REVENUE OPTIONS TO CLOSE THE FISCAL GAP IN ALBERTA: PICK YOUR POISON - DARIA CRISAN AND KENNETH J. MCKENZIE
←
→
Page content transcription
If your browser does not render page correctly, please read the page content below
PUBLICATIONS
SPP Pre-Publication Series

June 2021

REVENUE OPTIONS
TO CLOSE THE FISCAL
GAP IN ALBERTA: PICK
YOUR POISON

Daria Crisan and Kenneth J. McKenzie

AF-23                                  w w w. policyschool.ca
ALBERTA FUTURES PROJECT
    PRE-PUBLICATION SERIES

    Alberta has a long history of facing serious challenges to its economy, including shocks
    in the form of resource price instability, market access constraints, and federal energy
    policies. However, the recent and current challenges seem more threatening. It seems
    that this time is truly different.

    The collapse of oil and gas prices in 2014 combined with the rapid growth of U.S. oil
    production, difficulties in obtaining approval for infrastructure to reach new markets
    and uncertainty regarding the impacts of climate change policies world-wide have
    proven to be strong headwinds for the province’s key energy sector. Together, the
    negative effects on employment, incomes and provincial government revenues have
    been substantial. To make matters worse, in early 2020 the COVID-19 pandemic struck
    a major blow to the lives and health of segments of the population and to livelihoods
    in many sectors. The result has been further employment and income losses, more
    reductions in government revenues and huge increases in government expenditures
    and debt. These events, combined with lagging productivity, rapid technological
    shifts, significant climate policy impacts and demographic trends, call for great
    wisdom, innovation, collective action and leadership to put the province on the path of
    sustainable prosperity.

    It is in this context that we commissioned a series of papers from a wide range
    of authors to discuss Alberta’s economic future, its fiscal future and the future of
    health care. The plan is that these papers will ultimately be chapters in three e-books
    published by the School of Public Policy. However, in the interest of timeliness and
    encouraging discussion, we are releasing selected chapters as pre-publications.

1
INTRODUCTION
In this paper we examine government revenue options for Alberta in light of the “twin
crises” precipitated by the COVID-19 pandemic and changes in the market for fossil
fuels. The pandemic has dealt a historic blow to economies worldwide. Alberta is no
exception. However, as we emerge from the pandemic, and converge to an uncertain
“new normal”, Alberta faces additional challenges. The energy sector, which has
been the backbone of Alberta’s economy for decades, was under pressure prior to
the pandemic. While the sector will no doubt be subject to the “fits and starts” going
forward that Albertans are well used to, this underlying pressure is unlikely to ease
as Canada implements policies to meet its environmental obligations under the Paris
Agreement by 2030 and the more ambitious “net zero” objective by 2050. Related
to this is the decline in the growth of the demand for fossil fuels that will inevitably
accompany similar obligations on an international level. And all of this is layered on
top of uncertain technological developments in fossil fuels, carbon abatement and
renewables going forward.
It thus seems clear that the Alberta of the future will differ from the Alberta of the
past. While the precise pathway and speed of these changes are uncertain, they are
inevitable in the broad strokes. And there is little doubt that they have important
implications for Alberta’s economy and for its underlying fiscal framework. In this paper
we focus primarily on the revenue side of the fiscal equation. However, it is important
to consider Alberta’s revenue system within the broader fiscal context.
We anchor our discussion to the notion of fiscal sustainability. As explained by
Trevor Tombe in his contribution to this volume,1 the fiscal gap is a measure of fiscal
sustainability based on the path of the debt/GDP ratio. A fiscal configuration that
results in a rising debt/GDP ratio over time is said to be fiscally unsustainable. The
fiscal gap measures the difference between revenues and program expenditures as a
percentage of GDP required to maintain a stable debt/GDP ratio over a given period.
The fiscal gap is therefore a forward-looking concept, reflecting projected future
program expenditures and revenues under the current configuration as determined by
underlying assumptions regarding population growth, demographics (aging), labour
productivity, interest rates, inflation, etc. It is important to emphasize that the fiscal
gap is a dynamic concept, and therefore differs from the deficit which is measured at a
point in time.
Over a 10-year period Tombe calculates Alberta’s fiscal gap to be about 4.2 percentage
points of GDP, which is the second highest in the country. 2 Using the nominal GDP
forecast in the 2021 budget this is equivalent to about $15.1 billion in 2022. This means
1
Tombe (2021), which is an extension of Tombe (2020).
2
Behind Newfoundland and Labrador. Tombe’s calculations of the fiscal gap measured over longer time
periods are similar: 4.0% for 25 years, 4.3% for 50 and 75 years, 4.1% for 100 years. It should be noted that
the Parliamentary Budget Officer (PBO) calculates Alberta’s fiscal gap to be significantly lower, at 2.1 per
cent (https://www.pbo-dpb.gc.ca/web/default/files/Documents/Reports/RP-2021-033-S/RP-2021-033-S_
en.pdf). As explained by Tombe (2020), the difference is because he considers various revenue streams
individually on a disaggregated basis, while the PBO aggregates own-source revenue and assumes that it
simply grows with GDP. Tombe also includes capital expenditures, while the PBO does not. For these reasons
we think that the Tombe number is a more accurate depiction of Alberta’s fiscal situation.
2that Alberta’s finances are not sustainable under the current configuration of taxes
and expenditures, and the debt/GDP ratio is projected to rise over this period. Any
combination of an increase in revenues or decrease in program expenditures, as a
percentage of GDP, that add to 4.2 percentage points is required to close the fiscal gap
and put the province on a fiscally sustainable track by this definition.
The debate surrounding the sustainability of the province’s finances is sometimes framed
in terms of whether Alberta has a “revenue problem” or a “spending problem”. This is
a false dichotomy. Alberta has a “sustainability problem”, one which can be addressed
by working on either side of the budget, or both. While choosing how to address this
problem may involve difficult economic and political decisions, with the inevitable trade-
offs, the underlying math is simple and inescapable. And choose we must.
We therefore discipline our analysis by considering policy configurations that will,
by our calculations, roughly eliminate the fiscal gap over a ten-year period. This is
the dynamic equivalent to a revenue neutral or balanced budget analysis of changes
to public finances. By constraining our analysis in this way, three idioms inform our
discussion throughout: “there is no such thing as a free lunch”, the province must
“follow the money” and “pick its poison”.
Having said this, we do not take a strong stand on whether completely closing the fiscal
gap is indeed optimal from a welfare perspective. In a low interest rate environment
this is in fact an open question. 3 Rather, the approach taken here is to discipline the
analysis so as to compare “apples to apples” in various scenarios that close the fiscal
gap. To the extent that policies aimed at reducing, but not closing, the fiscal gap are
adopted the numbers presented below can be scaled accordingly.
We argue that while Alberta’s current fiscal configuration is not sustainable, and is in
need of an overhaul, it is not as bad as may be thought. The reason for this is that the
province has access to policy levers on both sides of the ledger, and in particular to
some untapped revenue sources, that can be used to move the province’s finances to
fiscal sustainability. We present some alternatives below that, while recognizing that
some difficult choices need to be made, retain at least some aspects of the “Alberta
Advantage” in fiscal policy that the province has enjoyed in the past. And, yes, to
address the elephant in the room at the outset, in our view this should include a
provincial sales tax harmonized with the GST.
But to see where we need to go, we need to know where we have been and where we
are at.
WHERE WE HAVE BEEN
Figures 1 through 5 provide a glimpse of Alberta’s fiscal situation over four and half
decades. Looking first at provincial program expenditures4, Figure 1 shows real per
capita program spending in Alberta compared to the rest of Canada (ROC), excluding
3
See, for example, Blanchard (2019).
4
Program expenditures exclude interest payments on government debt.
3Alberta. 5 It is evident that throughout much of the period per capita expenditures in
Alberta have been higher than the rest of the country. The exception is the period
between 1994 and 2000, when real per capita expenditures were reduced significantly
under the “Klein Revolution”. In 2020, per capita expenditures in Alberta were almost
14 per cent higher than the rest of Canada. It is fair to say that this difference in per
capita spending between Alberta and the rest of Canada is the source of the claim
that Alberta has a “spending problem.” For example, many of the recommendations
contained in the 2019 report of Blue Ribbon Panel on Alberta’s Finances (the
“MacKinnon Report”) are justified on the basis of per capita spending in Alberta being
out of line with other provinces on several dimensions.6
Figure 1: Real Per Capita Program Expenditures, Alberta and the Rest of Canada
14,000.0
12,000.0
10,000.0
8,000.0
6,000.0
4,000.0
2,000.0
0.0
73
75
77
79
81
83
85
87
89
91
93
95
97
99
01
03
05
07
09
11
13
15
17
19
19
19
19
19
19
19
19
19
19
19
19
19
19
19
20
20
20
20
20
20
20
20
20
20
Alberta Rest of Canada
Source: Finances of the Nation Government Finances Database at https://financesofthenation.ca/. Rest of
Canada does not include Alberta.
Notes: 2012 dollars.
Expressing program spending relative to GDP in Figure 2 tells a different story. Here we
see that spending as a percentage of GDP has typically been lower in Alberta than the
rest of Canada, most particularly from the mid-90’s on. This is due in large part to the
large role that the oil and gas sector plays in the Alberta economy relative to the rest of
5
Rather than using the “Rest of Canada” as a comparator the large provinces of Ontario, B.C. and Quebec are
sometimes employed (e.g., in the MacKinnon Report). This does not make a substantial difference as the per
capita figures for the “Rest of Canada” are dominated by the three largest provinces.
6
Blue Ribbon Panel (2019).
4the country, which increases per capita GDP in Alberta significantly. As the anticipated
decline in the relative importance of the oil and gas sector in the province’s economy
takes hold over the next several decades, this is expected to moderate.
Figure 2: Program Expenditures as a Per Cent of GDP, Alberta and the Rest of Canada
30.00%
25.00%
20.00%
15.00%
10.00%
5.00%
0.00%
73
75
77
79
81
83
85
87
89
91
93
95
97
99
01
03
05
07
09
11
13
15
17
19
19
19
19
19
19
19
19
19
19
19
19
19
19
19
20
20
20
20
20
20
20
20
20
20
Alberta Rest of Canada
Source: Finances of the Nation Government Finances Database at https://financesofthenation.ca/. Rest of
Canada does not include Alberta.
Turning to revenue, Figure 3 shows real per capita revenue in Alberta versus the rest
of Canada. For Alberta we show total revenue, non-resource revenue, and resource
revenue separately. Several things are evident from the figure. In terms of total revenue,
Alberta’s real per capita revenue has exceeded the average of the rest of the country
throughout the period. This, of course, is because of resource revenue. Note, however,
that in 2020 Alberta was very close to the rest of the country. Per capita non-resource
revenue in Alberta has been closer to the rest of Canada but has tended on the whole
to be slightly lower. Also evident from the figure is the high degree of volatility in total
and resource revenue in Alberta, and the precipitous decline starting in 2006.
5Figure 3: Real Per Capita Revenue, Alberta and the Rest of Canada
16,000.0
14,000.0
12,000.0
10,000.0
8,000.0
6,000.0
4,000.0
2,000.0
0.0
73
75
77
79
81
83
85
87
89
91
93
95
97
99
01
03
05
07
09
11
13
15
17
19
19
19
19
19
19
19
19
19
19
19
19
19
19
19
20
20
20
20
20
20
20
20
20
20
Total Revenue Alberta Non-Resource Revenue Alberta
Resource Revenue Alberta Total Revenue Rest of Canada
Source: Finances of the Nation Government Finances Database at https://financesofthenation.ca/. Rest of
Canada does not include Alberta.
Notes: 2012 dollars.
Again, expressing revenue as a share of GDP in Figure 4 tells a different story. Here we
see that since 1990 Alberta’s total revenue as a percentage of GDP has been lower than
the rest of Canada, and has fallen significantly in the 2000’s. This is due in large part to
drop in resource revenue, as non-resource revenue has remained relatively stable as a
share of GDP.
6Figure 4: Revenue as a Per Cent of GDP, Alberta and the Rest of Canada
30.00%
25.00%
20.00%
15.00%
10.00%
5.00%
0.00%
73
75
77
79
81
83
85
87
89
91
93
95
97
99
01
03
05
07
09
11
13
15
17
19
19
19
19
19
19
19
19
19
19
19
19
19
19
19
20
20
20
20
20
20
20
20
20
20
Total Revenue Alberta Non-Resource Revenue Alberta
Resource Revenue Alberta Total Revenue Rest of Canada
Source: Finances of the Nation Government Finances Database at https://financesofthenation.ca/. Rest of
Canada does not include Alberta.
Finally, Figure 5 shows program expenditures together with total and non-resource
revenue in Alberta in real per capita terms. This, in a nutshell, illustrates the essence of
the so-called “Alberta Advantage”. For much of the last 45 years government spending
in the province has somewhat closely tracked total revenue on a per capita basis, but
been significantly higher than non-resource revenue, the exception being the Klein
years from 1995-2000. As such, Albertans have been able to enjoy relatively high per
capita program spending without having to pay for it through higher (non-resource)
taxes. The reason, of course, is resource revenue. This has resulted in a sort of “fiscal
illusion”, whereby Albertans don’t “see” the full cost of government goods and services
reflected in their taxes, with resource revenue paying some of the freight.
7Figure 5: Real Per Capita Program Expenditures and Revenue, Alberta
16,000.0
14,000.0
12,000.0
10,000.0
8,000.0
6,000.0
4,000.0
2,000.0
0.0
73
83
93
03
13
75
77
79
81
85
87
89
91
95
97
99
01
05
07
09
11
15
17
19
19
19
19
19
19
19
19
19
19
19
19
19
19
19
20
20
20
20
20
20
20
20
20
20
Program Expenditures Non-Resource Revenue Total Revenue
Source: Finances of the Nation Government Finances Database at https://financesofthenation.ca/. Rest of
Canada does not include Alberta.
Notes: 2012 dollars.
This is changing. In response to the release of the MacKinnon Report Alberta Finance
Minister Travis Towes opined, “We can no longer spend like we’re the rich kids on the
block because, quite frankly, we’re not anymore.”7 The flip side is that we can no longer
tax like we’re the rich kid on the block. The money generated from our “trust fund” (our
endowment of natural resources) is being squeezed. It is time for the rich kids to cut
the apron strings and face the “real world”.
WHERE WE ARE AT
Before turning to a discussion of revenue options going forward, we briefly discuss the
current financial status of the province.
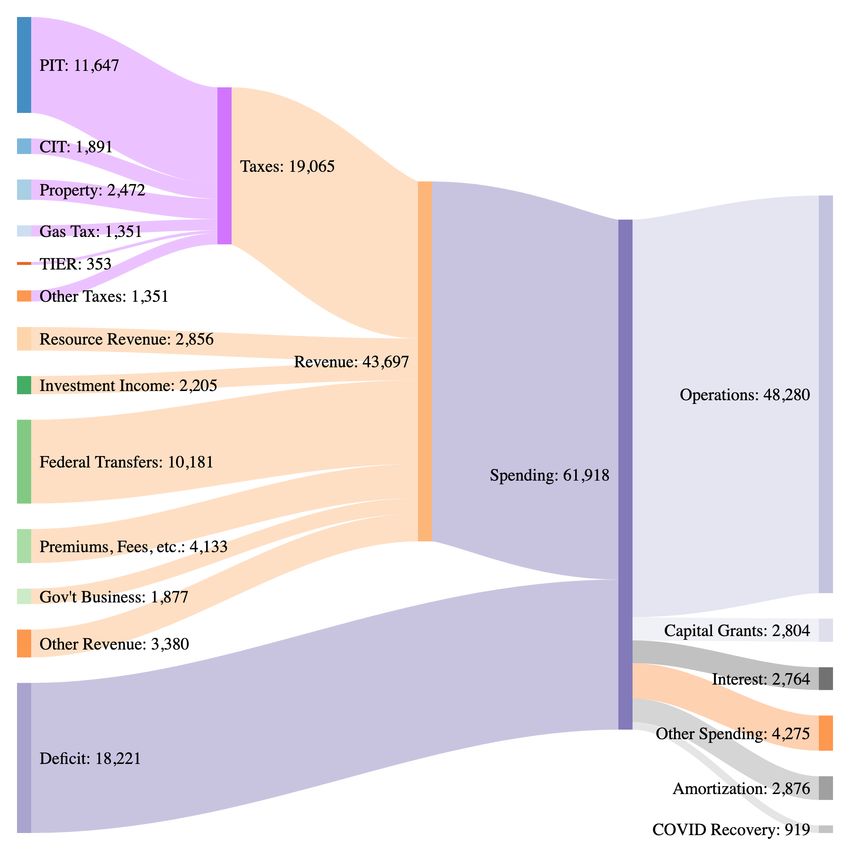
Figure 6 presents the estimated financial flows for 2021/22 from the most recent
Alberta budget. Total spending, including capital spending, is estimated to be about
$61.9 billion, financed by total revenue of $43.7 billion and a deficit of $18.2 billion.
7
https://www.thestar.com/business/2019/09/04/no-longer-the-rich-kids-on-the-block-alberta-finance-
minister-sells-restraint.html
8Figure 6: Government of Alberta Estimated Financial Flows 2021/22
Source: Government of Alberta Budget 2021, Fiscal Plan: Protecting Lives and Livelihoods. Created with
Sankeymatic.com.
On the revenue side, which is the focus of our analysis, we see that taxes in aggregate
are estimated to generate a little over $19.0 billion, or 43.6 per cent of total revenue.
Looking at tax revenue, personal income taxes are by far the single biggest source of
revenue, accounting for 26.6 per cent of total revenue, followed by property taxes (5.7
per cent) and corporate income taxes (4.3 per cent). Resource revenue of $2.9 billion
accounts for about 6.5 per cent of total revenue. There are a plethora of fees, licenses,
premiums and other tax and revenue sources that in aggregate account for about
20.2 per cent of total revenue. Also identified is $353 million in revenue from the TIER
(Technology Innovation and Emissions Reduction) regulations, which is the provincial
carbon tax imposed on large industrial emitters. More on this below. Notably absent
from the diagram, of course, is revenue from a provincial sales tax as Alberta is the only
province in the country that does not impose such a tax. More on this below.
9On the expenditure side government operations (program spending on health,
education, advanced education, social services, etc.) account for the bulk (78.0 per
cent) of total spending, with capital spending, interest, other spending, etc. taking up
the rest. The government estimates $919 million in spending for COVID-19 recovery in
2021/22.
WHERE WE NEED TO GO
From the perspective of the sustainability of its public finances, the current fiscal
configuration in Alberta is untenable; the province has a sizable fiscal gap that needs to
be addressed going forward, one way or another. We think a balanced approach is best.
In this regard, recall from above that in per capita terms program spending is about
14 per cent higher than the rest of Canada (see Figure 1). Using Tombe’s estimate of
Alberta’s fiscal gap of 4.2 percentage points of GDP, our calculations suggest that
reducing per capita program spending in Alberta to the average of the rest of Canada
would lower the fiscal gap by about 2.1 percentage points, or 50 per cent. Thus, if the
province spends like the rest of Canada going forward, rather than the rich kids on
the block, it can eliminate half of the fiscal gap, leaving the rest to be taken care of by
higher revenues. We therefore take this as a reasonable starting point, and “anchor” our
subsequent calculations accordingly. Indeed, in the April 2021 budget the government
announced that bringing Alberta’s spending in line with the other provinces as an
explicit policy objective, and one of the intermediate term “fiscal anchors” guiding
government finances going forward. 8 The numbers presented below can be scaled
appropriately if more or less is done on the expenditure side.
In considering alternative revenue sources to close the rest of the fiscal gap two broad
concepts guide our discussion: efficiency and equity. Efficiency in “econ-speak” refers
to the distortionary impact of a tax. All taxes are distortionary because they alter prices
which in turn results in changes in economic behaviour. The greater are the behavioural
effects the more distortionary and less efficient is the tax, and the greater are the costs
imposed on the economy.9 Equity concerns the distribution of the burden of a tax,
typically across different income groups. As a general rule, when evaluating alternative
revenue sources there is an equity-efficiency trade-off; in order to get more of one you
have to give up some of the other.
We now turn to an evaluation of some alternative revenue sources to assist in closing
the fiscal gap. The revenue increases from various options we consider are shown in
Table 1 as a percentage of GDP and as a percentage of the fiscal gap. This table is
referred to throughout. We begin with the elephant in the room: an Alberta Sales Tax.
8
See Dahlby’s (2021) contribution to this volume for more discussion on fiscal anchors.
9
See McKenzie (2019) for further discussion in this context.
10Table 1: Options for Closing the 4.2 Percentage Point Fiscal Gap by 2030
Expenditure Carbon Tax PIT Increase PIT Increase
Carbon Tax
Restraint to 6% PST Targeted 2 pp Lower 4 pp Top Two
Average Rebate
Equal ROC Rebated Three Brackets Brackets
Per cent of GDP 2.10 1.11 0.59 1.11 1.03 0.13
Per cent of Fiscal Gap 50.0 26.5 14.0 26.5 24.6 3.2
Source: Author calculations. Some of the calculations used Statistics Canada Social Policy Simulation
Database and Model (SPSD/M). The assumptions and calculations underlying the simulations were prepared
by the authors and the responsibility for the use and interpretation of these data lies entirely with them.
Notes: It is assumed that PST and PIT revenues grow proportionately with GDP. Carbon tax revenues are
based on federal government projections. The PST scenario includes provincial credits commensurate
with the federal GST credit. All calculations present the total impact on revenue, which is equal to the
mechanical effect of the tax change less the behavioural effect which accounts for the associated
shrinkage in the tax base.
THE ELEPHANT IN THE ROOM: AN ALBERTA SALES TAX
We are certainly not the first to address the issue of a provincial sales tax (PST)
in Alberta.10 The introduction of a sales tax harmonized with the federal GST (a
harmonized sales tax, or HST) has been recommended by economists for years, for
different purposes. Several School of Public Policy papers have analyzed sales taxes
in an Alberta context. For example, Bazel and Mintz (2013) argue that a PST of eight
per cent (a 13 per cent HST) would enhance Alberta’s competitiveness by providing
enough revenues to eliminate the personal income tax for the majority of Albertans
and to reduce the corporate income tax by more than 15 per cent. McKenzie (2019)
similarly argues that a sales tax in Alberta would be an efficient, stable and non-volatile
revenue source that would help get the province off of the royalty roller-coaster. Finally,
and more in keeping with the theme of this paper, Tombe (2018) discusses the role of a
sales tax in addressing Alberta’s fiscal gap.
The lack of a PST appears to be a matter of provincial pride, and an important part
of the often touted “Alberta Advantage”. However, the absence of a sales tax in the
province’s fiscal tool-kit is an outlier, both nationally and internationally. Of course all
of the other provinces have some form of a sales tax.11 The United States is the only
Organization for Economic Co-operation and Development (OECD) member country
without a national value-added tax,12 however 45 U.S. states levy sales taxes, and
local sales taxes are imposed in 38 U.S. states.13 In 2018, VAT/GST-type taxes were
responsible for an average of 20.4 per cent of total tax revenues (equivalent to 6.8 per
cent of GDP) in OECD countries (OECD 2020 Annex 1.A.4). In Canada this figure was
only 13.6 per cent (4.4 per cent of GDP), where the low 5 per cent national GST rate is
supplemented by provincial sales taxes in all provinces except Alberta.
10
Throughout we use PST to refer to the provincial part of a harmonized sales tax (HST). The total HST rate is
the sum of the PST and the federal GST.
11
None of the three territories levy a sales tax.
12
OECD (2020) Annex 1.A.4
13
https://taxfoundation.org/publications/state-and-local-sales-tax-rates/
11The introduction of a PST is clearly challenging from a political perspective.
Consumption taxes are visible and, as a result, unpopular. In October 1990, less than
two months before the introduction of the federal GST, a Maclean’s article called it “an
obsession” and “the most unpopular levy since the days of the Boston Tea Party”,14 with
a slim chance of success. However, a little more than a decade later, the GST is viewed
as perhaps the most important legacy of Brian Mulroney’s tenure of Prime Minister,
more important than the signing of the Free Trade Agreement with U.S. and Mexico.15
Leaving aside how difficult it might be to “sell” a PST in Alberta, from an economic
point of view it is commonly viewed as one of the least costly ways of generating
revenue.16 As a general rule, people do not like paying taxes and try to avoid them
by avoiding the goods or activities being taxed. Income taxes discourage earning (or
reporting) income, corporate taxes discourage investment, sales taxes discourage
consumption. Economists refer to these as behavioral changes. Relative to other taxes,
both theory and evidence suggest that the behavioural changes in response to sales
taxes are quite small; in economic jargon, the elasticity of the tax base with respect
to the tax rate is relatively low. Due to these relatively small behavioral effects, sales
taxes are largely viewed as one of the least distortionary and therefore most efficient
ways of raising revenue, more so than personal income taxes, and certainly corporate
income taxes.17 From a growth perspective there is some evidence suggesting that
changing the tax mix to favour consumption taxation is associated with higher growth
in GDP per capita.18
Another advantage of sales taxes is that they raise revenue from everyone who spends
their income in a jurisdiction: residents, tourists, visitors, temporary workers. Bazel and
Mintz (2013) estimate that approximately 10 per cent of the tax revenues expected to
be collected from an eight per cent Alberta PST would come from non-residents.
One of the common arguments against sales taxes is that they are regressive, imposing
a greater burden on low-income families than high income families This is debatable.
A progressive tax system imposes a higher tax rate on those with a higher “standard
of living.” The question then becomes how do we measure the “standard of living?”
Many economists argue that consumption is in fact a better measure of standard of
living than current income. Consumption out of inherited wealth, or offshore income
not reported to tax authorities, etc., is subject to sales taxes, but not income taxes.
Moreover, increased reliance on sales taxation can shift some of the burden of taxes
to older generations who have benefited from previous periods of buoyant economic
growth, and who will benefit from publicly funded health care as the population ages
going forward. Finally, and importantly, even if sales taxes are regressive, this can be
14
Newman (1990)
15
Policy Options (2003).
16
See Dahlby and Ferede (2016).
17
See McKenzie (2019) for a discussion.
18
For example, see Arnold et al (2011).
12taken care of by way of a refundable tax credit similar to the federal GST credit aimed
at low-income earners.
We consider a PST rate of six per cent harmonized with the federal GST, giving an HST
of 11 per cent in Alberta. This would be the lowest HST rate amongst the Canadian
provinces (tied with Saskatchewan) and would put Alberta slightly above all U.S states19
but it would still be the sixth lowest rate among the 38 OECD countries. 20
The total effect on revenue of introducing a PST in Alberta consists of the mechanical
effect, which ignores any shrinkage in the tax base, less the behavioural effect,
which accounts for the shrinkage in the base as consumers respond to the tax by
reducing expenditures. While the behavioural effect of sales taxes is small, it is not
zero. Thus, unlike most previous studies, we incorporate behavioural responses into
our calculations. There are not many studies of the sensitivity of the sales tax base in
Canada to changes in the PST rate. One recent examination by Smart (2021) considers
the impact of the reduction in the PST rate in Saskatchewan in 2006 from seven to
five per cent. He estimates this led to a 5.4 per cent increase in retail sales. We use this
result to model the behavioural effect of the introduction of a PST in Alberta. 21
By our calculations the mechanical effect of a PST of six per cent, coupled with a
provincial low-income credit equivalent to the federal GST credit, would generate
about $4.86 billion in revenue in 2022, which is about 1.35 per cent of GDP. Thus,
ignoring behavioural effects, a six per cent PST would lower the fiscal gap by 32.1 per
cent. However, accounting for the shrinkage in the tax base due to behavioural effects
lowers the revenue generated by the tax by about $860 million, giving total revenue
of $4.0 billion, which is 1.11 per cent of GDP and would close about 26.5 per cent of the
fiscal gap.
Thus, by our calculations, incorporating behavioural effects and providing a credit to
low-income households, a six per cent PST in Alberta coupled with a reduction in per
capita expenditures to equal the rest of Canada, would close about 3.21 percentage
points, or about 76.5 per cent, of the fiscal gap (see Table 1). The question then
becomes, where can the province get the rest of the money?
19
California has the highest state-level sales tax rate, at 7.25 per cent. After including city, county and
municipal sales taxes the average sales tax in California is 8.68 per cent. Five U.S. states have combined
state-local sales tax rates of more than 9 per cent (Tennessee, Louisiana, Arkansas, Washington, Alabama).
See https://taxfoundation.org/publications/state-and-local-sales-tax-rates/.
20
After U.S. (no national sales tax), Switzerland (7.7 per cent), Japan, Australia and Korea (10 per cent). The
OECD average VAT rate is 19.3 per cent.
21
We assume that the Saskatchewan PST is applied to the same base as the federal GST, recognizing that this
is an approximation. The 2 percentage point reduction in the PST thus results in a 16.7 per cent reduction in
the combined provincial plus federal sales tax rate. Combined with Smart’s estimate of the increase in sales
of 5.4 per cent, this suggests and elasticity of the sales tax base of 0.32. We then use the standard formula
to decompose the total revenue effect of a change in the sales tax rate into a mechanical effect less the
behavioural effect.
13REPATRIATE THE CONSUMER CARBON TAX
The history of carbon taxes in Alberta has been, to say the least, a long and winding
road. By our count, the province is currently operating under its third carbon tax
regime in the last 14 years. In our view, and in light of the Supreme Court of Canada
establishing the constitutional authority of the federal government to impose a so-
called “backstop” carbon tax in provinces that do not comply with federal standards, it
is time to move to a fourth-generation regime. But first a bit of history. It is important
to distinguish between carbon taxes applied to large industrial facilities and to
consumers and other businesses separately.
Alberta was the first jurisdiction in Canada to impose a carbon tax, under the Specified
Gas Emitters Regulation (SEGR) introduced in 2007. The SEGR applied to large
industrial facilities emitting more the 100,000 tonnes of carbon dioxide equivalent per
year. In 2018 SEGR was replaced by the Carbon Competitiveness Incentive Regulation
(CCIR). Alberta has been a pioneer in the use of output-based pricing systems (OBPS)
in the application of carbon taxes to large industrial emitters. The OBPS is intended
to provide a price incentive for large industrial facilities to reduce emissions while
maintaining competitiveness for carbon-intensive trade-exposed industries, and
protect against “carbon leakage” to other jurisdictions. Under the OBPS intensity-
based emission targets, or benchmarks, are established. If a facility’s emissions exceed
the benchmark, it must purchase carbon credits at the price set by the carbon tax;
if emissions are lower than the benchmark, it may sell credits accordingly. Under the
CCIR, the OBPS emissions targets for individual facilities were, for the most part,
based on industry-wide intensity benchmarks, whereby each facility in a specific
industry shared a common emission intensity standard. The CCIR was replaced by
the Technology Innovation and Emissions Reduction (TIER) Regulation in 2020, which
modified the OBPS, moving away from the industry-wide benchmarks to facility
specific benchmarks based on historical performance. 22 The industrial carbon tax under
TIER applies to about 60 per cent of Alberta’s carbon emissions. 23 The TIER meets
the federally mandated carbon standards for large emitters established by the federal
government. As such, the backstop federal carbon tax on large emitters does not apply
to large facilities in Alberta and all of the revenue generated by TIER stays in Alberta.
As mentioned above, in 2021/22 the TIER is estimated to generate about $353 million
in revenue.
The so-called consumer carbon tax was introduced in Alberta in 2017. The tax was
applied economy wide to various fuels based on their carbon content. This tax was
eliminated in 2020, ostensibly to “create jobs and put more money back into the
pockets of hard-working Albertans”. 24 However, under the federal government’s
Greenhouse Gas Pollution Pricing Act (GGPA), the provincial carbon tax was replaced
with the federal backstop, the Federal Fuel Surcharge. Under the federal backstop,
22
Each facility’s allowable emissions threshold is based on the average past performance of that facility
between 2016-2018.
23
Smaller firms, emitting less than 100,000 tonnes, may choose to opt-in to the TIER.
24
Jason Kenney, as quoted in a government press release at https://www.alberta.ca/release.
cfm?xID=63919C897F608-B026-62E8-61626ECCC59B50FC.
14a federal tax is imposed in any province that does not levy the equivalent of the
federal carbon tax. Albertans therefore continue to pay a carbon tax at the consumer
level, however it is collected by the federal government rather than the provincial
government. The Federal Fuel Surcharge also applies to businesses and industrial
emitters that are not subject to the TIER. Under the GGPA 90 per cent of carbon tax
revenue collected in Alberta by the federal government are returned to Albertans as
lump sum “rebates”. 25
To sum up, since 2007 Albertans have been subject to three different carbon tax
regimes: 1) 2007-2017, SEGR levied on large industrial emitters, no consumer carbon
tax; 2) 2017/2018-2019, CCIR levied on large industrial emitters, provincial consumer
carbon tax levied on fuel; 3) TIER levied on large industrial emitters, federal consumer
carbon tax levied on fuel. In our view, it is time for a fourth-generation carbon tax
regime, one which repatriates the consumer carbon tax, and the associated revenue,
to Alberta.
We think that there are two compelling arguments to do this. First, the federal
government has been quite flexible in accepting provincial carbon tax and pricing
regimes as meeting the federal standard to avoid the imposition of the backstop; and
indeed, there is a relatively wide variation across the provinces. This means that Alberta
has some flexibility to implement a “made in Alberta” consumer level tax on its own.
Second, and more relevant to this discussion, the province would be able to keep the
revenue and do what it wants with it. Frankly, politics aside, in our view repatriating the
consumer carbon tax is the proverbial “no brainer”.
In 2021 the carbon tax rate is $40 per tonne of CO2 emissions. According to federal
government data, for 2021 carbon tax revenue in Alberta under the federal policy is
expected to be about $1.8 billion, increasing to over $2.2 billion when the tax increases
to $50 per tonne in 2022, and to over $2.8 billion when the tax increases to $60 in
2023. By 2030, when the carbon tax is slated to reach $170 per tonne, taking account
of estimated behavioural effects as emissions decline in response to the rising tax,
consumer carbon tax revenue from Alberta is anticipated to be about $6.3 billion. 26
If Alberta was to repatriate the carbon tax this revenue would accrue to the province
rather than the federal government. The question is then what should it do with the
money? There are, of course, a myriad of possibilities.
One of us has argued previously that carbon tax revenues should be used to lower
other distortionary taxes, such as the PIT and the CIT, rendering the tax revenue
neutral. 27 From the perspective of pure economic efficiency this is widely thought to
be the best approach, dominating the return of the revenue in the form of lump sum
25
The term “rebate” is a misnomer, as the revenues are in fact returned on a lump sum basis to all Albertans
independently of how much carbon tax they actually pay. However, we use the term “rebate” in what follows
as it reflects its common usage in Canada in this context. The remaining 10 per cent of revenue is allocated
to universities, schools, nonprofits, indigenous communities and medium-sized businesses to help offset the
impact of the carbon tax.
26
This is based on federal government forecasts of carbon tax rebates in Alberta discussed below, which
suggest about a 20 per cent reduction in emissions over this period due to the rising carbon tax rate. See
footnote 20.
27
See McKenzie (2019).
15transfers. 28 However, this implicitly presumes that the province is in a sustainable fiscal
balance. In light of the substantial fiscal challenge facing the province this may not be
a prudent use of the revenue under the circumstances. As such, in keeping with the
perspective of this paper we argue that some of the revenue from repatriating the
consumer carbon tax could be used to help close the fiscal gap, effectively forestalling
the need to raise more revenue for this purpose by increasing other more distortionary
taxes like the PIT or CIT. There is no such thing as a free lunch.
In 2021 the average household in Alberta is expected to pay $598 in carbon taxes
under the federal system; however, the average lump sum rebate per household is
forecast to be $953. 29 This is because higher income households pay more in carbon
taxes. By 2030 the average household is expected to pay about $1,740 in carbon taxes
and receive $2,764 in rebates. Thus, under the federal carbon tax regime the average
household receives a rebate about 1.6 higher than the amount of carbon tax they
actually pay.
Carbon taxes are generally viewed as being regressive, falling more on lower income
households than higher income households. This is based on the observation that
households at the bottom of the income distribution spend a larger share of their
income on carbon-intensive products like gasoline, electricity, and natural gas than
do higher income households. 30 This suggests that from an equity perspective some
sort of rebate to lower income households is desirable. However, it is apparent from
the above that the rebates under the federal system are overly generous for the bulk
of the population. One option under a repatriated consumer carbon tax would be for
the province to lower the rebates to coincide with average carbon taxes paid. Rather
than returning 90 per cent of carbon tax revenue to households in the form of rebates
this would return 60 per cent. Based on the 2021 figures, this would free up $355 per
household that could be used to address the province’s fiscal gap; by 2030 this would
increase to about $1,024 per household.
Recall from above that by our rough calculations reducing per capita expenditures in
Alberta to the average of the rest of Canada, coupled with a six per cent provincial
PST (with a low income credit), would eliminate about 3.21 percentage points, or 76.5
per cent, of the 4.2 percent fiscal gap. Repatriating the carbon tax and lowering the
lump sum rebates to reflect carbon taxes paid by the average household would close
an additional 0.59 percentage points (14.0 per cent) of the gap by 2030. These three
measures combined would thus close about 3.80 percentage points, or 90.5 per cent,
of the fiscal gap by 2030.
However, we think there is a better approach. B.C. targets the lump sum rebates from
their carbon tax to middle- and low-income families, with payments declining by 2
per cent over a family income threshold. For example, for a household with two adults
28
See McKenzie (2016, 2019).
29
https://www.canada.ca/en/department-finance/news/2020/12/climate-action-incentive-payment-amounts-
for-2021.html.
30
This view is not universally held. For example, Beck et al (2015) find that the carbon tax in British Columbia is
slightly progressive across the income distribution even before taking account of rebates or other measures.
16and two children, the family income threshold in 2021 is $42,165 and the rebates cease
at income of $64,665. Under this more targeted approach, B.C. allocates about 16
per cent of their carbon tax revenue to rebates. 31 If Alberta took a similar targeted
approach to rebates, it could eliminate about 1.11 percentage points, or 26.5 per cent,
of the fiscal gap with the carbon tax revenue (see Table 1). Coupled with a six per cent
HST and expenditure cuts that bring Alberta in line with the other provinces this would
close the entire fiscal gap by 2030.
Of course, many other combinations are possible. Our point is that Alberta can achieve
a fiscally sustainable path over the next decade with a combination of expenditure
restraint that would bring the province in line with the rest of the country, the
imposition of a six per cent provincial PST (with low-income credits) that would be the
lowest in the country, and repatriating the consumer carbon tax coupled with targeted
lump sum rebates similar to the approach followed in B.C.
It bears mentioning that carbon tax revenue is likely to fall after 2030 as emissions
decline and no further increases in the tax rate are anticipated. As such, the province
may need to adjust its fiscal configuration again at that time. But first things first.
There are, of course, other revenue levers available to the province. We discuss some of
these briefly below.
PICK YOUR POISON: INCREASES IN PERSONAL INCOME TAXES
As indicted at the outset, we constrain our analysis by tying it to the objective of
closing the 4.2 percentage point fiscal gap calculated by Tombe. As such, if the
province does not adopt a provincial PST or repatriate the consumer carbon tax as
discussed above, it must close the gap in some other way. In our framework, the
province must pick its poison. Here we briefly consider increases in personal income
taxes (PIT).
There are many ways of increasing PIT, but we focus here on just one, admittedly
somewhat arbitrary, approach to get a feel for the magnitudes involved. To fix ideas,
we consider a configuration of increases in PIT rates that would generate about the
same revenue as a six per cent provincial PST.
Specifically, we consider a two-percentage point increase in the bottom three
provincial tax brackets (currently 10, 12, and 13 per cent) and a four-percentage point
increase in the top two brackets (currently 14 and 15 per cent). The two-percentage
point increase is thus applied to all taxable income less than $209,952, and the four-
percentage point increase is applied to taxable income in excess of this, roughly to the
top 1 per cent of tax filers in Alberta. 32
31
In B.C. forecast carbon tax revenues for 2021/22 are $1.985 billion and the Climate Action Tax Credit is
projected to cost $312 million. See https://www.bcbudget.gov.bc.ca/2021/pdf/2021_Budget%20and%20
Fiscal%20Plan.pdf.
32
See Statistics Canada high income tax filers data base at https://www150.statcan.gc.ca/t1/tbl1/en/
tv.action?pid=1110005501&pickMembers%5B0%5D=1.12&pickMembers%5B1%5D=3.3&cubeTimeFrame.
startYear=2014&cubeTimeFrame.endYear=2018&referencePeriods=20140101%2C20180101
17As discussed above, one of the advantages of the PST as a revenue source is that
the underlying tax base is not very responsive to changes in the tax rate. Thus, the
behavioural effects are relatively small, and the tax is generally viewed as being one
of the most efficient ways of raising revenue. Personal income taxes are a little less
so. In particular, there is significant evidence that individuals at the top of the income
distribution, in particular the top 1 per cent, react to changes in the marginal tax rate
by reducing their taxable income, though there is some disagreement on the precise
magnitude of this behavioural effect. The primary mechanism is tax planning and
avoidance by way of income shifting. On the other hand, individuals at lower income
levels are relatively unresponsive to changes in tax rates. In our calculations we
therefore take account of behavioural effects associated with the increase in the tax
rates for the top two brackets only. 33
As shown in Table 1, the two-percentage point increase applied to the bottom three
brackets does the heavy lifting here, generating about $3.7 billion in revenue, or 1.03
per cent of GDP, in 2022. This is because it applies to a very broad base of all taxpayers
earning more than the basic personal amount of $19,369. It is interesting to note that the
four-percentage point increase in the top two brackets, after accounting for behavioural
effects, generates only about $480 million, or 0.13 per cent of GDP in 2022. 34 Thus, we
see that despite common perceptions, generating significant revenue by increasing tax
rates on the “1 per centers” is difficult, even in the absence of behavioural effects — there
is simply not enough money there on an aggregate basis. 35 In this regard, it is important
to emphasize the obvious point that taxpayers in the top two brackets pay higher taxes
due to the increase in the tax rates in the first three brackets.
Together, our calculations thus suggest that the PIT increases described above would
generate slightly more revenue than a six per cent PST, about $4.2 billion in 2022,
or 1.17 per cent of GDP. Thus, if the choice is made to eschew the introduction of a
provincial PST, a significant across the board increase in PIT rates would be required to
close the fiscal gap.
Of course, there are other revenue generation options open to the government. We do
not explore these here other than to say that none of them has the potential to increase
revenues to the same extent as broad-based taxes like the PST or PIT. In tax policy the
simple rule is “follow the money.” Further, as a rule narrowly based tax increases tend
to give rise to larger behavioural effects, and are therefore less economically efficient
than broad based taxes. 36
33
We assume an elasticity of taxable income for the top 1% with respect to the net-of-tax rate of 0.60, which is
roughly consistent with Milligan and Smart (2015).
34
Ignoring behavioural effects, the increase in the top two brackets would generate about $626 million.
35
See, for example, Smart (2019).
36
Some have raised the possibility of introducing a “health care levy” based on income. This, for example, was
floated in the 2015 budget, but never implemented due to a subsequent change in government. From an
economic perspective a health care levy is just an income tax by another name.
18TIME TO GET RADICAL ON THE CIT?
Under the Job Creation Tax Cut introduced in 2019 the statutory corporate income
tax (CIT) rate in Alberta was slated to decline from 12 per cent in 2018 to 8 per cent by
2022. However, as a part of the Alberta Recovery Plan in response to the pandemic, the
government accelerated the tax cut to 8 percent effective July 1, 2020. At 23 percent,
the general combined (15 per cent federal plus 8 per cent provincial) CIT rate in Alberta
is one of the lowest in North America. 37 If the U.S. proceeds with an increase in the
federal CIT rate to 28 percent, as proposed by the Biden administration, Alberta’s CIT
tax rate advantage would increase even more.
The corporate income tax (CIT) is widely viewed to be one of the more distortionary and
economically costly taxes because of relatively large behavioural effects. 38 For example,
capital investment is thought to be relatively sensitive to corporate taxes. 39 There are
also income shifting and tax avoidance considerations which arise due to differences in
statutory tax rates, both internationally and interprovincially.40 Thus, corporate income
tax increases receive a low grade from an economic efficiency perspective.
What about equity? The key issue here involves who bears the ultimate burden of the
CIT, and in particular whether it falls mostly on owners of capital in the form of lower
returns, and is therefore more progressive, or on labour in the form of lower wages,
in which case it is less progressive. This is an unsettled issue amongst economists.
However, there is good reason to believe that in a small open economy with mobile
capital, which is a reasonable depiction of Canada generally and certainly for Alberta
specifically, much of the burden of the CIT falls on labour through lower wages.41
This is due to the sensitivity of investment to increases in the CIT, which lowers the
productivity of labour, which in turn dampens the demand for workers.
For these reasons closing the fiscal gap by way of increasing the CIT rate would not
in our view be the best approach, and Alberta would be wise to maintain its current
advantage on this dimension. There may nonetheless be scope for corporate tax
reform in Alberta, not from the perspective of generating more revenue, but rather with
a view to implementing a more efficient corporate tax system, one which encourages
investment and job creation.
First some context. All of the provinces and territories except Alberta and Quebec are
part of the corporate Tax Collection Agreements (TCA).42 The provinces subject to the
TCA agree to adopt the federal tax base (taxable income) but may levy their own tax
37
The federal rate in the U.S. is currently 21 percent. Nevada, Ohio and Texas do not levy a state CIT, but do
impose a gross receipts tax instead. South Dakota and Wyoming are the only states that levy neither a CIT
nor a gross receipts tax. The CIT rate in Mexico is 30 percent. With provincial rates of 11.5 percent, B.C. and
Ontario have the next lowest combined rate in Canada at 26.5 percent.
38
See Dahlby and Ferede (2016).
39
See Wen and Yilmaz (2020).
40
See McKenzie and Smart (2019) for a discussion.
41
See McKenzie and Ferede (2017).
42
Alberta is part of the Tax Collection Agreements for the personal income tax.
19rate on that base.43 For corporations with entities in several provinces, taxable income
is allocated according to a formula based on wages and sales in each province. Alberta
and Quebec are not part of the TCA for corporate tax purposes and levy their own
CIT separately from the federal government. However, both provinces have tended
to closely follow the federal CIT base. For example, when the federal government
introduced accelerated tax depreciation in 2017 in reaction to the federal tax cuts in the
U.S., Alberta automatically followed suit.
This needs not be the case. Alberta can adopt a different tax base than the federal
government. The question is, should it?
In this regard, there is an alternative approach to taxing corporations that would, in
principle, increase investment, jobs, and wages: a so-called rent-based tax. Economic
rent is income earned in excess of the “normal” return on capital required to just
satisfy the shareholders/owners of a business. The idea is to remove taxes levied on
the “normal” return to capital and impose taxes only on the “above normal” return,
or economic rent. A pure rent-based tax is thus largely non-distortionary and, at the
margin, does not affect investment.44
There are many ways of taxing economic rents, the simplest being a cash-flow tax. We
will not go into a discussion of these alternative approaches here. One of us has argued
elsewhere for the implementation of a rent-based tax at the federal level in Canada.45
The question here is, can Alberta go it alone, abandon the federal corporate income tax
base and replace it with a rent-based tax?
This is a complicated question, which would require careful consideration along several
dimensions. We do not propose to resolve these issues here. However, as Alberta is
not a part of the TCA the possibility certainly exists. Indeed, Alberta already imposes
a type of rent-based tax (in addition to the CIT) under the province’s “royalty” system
applied to oil sands operations. This involves levying a cash-flow tax on oil sands
facilities that have achieved “pay-out”, and generated sufficient income to cover capital
expenditures plus a “normal” rate of return. Is it time to take a conceptually similar
approach to the entire provincial corporate tax system?
Moreover, one of the advantages of Canada’s decentralized federal system is that
individual provinces can experiment with different policies. We have seen this in
Canada several times, for example historically with the introduction of medicare first
in Saskatchewan before it was adopted country wide, and more recently with the
proposal to introduce a national childcare program based on the experience of Quebec.
Further on this, some have mused that it may be time for Alberta to “go it alone” on
several dimensions of policy as it seeks a “fair deal” from the rest of the country.46 Is
it time for Alberta to “go it alone” and act as a “laboratory” for a fundamental change
43
Provinces can, and do, grant various tax credits which lower provincial corporate taxes payable directly.
44
Rent-based taxes could have inframarginal effects and affect firm location decisions. For a discussion see
McKenzie and Smart (2019).
45
McKenzie and Smart (2019).
46
https://www.alberta.ca/fair-deal-panel.aspx. See also Mintz et al (2020).
20in the taxation of corporate income in Canada? These are complicated questions for
another day. We raise them here as being worthy of further study and consideration
going forward.
CONCLUSION
The purpose of this paper is to examine some revenue options that will help put the
province of Alberta on a sustainable fiscal track. The analysis is anchored, disciplined if
you will, by the need to eliminate the province’s fiscal gap of 4.2 percentage points of
GDP by 2030, as calculated by Tombe (2021) in his contribution to this volume.
Our operating assumption throughout is that Alberta can close half of the fiscal gap
by way of expenditure restraint that brings the province roughly in line with the rest of
the country in per capita terms. This leaves the remainder of the gap to be closed by
new revenue.
The analysis is by no means exhaustive. Rather we focus on a few selected alternatives
in order to provide a feel for the magnitudes involved. In particular, we argue that if
relatively modest expenditure restraint is coupled with a six per cent provincial sales
tax (harmonized with the GST and with target low-income credits) and a repatriation
of the consumer carbon tax (with targeted low-income rebates) Alberta can achieve
fiscal sustainability. We think that this provides a reasonable path to sustainability for
the province, while maintaining some of the vaunted “Alberta Advantage” with similar
expenditures to the rest of Canada on a per capita basis, coupled with the lowest CIT
and sales tax rates in the country. However, other options are obviously available which
rely more or less on expenditure restraint, more or less on sales and carbon taxes,
and more or less on personal income taxes. Regardless of the approach taken, further
research on the efficiency and distributional implications is merited.
We emphasize that we take a long-run perspective in this paper. It is possible that
commodity prices will rise, and the province’s fiscal situation will improve, over the next
few years as we emerge from the COVID-19 pandemic. Or not. As stressed by Tombe
(2021) in his contribution to this volume, there are considerable uncertainties ahead
which have significant implications for the province’s fiscal sustainability.
Ignoring the fiscal realities facing the province won’t make them go away. Hoping for
a surge in resource revenues is not a plan. And if it occurs at all it would offer at best a
temporary respite from the province’s fiscal reality. Indeed, if such a surge occurs there
is merit in using some of the revenue to bolster saving or paying down the provincial
debt.47 But this is a discussion for another day.
One thing is clear – postponing the day of reckoning for too long will only make
matters worse. In keeping with the themes of the paper, “there is no such thing as a
free lunch”, the province must “follow the money” and “pick its poison”. The choices
may be difficult, but the math is simple; and choose we must.
47
Paying down debt or investing in a savings fund is essentially a portfolio composition decision.
21REFERENCES
Arnold, J., B. Brys, C. Heady, A. Johansson, C. Scwellnus and L. Varitia (2011), “Tax
Policy for Economic Recovery and Growth”, The Economic Journal.
Bazel, Philip, and Jack M. Mintz. 2013. “Enhancing the Alberta Tax Advantage with a
Harmonized Sales Tax.” The School of Public Policy Publications 6 (29). https://doi.
org/10.11575/sppp.v6i0.42441.
Beck, M., N. Rivers, R. Wigle, and H. Yonezawa (2015), “Carbon Tax Revenue Recyling:
Impacts on Households in British Columbia”, Resource and Energy Economics 41.
Blanchard, O. (2019), “Public Debt and Low Interest Rates”, American Economic Review
109:4.
Blue Ribbon Panel (2019), Report and Recommendations Blue Ribbon Panel on
Alberta’s Finances, Government of Alberta.
Dahlby, B. (2021), “A Fiscal Anchor for Alberta”, SPP Pre-Publication Series, The School
of Public Policy, University of Calgary.
Dahlby, B. and E. Ferede (2016), “The Costliest Tax of All: Raising Revenue Through
Corporate Tax Hikes Can be Counterproductive for the Provinces”, SPP Research
Paper 9:11, The School of Public Policy, University of Calgary.
Elsinger, J., J. Ernsthausen and P. Kiel, “The Secret IRS Files: Trove of Never-Before-
Seen Records Reveal How the Wealthiest Avoid Income Tax”, Propublic June 8,
2021 at https://www.propublica.org/article/the-secret-irs-files-trove-of-never-
before-seen-records-reveal-how-the-wealthiest-avoid-income-tax.
McKenzie, K.J. (2016), “Make the Carbon Tax Revenue Neutral”, SPP Briefing Paper 9:15,
The School of Public Policy, University of Calgary.
McKenzie, K.J. and E. Ferede (2017), “Who Pays the Corporate Tax? Insights from the
Literature and Evidence for Canadian Provinces”, SPP Research Paper 10:6. The
School of Public Policy, University of Calgary.
McKenzie, K.J., (2019), “Altering the Tax Mix in Alberta”, SPP Research Paper 12:25,
The School of Public Policy, University of Calgary.
McKenzie, K.J. and M. Smart (2019), “Tax Policy Next to the Elephant: Business Tax
Reform in the Wake of the U.S. Tax Cut and Jobs Act”, C.D. Howe Commentary
537, C.D. Howe Institute.
Milligan, K. and M. Smart (2015), “Taxation and Top Incomes in Canada”, Canadian
Journal of Economics 48:2.
Mintz, J., T. Morton and T. Flanagan (2020), Moment of Truth: How to Think About
Alberta’s Future, Sutherland House.
Newman, Peter C. 1990. “Why Mulroney Is Obsessed by the GST.” Maclean’s, October
8, 1990. https://archive.macleans.ca/article/1990/10/8/why-mulroney-is-obsessed-
by-the-gst.
22You can also read