Characterization of porous microaggregates and soil organic matter sequestered in allophanic paleosols on Holocene tephras using synchrotron...
←
→
Page content transcription
If your browser does not render page correctly, please read the page content below
Characterization of porous microaggregates and
soil organic matter sequestered in allophanic
paleosols on Holocene tephras using synchrotron-
based X-ray microscopy and spectroscopy
Doreen Yu-Tuan Huang ( doreen.huang@umu.se )
Umeå University
David J. Lowe
University of Waikato
G. Jock Churchman
University of Adelaide
Louis A. Schipper
University of Waikato
Alan Cooper
South Australian Museum
Tsan-Yao Chen
National Tsing Hua University
Nicolas J. Rawlence
University of Otago
Research Article
Keywords: Allophane, tephra, microaggregates, nano-pore network, SOM, carbon functional groups,
synchrotron radiation, C NEXAFS, 3D tomography, tephrochronology, upbuilding pedogenesis, Andisols,
multi-layered soils, paleopedology, Holocene, New Zealand
DOI: https://doi.org/10.21203/rs.3.rs-513069/v1
License: This work is licensed under a Creative Commons Attribution 4.0 International License.
Read Full License
Page 1/26
Abstract
Allophanic tephra-derived soils can sequester sizable quantities of soil organic matter (SOM). However,
no studies have visualized the ne internal porous structure of allophanic soil microaggregates, nor
studied the carbon structure preserved in such soils or paleosols. We used synchrotron radiation-based
transmission X-ray microscopy (TXM) to perform 3D-tomography of the internal porous structure of
allophanic soil microaggregates, and carbon near-edge X-ray absorption ne-structure (C NEXAFS)
spectroscopy to characterize SOM in ≤12,000-yr-old tephra-derived allophanic paleosols. The TXM
tomography showed a vast network of internal, tortuous nano-pores within an allophanic microaggregate
comprising nanoaggregates. SOM in the allophanic paleosols at four sites was dominated by
carboxylic/carbonyl functional groups with subordinate quinonic, aromatic, and aliphatic groups. All
samples exhibited similar compositions despite differences between the sites. That the SOM does not
comprise speci c types of functional groups through time implies that the functional groups are relict.
The SOM originated at the land/soil surface: ongoing tephra deposition (intermittently or abruptly) then
caused the land-surface to rise so that the once-surface horizons were buried more deeply and hence
became increasingly isolated from inputs by the sur cial/modern organic cycle. The presence of quinonic
carbon, from biological processes but vulnerable to oxygen and light, indicates the exceptional protection
of SOM and bio-signals in allophanic paleosols, attributable both to the porous allophane aggregates
that occlude the relict SOM from degradation, and to rapid burial by successive tephra-fallout, as well as
strong Al-organic chemical bonding. TXM and C NEXAFS spectroscopy unravel the ne structure of soils
and SOM and are of great potential for soil science studies.

1. Introduction
The secondary clay minerals in soils are the reactive inorganic components that form aggregates in
strong association with soil organic carbon (SOC)1,2, and the retention of soil organic matter (SOM) in
small pores within soil aggregates has been proven to slow carbon turnover or decomposition rates3–5.
Allophane is an Al-rich nanocrystalline aluminosilicate, formula (1–2)SiO2·Al2O3·(2–3)·H2O, that
comprises hollow spherules ~ 3.5 to 5 nm in diameter and a high speci c surface area (up to ~ 1200 m2
g− 1)6–8, enabling allophanic soils derived from tephra (volcanic ash), including Andisols, to adsorb much
SOM (including via strong Al-SOM bonding) and stablize SOC9,10. The aggregation of allophane
spherules generates fractal porous networks to retain and sequester considerable amounts of SOM which
is spatially protected against degradation11–15.

A distinctive feature of many tephra-derived allophanic soils on stable sites is their multi-layered
nature9,16. Such soils are formed by upbuilding pedogenesis during which soil evolution occurs via
topdown processes whilst tephras (including cryptotephras) are concomitantly added to the land/soil
surface16–18. The thickness and frequency of tephra accumulation (and other factors) determine if
developmental or retardant upbuilding, or both, takes place (nomenclature follows Johnson and Watson-
Stegner 19; Johnson, et al. 20; Almond and Tonkin 21). One of the advantages of tephra layers is that, once

                                                   Page 2/26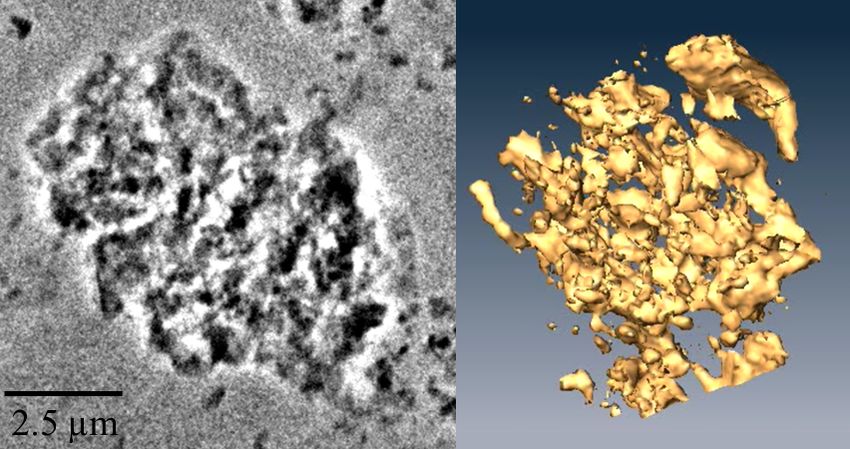
identi ed, they provide isochrons to connect and synchronize sequences and to assign relative or
numerical ages using tephrochronology22. Therefore the ages of buried soils (paleosols) on multiple
tephras are able to be dated.

The central North Island of New Zealand has huge stores of buried, allophane-rich paleosols developed
on sequences of well-dated tephra beds16,17,23,24. The early Holocene of this region was dominated by
extensive podocarp-broadleaf forest and warm and wet conditions followed generally by gradual drying
and cooling25–28 with modest uctuations29. Thus, the slow carbon turnover rate in allophane-rich soils,
and the abundance of buried allophanic paleosols on dated tephras in North Island, provide the
opportunity to characterize the nature of stabilized SOM preserved in allophanic soils/paleosols in
response to changes of environmental and climatic conditions.

Conventional studies of the nature of SOM have relied mainly on chemical extractions30. However, the
extractable components could only partially represent the nature of SOM31,32. Modern spectroscopic
techniques including 13C nuclear magnetic resonance (NMR), Fourier transform infrared (FTIR), pyrolysis
gas chromatography-mass spectrometry (pyrolysis-GC/MS), and carbon near-edge X-ray absorption ne
structure (C NEXAFS) spectroscopy, are used for characterizing SOM33–36 in order to more closely
analyze in situ organic matter by avoiding artefacts of the extraction techniques.

Paramagnetic metals in soils interfere with 13C NMR spectroscopy for SOM and thus hydro uoric acid
(HF) has been used to dissolve the majority of soil minerals before such analysis37,38. However, HF
treatment results in the loss of a SOM that is held as organo-mineral complexes38. The investigation of
the structural composition of SOM using FTIR spectroscopy is di cult also because of the overlap of
absorption bands of organic matter and inorganic soil components39. Instead, C NEXAFS spectroscopy
involves promotion of core electrons (in the K shell) to higher orbitals and allows monitoring of the
emitted electrons and photons. Other soil components (e.g. clays and water) do not interfere with the
analysis of carbon by C NEXAFS spectroscopy5,33,39. Figure 1 illustrates how different functional groups
(multiple peaks) of soil humic substances contribute a characteristic spectrum. Kruse, et al. 35 also nicely
documented the assignment of C K-edge XANES (NEXAFS) peak energy positions to C moieties.

Our objectives were to analyze the porous structure of allophanic microaggregates and functional groups
of SOM preserved from past environments associated with allophanic tephra-derived Holocene paleosols
to further understand carbon sequestration in Andisols and associated paleosols. We also wanted to
evaluate the potential of C NEXAFS spectroscopy for soil evolution studies and paleopedology. From four
sites in central North Island, we sampled a series of buried paleosols formed by developmental and/or
retardant upbuilding pedogenesis on Holocene tephra layers, all formed under podocarp-broadleaf forest
until only ca 700 calendar (cal.) yr ago (when Polynesian arrival led to partial deforestation), their ages
established via tephrochronology40. Each paleosol represents an age range from ca 1100 to ca 12,000
cal. yr of pedogenesis (soil formation) at the land surface before burial. Just the organo-clay complexes
were analyzed because only the clay fraction has a strong association with SOM and SOC retention in

                                                  Page 3/26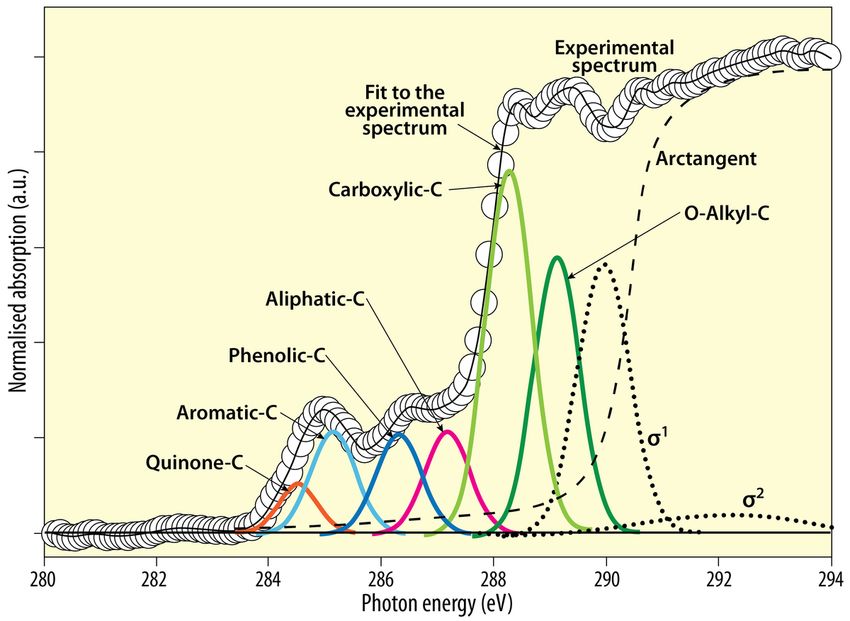
soils1,2, and the preserved SOM is held largely within microaggregates41. We rst used high-resolution
transmission X-ray microscopy (TXM) to examine the internal structure of the microaggregates to help
envisage and explain the preservation of SOM within them. The aggregates were then analyzed by C
NEXAFS spectroscopy to resolve the carbonaceous functional groups (also known as carbon speciation)
of SOM of various ages, which is the rst analysis to be undertaken on sequences of buried allophanic
paleosols formed on Holocene tephras of known age.

2. Materials And Methods
2.1 Stratigraphy and sampling of paleosols
We selected allophane-rich soil material and paleosols developed almost all on Holocene tephra-fall
deposits of both rhyolitic (i.e. with high silica content, ≥∼70 wt% SiO2) and andesitic (with intermediate
silica content, ∼50–70 wt% SiO2) composition at four geomorphically-stable sites in central North Island
(Fig. 2), two relatively close to the main volcanic sources (proximal sites) and two farther away (distal
sites). At two sites – Brett Rd, Ashton Dairies Pit – the (now buried) soil on Taupo eruptives is formed on
loose (i.e. non-welded), pumiceous Taupo ignimbrite, derived from a pyroclastic ow, rather than fall
deposits42.

The multi-layered soils at the two distal sites were formed mainly by developmental upbuilding: Tapapa
(formed on a composite of mainly rhyolitic tephras), near Tirau; and Lake Rotoaira (formed on a
composite of mainly andesitic tephras), near Turangi and close to Mount Tongariro (Fig. 2). The multi-
layered soils at the two proximal sites were formed on rhyolitic tephras via retardant upbuilding: Brett
Road and Ashton Dairies Pit, both near Mount Tarawera to the southeast of Rotorua (Fig. 2). Roadside
tephra-soil pro les (sections) at Tapapa and Lake Rotoaira were incised ~ 50 cm laterally to remove any
modern roadside plant material before sampling; the roadside pro le at Brett Rd was incised ~ 1 m
laterally; and the pro le at Ashton Dairies was in a pit newly excavated using a digger. The stratigraphy
and soil horizonation for each soil pro le were established using tephrostratigraphy − see supplementary
materials (SM) Sect. 1 − and conventional soil morphological examination (Fig. 3; Soil Survey Staff 44).

Soil horizons at all sites were tested using the NaF-based allophane test in the eld43 to con rm that they
were allophanic (samples were later analysed for allophane content). In total, 13 samples of buried
allophanic soil horizons (paleosols) were collected (Table 1). They were sieved to obtain < 2 mm-size
( ne-earth) fractions and stored at 4°C in the dark.

2.2 Soil properties and extraction of organo-clay fractions
Soil pH values (solid/solution = 1/2.5) were measured in water following the method of Blakemore, et al.
45
     (Table 1). Allophane contents of soil samples were estimated by oxalate-extractable Fe, Al, and Si as
well as pyrophosphate-extractable Al45,46. Before extraction of clay fractions, visible root remnants were
removed. To obtain clay fractions (particles < 2 µm), each sample was dispersed mechanically by
                                                   Page 4/26
prolonged shaking for 16 h with deionized (DI) water and 2-mm glass beads47, followed by sedimentation
of particles > 2 µm according to Stokes’ Law and then suspended clay was extracted via a pipette. The
clay fractions were frozen quickly with liquid nitrogen and freeze-dried to preserve the nature of organic
matter associated with the clay. The freeze-dried (organo-)clays were ground and analyzed for total
organic carbon (TOC). Analysis of TOC was undertaken using a Leco TruSpec carbon/nitrogen analyzer.
The pH values, clay, and allophane contents of whole soil ( ne-earth) collected from the paleosols are
shown in Table 1, together with the TOC contents (of clay fractions) and stratigraphic and age
information.
Page 5/26Table 1
Depths, ages, and pH values of the soil and buried-soil horizons at the four sites, and their clay, allophane,
and total organic carbon (TOC) contentsa.
Site Depth Age (range) of pH Clay Allophane TOC
paleosolc content content
(horizon (H2O)d (clay
notationb) (< 2 µm) ( ne-earth basis)
basis)
cm cal. yr BP wt % wt % wt %
Tapapa
Bw1 20 − 30 ≤ca 12,000 5.8 10.6 8.3 10.6
Bw2 30 − 40 ≤ca 12,000 5.9 6.8 10.4 7.7e
Lake Rotoaira
3Ahb 0 − 20f 2800 − 1718 6.3 9.3 11.3 7.0
3ACb 20 − 40f 2800 − 1718 6.2 8.1 18.3 6.9
4Ahb 40 − 60f 11,200–2800 6.2 16.6 32.7 6.7
4ABb1 60 − 80f 11,200–2800 6.2 19.0 18.6 6.5
4ABb2 80 − 11,200–2800 6.1 17.2 14.5 7.0
100f
Brett Rd
3ABb 70 − 80 1718 − 636 6.6 3.4 3.0 11.9
4Bwb 140 − 5526 − 1718 6.8 3.9 5.3 10.2
150
5Ahb 210 − 9423 − 5526 6.6 5.0 2.5 6.3
220
a Means of two samples.
b
Base on Soil Survey Staff 44 and Soil Survey Staff 48.
c
Approximate length of time the tephra material was at or near the land surface undergoing
weathering and pedogenesis by topdown soil processes before its burial by subsequent tephra(s)
(ages derived from, using tephrochronology − see text).
d
10 g of soil (< 2 mm fraction) in 25 mL of DI water.
e
From equivalent buried soil horizons on the same tephras at nearby sites (from Lowe and Tonkin 18,
after Green 49).
Page 6/26Site Depth Age (range) of pH Clay Allophane TOC
paleosolc content content
(horizon (H2O)d (clay
notationb) (< 2 µm) ( ne-earth basis)
basis)
cm cal. yr BP wt % wt % wt %
Ashton Dairies
Pit
3Bhb 20 − 30g 1718 − 636 6.5 4.7 2.1 na
4Bsb 60 − 80g 5526 − 1718 6.5 2.9 1.2 10.5
5Ahb 130 − 9423 − 5526 5.5 1.1 4.8 13.3e
140g
a Means of two samples.
b
Base on Soil Survey Staff 44 and Soil Survey Staff 48.
c
Approximate length of time the tephra material was at or near the land surface undergoing
weathering and pedogenesis by topdown soil processes before its burial by subsequent tephra(s)
(ages derived from, using tephrochronology − see text).
d
10 g of soil (< 2 mm fraction) in 25 mL of DI water.
e
From equivalent buried soil horizons on the same tephras at nearby sites (from Lowe and Tonkin 18,
after Green 49).
f
Below the datum line of the base of (non-welded) Taupo ignimbrite (Fig. 3).
g Below the datum line of the base of Kaharoa tephra (Fig. 3).
na: data not obtained.
2.3 Characterization of internal porous structure of
allophane aggregates using TXM
To help envisage and explain the preservation of the SOM identi ed in the allophanic buried
soils/paleosols, we used a synchrotron-based transmission X-ray microscope (TXM) which allows two
dimensional (2D) imaging and 3D tomography at tuneable energies from 6 to 11 keV. The experiment
was carried out at BL01B1 at the National Synchrotron Radiation Research Center (NSRRC) in Hsinchu,
Taiwan, and a natural allophane microaggregate extracted from the Bw1 horizon of the soil at Tapapa
(Fig. 3) was examined at 1.84 keV for silicon K-edge. 2D micrographs of the microaggregate were
generated using TXM with 60 s exposure times to obtain micrographs of high resolution; the 3D
tomography datasets were reconstructed based on sequential image frames taken with azimuth angle
Page 7/26rotating from − 75° to + 75° to obtain 151 2D micrographs of the microaggregate, with 60 s exposure
times for each 2D micrograph. The nal 3D virtual structure (image) of the microaggregate was
generated from the tomographic dataset using the software Amira 5.01, Visage Imaging.
2.4 Characterization of SOM sequestered by clays using C
NEXAFS spectroscopy
C NEXAFS spectra for (organo-) clays and for pure indium foils (as sample carriers) were collected at
beamline 24A1 at NSRRC. Typically, to normalize the signals from samples, the total electron yield from
each sample is divided by the yield of a clean surface (namely I0) measured concurrently with the sample
of interest, but often the C accumulation in the beamlines leads to false I0 signal for C analysis. Beamline
24A1 at NSRRC has a speci c system that allows I0 to be obtained by X-ray travelling through a golden
grid which had been set up in the beam path in the ionization chamber ahead of the analytical chamber.
The golden grid is coated in-situ by ionized gold atoms ejected from a gold stick during a sputtering
process before all the experiments are carried out. The signal derived when the beam passes through the
just-coated golden mesh is designated to be carbon-free, and the interference of carbon accumulating in
the beam path with spectra normalization is therefore eliminated. The beamline 24A1 was used to obtain
high-resolution C 1s X-ray photoelectron spectroscopy (XPS) spectra and C NEXAFS spectra50,51,
indicating that the beamline is free from signi cant carbon accumulation/contamination and is thus
suitable for C X-ray absorption spectroscopy (XAS).
Fluxes of photons 5×10¹¹ to 1×10¹⁰ per second were admitted to the chamber, and the beamline
produced soft X-rays (energy range < 5 keV) so that the energy was tuneable over 10 to 1500 eV and
allowed a focussed beam size of 0.7 by 0.3 mm. The end station comprised three chambers, including a
pre-chamber, a transfer chamber, and a main analytical chamber. The last is under very high vacuum (< 1
⊆10− 8 torr). For C NEXAFS spectroscopy with high resolution, the beamline grating was set to 400 mm− 1,
and the positions of two beamline silts were set to -200 and − 20 on the dial to minimize the light source
and focus the beam.
For sampling preparation, disposable gloves were worn and tools were cleaned with acetone to avoid
carbon contamination from personnel or preparation. An extracted organo-clay fraction from each soil
sample was pressed into indium foil (0.5 mm thick, manufactured by Puratronic®, 99.9975%) to be
conductive so that the excited electrons could be transmitted from the sample surface to the detector.
The surface of indium foil was fully covered with sample to avoid any potential extraneous carbon
contribution from the indium foil itself, and the indium foil with attached sample was attened with clean
glass rods. The attened indium foil containing the sample was attached to a clean sample holder, and
the holder was placed into the pre-chamber for degassing for 2 h and then transferred to the main
analytical chamber.
The C NEXAFS spectroscopy was performed with the X-ray energy set to increase from 275 to 340 eV
with a step of 0.035 eV (2000 dwell points in total, 1 millisecond dwell time per point), and it took
Page 8/26approximately 3 min to obtain one spectrum. Three spectra were collected for each organo-clay sample
based on total electron yield and partial electron detection modes with an electron energy analyzer
(SPECS PHOBOIS 150). The replicate C NEXAFS spectra for each sample were merged, processed,
baseline-corrected, and normalized using the Athena program, an interface to IFEFFIT (version 1.2.11).
The full spectra including post-edge region up to 340 eV were used for normalization (see an example in
Fig. SM1A). In our study we only present the spectra of total electron yield as they provided better
resolution with high electron yield in our case, and we show spectra of samples between 280–310 eV
because the peaks in this region representing various C functional groups were identi ed according to the
X-ray energies.
3. Results
3.1 Porous internal structure of an allophane
microaggregate from soil at Tapapa
The 2D and 3D images of the examined microaggregate are presented in Fig. 4. The 3D virtual
reconstruction of the allophane microaggregate showed that it was highly porous and comprised many
sub-microaggregates or nanoaggregates (de ned as ≤100 nm in diameter: Huang, et al. 41).
3.2 Carbon from indium foil and authentic carbon signal
from Beamline 24A1
The C NEXAFS spectrum for indium foil (99.9975% purity, used as sample carrier) showed that carbon
from the indium foil was characterized by quinonic and carboxylic/carbonyl functional groups (Fig.
SM1A), which, despite the safeguards noted earlier (Sect. 2.4), could be from the impurities when the
indium foil was re ned and manufactured or from extraneous carbon adsorbed on the indium foil before
use. We further examined other carbonaceous materials, such as biochars and non-allophanic soil
materials, and found different carbon functional groups (Figs. SM1B and SM1C). Quinonic carbon in
particular was not observed in biochar samples, and there was signi cant loss of carboxylic/carbonyl
groups in three samples. Thus, we concluded that the carbon signals from indium foil did not affect the
analysis of soil mounted on the surface of indium, and that indium foil was a suitable holder for soil
samples. Moreover, the spectra from our allophanic paleosols and from indium foil exhibited different
baselines and intramolecular resonances (over the 290 − 296 eV region) (see Fig. SM1A and Fig. 5), and
so the carbon signal from samples could not have originated from the indium foil.
3.3 Nature of SOM in allophanic clay fractions of Holocene
tephra-derived paleosols at the four sites
The clay fractions from allophanic paleosols contain 6.5 to 13.3% TOC. At the developmental upbuilding
sites in Tapapa and Rotoaira, we found very similar C functional groups compositionally and
Page 9/26proportionally (Figs. 5A and 5B). The C NEXAFS spectra were mainly characterised by quinonic (284 eV),
aromatic (285 eV), and carboxylic/carbonyl (288.5 eV) carbon, although the clay, allophane, and TOC
contents of the soils varied markedly (Table 1). The results show that the structures of preserved SOM in
clay fractions of paleosols on Holocene tephras of different ages (Fig. 3, Table 1) have remained the
same, and that clay and allophane contents, and time, have not signi cantly affected the constituent
functional groups of the SOM adsorbed by clays in these paleosols.
The paleosols at the retardant upbuilding sites, Brett Road and Ashton Dairies Pit, are each developed on
the same set of Holocene tephras, including Taupo, Rotoma, and Whakatane tephras. The clay-attached
organics in paleosols on each of these tephras at the two sites, despite some podzolic (strongly acidic
leaching) soil morphological differences noted earlier (Fig. 3, Table 1), still have similar spectral
characteristics (Fig. 5C), including substantial amounts of carboxylic/carbonyl groups (> 40%) at 288.6
eV and relatively small contributions of quinonic (284.3 eV), aromatic (285 eV), and aliphatic (287.1 eV)
groups despite differences in paleosol ages and depths (Fig. 3, Table 1). As at Tapapa and Lake Rotoaira,
these similarities indicate that the structures of preserved SOM in the clay fractions of Holocene
paleosols of different ages have remained the same despite the differences in clay and allophane content
and age, and the podzolization evident at Ashton Dairies Pit (SM Sect. 1.3).
4. Discussion
4.1 Porous clays in allophanic soils/paleosols and
upbuilding pedogenesis allow preservation of SOM
Previously the high surface area and the hydroxyl groups of allophane in tephra soils and Andisols were
considered to be one of the keys for SOM/SOC sequestration52,53. However, more recent study based on
the surface chemistry and adsorption capacity of synthetic allophane spherules showed that almost 80%
of the organic compunds were held “physically” within pores of allophane microaggregates and
nanoaggregates41. Our 3D tomography of a microaggregate from the Bw1 horizon of the allophanic soil
material at Tapapa shows the vast internal porous structure within the aggregate, and such an extent of
fractal nano-pores (described as a “nanolabyrinthic” pore distribution with a high degree of tortuosity)
decreases organic matter bioavailability and carbon turnover rate4,11,41.
Ongoing tephra accretion then causes the land surface to rise so that the once-surface horizon becomes
more deeply buried and hence increasingly isolated from the modern (sur cial) organic cycle.
Consequently, the effects of pedogenesis (parent material transformation) become negligible or nil: in the
case of incremental, thin tephra/cryptotephra deposition (i.e. developmental upbuilding), the isolation is
gradual whereas in the case of sudden thick tephra deposition (i.e. retardant upbuilding) it is abrupt or
paroxysmal (these concepts were rst described by Tayler 54; see also Schaetzl and Sorenson 55).
Although downward leaching of mobile, younger SOM from the surface through the pro les occurs, we
contend that such SOM would not be well protected chemically unless it was able to be encapsulated into
Page 10/26the nanolabyrinthic pore network, which, however, would be largely occupied by older SOM encased
physically during past periods of soil formation that included weathering and dissolution of abundant
volcanic glass by hydrolysis (where the proton donor was usually carbonic acid, together with organic
acids especially at Ashton Dairies Pit) and the synthesis (neoformation) of the dissolution products to
form clays near the soil/land surface56.
Thus, much of the SOM adsorbed and preserved chemically and physically by allophane in clay fractions
of the buried paleosols on Holocene tephras in New Zealand is, we suggest, derived mainly from past
environments when the organo-allophane micro/nanoaggregates were formed at or close to the (paleo)
land surface prior to their burial. This conclusion is supported by the earlier ndings on ancient plant DNA
extracted from a buried paleosol on Rotoma tephra at the Brett Rd site57.
4.2 Similarity of carbon functional groups of SOM in
paleosol clay fractions
In our study, the shapes of spectra for SOM in clay fractions showed no signi cant increase nor decrease
in intensity of speci c C functional groups between samples, revealing the high similarity of stabilized C
in the clay fractions of the allophane-rich paleosols. Although Heymann, et al. 31 showed that the
proportions of aromatic C and O-alkyl C in alkaline extracts from soils at different depths could be varied,
the SOM in the non-treated clays from our paleosols shows the same carbon functional groups. The
predominance of carboxylic/carbonyl carbon in the allophanic soils/paleosols examined in our study
may result from (1) a strong association of carboxylic/carbonyl groups of humic substances with Al-OH
defects on the surface of allophane by ligand exchange13,52,58, or (2) oxidation of organics in uppermost
soil horizons (at the land surface under an active organic regime)59 in the past and before the land
surface was buried by new tephra deposits, or both. We therefore infer that the SOM originated at or near
the land surface during upbuilding pedogenesis.
As soil genesis and hydrolysis-dominated weathering began in a newly-deposited tephra uppermost in the
soil pro le, allophane formed quickly7 and SOM was sequestered on spherules and in nano-pores within
microaggregates. As noted above, ongoing tephra deposition (incrementally and/or suddenly) caused the
land surface to rise so that horizons formerly at the surface were gradually or suddenly buried and hence
over time became increasingly isolated from inputs by the modern organic cycle and near-surface
processes. The presence of quinonic carbon, especially sensitive to oxygen and light, is indicative of the
exceptionally strong protection of SOM by clays in allophanic paleosols, and attributable both to a
tortuous nano-pore network amidst allophane micro-and nanoaggregates that encapsulates and shields
the relict SOM from degradation, and to rapid burial by successive tephra-fall deposition. The occlusion,
together with rapid burial, would help cut out light (which is unlikely to penetrate beyond ca 10 mm:
Tester and Morris 60 and thus reduce photodegradation of quinonic carbon by solar irradiance61. The
mean rates of tephra accretion at Brett Rd and Ashton Dairies Pit are ~ 25 mm per century, and those at
Tapapa and Lake Rotoaira are ~ 5 to 12 mm per century, respectively (after Lowe 62), and so, on average,
surface horizon components typically would be buried beyond light penetration within just decades. The
Page 11/26clay-associated SOM (as expressed by the carbon functional groups) in the paleosols at each of the four
study sites thus likely derived from soil processes operating from early to late Holocene and has not been
modi ed by modern surface processes, or diagenesis, after burial.
An early study in southern Italy also showed no differences in the chemical composition and structure of
the humic substances extracted from six paleosols formed on a sequence of pyroclastic deposits dating
from ca. 30,000 to 7,000 cal. yr BP, despite the difference in age63, and this study concluded that the
paleosols appear to be “closed systems from the geochemical point of view”. Similarly, with the use of
solid-state NMR spectroscopy, the SOM in 50, 100, 300, 700, and 2000 year-old soils collected from a
paddy soil chronosequence in China showed similar compositions of carbon functional groups64. Kleber,
et al. 65 also showed that old, preserved SOM adsorbed by clays does not comprise a particular type of
carbon, but a 680-year-old Inceptisol (a weakly developed soil with a Bw horizon: Soil Survey Staff 48)
sequestered a large proportion of alkyl carbon (aliphatic functional groups) that can be metabolized
easily.
4.3 Presence of quinone as an indication of bio-signal
preservation in allophanic soils
In comparison with published C NEXAFS spectra for organic matter in other soils or soil
aggregates33,65,66, our New Zealand allophanic paleosols studied here all contained a distinct amount of
quinonic carbon (over 284 eV region). Natural quinones are common constituents of bacterial plasma
membranes67,68 and of pigments of chloroplasts69, which are involved in cellular respiration and
photosynthesis. Among natural quinones, isoprenoid quinones have been used as taxonomic markers68
and are one of the most important groups of quinones because of their functions. Isoprenoid quinones
are composed of a hydrophilic head group and an apolar isoprenoid side chain, giving the molecules a
lipid-soluble character70. These quinones are hydrophobic and particularly susceptible to breaking down
in well-drained alkaline conditions and are photo-oxidized rapidly in the presence of oxygen and strong
light71,72. Naturally, the quinonic ring (an unsaturated ring containing two –C = O groups) undergoes
reversible reduction, leading to more stable quinol ring (an unsaturated ring containing two –OH
groups)70. Therefore, quinonic carbon is labile and highly susceptible to degradation and transformation
in soils, which explains the absence or trace presence only of quinonic carbon in most soils examined in
previous studies5,33,66. Hence, the presence of quinonic carbon in some soils has been attributed to its
occlusion and thus protection within organo-aggregates − for example, Solomon, et al. 73 mapped the
carbon functional groups of an ultrathin section of a soil microaggregate and showed the quinonic
carbon occurred only in the inner and intermediate regions of the aggregate.
The encapsulation of organic matter within labyrinthic pore networks amidst allophane micro-and
nanoaggregates, readily envisaged from the 3D microtomographic image in Fig. 4, allows such organic
matter to be occluded and thus remain intact despite strongly acidic leaching and oxidizing conditions at
our sites (cf. Chevallier, et al. 11; Huang, et al. 57). The good preservation of the bio-signal in allophane-rich
Page 12/26soils is evidenced by the presence of quinones in the soils, and thus the allophane-rich paleosol archives
are of great potential for future studies in reconstructing past environments via lipid biomarker or ancient
DNA analyses.
5. Conclusions
(1) The synchrotron-based TXM allowed us to obtain the rst visualization and reconstruction of the vast
network of internal nano-pores, i.e. nanolabyrinthic pore structure, within a microaggregate extracted from
tephra-derived allophanic soil material of Holocene age. This highly porous, tortuous nano-scale network
allows carbon to be tightly entrapped, and the ongoing, rapid burial and hence subsurface isolation of the
soil horizons (via upbuilding pedogenesis), together help to explain the high SOM sequestration and slow
carbon turnover rate in tephra-derived soils (see (3) below for summary of mechanism).
(2) The SOM associated with allophanic clay fractions in the paleosols, ranging in age from ca 12,000 to
1718 cal. yr BP, was dominated by carboxylic/carbonyl functional groups with subordinated amounts of
quinonic, aromatic, and aliphatic groups. All samples from four study sites exhibited similar
compositions despite differences in clay and allophane contents, stratigraphic position (depth of burial),
age, parent-tephra composition (andesitic versus rhyolitic), rainfall (Lake Rotoaira > Tapapa, Brett Rd,
Ashton Dairies), and mode of soil genesis (developmental versus retardant upbuilding). The dominant
carboxylic/carbonyl functional groups could be ascribable to close binding between these functional
groups and allophane that is better than for other groups.
(3) We envisage that the SOM (as expressed by the carbon functional groups) originated at or near the
land surface via upbuilding pedogenesis and weathering dominated by hydrolysis in free-draining tephra
layers. As soil genesis began in a newly-deposited tephra bed at the soil/land surface, allophane was
precipitated from weathering-derived solutes and formed micro- and nanoaggregates, physically
sequestering contemporary SOM from the modern (sur cial) organic cycle. Ongoing tephra deposition
then caused the land surface to rise so that previous-surface (A) horizons became increasingly divorced
from the modern organic cycle through their ever-deepening burial, eventually forming isolated paleosols.
The SOM in the paleosols at each of the four study sites thus derives from processes operating from
early to late Holocene, and not from modern surface processes nor from diagenesis.
(4) In comparison with published C NEXAFS spectra for SOM in other soil materials, our allophanic
paleosols contained a distinct amount of quinonic carbon over 284 eV region, indicating strong
preservation of bio-signals in these soils. Thus allophanic paleosols archives are of great potential for
paleoecology studies via biomarker (i.e. lipid or DNA) analyses.
(5) Our study suggests that the TXM possesses a great potential for study in soil microstructure at micro-
and nano-scales and the C NEXAFS spectroscopy is an important method for evaluating the ne structure
of SOM in order to study the persistence and change of SOM in response to environmental change.
Page 13/26Declarations
Acknowledgements
This research was supported mainly by the Marsden Fund Te Pūta Rangahau a Marsden administered
through the Royal Society of New Zealand (Royal Society Te Apārangi) for the project “New view from old
soils: testing the reconstruction of environmental and climatic change using genetic signals preserved in
buried paleosols” (contract UOW1006) to D.J. Lowe, and partly by a University of Waikato doctoral
scholarship and The Swedish Research Council Formas Mobility Grant (Project number 2019-01668) to
D.Y.-T. Huang. Our research was also supported by managers and other staff at beamlines 24A1 and
01B1 at the National Synchrotron Radiation Research Center (NSRRC) at Hsinchu, Taiwan, whom we
gratefully thank for their expertise and help for our project “Characterising DNA and carbon within and
between nanoaggregates of allophane in andic soils and paleosols, northern New Zealand” (proposal
2012-2-049). We are also grateful to Prof. Shan-Li Wang and Prof. Zeng-Yei Hseu for providing biochars
and non-allophanic soil material, and other support. We thank Anja Moebis for her advice regarding the
tephrostratigraphy at the Lake Rotoaira site, and colleagues who helped with sampling including Chris
McKinnon, Natasha Jaques, Maria Zammit, Bruce and Triona Williamson, Kerri Lanigan, and Maria Lowe.
We especially thank farmers Marcus Pinder and Mike Marti at Ashton Dairies for providing access and for
generously excavating a pit for us, and Jan and Barry Goodwin for allowing ongoing access to the
Tapapa site on their farm. Brent Green is thanked for allowing us to cite data from his masterate thesis
(1987), David Palmer for providing modelled rainfall data, Max Oulton for re-drawing Fig. 1, and Marta
Camps Arbestain and Randy Dahlgren for helpful comments on an early version of the paper. DJL is
grateful to Siwan Davies and her tephra group at Swansea University, UK, for supporting his visit in
August 2015 during which parts of this paper were initially prepared. The paper is an output of the
Commission on Tephrochronology (COT) of the International Association of Volcanism and Chemistry of
the Earth’s Interior (IAVCEI).
Author contributions
The nature of contribution by the leading author D.Y.-T.H. included sampling, design and conduct of
experiments, data analysis and writing. D.J.L. substantially contributed to development of project,
sampling, experiment design, manuscript writing/editing and to the text regarding tephrochronology,
detailed information of landscape of study sites and pedogenesis information. G.J.C. contributed to the
development of project and experiment design and provided substantial comments particularly on the
interactions between clays and SOM/SOC. L.A.S., and A.C. and N.J.R provided comments on data
analysis and interpretation. T.-Y.C. provided fundamental technical support on synchrotron radiation work
and comments on the manuscript. The manuscript was revised by all authors.
Additional information
There is no competing nancial and/or non- nancial interests in relation to the work described.
Page 14/26Data availability
All the soil chemistry data as well as the TXM tomographic images and C NEXAFS spectra are available.
Abbreviations
asl, above sea level; AP, Ashton Dairies Pit; BP, before present (‘present’ is 1950 in the radiocarbon [14C]
timescale); BR, Brett Rd; cal., calendar or calibrated; C NEXAFS, carbon near-edge X-ray absorption ne
structure; DNA, deoxyribonucleic acid; DI, deionized; FTIR, Fourier transform infrared; NMR, nuclear
magnetic resonance; NSRRC, National Synchrotron Radiation Research Center; Ok, Okareka tephra;
pyrolysis-GC/MS, pyrolysis gas chromatography-mass spectrometry; Rk, Rerewhakaaitu tephra; Rr,
Rotorua tephra; SM, supplementary materials; SOC, soil organic carbon; SOM, soil organic matter; Te, Te
Rere tephra; TXM, transmission X-ray microscopy; XAS, X-ray absorption spectroscopy; XPS, X-ray
photoelectron spectroscopy; yr, year(s).
References
1 Mikutta, R., Kleber, M. & Jahn, R. Poorly crystalline minerals protect organic carbon in clay
subfractions from acid subsoil horizons. Geoderma128, 106-115 (2005).
2 Churchman, G. J. & Lowe, D. J. Alteration, formation, and occurrence of minerals in soils in
Handbook of Soil Sciences, Vol. 1: Properties and processes (eds Huang, P. M. & Sumner, M. E.) 20.21-
20.72 (CRC Press (Taylor & Francis), 2012).
3 Six, J., Elliott, E. T. & Paustian, K. Soil macroaggregate turnover and microaggregate formation: a
mechanism for C sequestration under no-tillage agriculture. Soil Biology and Biochemistry32, 2099-2103
(2000).
4 Strong, D. T., Wever, H. D., Merckx, R. & Recous, S. Spatial location of carbon decomposition in the
soil pore system. European Journal of Soil Science55, 739-750 (2004).
5 Arachchige, P. S. P. et al. Sub-micron level investigation reveals the inaccessibility of stabilized
carbon in soil microaggregates. Scienti c reports8, 16810 (2018).
6 Theng, B. K. G. & Yuan, G. Nanoparticles in the soil environment. Elements4, 395-399 (2008).
7 Par tt, R. L. Allophane and imogolite: role in soil biogeochemical processes. Clay Minerals44, 135-
155 (2009).
8 Iyoda, F. et al. Synthesis and adsorption characteristics of hollow spherical allophane nano-particles.
Applied Clay Science56, 77-83 (2012).
Page 15/269 McDaniel, P. A., Lowe, D. J., Arnalds, O. & Ping, C.-L. Andisols in Handbook of soil sciences, Vol. 1:
Properties and processes (eds Huang, P. M., Li, Y. & Sumner, M. E.) 33.29-33.48 (CRC Press, 2012).
10 Churchman, G. J., Singh, M., Schapel, A., Sarkar, B. & Bolan, N. Clay minerals as the key to the
sequestration of carbon in soils. Clays and Clay Minerals68, 135-143 (2020).
11 Chevallier, T., Woignier, T., Toucet, J. & Blanchart, E. Organic carbon stabilization in the fractal pore
structure of Andosols. Geoderma159, 182-188 (2010).
12 Dungait, J. A. J., Hopkins, D. W., Gregory, A. S. & Whitmore, A. P. Soil organic matter turnover is
governed by accessibility not recalcitrance. Global Change Biology18, 1781-1796 (2012).
13 Matus, F., Rumpel, C., Neculman, R., Panichini, M. & Mora, M. L. Soil carbon storage and stabilisation
in andic soils: A review. Catena120, 102-110 (2014).
14 Calabi-Floody, M. et al. Rold of nanoclays in carbon stabilization in Andisols and Cambisols. Journal
of Soil Science and Plant Nutrition15, 587-604 (2015).
15 Singh, M. et al. Stabilization of Soil Organic Carbon as In uenced by Clay Mineralogy. Advances in
Agronomy148, 33-84 (2018).
16 Hewitt, A. E., Balks, M. R. & Lowe, D. J. Allophanic soils in The Soils of Aotearoa New Zealand 21-39
(Springer International Publishing, 2021).
17 Lowe, D. J. & Palmer, D. J. Andisols of New Zealand and Australia. Journal of Intergrated Field
Science2, 39-65 (2005).
18 Lowe, D. J. & Tonkin, P. J. Unravelling upbuilding pedogenesis in tephra and loess sequences in New
Zealand using tephrochronology in Proceeding of 19th World Congress of Soil Science "Soil Solutions for
a Changing World", Symposium 1.3.2 Geochronological techniques and soil formation. (eds R. J. Gilkes &
N. Prakongkep) 34-37 (2010).
19 Johnson, D. L. & Watson-Stegner, D. Evolution model of pedogenesis. Soil Science143, 349-366
(1987).
20 Johnson, D. L., Keller, E. A. & Rockwell, T. K. Dynamic pedogenesis: new views onsome key soil
concepts, and a model for interpreting quaternary soils. Quaternary Research33, 306-319 (1990).
21 Almond, P. C. & Tonkin, P. J. Pedogenesis by upbuilding in an extreme leaching and weathering
environment, and slow loess accretion, south Westland, New Zealand. Geoderma92, 1-36 (1999).
22 Lowe, D. J. Tephrochronology and its application: A review. Quaternary Geochronology6, 107-153
(2011).
Page 16/2623 Pullar, W. A., Birrell, K. S. & Heine, J. C. Named tephras and tephra formations occurring in the central
North Island, with notes on derived soils and buried paleosols. New Zealand Journal of Geology and
Geophysics16, 497-518 (1973).
24 Hewitt, A. E., Balks, M. R. & Lowe, D. J. Pumice soils in The Soils of Aotearoa New Zealand 179-198
(Springer International Publishing, 2021).
25 McGlone, M. S. Holocene pollen diagrams, Lake Rotorua, North Island, New Zealand. Journal of the
Royal Society of New Zealand13, 53-65 (1983).
26 Newnham, R. M., de Lange, P. J. & Lowe, D. J. Holocene vegetation, climate and history of a raised
bog complex, northern New Zealand based on palynology, plant macrofossils and tephrochronology. The
Holocene5, 267-282 (1995).
27 Williams, P. W., King, D. N. T., Zhao, J.-X. & Collerson, K. D. Speleothem master chronologies:
combined Holocene 18O and 13C records from the North Island of New Zealand and their
palaeoenvironmental interpretation. The Holocene14, 194-208 (2004).
28 Jara, I. A., Newnham, R. M., Alloway, B. V., Wilmshurst, J. M. & Rees, A. B. H. Pollen-based
temperature and precipitation records of the past 14,600 years in northern New Zealand (37°S) and their
linkages with the Southern Hemisphere atmospheric circulation. The Holocene27, 1756-1768 (2017).
29 Newnham, R. M. et al. Peat humi cation records from Restionaceae bogs in northern New Zealand
as potential indicators of Holocene precipitation, seasonality, and ENSO. Quaternary Science Reviews
218, 378-394 (2019).
30 Baldock, J. A. & Broos, K. Soil organic matter in Handbook of Soil Sciences, second edn, Vol. 1:
Properties and Processes (eds Huang, P. M., Li, Y. & Sumner, M. E.) 11.11-11.15 (CRC Press, 2012).
31 Heymann, K. et al. Can functional group composition of alkaline isolates from black carbon-rich
soils be identi ed on a sub-100nm scale? Geoderma235-236, 163-169 (2014).
32 Kyle, M., Haande, S., Sønstebø, J. & Rohrlack, T. Ampli cation of DNA in sediment cores to detect
historic Planktothrix occurrence in three Norwegian lakes. Journal of Paleolimnology53, 61-72 (2015).
33 Solomon, D., Lehmann, J., Kinyangi, J., Liang, B. & Schäfer, T. Carbon K-edge NEXAFS and FTIR-ATR
spectroscopic investigation of organic carbon speciation in soils. Soil Science Society of America
Journal69, 107-119 (2005).
34 Buurman, P., Peterse, F. & Almendros Martin, G. Soil organic matter chemistry in allophanic soils: a
pyrolysis-GC/MS study of a Costa Rican Andosol catena. European Journal of Soil Science58, 1330-1347
(2007).
Page 17/2635 Kruse, J., Eckhardt, K.-U., Regier, T. & Leinweber, P. TG–FTIR, LC/MS, XANES and Py-FIMS to disclose
the thermal decomposition pathways and aromatic N formation during dipeptide pyrolysis in a soil
matrix. Journal of Analytical and Applied Pyrolysis90, 164-173 (2011).
36 Forouzangohar, M. et al. Using the power of C-13 NMR to interpret infrared spectra of soil organic
matter: A two-dimensional correlation spectroscopy approach. Vibrational Spectroscopy66, 76-82 (2013).
37 Par tt, R. L., Yuan, G. & Theng, B. K. G. A 13C-NMR study of the interactions of soil organic matter
with aluminium and allophane in podzols. European Journal of Soil Science50, 695-700 (1999).
38 Smernik, R. J. & Oades, J. M. Paramagnetic effects on solid state carbon-13 nuclear magnetic
resonance spectra of soil organic matter. Journal of Environment Quality31, 414-420 (2002).
39 Lehmann, J. & Solomon, D. Organic carbon chemistry in soils observed by synchrotron-based
spectroscopy in Synchrotron-based techniques in soils and sediments (eds Singh, B. & Gräfe, M.) 289-312
(Elsevier, 2010).
40 Lowe, D. J., Blaauw, M., Hogg, A. G. & Newnham, R. M. Ages of 24 widespread tephras erupted since
30,000 years ago in New Zealand, with re-evaluation of the timing and palaeoclimatic implications of the
Lateglacial cool episode recorded at Kaipo bog. Quaternary Science Reviews74, 170-194 (2013).
41 Huang, Y.-T. et al. DNA adsorption by nanocrystalline allophane spherules and nanoaggregates, and
implications for carbon sequestration in Andisols. Applied Clay Science120, 40-50 (2016).
42 Lowe, D. J. & Pittari, A. The Taupō eruption sequence of AD 232 ± 10 in Aotearoa New Zealand: a
retrospection. Journal of Geography130, 117-141 (2021).
43 Hewitt, A. E. New Zealand Soil Classi cation, third edn. Vol. 1, 136 (2010).
44 Soil Survey Staff. Keys to Soil Taxonomy, twelth edn, 362 (USDA Natural Resources Conservation
Service, 2014).
45 Blakemore, L. C., Searle, P. L. & Daly, B. K. Methods for chemical analysis of soils. NZ Soil Bureau
Scienti c Report, 80 (1987).
46 Par tt, R. L. & Wilson, A. D. Estimation of allophane and halloysite in three sequences of volcanic
soils, New Zealand. Catena Supplement7, 1-8 (1985).
47 Churchman, G. J. & Tate, K. R. Aggregation of clay in six New Zealand soils types as measured by
disaggregation procedures. Geoderma37, 207-220 (1986).
48 Soil Survey Staff. Buried soils and their effect on taxonomic classi cation,
(2014).
Page 18/2649 Green, B. E. Weathering of buried paleosols on late Quaternary rhyolitic tephras, Rotorua Region, New
Zealand Master of Science thesis, The University of Waikato, (1987).
50 Thomsen, L., Wharmby, M. T., Riley, D. P., Held, G. & Gladys, M. J. The adsorption and stability of
sulfur containing amino acids on Cu{531}. Surface Science603, 1253-1261 (2009).
51 Chen, C. J. et al. Improvement of lithium anode deterioration for ameliorating cyclabilities of non-
aqueous Li-CO2 batteries. Nanoscale12, 8385-8396 (2020).
52 Theng, B. K. G., Yuan, G. & Hashizume, H. Clay minerals and polymers: from soils to
nanocomposites. Clay Sciences12, 69-73 (2005).
53 Hernández, Z. et al. In uence of non-crystalline minerals in the total amount, resilience and
molecular composition of the organic matter in volcanic ash soils (Tenerife Island, Spain). European
Journal of Soil Science63, 603-615 (2012).
54 Tayler, N. H. Soil processes in volcanic ash-beds (part I and II). New Zealand Journal of Science and
Technology14, 193-202, 338-352 (1933).
55 Schaetzl, R. J. & Sorenson, C. J. The concept of “buried” versus “isolated” paleosols: examples from
northeastern Kanasa. Soil Science143, 426-435 (1987).
56 Hodder, A. P. W. A two-stage model for the formation of clay minerals from tephra-derived volcanic
glass. Clay Minerals25, 313-327 (1990).
57 Huang, Y.-T. et al. A new method to extract and purify DNA from allophanic soils and paleosols, and
potential for paleoenvironmental reconstruction and other applications. Geoderma274, 114-125 (2016).
58 Yuan, G., Theng, B. K. G., Par tt, R. L. & Percival, H. J. Interactions of allophane with humic acid and
cations. European Journal of Soil Science51, 35-41 (2000).
59 Lehmann, J. Near-edge X-ray absorption ne structure (NEXAFS) spectroscopy for mapping nano-
scale distribution of organic carbon forms in soil: Application to black carbon particles. Global
Biogeochemical Cycles19, GB1013 (2005).
60 Tester, M. & Morris, C. The penetration of light through soil. Plant, Cell & Environment 10, 281-286
(1987).
61 Rutledge, S., Campbell, D. I., Baldocchi, D. & Schipper, L. A. Photodegradation leads to increased CO2
losses from terrestrial organic matter. Global Change Biology16, 3065-3074 (2010).
62 Lowe, D. J. Upbuilding pedogenesis in multisequal tephra-derived soils in the Waikato region in
Proceeding of Australian and New Zealand 2nd Joint Soils Conference 183-184 (New Zealand Society of
Soil Science, 2000).
Page 19/2663 Calderoni, G. & Schnitzer, M. Effects of age on the chemical structure of paleosol humic acids and
fulvic acids. Geochimica et Cosmochimica Acta48, 2045-2051 (1984).
64 Zhou, Z. et al. Similarities in chemical composition of soil organic matter across a millennia-old
paddy soil chronosequence as revealed by advanced solid-state NMR spectroscopy. Biology and Fertility
of Soils50, 571-581 (2014).
65 Kleber, M. et al. Old and stable soil organic matter is not necessarily chemically recalcitrant:
implications for modeling concepts and temperature sensitivity. Global Change Biology17, 1097-1107
(2011).
66 Wan, J., Tyliszczak, T. & Tokunaga, T. Organic carbon distribution, speciation, and elemental
correlations within soil microaggregates: Applications of STXM and NEXAFS spectroscopy. Geochimica
et Cosmochimica Acta71, 5439-5449 (2007).
67 Lester, R. L. & Crane, F. L. The natural occurrence of coenzyme Q and related compounds. The
Journal of Biological Chemistry234, 2169-2175 (1959).
68 Collins, M. D. & Jones, D. Distribution of isoprenoid quinone structural types in bacteria and their
taxonomic implications. Microbiological Reviews45, 316-354 (1981).
69 Karp, G. C. Photosynthesis and the chloroplast in Cell and molecular biology: concepts and
experiments (ed Karp, G. C.) 211-254 (Wiley, 2013).
70 Nowicka, B. & Kruk, J. Occurrence, biosynthesis and function of isoprenoid quinones. Biochimica et
Biophysica Acta1797, 1587-1605 (2010).
71 Green, J., Edwin, E. E., Diplock, A. T. & McHale, D. The conversion of ubiquinone to ubichromenol.
Biochemical and Biophysical Research Communications2, 269-271 (1960).
72 Dunphy, P. J. & Brodie, A. F. The structure and function of quinones in respiratory metabolism.
Methods in Enzymology18, 407-461 (1971).
73 Solomon, D. et al. Micro- and nano-environments of C sequestration in soil: A multi-elemental
STXM–NEXAFS assessment of black C and organomineral associations. Science of The Total
Environment438, 372-388 (2012).
Figures
Page 20/26Figure 1
C K-edge NEXAFS spectra for humic substances extracted from clay fractions of a soil from Wushwush,
Ethiopia, and the spectra deconvolution showing the transitions (multiple peaks) of various carbon
functional groups (redrawn from Solomon, et al. 33, p. 110, with permission from the Alliance of Crop,
Soil, and Environmental Science Societies, publishers of Soil Science Society of America Journal) [CCC
license number 3736690498274].
Page 21/26Figure 2
Map of central North Island, New Zealand, showing the locations of the four study sites in the Taupo-
Rotorua region. The inset map shows the distribution of Andisols, mainly Udands (equivalent to
Allophanic Soils in Hewitt 43) and Vitrands (Pumice Soils in Hewitt 43), and the location of Taupo
Volcanic Zone (TVZ) encompassing the volcanoes that erupted parent tephras for the soils and paleosols
under study16,17,24. State highways are numbered (red shields).
Page 22/26Figure 3
Photos of soil pro les showing soil horizons and their notation, and the stratigraphy and names and ages
of parent tephras (derived using tephrochronology) at Tapapa, Lake Rotoaira, Brett Rd, and Ashton
Dairies Pit (Fig. 2). The su x ‘b’ is used to denote an identi able soil horizon with pedogenic features
developed before its burial. More details are given in Table 1 and SM section 1. Abbreviations: Rr, Rotorua
tephra; Rk, Rerewhakaaitu tephra; Ok, Okareka tephra; Te, Te Rere tephra; BP, before present. For almost all
of the Holocene, the soils carried a similar forest cover, namely podocarp-broadleaf forest (currently
extant at the Lake Rotoaira site), which was temporarily interupted by the deposition of thick tephra at
Brett Rd and Ashton Dairies from time to time. Scale divisions on tape = 10 cm. Photos: D.J. Lowe.
Page 23/26Figure 4
(Left) A 2D micrograph of a natural allophane-dominated microaggregate (extracted from the Bw1
horizon of the soil at Tapapa) obtained using TXM. Dark shadow represents the absorption of 1.84 keV
(silicon K-edge) and thus the structure/shape of silicate-based clay, and the white areas are silicate-free
pores. (Right) A 3D virtual reconstruction of the microaggregate obtained from 3D tomography datasets,
showing its high porosity and high degree of pore network tortuosity (see Huang et al. 41). The scale is
the same for the two images, but the images (stills) show the microaggregate from different azimuth
angles. Video views of the 2D image and the coloured 3D reconstruction are available as supporting
materials.
Page 24/26Figure 5
C NEXAFS spectra for organo-clays in allophanic paleosols. (A) Clays extracted from the Bw1 horizon
(20−30 cm depth) and from the Bw2 horizon (30−40 cm depth) above Rotorua (Rr) tephra at Tapapa. (B)
Clays extracted from the ve soil subhorizons denoted 3Ahb and 3ACb (representing ca 1082 yr of soil
formation), and 4Ahb, 4ABb1, and 4ABb2 (representing up to ca 8400 yr of soil formation) at Lake
Rotoaira. (C) Clays extracted from upper allophanic soil horizons on Taupo tephra (representing ca 1082
Page 25/26yr of soil formation), Whakatane tephra (representing ca 3808 yr of soil formation), and Rotoma tephra
(representing ca 3897 yr of soil formation) at Brett Rd and Ashton Dairies Pit. Spectral features identi ed
by the vertical lines correspond to carbon in (a) quinonic, (b) aromatic, (c) aliphatic, (d)
carboxylic/carbonyl, and (e) carbonyl/carbonate functional groups (Fig. 1). Note there were cartographic
shifts of spectra in both A and B graphs to show each spectrum clearly, but no shift in graph C in order to
observe the difference of intensity of X-ray absorbance between samples collected from the two near-
adjacent sites. The small insets show the full spectra including pre-edge and post-edge regions to
indicate proper spectrum normalization.
Supplementary Files
This is a list of supplementary les associated with this preprint. Click to download.
Huangetal.supplementary le.docx
Huangetal.supplementary levideoviewof2Dtomographicimagesofanallophanicmicroaggregate.mov
Huangetal.supplementary levideoviewof3Dreconstructionofanallophanicmicroaggregate.mov
Huangetal.supplementary le.docx
Huangetal.supplementary levideoviewof2Dtomographicimagesofanallophanicmicroaggregate.mov
Huangetal.supplementary levideoviewof3Dreconstructionofanallophanicmicroaggregate.mov
Page 26/26You can also read