A revised pan-Arctic permafrost soil Hg pool based on Western Siberian peat Hg and carbon observations
←
→
Page content transcription
If your browser does not render page correctly, please read the page content below
Biogeosciences, 17, 3083–3097, 2020
https://doi.org/10.5194/bg-17-3083-2020
© Author(s) 2020. This work is distributed under
the Creative Commons Attribution 4.0 License.

A revised pan-Arctic permafrost soil Hg pool based on Western
Siberian peat Hg and carbon observations
Artem G. Lim1 , Martin Jiskra2 , Jeroen E. Sonke3 , Sergey V. Loiko1 , Natalia Kosykh4 , and Oleg S. Pokrovsky3,5
1 BIO-GEO-CLIM    Laboratory, Tomsk State University, Tomsk, Russia
2 Universityof Basel, Environmental Geosciences, Bernoullistrasse 30, 4056 Basel, Switzerland
3 Geosciences and Environment Toulouse, UMR 5563 CNRS, 14 Avenue Edouard Belin, 31400 Toulouse, France
4 Lab Biogeocenol, Institute of Soil Science and Agrochemistry, Russian Academy of Sciences,

Siberian Branch, Novosibirsk, Russia
5 N. Laverov Federal Center for Integrated Arctic Research, Russian Academy of Sciences, Arkhangelsk, Russia

Correspondence: Oleg S. Pokrovsky (oleg.pokrovsky@get.omp.eu)

Received: 8 December 2019 – Discussion started: 28 January 2020
Revised: 29 April 2020 – Accepted: 19 May 2020 – Published: 18 June 2020

Abstract. Natural and anthropogenic mercury (Hg) emis-          the same RHgC approach, we revise the upper 30 cm of the
sions are sequestered in terrestrial soils over short, annual   global soil Hg pool to contain 1086 Gg of Hg (852–1265 Gg,
to long, millennial timescales before Hg mobilization and       IQR), of which 7 % (72 Gg) resides in northern permafrost
run-off impact wetland and coastal ocean ecosystems. Re-        soils. Additional soil and river studies in eastern and north-
cent studies have used Hg-to-carbon (C) ratios (RHgC ’s) mea-   ern Siberia are needed to lower the uncertainty on these esti-
sured in Alaskan permafrost mineral and peat soils together     mates and assess the timing of Hg release to the atmosphere
with a northern circumpolar permafrost soil carbon inventory    and rivers.
to estimate that these soils contain large amounts of Hg (be-
tween 184 and 755 Gg) in the upper 1 m. However, measure-
ments of RHgC on Siberian permafrost peatlands are largely
missing, leaving the size of the estimated northern soil Hg     1   Introduction
budget and its fate under Arctic warming scenarios uncer-
tain. Here we present Hg and carbon data for six peat cores     High-latitude organic-rich soils are key ecosystems control-
down to mineral horizons at 1.5–4 m depth, across a 1700 km     ling the transfer of carbon, nutrients, and pollutants be-
latitudinal (56 to 67◦ N) permafrost gradient in the Western    tween the atmosphere, rivers, lakes, and the Arctic Ocean.
Siberian Lowland (WSL). Mercury concentrations increase         These soils are most vulnerable to ongoing climate change
from south to north in all soil horizons, reflecting a higher   due to the high-potential mobility of carbon stored in the
stability of sequestered Hg with respect to re-emission. The    form of peat deposits. Part of the peat layers is currently
RHgC in the WSL peat horizons decreases with depth, from        frozen but may be subjected to fast thawing, especially in
0.38 Gg Pg−1 in the active layer to 0.23 Gg Pg−1 in continu-    discontinuous- and sporadic-permafrost zones (Romanovsky
ously frozen peat of the WSL. We estimate the Hg pool (0–       et al., 2010). While the stock of C in Arctic and sub-Arctic
1 m) in the permafrost-affected part of the WSL peatlands to    peat and mineral soils is fairly well quantified (472 Pg C;
be 9.3 ± 2.7 Gg. We review and estimate pan-Arctic organic      95 % confidence interval, CI, of ±27 Pg) in the upper 0–1 m
and mineral soil RHgC to be 0.19 and 0.63 Gg Pg−1 , respec-     (Hugelius et al., 2014), this is not true for pollutants such as
tively, and use a soil carbon budget to revise the pan-Arctic   mercury (Hg). Because of its strong bioamplification in Arc-
permafrost soil Hg pool to be 72 Gg (39–91 Gg; interquartile    tic marine biota (Morel et al., 1998) and exposure to native
range, IQR) in the upper 30 cm, 240 Gg (110–336 Gg) in the      Arctic populations (AMAP, 2011), there is a strong interest
upper 1 m, and 597 Gg (384–750 Gg) in the upper 3 m. Using      in understanding Hg biogeochemistry in Arctic environments
                                                                (Outridge et al., 2008; Steffen et al., 2008; Stern et al., 2012).

Published by Copernicus Publications on behalf of the European Geosciences Union.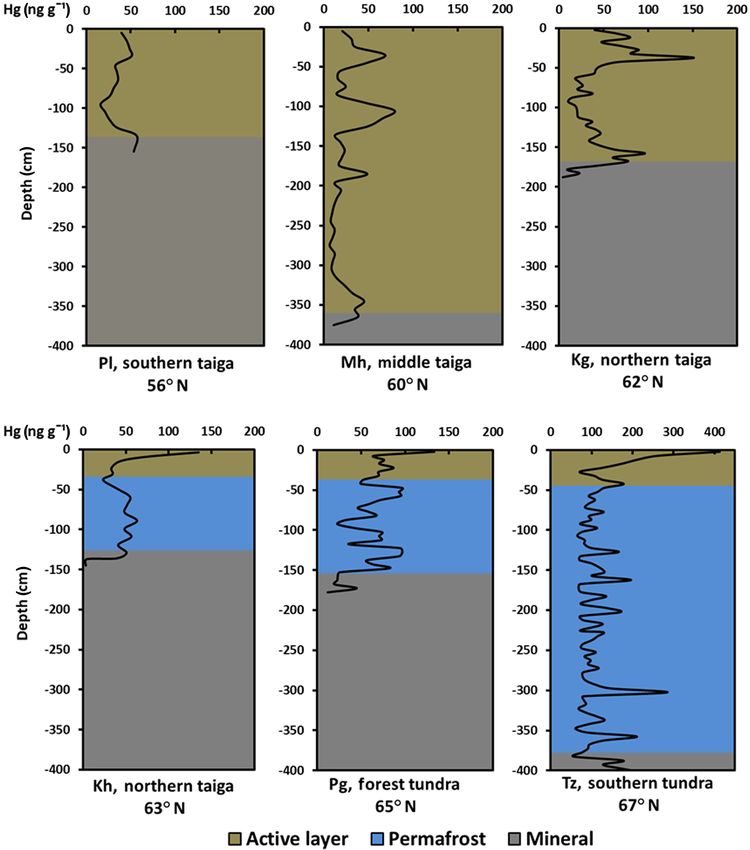
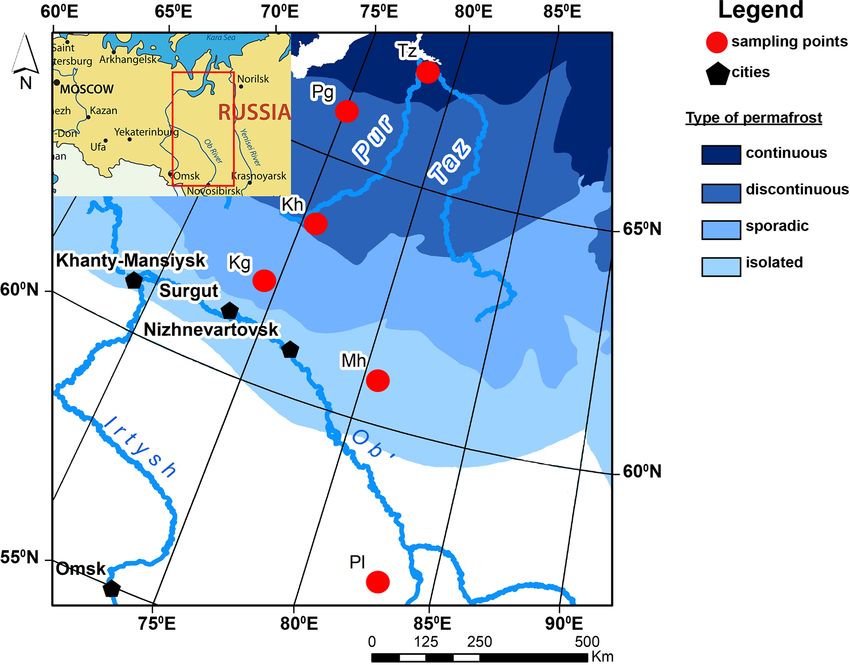
3084                                                             A. G. Lim et al.: A revised pan-Arctic permafrost soil Hg pool

   Recent advances in quantifying Arctic Hg cycling show              ing the respective RHgC by the same C pool estimates for the
that Arctic HgII wet deposition is generally low (Pearson             northern circumpolar permafrost region, covering an area of
et al., 2019) and that the vegetation Hg pump drives year-            17.8 × 10⁶ km2 (Hugelius et al., 2014).
long net gaseous Hg0 (and CO2 ) deposition via foliar uptake             Direct measurements of soil Hg and carbon profiles in
to Arctic vegetation and litterfall to soils (Obrist et al., 2017;    frozen peatlands of Siberia are needed to address these vari-
Jiskra et al., 2018, 2019). Soil core analyses in Alaska indi-        able RHgC and Hg pool estimates of pan-Arctic permafrost
cate that large amounts of carbon and Hg have accumulated             soils. This constitutes the first and main objective of the
since the last glacial maximum (Olson et al., 2018; Schuster          present study. The second objective was to assess the impact
et al., 2018). Two upscaling approaches reported differing es-        of permafrost type (absent, sporadic, discontinuous, and con-
timates for the 0 to 1 m soil pool of the northern circumpolar        tinuous) on Hg concentrations and pools in the active layer,
permafrost region of 184 Gg (Olson et al., 2018) and 755 Gg           frozen peat, and mineral horizons. The third objective was to
(Schuster et al., 2018).                                              relate Hg concentration in peat to that of other trace metals in
   Despite the overall net atmospheric Hg deposition to soils,        order to reveal possible mechanisms of Hg and other metal
research has found that Arctic rivers export 37 to 44 Mg yr−1         pollutant accumulation within the organic and mineral hori-
of soil Hg, bound to particulate and dissolved organic mat-           zons of frozen peatlands. Finally, we revisit the world soil
ter, to the Arctic Ocean (Fisher et al., 2012; Dastoor et al.,        Hg inventory in order to put the pan-Arctic permafrost soil
2014; Zhang et al., 2015; Sonke et al., 2018; Zolkos et al.,          Hg pool into a global perspective.
2020). Together with coastal erosion of soils (30 Mg yr−1 ),
river Hg inputs constitute a terrestrial Hg flux of 74 Mg yr−1
to the Arctic Ocean that is of similar magnitude to gross             2     Study site and methods
atmospheric deposition (80 Mg yr−1 ) over the Arctic Ocean
(Sonke et al., 2018). Permafrost thawing has been shown to            2.1    Sampling sites
enhance river Hg export from soils to rivers (St. Pierre et al.,
2019). It is most pronounced in the discontinuous-permafrost          Soil sampling was performed along a latitudinal transect
zone due to thawing of fresh soil organic matter and max-             of the Western Siberia Lowland (WSL) that comprised
imal active layer depth and has been suggested to poten-              the southern taiga (Plotnikovo, 56◦ N), the middle taiga
tially double over the next 50 years (Lim et al., 2019). The          (Mukhrino, 60◦ N), the northern part of the taiga zone (Koga-
quantity of atmospheric Hg deposition to northern peat soils          lym, 62◦ N), forest tundra (Khanymey, 62◦ N; and Pangody,
that is presently re-emitted to the atmosphere is not well un-        65◦ N), and tundra (Tazovsky, 67◦ N) biomes (Fig. 1). In the
derstood. Hg exchange studies indicate temporally limited             WSL, the permafrost zones follow the temperature and veg-
Hg0 emission from the Alaskan permafrost tundra at 68◦ N              etation distribution over the latitude at otherwise similar re-
(Obrist et al., 2017) and year-round net Hg0 emission from            lief, lithology, and runoff, thus allowing us to test the effect
Scandinavian peat at 64◦ N (Osterwalder et al., 2018). Other          of permafrost by analyzing latitudinal features of Hg distri-
studies provide evidence for vegetation type (Rydberg et al.,         bution in soils. Key physicogeographical parameters of stud-
2010) and temperature and insolation control (Fahnestock              ied sites and soil types are listed in Table S1 in the Supple-
et al., 2019) on net Hg0 deposition or emission.                      ment. The WSL peat actively formed since the beginning of
   All available data of Hg in permafrost soils originate from        the Holocene until freezing of bogs in the Subboreal period
North America or Scandinavia (Jensen et al., 1991; Bailey             (11–4.5 kyr; Kremenetski et al., 2003; Panova et al., 2010;
et al., 2002; Talbot et al., 2017; Schuster et al., 2018; Olson       Ponomareva et al., 2012; Loiko et al., 2019). For 4.5 kyr, the
et al., 2018). Except for in three studies (Golovatskaya et al.,      rate of peat formation and bog extension in the permafrost-
2009; Lyapina et al., 2009; Vasilevich, 2018), we did not find        affected part of the WSL has been decreasing. In the south-
extensive measurements of Hg in peat profiles from boreal             ern part of the cryolithozone and permafrost-free part of the
and permafrost regions of the Russian Arctic and Siberia. Re-         WSL, peat accumulation and bog extension remained active
cent work has used a soil carbon model to estimate the size of        over the entire Holocene (Kurina and Veretennikova, 2015;
the northern permafrost soil Hg inventory to be 755±427 Gg            Preis and Karpenko, 2015; Kurina et al., 2018). The main
(95 % CI) in the upper 1 m (Schuster et al., 2018). However,          mineral substrates underlying frozen peat layers of the WSL
this estimate is based on extrapolation of high Hg-to-organic-        are quaternary clays, sands, and alevrolites. In the southern
carbon (C) ratios (RHgC ’s) of 1.6 Gg Hg per petagram of              part (Plotnikovo and Mukhrino sites), the typical substrate
C (Gg Pg−1 ) in Alaskan mineral soils to the entire North             is carbonate-bearing clays of lake alluvium origin with rare
American and Eurasian permafrost zone. Another study used             layers of sandstones (Table S1).
lower RHgC ’s of 0.12 to 0.62 Gg Pg−1 derived from observa-              Mean annual ambient temperature (MAAT) decreases
tions of both Alaskan organic and mineral soils and literature        from south to north, being equal to −0.4, −1.2, −4.0,
data, to estimate a lower northern soil 0–1 m Hg inventory            −5.6, −6.4, and −9.1 ◦ C at Plotnikovo, Mukhrino, Koga-
of 184 Gg (136–274 Gg, 37.5–62.5 percentiles; Olson et al.,           lym, Khanymey, Pandogy, and Tazovsky, respectively (Trofi-
2018). Both studies provide the Hg inventory by multiply-             mova and Balybina, 2014). The permafrost is absent in Plot-

Biogeosciences, 17, 3083–3097, 2020                                                      https://doi.org/10.5194/bg-17-3083-2020
A. G. Lim et al.: A revised pan-Arctic permafrost soil Hg pool                                                                  3085

Figure 1. Sampling sites and permafrost boundaries (modified after Brown et al., 2001) of WSL territory investigated in this work. The
climate and soil parameters of six sampling sites – Tazovsky (Tz), Pangody (Pg), Khanymey (Kh), Kogalym (Kg), Mukhrino (Mh), and
Plotnikovo (Pl) – are listed in Supplement Table S1.

nikovo but present at all other sites, and it ranges from relict     2.2   Sampling procedure, analyses, and data treatment
to isolated (Mukhrino) and isolated to sporadic (Kogalym) in
the south to discontinuous (Khanymey, Pangody) and con-              Peat core samples were collected in August, when the depth
tinuous (Tazovsky) in the north. At permafrost-affected sites,       of the unfrozen layer was at its maximum (see Raudina et al.,
the average active-layer thickness (ALT) at the time of sam-         2017). Based on measurements by temperature loggers over
pling of peat mounds (hummocks) ranged from 90 cm in                 the summer period, the in situ temperature of the studied soil
the south to 45 cm in the north. The peat mounds of om-              profile ranged from 15 ± 5 ◦ C in the top soil (0–20 cm) to
brotrophic bogs probed in this work are present across the           4 ± 2 ◦ C at the permafrost boundary (40–80 cm). Field logis-
full latitudinal gradient.                                           tics and financial resources did not make it possible to study
   The vegetation of three studied types of bogs (polygo-            multiple cores from each climate zone. The physical, chem-
nal, flat-mound, and ridge-hollow) is essentially oligotrophic       ical, and botanical properties of several peat cores collected
(poor in nutrients) which indicates the ombrotrophic (rain-          in the homogeneous palsa region in the north and ridge–ryam
and snow-water-fed) conditions, i.e., the lack of groundwater        complex in the south are highly similar among different peat
input and lateral surface influx of nutrients. The flat-mound        mounds, suggesting that the cores we obtained are represen-
palsa is covered by dwarf shrubs (Ledum decumbens, Betula            tative for the WSL (Velichko et al., 2011; Stepanova et al.,
nana, Andromeda polifolia, Vaccinium ssp., Empetrum ni-              2015).
grum), lichens (Cladonia ssp., Cetraria, Ochrolechia), and              Peat cores were extracted using a Russian sediment–peat
mosses (Dicranum ssp., Polytrichum ssp., Sphagnum an-                corer, and the frozen part was sampled using a motorized
gustifolium, S. lenense). At southern sites, the pine Pinus          Russian peat corer (UKB-12/25 I, Russia) with a 4 cm diame-
sylvestris is abundant on ridges (Peregon et al., 2008, 2009),       ter corer sterilized with 40 % ethanol prior to each extraction.
whereas the two taiga sites are dominated by Pinus sylvestris,       We collected the full active (unfrozen) layer of the peat col-
with minor but permanently present Betula pubescens and              umn, the frozen peat column and some 10 to 30 cm of frozen
Pinus sibirica. Dwarf shrubs are dominated by Ledum palus-           mineral horizons using clean powder-free vinyl gloves. Peat
tre, Chamaedaphne calyculata, and Vaccinium vitis-idaea.             or mineral soil samples were divided in 5–10 cm segments
The moss layer is dominated by S. fuscum, S. angustifolium,          using a sharp sterile single-use plastic knife. Soil samples
with the presence of S. magellanicum, S. capillifolium, and          were placed in sterile, doubled-zipped PVC bags and kept
boreal forest moss species like Pleurozium schreberi.                at −20 ◦ C during transport and storage. To avoid contami-

https://doi.org/10.5194/bg-17-3083-2020                                                      Biogeosciences, 17, 3083–3097, 2020
3086 A. G. Lim et al.: A revised pan-Arctic permafrost soil Hg pool
nation of peat from external surroundings, we separated the ing normal distribution and the uncertainties of RHgC assum-
part of the core for geochemical analysis exclusively from ing log-normal distribution.
the interior of the core (> 1 cm from the core liner) follow-
ing conventional procedures (Wilhelm et al., 2011).
Total Hg concentration (THg) in freeze-dried and ground 3 Results
slices of peat cores was determined using a direct mer-
3.1 Depth (vertical) distribution of Hg in WSL peat
cury analyzer (DMA-80, Milestone, Italy). Analysis of ref-
profiles
erence material BCR-482 (lichen, 480 ± 28 ng g−1 ), MESS-
3 (sediment, 91 ± 9 ng g−1 ), and NIST SRM 1632d (coal, Hg concentration in peat cores of the WSL are illustrated
93 ± 3 ng g−1 ) showed good reproducibility (mean ± 1σ ) of in Fig. 2, and primary data on soil chemical composition
467 ± 28, 80 ± 6 and 98 ± 8 ng g−1 , respectively. The average and Hg concentration are listed in Table S2 of the Supple-
uncertainty of duplicate sample analysis did not exceed 5 % ment. The upper 0–20 cm layer is 2 to 3 times more enriched
(1σ ). The carbon (C) and nitrogen (N) concentrations were with Hg compared to the rest of the peat core in permafrost-
measured using catalytic combustion, with Cu–O at 900 ◦ C affected sites (Khanymey, Pangody, and Tazovsky). This is
and an uncertainty of ≤ 0.5 %, using a Thermo Flash 2000 not the case, however, for the sporadic-permafrost zone (Ko-
CN analyzer, aspartic acid (C 36.1 % ± 1.5 %; N 10.5 % ± galym) and isolated-permafrost zone (Mukhrino), where a lo-
0.5 %), and soil reference material (C 2.29 % ± 0.07 %; N cal maximum at ca. 35 cm depth was detected, but no en-
0.21 %±0.01 %) as standards. Analyses of total C before and richment of the upper 10–20 cm horizons occurred. In the
after sample treatment with HCl did not yield more than 1 % permafrost-free site of the WSL (Plotnikovo, southern taiga),
of inorganic C; therefore our total C determination represents the Hg concentration profile in the peat was fairly constant,
organic carbon. For trace- and major-element analysis, soil with a local minimum at 100 cm depth. The mean depth-
samples were subjected to full acid digestion in the clean integrated Hg concentrations in active-layer, permafrost, and
room following ICP-MS (inductively coupled plasma mass mineral horizons are illustrated in Fig. 3 and summarized in
spectrometry; Agilent 7500 ce) analyses as described previ- Table 1. The latitudinal trend of Hg concentration in peat
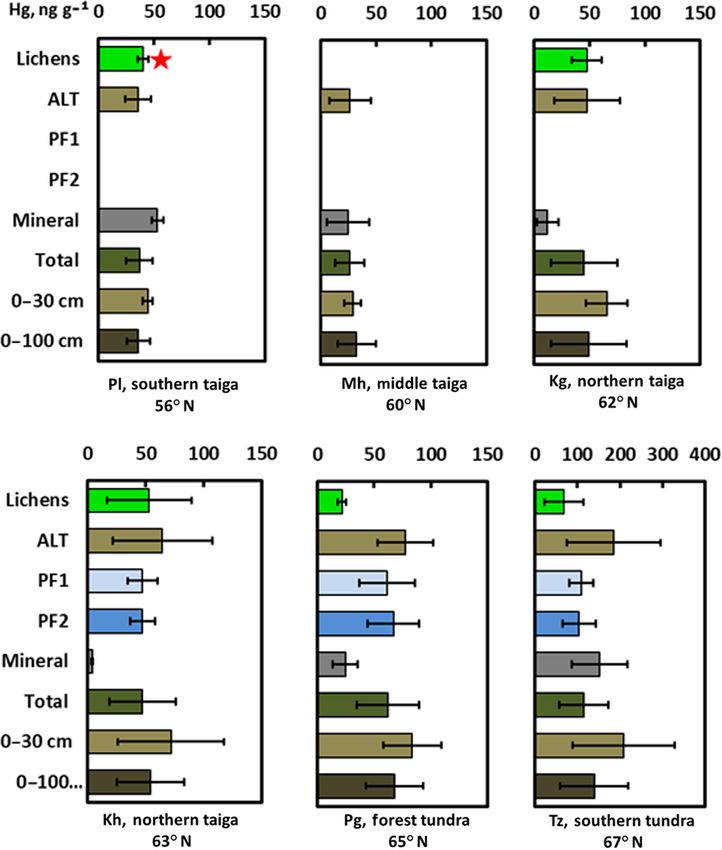
ously (Morgalev et al., 2017). consists of a systematic increase northward, both in per-
The Shapiro Wilk normality test was used to assess THg, mafrost and active peat layers. The dominant ground vege-
elemental and RHgC distributions, and statistical data de- tation (lichens) analyzed at five sites out of six (Plotnikovo,
scriptors adjusted accordingly. All statistical tests used a sig- Kogalym, Khanymey, Pangody and Tazovsky) did not show
nificance level of 95 % (α = 0.05). Spearman rank order cor- significantly different (Mann–Whitney U test) Hg concentra-
relations (significant at p < 0.05) were performed to charac- tions relative to the peat cores (Fig. 3). Mercury concentra-
terize the link of Hg with C, N, and other major and trace tions in the six WSL peat cores ranged from 7 to 284 ng g−1 ,
elements. The differences in Hg concentration between the with a median (± IQR) of 67 ± 57 ng g−1 . The Hg concen-
active and frozen peat layer were tested using the Mann– tration in the thawed, active layer was generally comparable
Whitney U test for paired data at a significance level of 0.05. to that in the frozen layer, supported by a Mann–Whitney
C pools of different soil classes reported by Hugelius test, which did not show a significant difference in Hg con-
et al. (2014) were divided into two categories: organic and centration between frozen and thawed peat in all permafrost-
mineral soils. Histosols and Histels were defined as or- affected sites. Within the latitudinal transect from south to
ganic soils. Turbels and Orthels were considered as organic north, the Hg concentrations in peat are higher (Plotnikovo,
soils for the 0–0.3 m interval and as mineral soils for the Kogalym, Khanymey, Pangody) or comparable (Tazovsky) to
0.3–3 m interval. All other soils were considered as min- those in the mineral horizons.
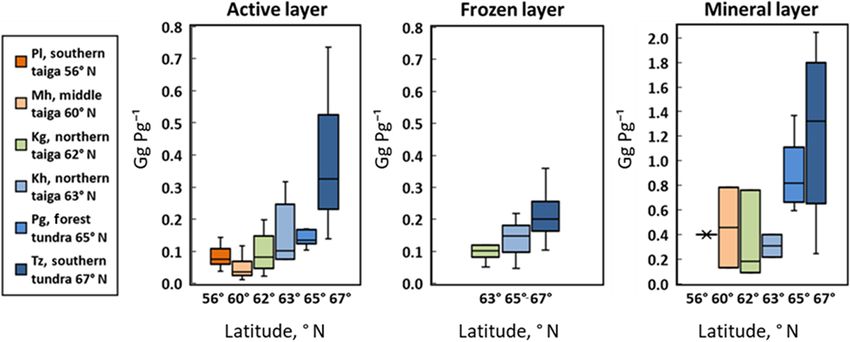
eral soils. To estimate the pan-Arctic permafrost soil Hg The ratio of Hg : C (RHgC , µg g−1 , corresponding to
pool, C pools were multiplied by the respective RHgC de- Gg Pg−1 ) ranged between 0.05 and 2.0 over the peat columns
rived for organic (> 20 % C) and mineral (< 20 % C) soil and was 5 to 10 times higher in mineral horizons compared
data from Eurasia and North America (excluding Alaska). To to frozen peat and active layers (Fig. 4). The RHgC in the ac-
calculate the global Hg pool, a simpler approach was used, tive layer and in the mineral horizons increased 3-fold from
and one single RHgC was considered for five climate zones, the south (56◦ N) to the north (67◦ N). In the frozen peat hori-
which were defined by latitude (Arctic: > 67◦ N; boreal: 50– zon, the RHgC ratio increased 2-fold from the sporadic- and
67◦ N; temperate: 35–50◦ N; subtropical: 23.45–35◦ N; trop- isolated- to the continuous-permafrost zone.
ical: < 23.45◦ N) according to FAO and ITPS (2018). The
uncertainty was assessed with a Monte Carlo approach us- 3.2 Regional and total pools of Hg in the WSL peat and
ing the rnorm and rlnorm functions of R (version 3.6.1.) and mineral layers
is reported as the interquartile range (IQR; 25th and 75th
percentile) of 100 000 simulations. For the pan-Arctic per- The mass of Hg per area of soil in the active and frozen
mafrost soil Hg pool, final uncertainties incorporate the un- peat layer as well as in the top 30 cm of frozen mineral hori-
certainties of the C stock from Hugelius et al. (2014) assum- zons of the six studied WSL peat profiles was calculated by
Biogeosciences, 17, 3083–3097, 2020 https://doi.org/10.5194/bg-17-3083-2020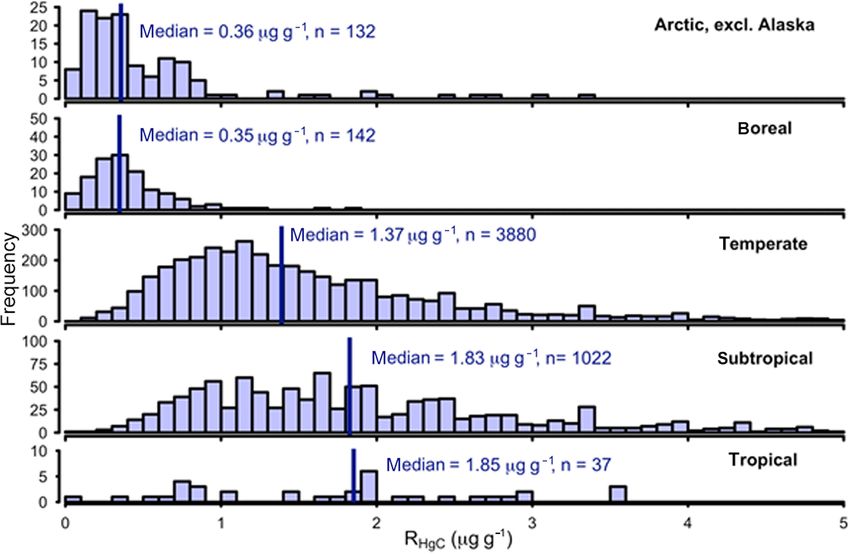
A. G. Lim et al.: A revised pan-Arctic permafrost soil Hg pool                                                                                        3087

Table 1. Mean (±SD) concentrations and stocks of C and Hg in six studied sites in the Western Siberian Lowland (WSL) peat bogs.

                    Horizons                             C, %       Hg, ng g−1        kg C m−2         mg Hg m−2          RHgC (Gg Pg−1 )
                    Plotnikovo (Pl), southern taiga, 56.9◦ N∗
                    ALT (0–140 cm)                     45 ± 2           36 ± 12                 24                2.8            0.08 ± 0.03
                    Mineral (140–150 cm)                   13                53                 23                9.0                   0.40
                    Total (150 cm)                     43 ± 8           37 ± 12                 47               11.8            0.10 ± 0.09
                    0–30 cm                            44 ± 2            44 ± 5                  3                0.3            0.10 ± 0.01
                    0–100 cm                           45 ± 2           36 ± 10                  9                0.8            0.08 ± 0.02
                    Mukhrino (Mh), middle taiga, 60.9◦ N∗
                    ALT (0–360 cm)                     53 ± 7           26 ± 13                67                 4.3            0.05 ± 0.03
                    Mineral (360–380 cm)              15 ± 19           24 ± 19                51                 8.3            0.46 ± 0.46
                    Total (380 cm)                   51 ± 10            26 ± 19               118                12.6            0.07 ± 0.12
                    0–30 cm                          50 ± 0.4            29 ± 7                 4                 0.3            0.06 ± 0.02
                    0–100 cm                           52 ± 5           32 ± 17                18                 1.3            0.06 ± 0.04
                    Kogalym (Kg), northern taiga, 62.3◦ N∗
                    ALT (0–175 cm)                    48 ± 4            48 ± 30                93                 8.7            0.10 ± 0.06
                    Mineral (175–190 cm)             10 ± 13            12 ± 10                17                 2.3            0.34 ± 0.36
                    Total (190 cm)                   45 ± 12            45 ± 30               110                  11            0.12 ± 0.12
                    0–30 cm                           45 ± 1            65 ± 19                 3                 0.5            0.14 ± 0.04
                    0–100 cm                          47 ± 2            49 ± 34                38                   3            0.11 ± 0.07
                    Khanymey (Kh), northern taiga, 63.8◦ N
                    ALT (0–34 cm)                     44 ± 2            64 ± 43                17                 2.1            0.15 ± 0.10
                    PF1 (34–100 cm)                   50 ± 2            47 ± 13                78                 7.6            0.09 ± 0.02
                    PF2 (34–138 cm)                   48 ± 6            47 ± 11               119                11.8            0.10 ± 0.02
                    Mineral (138–147 cm)               1±1                4±1                   2                 0.5            0.31 ± 0.13
                    Total (147 cm)                   42 ± 16            47 ± 28               138                14.4            0.13 ± 0.09
                    0–30 cm                           43 ± 1            71 ± 46                13                 1.8            0.17 ± 0.11
                    0–100 cm                          47 ± 4            54 ± 29                95                 9.6            0.12 ± 0.07
                    Pangody (Pg), forest tundra, 65.9◦ N
                    ALT (0–40 cm)                     50 ± 4            78 ± 25                38                 5.3            0.16 ± 0.07
                    PF1 (40–100 cm)                   53 ± 4            61 ± 25                54                 6.6            0.11 ± 0.04
                    PF2 (40–155 cm)                  48 ± 10            67 ± 23                78                11.0            0.15 ± 0.07
                    Mineral (155–185 cm)               3±1              24 ± 11                15                12.5            0.88 ± 0.28
                    Total (185 cm)                   41 ± 19            62 ± 28               130                28.8            0.27 ± 0.30
                    0–30 cm                           50 ± 5            83 ± 26                26                 4.0            0.17 ± 0.07
                    0–100 cm                          52 ± 4            68 ± 25                92                11.9            0.13 ± 0.06
                    Tazovsky (Tz), southern tundra, 67.4◦ N
                    ALT (0–40 cm)                      49 ± 3        186 ± 110                 22                7.4             0.38 ± 0.20
                    PF1 (40–100 cm)                    46 ± 3         109 ± 28                 27                6.3             0.23 ± 0.06
                    PF2 (40–380 cm)                    47 ± 4         104 ± 39                156               35.0             0.22 ± 0.08
                    Mineral (380–405 cm)               14 ± 5         152 ± 65                 60               64.7             1.24 ± 0.66
                    Total (405 cm)                     45 ± 9         115 ± 57                238              107.0             0.30 ± 0.31
                    0–30 cm                            49 ± 4        209 ± 120                 16                6.0             0.42 ± 0.21
                    0–100 cm                           47 ± 3         140 ± 80                 48               13.7             0.29 ± 0.15
                  ALT is active-layer thickness; PF1 is frozen peat (ALT − 100 cm); PF2 is frozen peat (ALT to mineral layer); “mineral” is mineral
                  layer; “total” is total Hg content averaged over full sampled depth. ∗ In the permafrost-free zone, the ALT extends from the
                  surface to the mineral layer.

https://doi.org/10.5194/bg-17-3083-2020                                                                              Biogeosciences, 17, 3083–3097, 2020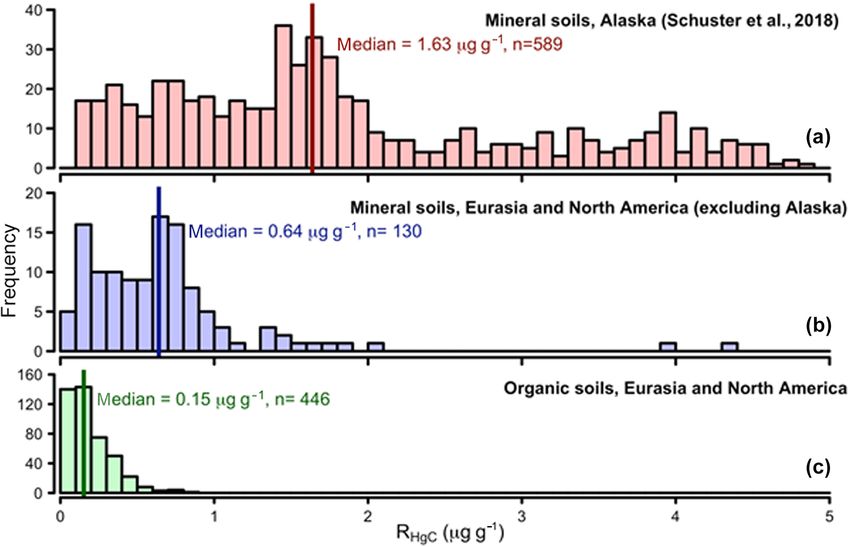
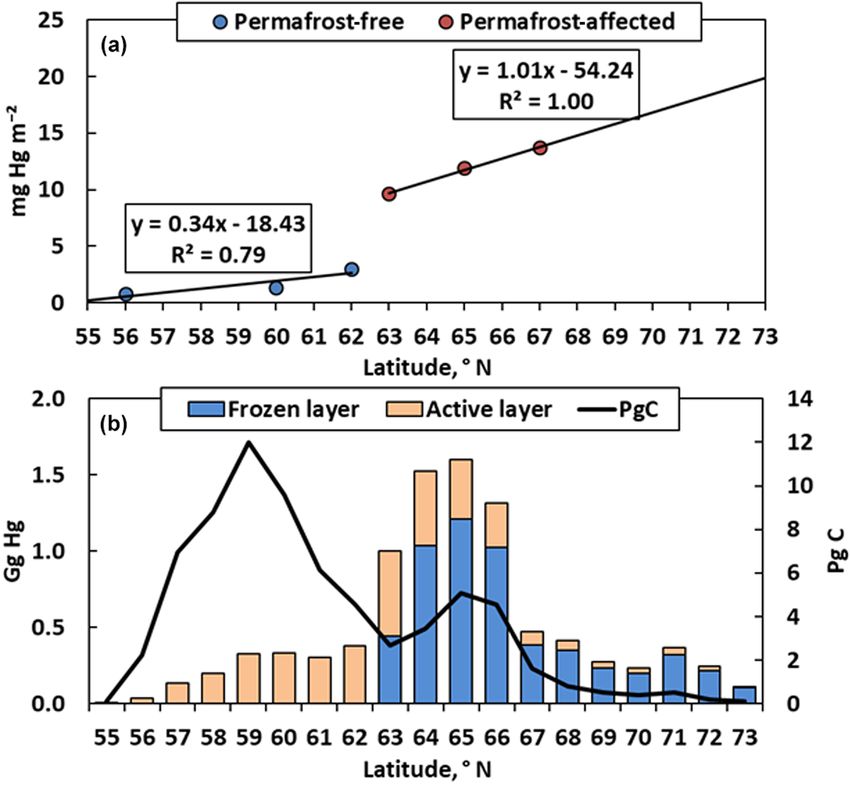
3088                                                                 A. G. Lim et al.: A revised pan-Arctic permafrost soil Hg pool

Figure 2. Vertical-depth profile distribution of total Hg (THg) in six peat cores across a 1700 km latitudinal transect of the WSL. Site location
and physiogeographical parameters are shown in Fig. 1 and Table S1.

multiplying bulk soil peat and mineral layer densities (rang-              mafrost and permafrost-free zones (Fig. 7a), extrapolated to
ing from 0.01 to 0.38 g cm−3 ; Table S2) by Hg concentra-                  the full average thickness of peat in the WSL (280 cm; Sheng
tion and integrating over the corresponding depths. The dif-               et al., 2004) and assuming that Hg concentration in the upper
ference between surface-area-normalized Hg stock system-                   0–100 cm peat layer is the same as in 100–280 cm of peat.
atically increased from south to north (ca. 0.3 to 6.0 and                 We then multiplied this Hg concentration in the upper 0–
ca. 0.8 to 13.7 mg Hg m−2 , in the 0–30 and the 0–100 cm                   100 cm peat layer by the area of the bogs in each latitudi-
peat layer, respectively; Fig. 5a). This northward increase                nal grid (◦ S, m2 ) as shown in Fig. 7b. This yields 1.7 Gg Hg
was most pronounced for the active layer, less evident for                 in the permafrost-free zone and 7.6 Gg Hg in the permafrost-
frozen peat, and insignificant for the upper 30 cm of min-                 bearing zone, with a total Hg pool of 9.3 Gg in the WSL. For
eral horizon located under the peat (Fig. 5b). Taking into ac-             this calculation we did not take into account the mineral hori-
count the proportion of bogs (peatlands) in each zone (1◦                  zons, and we used variable active-layer thickness across the
latitudinal grid) from Sheng et al. (2004), we calculated the              latitudinal gradient of the WSL, as estimated at our sampling
pool of Hg in permafrost-free and permafrost-affected WSL                  sites (Table S1). The amount of Hg in the permafrost-bearing
peatlands (Fig. 6). The total pool of Hg in the 0–100 cm                   zone within the active (unfrozen) peat layer (0–160 cm in the
layer of peat bogs exhibits a maximum (356–580 Mg) in the                  south and 0–20 cm in the north) of the WSL is 2.0 Gg, and
discontinuous-permafrost zone.                                             that in the frozen (160–280 cm in the south and 20–280 cm
   We estimate the total organic soil Hg pool in the WSL                   in the north) layer is 5.6 Gg.
from the Hg stock (mg Hg m−2 over 0–100 cm depth) for per-

Biogeosciences, 17, 3083–3097, 2020                                                             https://doi.org/10.5194/bg-17-3083-2020
A. G. Lim et al.: A revised pan-Arctic permafrost soil Hg pool                                                                    3089

                                                                      (RSpearman > 0.70) positive correlations of Hg were observed
                                                                      with Li, Ca, Sr, P, N, Mn, Ni, Co, Cr, and Cd. A positive
                                                                      (RSpearman = 0.60) relationship between Hg and C was ob-
                                                                      served in mineral horizons, whereas no correlation was de-
                                                                      tected in both frozen and thawed peat. This is consistent with
                                                                      some studies of peat soil in Brazil (Roulet et al., 1998) and
                                                                      Arctic tundra soils (Olson et al., 2018). At the same time,
                                                                      there was a positive correlation of Hg with nitrogen (N) in the
                                                                      active layer, frozen peat, and mineral horizons (RSpearman =
                                                                      0.50, 0.47, and 0.75, respectively). Stronger and more stable
                                                                      correlation of Hg with N compared to C was also noted by
                                                                      Roulet (2000).

                                                                      4     Discussion

                                                                      4.1    Hg association with other elements in peat

                                                                      Stronger accumulation of Hg relative to C in mineral hori-
                                                                      zons in the north (Tazovsky, Fig. 4) may be linked to the
                                                                      clay nature of mineral layers (Roulet et al., 1998; Baptista-
                                                                      Salazar et al., 2017) in these regions (Table S1) but also to
                                                                      the presence of specific host phases of Hg (see examples
                                                                      of peat minerals in Rudmin et al., 2018). Dissolved oxygen
                                                                      measurements in soil porewaters at the Tazovsky site indicate
Figure 3. Mean (±SD) depth-integrated Hg concentrations in peat       that mineral Gleysols and peat Histosols, which often over-
columns and mineral layers of six studied sites. The red aster-       lay former lake sediments, are anoxic (Raudina et al., 2017;
isk represents the data from Lyapina et al. (2009). ALT is active-    Loiko et al., 2019). The Hg host phases in these soils are
layer thickness; PF1 is frozen peat (ALT − 100 cm); PF2 is frozen     therefore likely sulfide minerals. Indeed, known Hg carriers
peat (ALT to mineral layer); “mineral” is mineral layer; “total” is   in peat deposits are Fe and Zn sulfide minerals or organic-
total Hg content averaged over the full sampled depth. ∗ In the       bound sulfide functional groups (Smieja-Król et al., 2010;
permafrost-free zone, the ALT extends from the surface to the min-    Prietzel et al., 2009; Skyllberg et al., 2003, Bates et al., 1998;
eral layer.                                                           Steinmann and Shotyk, 1997).
                                                                         In the peat active layer, Hg was positively correlated with
                                                                      K, Rb, Cs, P, As, V, Cr, and Cu (Table S3). In the frozen part
   Alternatively, to calculate the total pool of Hg in WSL            of the peat core, Hg was positively correlated with Ca, N,
bogs, we used the RHgC inferred from our data across                  Mn, Sr, Mg, P (Table S3). Indeed, atmospheric particles in
the gradient of permafrost and biomes (Table 1). Taking               snow across the WSL exhibit strong enrichment in Mo, W,
into account the C pool in the WSL (70.2 Pg C of the 0–               As, Sb, Ni, Cu, Zn, Cd, Pb, Mg, Ca, and Na (Shevchenko et
280 cm depth layer; Sheng et al., 2004) and the median                al., 2017). The strong positive correlation of Hg with these
RHgC of 0.133 Gg Pg−1 in the WSL, we calculated Hg for                elements in peat soils of the WSL suggests a common at-
the full depth of the peat layer in each zone. This also gives        mospheric origin. Note, however, that the cited elements de-
9.3 Gg Hg for a total area of 592 440 km2 .                           posit with particles, rainfall, and snowfall, whereas atmo-
                                                                      spheric Hg transfer to peat occurs mainly via the vegetation
3.3   Correlation of Hg with other elements in the peat               pump, with tundra and taiga vegetation actively taking up at-
      cores                                                           mospheric gaseous Hg0 through foliage (Obrist et al., 2017;
                                                                      Jiskra et al., 2018).
Spearman rank order correlations RSpearman of Hg with
other elements demonstrated significant positive relation-            4.2    Estimating the pan-Arctic permafrost soil Hg pool
ships (RSpearman > 0.60; p < 0.05) with K, Rb, Cs, P, As,
W, V, Cr, and Cu in the active (unfrozen) layer (Table S3             A recent study used a median RHgC value of 1.6 Gg Pg−1 ,
of the Supplement). However, these relationships were less            observed mainly in mineral soil samples (median soil or-
pronounced in the frozen peat, where only Mg, Ca, Sr, Mn,             ganic carbon, SOC, of 3 %, IQR is 1.7 % to 8.7 %) along
N, P, As, Cu, Ni, Sb, and some rare earth elements (REEs)             a transect in Alaska, to estimate a pan-Arctic permafrost
demonstrated minor (0.40 < RSpearman < 0.55) positive cor-            soil Hg pool of 755 ± 427 Gg in the upper 0–100 cm and
relations with Hg. Finally, in the mineral layer, significant         1656 ± 962 Gg in the upper 0–300 cm, respectively (Schus-

https://doi.org/10.5194/bg-17-3083-2020                                                       Biogeosciences, 17, 3083–3097, 2020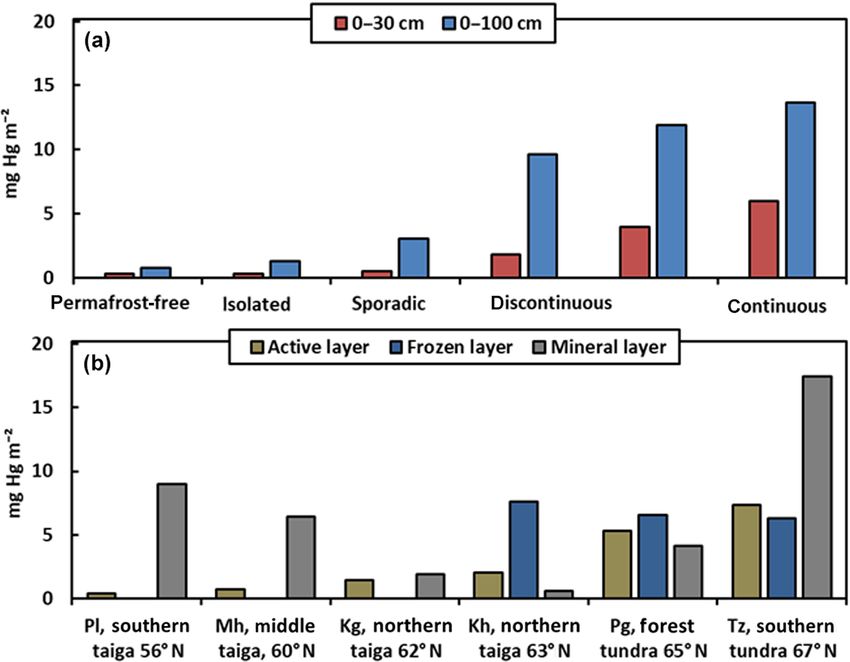
3090                                                                 A. G. Lim et al.: A revised pan-Arctic permafrost soil Hg pool

Figure 4. The ratio Hg : C (Gg Pg−1 ; median ± IQR) in the active layer, frozen peat, and mineral horizons across the WSL latitudinal
transect.

                                                                          Figure 6. Total depth-integrated pools of Hg mass (Mg) in the upper
                                                                          0–30 and 0–100 cm (red and blue columns, respectively) of WSL
                                                                          frozen peatlands in each permafrost zone. The stocks are calculated
                                                                          assuming the areal proportion of bogs from the landscape inventory
                                                                          across the WSL (Sheng et al., 2004).

Figure 5. Latitudinal variation in WSL soil Hg storage                    0–30 cm layer and 3.0 mg Hg m−2 in the 0–100 cm layer
(mg Hg m−2 ) in the 0–30 and 0–100 cm peat layer (a) and in the ac-
                                                                          in the sporadic zone (Kogalym site), 1.8–4.0 mg Hg m−2 in
tive, frozen, and mineral layers (b). In the permafrost-free zone, the
first 40 cm were used to calculate Hg storage in the active layer. The
                                                                          the 0–30 cm layer and 9.6–11.9 mg Hg m−2 in the 0–100 cm
permafrost peat layer is fixed from the lower boundary of the active      layer in the continuous- to discontinuous-permafrost zone
(unfrozen) layer down to 100 cm. Finally, for the mineral layer we        (Khanymey and Pangody sites), and 6.0 mg Hg m−2 in the
considered only the first 10 cm below peat deposits across the full       0–30 cm layer and 13.7 mg Hg m−2 in the 0–100 cm layer in
latitudinal gradient of the WSL peatland.                                 the continuous-permafrost zone (Tazovsky). It is worth not-
                                                                          ing that the recent data of Talbot et al. (2017) for Ontario
                                                                          (Canada) bogs (surface area: 1 133 990 km2 ; 18.8 Gg Hg at a
ter et al., 2018). In the case of Western Siberia, this high              depth of 277 ± 123 cm) are consistent with the results of the
RHgC value overestimates the Hg pool 12-fold given that                   present study in the WSL (9.3 Gg Hg for 592 440 km2 at a
the median RHgC in WSL peat is only 0.13 ± 0.12 Gg Pg−1                   depth of 280 ± 100 cm).
(median ± IQR) (Table 1, Fig. 4). The extrapolation based                    A revised value of the Hg pool in the pan-Arctic per-
on Alaskan RHgC for the whole Northern Hemisphere per-                    mafrost soils was recently provided by Olson et al. (2018),
mafrost region also suggests that the WSL contains large                  who combined measured RHgC values for Alaskan tun-
amounts of Hg in the upper 0–30 cm (20–40 mg Hg m−2 )                     dra soils (Dalton Highway, Noatak National Preserve, 8
and in the upper 0–100 cm (40–80 mg Hg m−2 ). These num-                  Mile Lake Observatory) with literature data (Table S4)
bers are much higher than the direct measurements in                      and derived RHgC of 0.12 Gg Pg−1 for the 0–30 cm (or-
this study: 0.3 mg Hg m−2 in the 0–30 cm layer and 0.8–                   ganic) and 0.62 Gg Pg−1 for the 30–100 cm (mineral) lay-
1.3 mg Hg m−2 in the 0–100 cm layer in the permafrost-free                ers. Note that Table 1 from Olson et al. (2018) has an in-
zone (Plotnikovo and Mukhrino sites), 0.5 mg Hg m−2 in the                correct organic soil RHgC of 0.274 Gg Pg−1 , which should be

Biogeosciences, 17, 3083–3097, 2020                                                           https://doi.org/10.5194/bg-17-3083-2020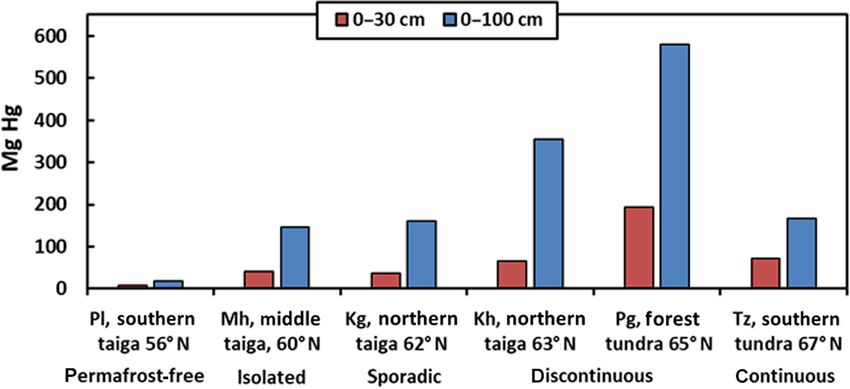
A. G. Lim et al.: A revised pan-Arctic permafrost soil Hg pool                                                                     3091

                                                                        Figure 8. Histograms of published (Table S4) and WSL (this study)
                                                                        RHgC data used for estimating the northern circumpolar permafrost
                                                                        region soil Hg pool: (a) Alaskan mineral soils (Schuster et al.,
                                                                        2018), (b) mineral soils from Eurasia and North America (exclud-
                                                                        ing Alaska), and (c) organic soils from Eurasia and North America
                                                                        (including Alaska).
Figure 7. Estimated Hg storage (mg Hg m−2 ) in the 0–100 cm soil
layer of the WSL (a) and latitudinal distribution of the Hg pool (Gg)
in active and frozen peat layers of the WSL (b). The solid black line
represents the WSL C pool (Pg) from Sheng et al. (2004).                IQR is 0.09 to 0.25 Gg Pg−1 , n = 446) than that in min-
                                                                        eral soils of Eurasia and North America (excluding Alaska)
                                                                        (Fig. 8), which is consistent with the observed difference in
                                                                        WSL mineral and organic soils. Higher RHgC observed in
0.119 Gg Pg−1 ; the typo did not affect their soil Hg budgets.          mineral soils may originate from a contribution of geogenic
Olson et al. (2018) estimate pan-Arctic permafrost soil Hg              Hg from the weathered bedrock (independent of C stock)
pools of 26 Gg (0–30 cm) and 158 Gg (30–100 cm), which                  and/or a higher mineralization rate of C (C loss is stronger
when combined (184 Gg) is 4 times lower than the num-                   than Hg loss) in predominantly oxic mineral soils compared
ber of 755 Gg (0–100 cm) by Schuster et al. (2018). Both                to anoxic peat soils.
studies report RHgC measurements from Alaskan soils due                    In Table 2 we revisit the full 0–300 cm pan-Arctic per-
to relatively easy road access to the sampling sites along              mafrost soil Hg inventory. For this, we used Eurasian and
the Dalton Highway. The bedrock along the Dalton High-                  North American (excluding Alaska) RHgC based on the lit-
way contains relatively high geogenic Hg levels (mean con-              erature data compilations of Olson et al. (2018) and Schus-
centration: 32 ng g−1 ), resulting in a high geogenic contri-           ter et al. (2018) and our observed WSL RHgC for Eurasia,
bution in mineral soils (39 % for B horizons and 20 % for               multiplied by estimated organic C pools for the northern
A horizons; Obrist et al., 2017). It is clear that any upscal-          permafrost region covering 17.8 × 10⁶ km2 from Hugelius
ing calculation of pan-Arctic permafrost Hg depends criti-              et al. (2014). The systematic underestimation made by ne-
cally on the RHgC of the 0–30 and 30–100 cm peat layers as              glecting high RHgC in Alaskan mineral soils is small, on the
Eurasian sporadic to continuous permafrost represents 54 %              order of 2.5 Gg Hg, due to a relatively small Alaskan C pool
of the northern soil C inventory (Table 2). We combined our             of 2.6 Pg C (Tarnocai et al., 2009). We estimate the pan-
new WSL data (n = 202) with literature data covering Rus-               Arctic permafrost soil Hg pool to be 72 Gg (39–91 Gg, IQR)
sia (n = 42), Scandinavia (n = 97), Canada (n = 122), and               in the upper 30 cm, 240 Gg (110–336 Gg) in the upper 1 m,
Alaska (n = 703) to build a pan-Arctic database for RHgC                and 597 Gg (384–750 Gg) in the upper 3 m (Table 3). Note
(Table S4). Setting Alaska aside, as a geographic region with           that our revised value in the 0–1 m range (240 Gg) is similar
high geogenic Hg, we find that Eurasian and North Amer-                 to that of Olson et al. (2018; 184 Gg) but sizably lower than
ican (excluding Alaska) mineral (< 20 % SOC) soil RHgC                  that of Schuster et al. (2018; 755 Gg). We find that Hg stocks
was lower (µ = 0.67 Gg Pg−1 , median = 0.64 Gg Pg−1 , IQR               in organic soils (> 20 % SOC) represent 52 % and 21 % of
is 0.33 to 0.79 Gg Pg−1 , n = 130) than RHgC reported for               the total Hg stock in the 0–30 and 0–100 cm depth range,
mineral soils along the Dalton Highway in Alaska (me-                   respectively (Table 2). The rest of the pan-Arctic Hg is asso-
dian = 1.64 Gg Pg−1 , IQR is 0.91 to 2.93 Gg Pg−1 , n = 589;            ciated with C in mineral soils (< 20 % SOC) for which rel-
Schuster et al., 2018; Fig. 8). The RHgC in organic soils (>            atively sparse data exist (n = 131). In particular, Turbel and
20 % SOC, including data from Alaska) was approximately                 Orthel mineral soils, which are estimated to contain 49 % to
4 times lower (µ = 0.19 Gg Pg−1 , median = 0.15 Gg Pg−1 ,               62 % of total Arctic C, respectively (Hugelius et al., 2014),

https://doi.org/10.5194/bg-17-3083-2020                                                        Biogeosciences, 17, 3083–3097, 2020
3092 A. G. Lim et al.: A revised pan-Arctic permafrost soil Hg pool
Table 2. Estimated pan-Arctic permafrost soil Hg inventory (Gg) for different depth ranges down to 300 cm. Hg pool uncertainties are
reported as the interquartile range (IQR), i.e., the 25th to 75th percentiles of the Hg pool distribution estimates by a Monte Carlo method.
Soil organic carbon (SOC) pools are from Hugelius et al. (2014).
Depth range Soils SOC Hg pool IQR % of total
(Pg) (Pg)
0–30 cm Organic (> 20 % SOC) 172 35 13 45 48
Mineral (< 20 % SOC) 45 37 15 47 52
Total 217 72 39 91
0–100 cm Organic (> 20 % SOC) 253 50 26 65 21
Mineral (< 20 % SOC) 219 191 59 287 79
Total 472 240 110 336
0–200 cm Organic (> 20 % SOC) 366 72 44 92 16
Mineral (< 20 % SOC) 461 392 196 529 84
Total 827 464 269 601
0–300 cm Organic (> 20 % SOC) 427 85 55 106 14
Mineral (< 20 % SOC) 607 512 300 666 86
Total 1034 597 384 750
and 36 % to 85 % of Hg, respectively, at the various depth
intervals need to be further investigated.
4.3 Estimating Earth’s global soil (0–30 cm) Hg pool
To assess Earth’s global soil Hg pool, we combined the more
detailed Arctic pool estimate (separating organic and min-
eral soils) with a more basic approach for the other climate
zones, where we derived bulk RHgC ’s for the 0–30 cm surface
soils based on published literature data. The core dataset for
this analysis was the global literature compilation by Schus-
ter et al. (2018) with 11 000 data points, of which 6224 data
points were from the 0–30 cm range. This global dataset was
complemented by soil Hg data from the boreal (Olson et al.,
2018) and tropical (Campbell et al., 2003; Almeida, 2005; Figure 9. Histograms and median RHgC for the 0–30 cm soil inter-
Almeida et al., 2005; Melendez-Perez et al., 2014) zones. val for different global climate zones.
The RHgC ’s for each climate zone (Arctic, boreal, temperate,
subtropical, and tropical) were then multiplied by the respec-
tive C stock estimates from the global soil organic carbon ter et al. (2018) concluded that Arctic permafrost soils store
map (FAO and ITPS, 2018). The RHgC of all 0 to 30 cm soil nearly twice the amount of Hg as all other soils, the ocean,
data increases from cold climate zones to warmer climate, and the atmosphere combined, but in doing so they compared
from 0.36 Gg Pg−1 for Arctic soils (excluding Alaska) to different depth ranges for global (typically 0–15 or 0–20 cm)
1.8 Gg Pg−1 in subtropical and tropical soils (Fig. 9, Table 4). and Arctic soil estimates (0–300 cm). Our revised estimate
This latitudinal trend in RHgC likely reflects a combination of of the pan-Arctic permafrost and global soil pool suggests
low C mineralization rates in colder northern soils and addi- that, for a similar depth range of 0–30 cm, permafrost soils
tional Hg sorption to Fe(oxi)hydroxides in old tropical soils. contain 7 % (72 Gg) of the global soil Hg pool (1086 Gg).
Taking into account the variation in RHgC and C stocks across
the climate zones, we estimate a global Hg stock of 1086 Gg 4.4 Northern soil Hg sequestration and Hg loss
(852–1265 Gg, IQR) for the top 0–30 cm (Table 4). Previous
global Hg soil pool estimates vary between 232 and 1150 Gg Olson et al. (2018) recognized that the large 0–100 cm north-
(Selin et al., 2008; Smith-Downey et al., 2010; Amos et al., ern soil Hg pool is the result of thousands of years of net at-
2014, 2015; Hararuk et al., 2013; Wang et al., 2019). Schus- mospheric Hg deposition. The latitudinal trend of northward-
Biogeosciences, 17, 3083–3097, 2020 https://doi.org/10.5194/bg-17-3083-2020A. G. Lim et al.: A revised pan-Arctic permafrost soil Hg pool 3093
Table 3. Comparison of estimated pan-Arctic permafrost soil Hg pools by different studies.
Depth range Hugelius et al. Schuster et al. Olson et al. This study
(2014) (2018) (2018)
SOC 95 % CI Hg Pool 95 % CI Hg Pool 25 % CI Hg Pool IQR
(Pg) (Pg) (Gg) (Gg) (Gg) (Gg) (Gg) (Gg)
0–30 cm 217 12 347 ±196 26 21–42∗ 72 39–91
0–100 cm 472 27 755 ±301 184 136–274∗ 240 110–336
0–200 cm 827 108 1323 ±764 464 269–601
0–300 cm 1034 150 1656 ±962 597 384–750
∗ Confidence interval (CI) corresponding to the 37.5th to 62.5th percentile.
Table 4. Estimated soil Hg pool (0 to 30 cm interval) for different climate zones based on reported RHgC and carbon pools. Hg pool
uncertainties are reported as the interquartile range (IQR), i.e., the 25th to 75th percentiles of the Hg pool distribution estimates by a Monte
Carlo method.
Climate zone C pool Median RHgC Mean RHgC Hg pool IQR
(Pg) (Gg Pg−1 ) (Gg Pg−1 ) (Gg) (Gg)
Tropicsa 208 1.85 2.14 446 268–556
Subtropicsa 102 1.83 2.13 217 128–271
Temperatea 191 1.37 1.55 296 183–366
Boreala 140 0.35 0.41 55 35–67
Arcticb 217c (0.15, 0.64) (0.19, 0.67) 72 39–91
Total 858 1086 852–1265
a Carbon pools are from FAO and ITPS (2018). b The Arctic R c
HgC and Hg pool are from Table 2. The
Arctic carbon pool is from Hugelius et al. (2014).
increasing peat Hg concentration in the WSL (Figs. 4, 5) il- the climate dependence of Hg0 sequestration (as soil HgII )
lustrates that this net Hg deposition is a fine balance between and Hg0 re-emission before we can predict and model north-
the vegetation Hg pump, which sequesters Hg0 in soils via ern soil Hg loss to the atmosphere due to global warming
foliar uptake and litterfall, and Hg0 emission during biomass trajectories.
degradation. Annual gross Hg sequestration by vegetation
via the vegetation pump likely scales with primary produc-
tivity and therefore decreases northward as insolation and 5 Conclusions
growing season decrease. However, in the north, degradation
rates of vegetation biomass are lower than in the south: the Western Siberian peatlands contain a large amount of Hg in
moss biomass loss during decomposition in the forest tun- frozen and thawed peat; the lateral pools of peat palsa bogs
dra zone (5–6 % over first year and 10–12 % over 2 years) is range from between 1 and 2 mg Hg m−2 in the south to be-
lower than that in the southern taiga (10–20 % over first year tween 10 and 15 mg Hg m−2 in the north. This northward in-
and 20–40 % over 2 years) based on in situ biomass degrada- crease of Hg concentration and pools can be explained by
tion experiments across the WSL gradient of biomes (Vish- better preservation of organic-bound Hg, i.e., lower Hg re-
nyakova and Mironycheva-Tokareva, 2018). The net result is emissions, due to colder temperatures and a shorter active
a higher preservation of soil Hg in the north, where less emis- period in the continuous-permafrost zone compared to the
sion of Hg0 during plant decay occurs. The dependence of discontinuous and sporadic zones. We revisited the full 0–
this balance between Hg0 sequestration and Hg0 re-emission 300 cm pan-Arctic permafrost soil Hg inventory, based on
on climate qualitatively explains the contrasting observations published RHgC and our observed WSL RHgC , together with
made in Toolik (AK, USA, 68◦ N; MAAT: −7 ◦ C; Obrist estimated pan-Arctic permafrost soil organic C pools for
et al., 2017) and Degerö Stormyr (Sweden, 64◦ N; MAAT: 0–300 cm from Hugelius et al. (2014). We estimate the 0–
2 ◦ C; Osterwalder et al., 2018). At Toolik, net Hg0 deposi- 300 cm pan-Arctic permafrost soil Hg inventory to be 597 Gg
tion by vegetation and soil uptake occurs on an annual basis, (384–750 Gg, IQR), which is 3 times lower than a previ-
whereas at Degerö Stormyr higher temperatures result in net ous estimate of 1656 ± 962 Gg Hg for the same depth range
annual Hg0 emission. More research is needed to quantify (Schuster et al., 2018). We estimate the global soil Hg pool
to be 1086 Gg for the 0–30 cm depth range. The permafrost
https://doi.org/10.5194/bg-17-3083-2020 Biogeosciences, 17, 3083–3097, 20203094 A. G. Lim et al.: A revised pan-Arctic permafrost soil Hg pool
Hg pool for the same 0–30 cm depth range is 72 Gg, and Financial support. This research has been supported by the Rus-
while large compared to the 3 Gg of Hg residing in the Arctic sian Science Foundation (project no. 18-77-10045), Russian Fund
Ocean (Soerensen et al., 2016), it represents only 7 % of the for Basic Research (grant nos. 19-29-05209-mk and 19-55-15002-
global soil Hg pool. NCNI_a), the CNRS Chantier Arctique Français (via the PARCS
We document large regional differences in RHgC driven by project), and the European Commission, H2020 Research Infras-
tructures, ERA-PLANET (grant no. 689443), iGOSP and iCUPE
(1) different contributions of geogenic Hg in mineral soils,
programs. Martin Jiskra acknowledges funding by the Swiss Na-
e.g., resulting in higher RHgC in Alaska than in other areas tional Science Foundation (grant no. PZ00P2_174101).
of the pan-Arctic permafrost region, and (2) the stability of
Hg with respect to emission from organic soils, e.g., result-
ing in a gradient with increasing RHgC towards the north of Review statement. This paper was edited by Andreas Richter and
the WSL. These systematic differences illustrate the limita- reviewed by two anonymous referees.
tions of the pool size estimation approach where C invento-
ries are multiplied by average RHgC values, and they empha-
size the need for spatially resolved sampling and pool size
estimates, similar to the pan-Arctic permafrost C pool esti-
References
mates (Hugelius et al., 2014). In particular, to estimate the
release of Hg to aquatic ecosystems, e.g., coastal erosion and Almeida, M. D.: Biogeoquímica de mercúrio na interface solo-
transfer to rivers and Hg evasion to the atmosphere, spatially atmosfera na Amazônia, PhD thesis, Univsidade Federal Flumi-
resolved Hg soil pools will be valuable. nense, Niterói, Brazil, 221 pp., 2005.
Almeida, M. D., Lacerda, L. D., Bastos, W. R., and Herrmann, J. C.:
Mercury loss from soils following conversion from forest to pas-
Data availability. Hg and C concentration data of the WSL ture in Rondônia, Western Amazon, Brazil, Environ. Pollut., 137,
soil samples are available in the Supplement. A summary of 179–186, https://doi.org/10.1016/j.envpol.2005.02.026, 2005.
pan-Arctic literature data is provided in the Supplement. The per- AMAP: AMAP Assessment 2011: Mercury in the Arctic. Arc-
mafrost data from Schuster et al. (2018) and a global compilation tic Monitoring and Assessment Programme (AMAP), Oslo,
of RHgC data are available at https://agupubs.onlinelibrary. Norway, xiv + 193 pp., https://www.amap.no/documents/doc/
wiley.com/action/downloadSupplement?doi=10.1002/ amap-assessment-2011-mercury-in-the-arctic/90 (last access:
2017GL075571&file=grl56886-sup-0002-2017GL075571-ds01. 15 June 2020), 2011.
csv and https://agupubs.onlinelibrary.wiley.com/action/ Amos, H. M., Jacob, D. J., Kocman, D., Horowitz, H. M.,
downloadSupplement?doi=10.1002/2017GL075571&file= Zhang, Y., Dutkiewicz, S., Horvat, M., Corbitt, E. S.,
grl56886-sup-0003-2017GL075571-ds02.csv. The Arctic and Krabbenhoft, D. P., and Sunderland, E. M.: Global bio-
boreal soil data from the Olson et al. (2018) study are available geochemical implications of mercury discharges from rivers
from the corresponding author upon request. Note that Table 1 and sediment burial, Environ. Sci. Technol., 48, 9514–9522,
from Olson et al. (2018) has an incorrect organic soil RHgC of https://doi.org/10.1021/es502134t, 2014.
0.274 Gg Pg−1 , which should be 0.119 Gg Pg−1 . The data from the Amos, H. M., Sonke, J. E., Obrist, D., Robins, N., Ha-
tropical climate zone were compiled from original publications of gan, N., Horowitz, H. M., Mason, R. P., Witt, M., Hedge-
Almeida (2005), Almeida et al. (2005), Campbell et al. (2003), and cock, I. M., Corbitt, E. S., and Sunderland, E. M.: Observa-
Melendez-Perez et al. (2014). tional and modeling constraints on global anthropogenic en-
richment of mercury, Environ. Sci. Technol., 49, 4036–4047,
https://doi.org/10.1021/es5058665, 2015.
Supplement. The supplement related to this article is available on- Bailey, E. A., Gray, J. E., and Theodorakos, P. M.: Mercury in
line at: https://doi.org/10.5194/bg-17-3083-2020-supplement. vegetation and soils at abandoned mercury mines in south-
western Alaska, USA, Geochem.-Explor. Env. A., 2, 275–285,
https://doi.org/10.1144/1467-787302-032, 2002.
Baptista-Salazar, C., Richard, J. H., Horf, M., Rejc, M., Gosar, M.,
Author contributions. OSP and SVL designed the study. SVL,
and Biester, H.: Grain-size dependence of mercury speciation in
AGL, and NK performed field sampling. AGL and OSP did all lab-
river suspended matter, sediments and soils in a mercury min-
oratory analysis. MJ and JES did the northern soil and global soil
ing area at varying hydrological conditions, Appl. Geochem.,
Hg pool calculations. All authors contributed to the writing of the
81, 132–142, https://doi.org/10.1016/j.apgeochem.2017.04.006,
manuscript.
2017.
Bates, A. L., Spiker, E. C., and Holmes, C. W.: Speci-
ation and isotopic composition of sedimentary sulfur in
Competing interests. The authors declare that they have no conflict the Everglades, Florida, USA, Chem. Geol., 146, 155–170,
of interest. https://doi.org/10.1016/S0009-2541(98)00008-4, 1998.
Brown, J., Ferrians Jr., O. J., Heginbottom, J. A., and Mel-
nikov, E. S.: Circum-arctic map of permafrost and ground ice
Acknowledgements. We are thankful to Luiz D. Lacerda for sharing conditions, National Snow and Ice Data Center, Digital media,
Hg and C data from Brazil. Boulder, CO 80309-0449 USA, 1998, revised February 2001.
Biogeosciences, 17, 3083–3097, 2020 https://doi.org/10.5194/bg-17-3083-2020A. G. Lim et al.: A revised pan-Arctic permafrost soil Hg pool 3095 Campbell, L. M., Hecky, R. E., Muggide, R., Dixon, D. G., 87, https://doi.org/10.15356/0373-2444-2015-2-74-87, 2015 (in and Ramlal, P. S.: Variation and distribution of total mer- Russian). cury in water, sediment and soil from northern Lake Kurina, I. V., Veretennikova, E. E., Il’ina, A. A., Dyukarev, E. A., Victoria, East Africa, Biogeochemistry, 65, 195–211, Golovatskaya, E. A., and Smirnov, S. V.: Reconstruction of https://doi.org/10.1023/A:1026058417584, 2003. conditions of formation of the eutrophic peatland deposits in Dastoor, A. P. and Durnford, D. A.: Arctic Ocean: Is It a Sink or south of the taiga zone of Western Siberia, Izvestiya Rossi- a Source of Atmospheric Mercury?, Environ. Sci. Technol., 48, iskoi Akademii Nauk, Seriya Geograficheskaya, 4, 66–76, 1707–1717, https://doi.org/10.1021/es404473e, 2014. https://doi.org/10.1134/S2587556618040106, 2018. Fahnestock, M. F., Bryce, J. G., McCalley, C. K., Montes- Lim, A. G., Sonke, J. E., Krickov, I. V., Manasypov, R. M., deoca, M., Bai, S., Li, Y., Driscoll, C. T., Crill, P. M., Loiko, S. V., and Pokrovsky, O. S.: Enhanced particulate Hg ex- Rich, V. I., and Varner, R. K.: Mercury reallocation in thaw- port at the permafrost boundary, western Siberia, Environ. Pol- ing subarctic peatlands, Geochem. Perspect. Lett., 6, 33–38, lut., 254, 113083, https://doi.org/10.1016/j.envpol.2019.113083, https://doi.org/10.7185/geochemlet.1922, 2019. 2019. FAO and ITPS: Global Soil Organic Carbon Map (GSOCmap), Loiko, S., Raudina, T., Lim, A., Kuzmina, D., Kulizhskiy, S., and Technical Report, Rome, 162 pp., 2018. Pokrovsky, O.: Microtopography controls of carbon and related Fisher, J. A., Jacob, D. J., Soerensen, A. L., Amos, H. M., Stef- elements distribution in the West Siberian frozen bogs, Geo- fen, A., and Sunderland, E. M.: Riverine source of Arctic Ocean sciences, 9, 291, https://doi.org/10.3390/geosciences9070291, mercury inferred from atmospheric observations, Nat. Geosci., 5, 2019. 499–504, https://doi.org/10.1038/ngeo1478, 2012. Lyapina, E. E., Golovatskaya, E. A., and Ippolitov, I. I.: Mercury Golovatskaya, E. A. and Lyapina, E. E.: Distribution of total mer- concentration in natural objects of west Siberia, Contemp. Probl. cury in peat soil profiles in West Siberia, Contemp. Probl. Ecol., Ecol., 2, 1–5, https://doi.org/10.1134/S1995425509010019, 2, 156–161, https://doi.org/10.1134/S199542550902012X, 2009. 2009. Melendez-Perez, J. J., Fostier, A. H., Carvalho, J. A., Wind- Hararuk, O., Obrist, D., and Luo, Y.: Modelling the sensi- möller, C. C., Santos, J. C., and Carpi, A.: Soil and tivity of soil mercury storage to climate-induced changes biomass mercury emissions during a prescribed fire in in soil carbon pools, Biogeosciences, 10, 2393–2407, the Amazonian rain forest, Atmos. Environ., 96, 415–422, https://doi.org/10.5194/bg-10-2393-2013, 2013. https://doi.org/10.1016/j.atmosenv.2014.06.032, 2014. Hugelius, G., Strauss, J., Zubrzycki, S., Harden, J. W., Schuur, E. Morel, F. M. M., Kraepiel, A. M. L., and Amyot, M.: The chemical A. G., Ping, C.-L., Schirrmeister, L., Grosse, G., Michaelson, G. cycle and bioaccumulation of mercury, Annu. Rev. Ecol. Syst., J., Koven, C. D., O’Donnell, J. A., Elberling, B., Mishra, U., 29, 543–566, https://doi.org/10.1146/annurev.ecolsys.29.1.543, Camill, P., Yu, Z., Palmtag, J., and Kuhry, P.: Estimated stocks 1998. of circumpolar permafrost carbon with quantified uncertainty Morgalev, Y. N., Lushchaeva, I. V., Morgaleva, T. G., ranges and identified data gaps, Biogeosciences, 11, 6573–6593, Kolesnichenko, L. G., Loiko, S. V., Krickov, I. V., Lim, A., https://doi.org/10.5194/bg-11-6573-2014, 2014. Raudina, T. V., Volkova, I. I., Shirokova, L. S., Morgalev, S. Y., Jensen, A. and Jensen, A.: Historical deposition rates of mercury Vorobyev, S. N., Kirpotin, S. N., and Pokrovsky, O. S.: Bacteria in scandinavia estimated by dating and measurement of mer- primarily metabolize at the active layer/permafrost border in cury in cores of peat bogs, Water Air Soil Pollut., 56, 769–777, the peat core from a permafrost region in western Siberia, Polar https://doi.org/10.1007/BF00342315, 1991. Biol., 40, 1645–1659, https://doi.org/10.1007/s00300-017-2088- Jiskra, M., Sonke, J. E., Obrist, D., Bieser, J., Ebinghaus, R., 1, 2017. Myhre, C. L., Pfaffhuber, K. A., Wängberg, I., Kyllö- Obrist, D., Agnan, Y., Jiskra, M., Olson, C. L., Cole- nen, K., Worthy, D., Martin, L. G., Labuschagne, C., grove, D. P., Hueber, J., Moore, C. W., Sonke, J. E., and Mkololo, T., Ramonet, M., Magand, O., and Dommergue, A.: Helmig, D.: Tundra uptake of atmospheric elemental mer- A vegetation control on seasonal variations in global atmo- cury drives Arctic mercury pollution, Nature, 547, 201–204, spheric mercury concentrations, Nat. Geosci., 11, 244–250, https://doi.org/10.1038/nature22997, 2017. https://doi.org/10.1038/s41561-018-0078-8, 2018. Olson, C., Jiskra, M., Biester, H., Chow, J., and Obrist, D.: Mercury Jiskra, M., Sonke, J. E., Agnan, Y., Helmig, D., and Obrist, D.: In- in Active-Layer Tundra Soils of Alaska: Concentrations, Pools, sights from mercury stable isotopes on terrestrialatmosphere ex- Origins, and Spatial Distribution, Global Biogeochem. Cy., 32, change of Hg(0) in the Arctic tundra, Biogeosciences, 16, 4051– 1058–1073, https://doi.org/10.1029/2017GB005840, 2018. 4064, https://doi.org/10.5194/bg-16-4051-2019, 2019. Osterwalder, S., Sommar, J., Åkerblom, S., Jocher, G., Fritsche, J., Kremenetski, K. V., Velichko, A. A., Borisova, O. K., MacDon- Nilsson, M. B., Bishop, K., and Alewell, C.: Comparative ald, G. M., Smith, L. C., Frey, K. E., and Orlova, L. A.: Peat- study of elemental mercury flux measurement techniques over lands of the Western Siberian lowlands: Current knowledge on a Fennoscandian boreal peatland, Atmos. Environ., 172, 16–25, zonation, carbon content and Late Quaternary history, Qua- https://doi.org/10.1016/j.atmosenv.2017.10.025, 2018. ternary Sci. Rev., 22, 703–723, https://doi.org/10.1016/S0277- Outridge, P. M., Macdonald, E. R. W., Wang, G. F., Stern, G. A., 3791(02)00196-8, 2003. and Dastoor, A. P.: A mass balance inventory of mer- Kurina, I. V. and Veretennikova, E. E.: Impact of climate cury in the Arctic Ocean, Environ. Chem., 5, 89–111, change of the Holocene on the development of the ridge- https://doi.org/10.1071/EN08002, 2008. hollow swamp complex of Western Siberia, Izvestiya Rossi- Panova, N. K., Trofimova, S. S., Antipina, T. G., Zinoviev, E. V., iskoi Akademii Nauk, Seriya Geograficheskaya, 2, 74– Gilev, A. V., and Erokhin, N. G.: Holocene dynamics of https://doi.org/10.5194/bg-17-3083-2020 Biogeosciences, 17, 3083–3097, 2020
You can also read


