Record low ozone values over the Arctic in boreal spring 2020
←
→
Page content transcription
If your browser does not render page correctly, please read the page content below
Atmos. Chem. Phys., 21, 617–633, 2021
https://doi.org/10.5194/acp-21-617-2021
© Author(s) 2021. This work is distributed under
the Creative Commons Attribution 4.0 License.

Record low ozone values over the Arctic in
boreal spring 2020
Martin Dameris1 , Diego G. Loyola2 , Matthias Nützel1 , Melanie Coldewey-Egbers2 , Christophe Lerot3 ,
Fabian Romahn2 , and Michel van Roozendael3
1 Deutsches Zentrum für Luft- und Raumfahrt, Institut für Physik der Atmosphäre,
Oberpfaffenhofen, Germany
2 Deutsches Zentrum für Luft- und Raumfahrt, Institut für Methodik der Fernerkundung,

Oberpfaffenhofen, Germany
3 Royal Belgian Institute for Space Aeronomy (BIRA-IASB), Brussels, Belgium

Correspondence: Martin Dameris (martin.dameris@dlr.de)

Received: 21 July 2020 – Discussion started: 21 July 2020
Revised: 13 November 2020 – Accepted: 16 November 2020 – Published: 18 January 2021

Abstract. Ozone data derived from the Tropospheric Moni-        features are presented and discussed. It becomes apparent
toring Instrument (TROPOMI) sensor on board the Sentinel-       that the monthly mean of the minimum total ozone column
5 Precursor satellite show exceptionally low total ozone        value for March 2020 (221 DU) was clearly below the re-
columns in the polar region of the Northern Hemisphere          spective values found in March 1997 (267 DU) and 2011
(Arctic) in spring 2020. Minimum total ozone column val-        (252 DU), which highlights the special evolution of the po-
ues around or below 220 Dobson units (DU) were seen over        lar stratospheric ozone layer in the Northern Hemisphere in
the Arctic for 5 weeks in March and early April 2020. Usu-      spring 2020. A comparison with a typical ozone hole over
ally the persistence of such low total ozone column values in   the Antarctic (e.g., in 2016) indicates that although the Arctic
spring is only observed in the polar Southern Hemisphere        spring 2020 situation is remarkable, with total ozone column
(Antarctic) and not over the Arctic. These record low to-       values around or below 220 DU observed over a considerable
tal ozone columns were caused by a particularly strong po-      area (up to 0.9 million km2 ), the Antarctic ozone hole shows
lar vortex in the stratosphere with a persistent cold strato-   total ozone columns typically below 150 DU over a much
sphere at higher latitudes, a prerequisite for ozone deple-     larger area (of the order of 20 million km2 ). Furthermore, to-
tion through heterogeneous chemistry. Based on the ERA5,        tal ozone columns below 220 DU are typically observed over
which is the fifth generation of the European Centre for        the Antarctic for about 4 months.
Medium-Range Weather Forecasts (ECMWF) atmospheric
reanalysis, the Northern Hemisphere winter 2019/2020 (from
December to March) showed minimum polar cap tempera-
tures consistently below 195 K around 20 km altitude, which     1   Introduction
enabled enhanced formation of polar stratospheric clouds.
The special situation in spring 2020 is compared and dis-       Today’s operating satellite instruments produce a reliable
cussed in context with two other Northern Hemisphere spring     picture of the Earth’s atmosphere and its chemical composi-
seasons, namely those in 1997 and 2011, which also dis-         tion. These instruments monitor, for example, the evolution
played relatively low total ozone column values. However,       of the stratospheric ozone layer (e.g., Loyola et al., 2009),
during these years, total ozone columns below 220 DU over       which is important for life on Earth. Unusually low ozone
several consecutive days were not observed in spring. The       values can occur in the polar regions if chemical and dy-
similarities and differences of the atmospheric conditions of   namical processes interact in a specific way. A long-lived
these three events and possible explanations for the observed   polar vortex with low stratospheric temperatures can sup-
                                                                port significant ozone depletion, and a strong polar vortex

Published by Copernicus Publications on behalf of the European Geosciences Union.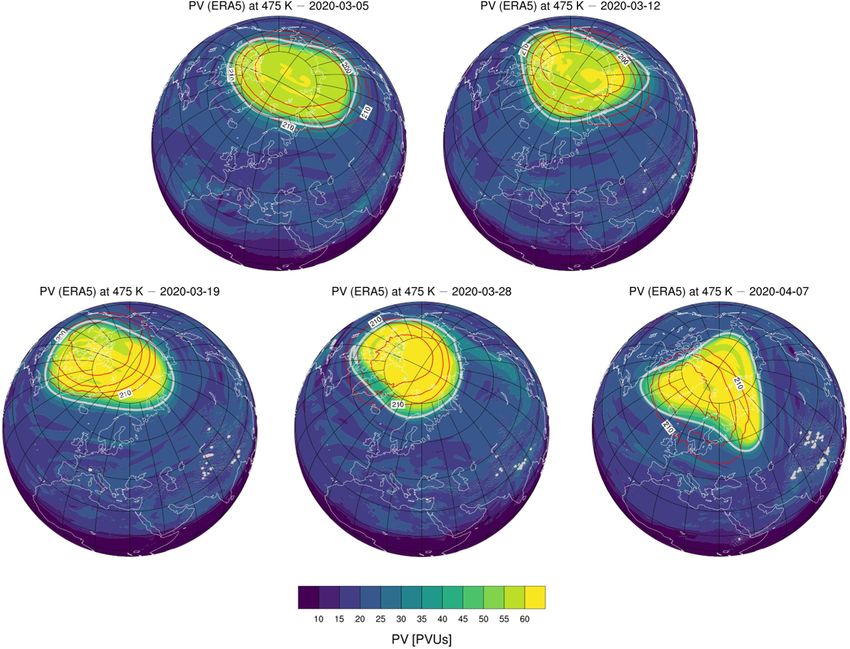
618                                                               M. Dameris et al.: Record low ozone values over the Arctic

itself can hamper meridional transport of ozone-rich air from      is still enhanced with respect to 1980s values as CFCs have
lower latitudes (e.g., Solomon, 1999; Solomon et al., 2014).       lifetimes of several decades (SPARC, 2013). Consequently,
The largest concentrations of atmospheric ozone are found          the chlorine concentration in the stratosphere is still high.
in the stratospheric ozone layer, with about 90 % of the at-       Based on the current scientific understanding, the chlorine
mosphere’s ozone located at altitudes between 15 and 30 km         content is expected to reach pre-CFC-era conditions (i.e., lev-
(e.g., Langematz, 2019). The Dobson unit (DU) – named af-          els similar to the ones before 1980) around the middle of this
ter Gordon Dobson (1889–1976), who devised the first in-           century, and we can therefore expect a return to pre-CFC val-
strument for measuring atmospheric ozone content – is used         ues of the ozone layer in the next 30 to 40 years (see Chaps. 3
to describe the total amount of ozone found in the atmosphere      and 4 in WMO, 2018).
above a specific location. Typically, an ozone hole in the            Notwithstanding the Montreal Protocol and the projected
Antarctic is defined as the area where the total ozone column      recovery of the ozone layer, very low TOC values over the
(TOC) is less than 220 DU (e.g., WMO, 2018). In the South-         polar cap can occur not only in the SH, but also in the
ern Hemisphere (SH) polar region (Antarctic) a TOC below           NH. For instance, as shown in Fig. 1, in March and early
220 DU is about 30 % under the climatological mean ozone           April 2020, very low TOC values were measured in the Arc-
value in austral spring, which was determined for the years        tic, although the stratospheric chlorine content in 2020 was
before 1980 (e.g., Chap. 4 in WMO, 1999; Chap. 3 in WMO,           known to be lower than in previous years (Chap. 1 in WMO,
2003). Climatological mean TOCs averaged over the North-           2018).
ern Hemisphere (NH) polar region (Arctic) in boreal spring            The dynamical conditions of the stratosphere as observed
are higher (∼ 400–450 DU; e.g., Dameris, 2010). Therefore,         in the NH spring 2020 were unusual, showing an undis-
the decrease of TOC below 220 DU during this period indi-          turbed polar stratospheric vortex with low temperatures, as
cates a reduction of total ozone in the order of 50 %. We note     will be seen in the upcoming analysis. Comparable dynami-
that NH winters with reduced wave activity could be related        cal conditions in the NH stratosphere in spring were noted
to reduced transport of ozone into the stratospheric polar vor-    in the literature for 1997 (e.g., Coy et al., 1997; Manney
tex and to stronger ozone depletion in the lower stratosphere      et al., 1997; Lefèvre et al., 1998; Hansen and Chipperfield,
because of lower temperatures (e.g., Tegtmeier et al., 2008).      1999) and 2011 (e.g., Manney et al., 2011; Sinnhuber et
Additionally, a shift of the tropopause to higher altitudes and    al., 2011; Kuttippurath et al., 2012; Hommel et al., 2014).
a colder tropopause could lead in the same direction (e.g.,        TOC values were low for an extended time period in spring
Manney et al., 2011).                                              in these 2 years, but TOC values below 220 DU were not
   The south polar lower stratosphere cools significantly          observed. Although the dynamical conditions in winter and
more in winter (June–August) than the north polar lower            spring 2019/2020 were unusual, they lie in the natural range
stratosphere (December–February). In the cold polar lower          of stratospheric dynamical fluctuations in NH winter and
stratosphere in winter, polar stratospheric clouds (PSCs)          early spring (e.g., Langematz et al., 2014). The importance of
form during polar night. PSCs develop at temperatures be-          stratospheric dynamics causing low TOC has been discussed
low 195 K or 188 K at 50 hPa, which are approximate values         in detail in the last decades (e.g., Chaps. 4 and 12 in WMO,
that depend on HNO3 and H2 O concentrations (see, for in-          1999; Chap. 3 in WMO, 2003; Chap. 3 in WMO, 2014;
stance, Fig. 4-1 of Chap. 4 in WMO, 2018). Under these con-        Solomon, 1999; Petzoldt, 1999; Rex et al., 2004; Tilmes et
ditions, nitric acid trihydrate crystals (NAT: HNO3 × 3H2 O;       al., 2006; Kivi et al., 2007; Tegtmeier et al., 2008; Harris et
so-called NAT-PSCs) or ice PSCs are formed in the follow-          al., 2010).
ing days or weeks, respectively. PSC particles allow hetero-          Considering the dynamical conditions, it was not unex-
geneous reactions to take place on their surfaces, which en-       pected to measure low TOC values within the polar vortex
able halogen compounds (chlorine and bromine) to be re-            in NH spring 2020. However, as indicated in Fig. 1, it is still
leased from reservoir compounds (e.g., ClONO2 , HCl) and           noteworthy that the TOC values were below the typical ozone
then be converted to an active form. When the sun returns          hole threshold of 220 DU for about 5 weeks, despite the re-
in polar spring, active molecules, such as Cl2 or HOCl, are        duced chlorine content in the stratosphere. The occurrence
converted into reactive Cl and ClO. Ozone depletion follows        of TOC values below 220 DU in March 2020 derived from
via catalytic photochemical reaction cycles. More details can      satellite instrument measurements is confirmed by ground-
be found in the review article by Solomon (1999).                  based measurements at different NH stations, in particular
   Due to the prohibition of the production and usage of           at stations in Canada (e.g., Alert, Eureka, and Resolute). The
ozone-depleting substances (among others CFCs, chloroflu-          ozone data are available, for instance, at http://www.temis.nl/
orocarbons) in response to the international activities to pro-    uvradiation/UVarchive/stations_uv.html (last access: 13 Jan-
tect the ozone layer (Montreal Protocol, 1987, and its amend-      uary 2021; van Geffen et al., 2017). Additional ozonesonde
ments), atmospheric concentrations of these chemical sub-          profiles are discussed in detail by Wohltmann et al. (2020)
stances (particularly CFCs) and their products have been re-       and Bernhard et al. (2020).
duced over the last 20 years by about 15 % (Chap. 1 in WMO,           This study provides a description of the dynamical situa-
2018). Nevertheless, the current atmospheric burden of CFCs        tion in NH winter and spring 2019/2020, which for the first

Atmos. Chem. Phys., 21, 617–633, 2021                                                 https://doi.org/10.5194/acp-21-617-2021
M. Dameris et al.: Record low ozone values over the Arctic 619
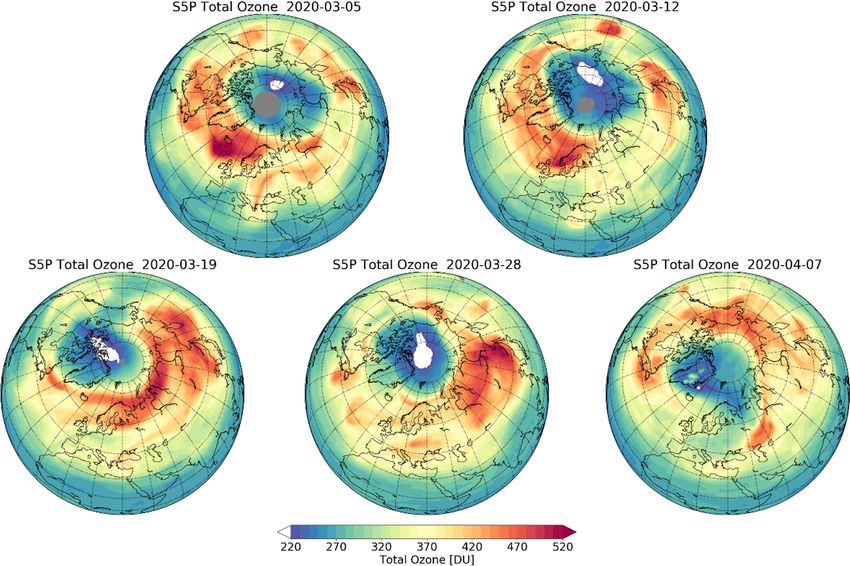
Figure 1. Total ozone column over the Northern Hemisphere on 5, 12, 19, and 28 March and 7 April 2020 measured by the TROPOMI
instrument on board the Sentinel-5 Precursor (S5P) satellite. The color scale shows Dobson units (DU). The area with total ozone column
values below 220 DU is denoted by the white color. Grey areas near the North Pole indicate missing data during polar night.
time led to TOC values below 220 DU in larger areas of the (Hersbach et al., 2019b, 2020). The ERA5 data used in this
polar vortex for an extended time period over the Arctic. We study cover the period from 1979 to 2020. For our investi-
compare winter 2019/2020 to winters with similar dynami- gations ERA5 temperature and wind data were used at the
cal conditions in Arctic spring but which did not show TOC provided 0.25◦ × 0.25◦ resolution. Daily mean data are cal-
values below 220 DU over the polar NH in spring over an ex- culated for the presentations of the respective meteorologi-
tended time period. Further, we also demonstrate that the low cal situations from the ERA5 hourly data on pressure levels
TOC values over the Arctic observed in spring 2020 are far (Hersbach et al., 2018). Monthly mean values are obtained
from the conditions usually observed in the Antarctic ozone from the monthly mean data at pressure levels (Hersbach et
hole. al., 2019a). In addition, daily potential vorticity (PV) fields
In the next section (Sect. 2) the data sets used are intro- on isentropes have been derived from hourly PV data on
duced, including a short description of the performed data isentropes, which were obtained from the full ERA5 data
processing. In Sect. 3 the special situation in NH winter and set (Copernicus Climate Change Service (C3S), 2017) and
spring 2019/2020 is presented in detail, and in Sect. 4 it is regridded to a regular latitude longitude grid (of roughly
compared with two NH winter and spring seasons, namely 0.28◦ × 0.28◦ ). ERA5 (raw) data are publicly available. For
1996/1997 and 2010/2011, where similar polar stratospheric details, see the Data Availability section.
conditions – including low TOC values – have been ob-
served. In addition, the observations in Arctic winter and 2.2 Ozone data
spring 2019/2020 are compared to a typical Antarctic ozone
hole as detected in 2016 and to the small Antarctic ozone Ozone data from July 2019 to April 2020 from the Tropo-
hole observed in 2019. The discussion of results and the con- spheric Monitoring Instrument (TROPOMI) sensor on board
clusions are presented in Sects. 5 and 6, respectively. the EU/ESA Copernicus Sentinel-5 Precursor satellite are
scientifically used for the first time in combination with the
2 Data and data processing long-term ozone data set from the European satellite data
record GOME-type Total Ozone Essential Climate Variable
2.1 Meteorological data (GTO-ECV) from July 1995 to June 2019 (Coldewey-Egbers
et al., 2015). The publicly available (Level 2) TOC data for
In this study the presented dynamical analyses are based July 2019 to April 2020 are derived from the TROPOMI sen-
on meteorological data derived from the European Centre sor using the GODFIT algorithm (Lerot et al., 2014). The es-
for Medium-Range Weather Forecasts’ (ECMWF’s) most re- timated mean magnitude of the bias of the TROPOMI TOC
cent atmospheric reanalysis, ERA5, i.e., the fifth generation compared with ground-based measurements is less than 1 %,
https://doi.org/10.5194/acp-21-617-2021 Atmos. Chem. Phys., 21, 617–633, 2021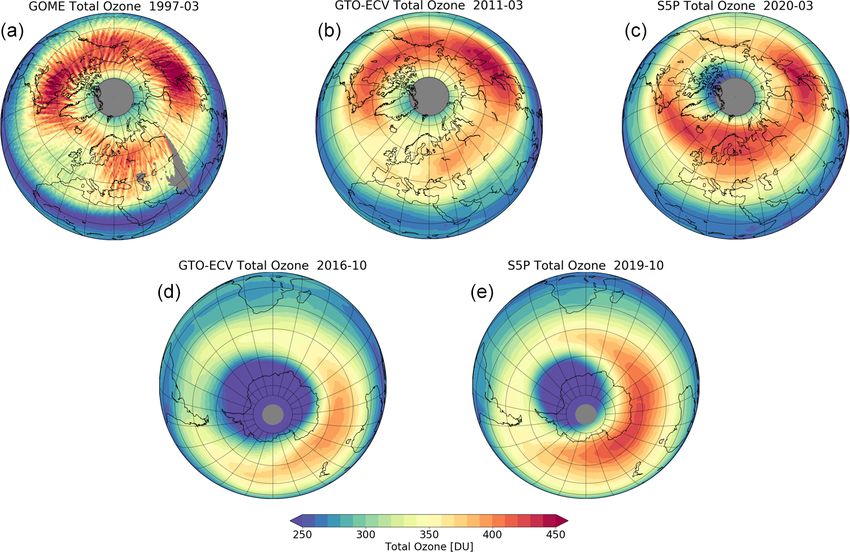
620                                                               M. Dameris et al.: Record low ozone values over the Arctic

with a mean standard deviation of up to 2.5 % (Garane et al.,      3   Situation in Northern Hemisphere winter and spring
2019). An initial comparison of TOCs from TROPOMI and                  2019/2020
the Ozone Monitoring Instrument (OMI) on board the NASA
Aura spacecraft indicated that TROPOMI TOCs are slightly           Arctic winter and early spring 2019/2020 showed a persis-
smaller (∼ −1 %) than OMI TOCs. A similar difference is            tent stratospheric polar vortex with strong zonal winds from
thus expected with respect to GTO-ECV since OMI provides           mid-December until early April. Figure 2 presents the po-
the reference basis for the combined record (see next para-        tential vorticity (PV) field of ERA5 in the NH at the isen-
graph). The TROPOMI TOC images presented for the first             tropic surface of 475 K (around 20 km altitude) and shows
time in this study are based on daily mean data regridded to       the position and strength of the polar vortex. The region of
1◦ × 1◦ resolution to facilitate the comparison with the GTO-      strong PV gradients, which is represented here by the con-
ECV data. For details, see the Data Availability section.          tour line of 36 PV units (e.g., Wohltmann et al., 2020), in-
   GTO-ECV has been developed in the framework of the              dicates the edge of the polar vortex. The figure illustrates
European Space Agency’s Climate Change Initiative ozone            that the polar vortex is strong in March and early April and
project and is based on observations from different satellite      that the position of the polar vortex coincides with the re-
sensors: the Global Ozone Monitoring Experiment on board           gion of low TOC values (Fig. 1). Figure 3 shows strong zonal
the second European Remote Sensing satellite (GOME/ERS-            mean zonal wind speeds at 60◦ N, 10 hPa (about 30 km alti-
2), the Scanning Imaging Absorption Spectrometer for At-           tude) in the ERA5 data (magenta line and dots in the fig-
mospheric Chartography on board the Environmental Satel-           ure), which are higher than the monthly mean values for
lite (SCIAMACHY/ENVISAT), the Ozone Monitoring In-                 the time period from 1979/1980 to 2019/2020 (see grey dots
strument on board the Aura satellite (OMI/Aura), and the           in the figure). This finding is in line with a similar analy-
Global Ozone Monitoring Experiment second generation on            sis by Lawrence et al. (2020), who used Modern-Era Ret-
board the MetOp satellite (GOME-2/MetOp), covering the             rospective analysis for Research and Applications version 2
time period from July 1995 to June 2019 (Coldewey-Egbers           (MERRA-2) data. In addition, Lawrence et al. (2020) showed
et al., 2015). As for TROPOMI, the retrieval algorithm GOD-        that the polar vortex was generally stronger than usual (with
FIT (Lerot et al., 2014) is used to derive TOCs from the mea-      respect to the climatological mean) in the polar stratosphere
surements of the individual satellite sensors. Before the sep-     from November to April. Further, their analysis showed the
arate data records are merged into one single product, ad-         height dependence of the zonal mean zonal wind anoma-
justments are applied in order to minimize possible inter-         lies, and it was found that the anomalies in NH spring
sensor biases and/or drifts. If not accounted for, such dis-       are most pronounced around 10 hPa (and above). Smaller
crepancies can introduce unwanted discontinuities or artifi-       dynamical fluctuations were detected in winter 2019/2020,
cial trends in the combined record. Due to its notable tem-        which were caused by planetary wave activity (Lawrence
poral stability, OMI was selected to serve as a reference for      et al., 2020; for additional information, see https://acd-ext.
the other instruments. The data are then adjusted by using         gsfc.nasa.gov/Data_services/met/ann_data.html, last access:
a correction that depends on latitude and time. The agree-         13 January 2021; or https://ozonewatch.gsfc.nasa.gov/, last
ment between GTO-ECV and ground-based observations is              access: 13 January 2021; a key reference for such analyses
0.5 %–1.5 % peak-to-peak amplitude with a negligible long-         is Newman et al., 2001). No minor or major warmings of
term drift in the NH (Garane et al., 2018), and the difference     the polar stratosphere were observed (see below), and the
between GTO-ECV and an “adjusted” TOC data set based               polar vortex was mostly undisturbed and showed a circular
on reanalysis data is between −0.5 ± 1.7 % and −1.0 ± 1.1 %        shape, except for the period from mid-January to beginning
(for details, see Coldewey-Egbers et al., 2020). In particular,    of February 2020, as can be seen from Fig. 3. These re-
the excellent temporal stability makes the GTO-ECV data            sults are in agreement with Lawrence et al. (2020). In Fig. 4
record suitable and useful for applications related to long-       the ERA5 monthly mean zonal winds derived for the NH
term investigations of the ozone layer. In this study we use       in January, February, and March 2020 indicate a persistent
the daily mean data product at 1◦ × 1◦ resolution to analyze       strong polar vortex, with maximum zonal wind speeds up to
minimum ozone columns in the NH polar region during the            118 m s−1 at 10 hPa in January.
past 24 years. During polar night, the satellite sensors used         The dynamical conditions in winter 2019/2020 with low
cannot provide measurements. For instance, in December,            planetary wave activity result in very low temperatures in the
north of about 70◦ N, no observations are available. With re-      polar lower stratosphere during polar night, especially in Jan-
turning sunlight, the coverage in the NH high-latitude regions     uary, February, and March, which cause a strong polar vor-
improves, and global coverage resumes around 20 March.             tex as a response. In the following, our analyses of lower
                                                                   stratospheric temperatures focus on the 50 hPa pressure level
                                                                   (about 20 km altitude), which is within the height range im-
                                                                   portant for ozone depletion. Figure 5 shows that the monthly
                                                                   mean temperatures in January, February, and March 2020
                                                                   were very low in comparison with the respective mean values

Atmos. Chem. Phys., 21, 617–633, 2021                                                 https://doi.org/10.5194/acp-21-617-2021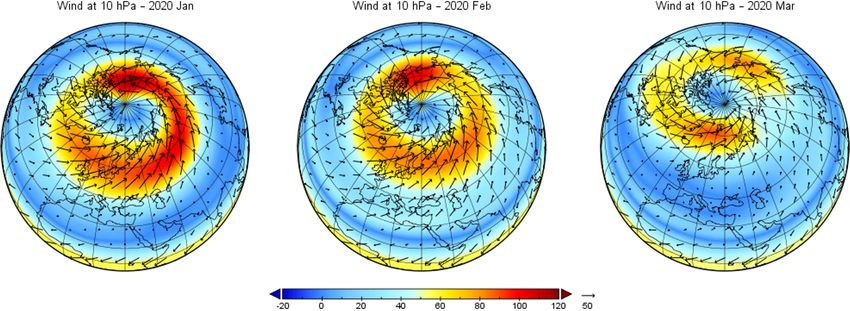
M. Dameris et al.: Record low ozone values over the Arctic                                                                        621

Figure 2. Potential vorticity (PV) on the 475 K isentropic surface over the Northern Hemisphere on 5, 12, 19, 28 March and 7 April 2020
based on ERA5. The color scale shows potential vorticity units (PVUs); 1 PVU is 10−6 m−2 s−1 K kg−1 . The grey contour highlights the
36 PVU. Red contour lines indicate the polar temperature field, with values ranging from 210 to 195 K; the distance of isolines is 5 K.

calculated for the last 4 decades (1979/1980–2019/2020). In           the magenta line in Fig. 8). A region of significantly reduced
March 2020 the calculated maximum temperature difference              TOC values inside the polar vortex was observed over the
with respect to the long-term mean was −23.8 K. In Fig. 6             polar cap from the beginning of March until early April 2020
(magenta line) minimum polar temperatures below 195 K at              (Fig. 1).
50 hPa are detected in the polar cap region (50–90◦ N) from              In Figs. 3 and 6, corresponding values of mean zonal
the beginning of December until the end of March. Further             winds and minimum polar cap temperatures over the Antarc-
analyses of the temperature field at 50 hPa indicate large ar-        tic are shown. In particular, a typical, undisturbed SH sit-
eas below 195 K. This result agrees with the analyses by              uation in 2016 (red lines) and the situation in 2019 (pur-
Lawrence et al. (2020) based on MERRA-2 and by Wohlt-                 ple lines) with a dynamically disturbed spring season are
mann et al. (2020) based on ERA5. As indicated in Fig. 7              presented. It becomes evident that in winter the zonal
(dotted magenta line), the maximum daily mean area of tem-            mean zonal winds (at 60◦ S, 10 hPa) are stronger (by about
peratures below 195 K is 13 × 1012 m2 , found at the end of           30 m s−1 ), and the minimum temperatures (polar cap, 50 hPa)
January. At the end of March, the daily cumulative area be-           are much lower (about 10 K) than in the Arctic (see also War-
low 195 K, i.e., the sum of the daily areas below 195 K up            gan et al., 2020).
to the respective date, results in about 920 × 1012 m2 . This            The temporal evolution of minimum TROPOMI TOC val-
led to conditions allowing for the formation of NAT-PSCs at           ues north of 50◦ N from July 2019 until April 2020 is pre-
50 hPa for about 3.5 months (see Figs. 6 and 7). Our results          sented in Fig. 8 (magenta line) and compared with histori-
are supported by Lawrence et al. (2020) and Wohltmann et              cal values from the GTO-ECV data record (see Sect. 2 for
al. (2020), who among others analyzed the volume of PSCs              details). In winter 2019/2020 ozone values were slightly be-
(see also Manney et al., 2020). When the sun rises in spring,         low mean conditions most of the time until the end of Febru-
sunlight delivers the energy required for starting a chemical         ary with respect to mean minimum TOC values (Fig. 8; ma-
depletion process of ozone (e.g., Solomon, 1999). In spring           genta line vs. thick black line). There were however sev-
2020 record low Arctic TOC values below 220 DU devel-                 eral short-term deviations towards even lower TOC, during
oped within the boundaries of the strong polar vortex for 8           so-called ozone mini-hole events (e.g., Millán and Manney,
continuous days from 12 to 19 March (see Fig. 1 and also              2017, and references therein). The most noteworthy exam-

https://doi.org/10.5194/acp-21-617-2021                                                   Atmos. Chem. Phys., 21, 617–633, 2021
622 M. Dameris et al.: Record low ozone values over the Arctic
instance on 3 and 4 December, showed very low TOC values
(170 DU; Fig. 8) at 65◦ N, northeast of United Kingdom and
west of Scandinavia.
Because the polar vortex was persistent and strong since
the beginning of the Arctic winter 2019/2020, reduced TOC
values inside the polar vortex and higher TOC values out-
side were observed from January 2020 onwards but with
TOC values clearly above 220 DU inside the vortex. As indi-
cated in Fig. 4, the polar vortex with persistent strong zonal
winds and strong PV gradients (see Fig. 2) prevented the
meridional transport of ozone-rich air from lower latitudes
towards the NH polar region. Lawrence et al. (2020) showed
that the undisturbed polar vortex acted as a strong transport
barrier. This is, among others, indicated by ozonesonde and
ground-based measurements at different NH stations, with
lower TOC values in the inner part of the polar vortex and
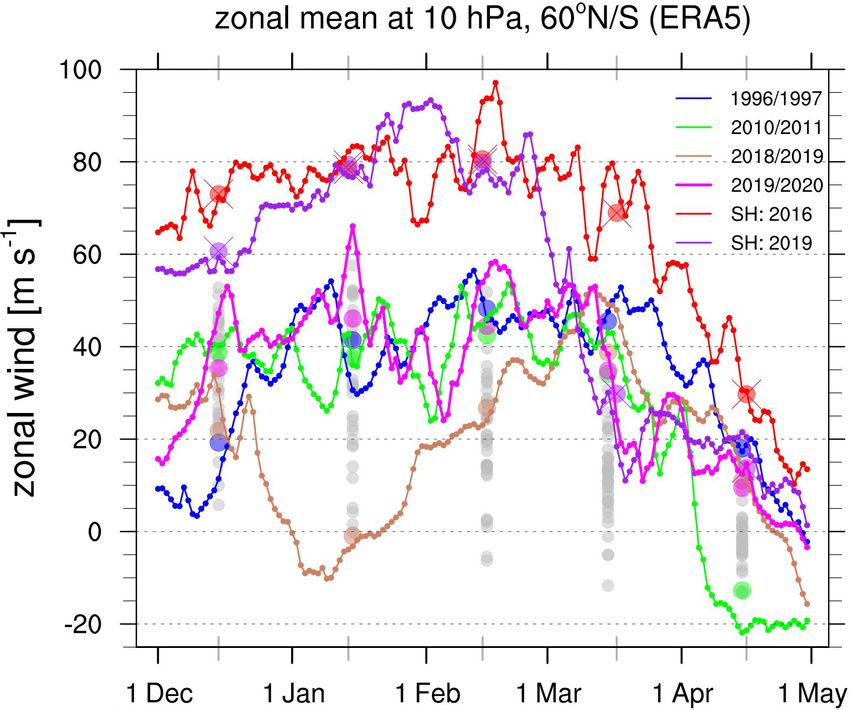
Figure 3. Daily (lines) and monthly (dots; in the center of each higher TOC values outside. Respective ozone data are avail-
month) mean zonal mean zonal wind (in m s−1 ) at 10 hPa (about able at http://www.temis.nl/uvradiation/UVarchive/stations_
30 km altitude): the Northern Hemisphere winters 1996/1997, uv.html (last access: 13 January 2021; van Geffen et al.,
2010/2011, 2018/2019, and 2019/2020 at 60◦ N from 1 Decem-
2017) and also available at https://woudc.org/data/explore.
ber to 30 April based on ERA5 data are displayed in blue, green,
brown, and magenta (lines and dots); the Southern Hemisphere win-
php (last access: 13 January 2021) and at https://www.ndacc.
ters 2016 and 2019 at 60◦ S from 1 June to 1 November (attention: org (last access: 13 January 2021; see also Wohltmann et al.,
the respective data are shifted by 6 months) based on ERA5 data 2020 and Bernhard et al., 2020). After mid-February, low
are displayed in red and purple (lines and dots with crosses). Ad- TOC values inside the polar vortex can be identified also
ditional monthly means for the Northern Hemisphere winters from in the TROPOMI data (not shown), which is indicated by
1979/1980 to 2019/2020 are shown as grey dots in the center of a strong horizontal ozone gradient in the vicinity of the polar
each month. For simplicity, the leap day in 2020 (29 February) was jet with the strongest zonal winds.
neglected in the daily time series. Remarkable deviations from normal Arctic conditions
were found starting in early March 2020 until early April,
when low TOC values in the north polar region were detected
ples occurred in early December 2019 (3 and 4 December), (magenta line in Fig. 8): the long period of unusually low
the beginning of January 2020 (4–8 January), and the end TOC started in early March 2020, falling below 220 DU for
of January (25–27 January). Ozone mini-holes are synoptic- the first time on 2 March, and continued with similarly low
scale features (with a high-pressure system in the troposphere TOC – including a period of 8 consecutive days with mini-
below the stratospheric polar vortex, i.e., a low-pressure area) mum TOCs below 220 DU – until 7 April. For the first time
with significantly reduced TOC values. It is well understood TOC values near or below 220 DU unrelated to ozone mini-
that ozone mini-holes primarily result from dynamical pro- hole events were observed for a period of about 5 weeks,
cesses (e.g., Millán and Manney, 2017). The positions of the corresponding to new record low values for this time of
mini-holes correlate well with minima of potential vorticity the year. The maximum area with TOC below 220 DU was
near the tropopause (Peters et al., 1995; James and Peters, 0.9 million km2 (= 0.9 × 10¹² m2 ) on 12 March (Fig. 1). For
2002). Hoinka et al. (1996) found that about 50 % of short- 12 March, the size of the polar vortex is 21.75 million km2
term TOC fluctuations in the NH can be explained by vari- (Fig. 2). This is in the order of 4 % of the polar vortex area
ations of the tropopause pressure (see also Manney et al., at the 475 K isentropic surface inside the 36 PV unit con-
2011). Furthermore, Steinbrecht et al. (1998) showed that an tour (Wohltmann et al., 2020). In comparison with corre-
increase of tropopause height by 1 km is connected with a re- sponding values of a typical ozone hole in the Antarctic (here
duction of TOC by 16 DU. Figure 8 illustrates that such mini- 2016; Fig. 8, red line; Fig. 9d) the area of low TOC (below
hole events occur regularly (the lower light grey line) during 220 DU) is much smaller, and the minimum TOC is clearly
NH winter. The ozone mini-holes very commonly develop higher. The Antarctic ozone hole in spring 2016 showed min-
in the North Atlantic region and then often drift eastward imum TOC clearly below 150 DU, and TOC values below
towards northern Europe within a few days (James, 1998). 220 DU were found for a period of about 4 months. The
This was also the case for the three examples seen in win- maximum area of the ozone hole was in the order of 20 mil-
ter 2019/2020, with minimum TOC found over northern Eu- lion km2 (Fig. 9d). Even the maximum area of record low
rope (not shown). Since the polar vortex already existed in TOC values (below 220 DU), detected in the Arctic in spring
late November and early December 2019 (Lawrence et al., 2020 (Fig. 9a), is just about 10 % of the exceptionally small
2020) with lower than usual TOC, the ozone mini-hole, for Antarctic ozone hole observed in SH spring 2019; see War-
Atmos. Chem. Phys., 21, 617–633, 2021 https://doi.org/10.5194/acp-21-617-2021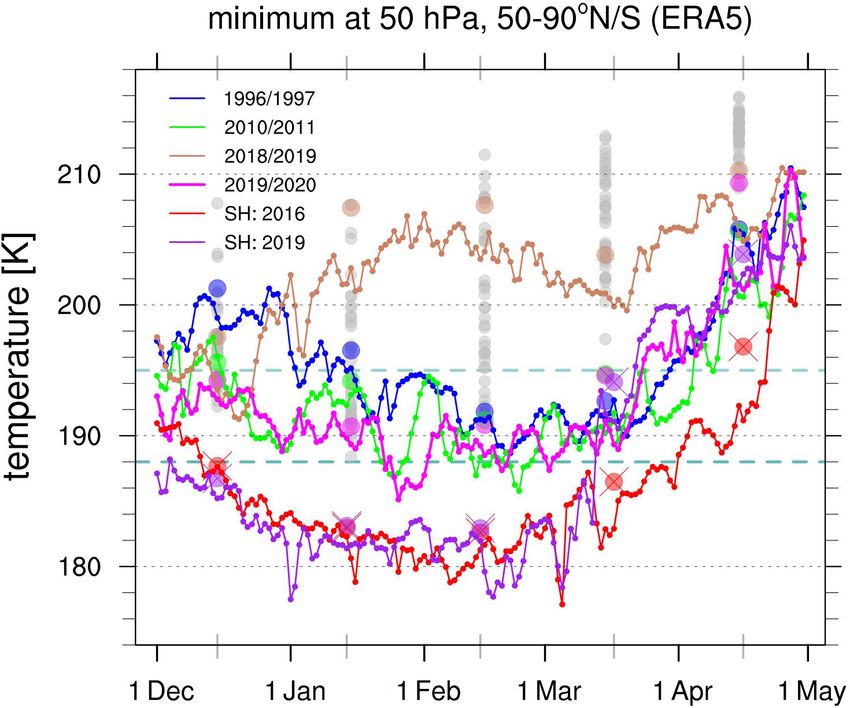
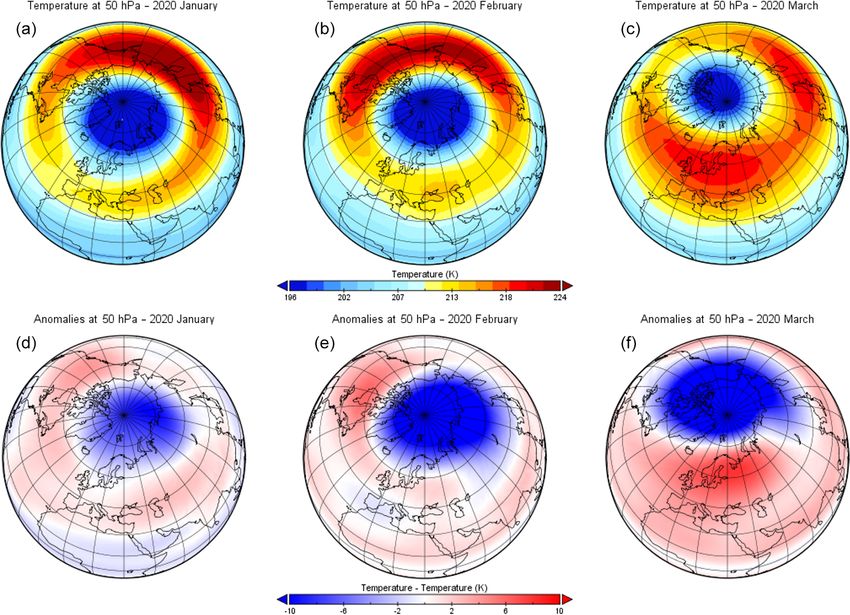
M. Dameris et al.: Record low ozone values over the Arctic                                                                        623

Figure 4. ERA5 monthly mean wind at 10 hPa (about 30 km altitude), showing a strong vortex in the north polar region, with speeds of up
to 118, 103, and 89 m s−1 for January to March 2020 respectively.

Figure 5. ERA5 monthly mean temperature at 50 hPa (about 20 km altitude) for January to March (columns 1 to 3) for year 2020 (a–c) and
the corresponding temperature anomalies (d–f) with respect to the average from 1979–2019, showing negative differences of up to −9.93 K
in January, −18.44 K in February, and −23.83 K in March 2020.

https://doi.org/10.5194/acp-21-617-2021                                                   Atmos. Chem. Phys., 21, 617–633, 2021
624 M. Dameris et al.: Record low ozone values over the Arctic
Figure 8. Annual cycle of the minimum total column ozone val-
ues (in Dobson Units, DU) in the north polar region between 50
Figure 6. Minimum values of daily (lines) and of monthly (dots; in and 90◦ N and in the south polar region between 50 and 90◦ S
the center of each month) mean temperatures (in K) at 50 hPa (about derived from the European satellite data record GOME-type To-
20 km altitude): the Northern Hemisphere winters 1996/1997, tal Ozone Essential Climate Variable (GTO-ECV) from July 1995
2010/2011, 2018/2019, and 2019/2020 for 50–90◦ N from 1 De- to June 2019 and TROPOMI data from July 2019 to April 2020.
cember to 30 April based on ERA5 data are displayed by blue, The thick black line shows the GTO-ECV mean annual cycle in the
green, brown, and magenta (lines and dots); the Southern Hemi- north polar region, with the lowest ozone values in the fall season
sphere winters 2016 and 2019 for 50–90◦ N from 1 June to (October, November) and the highest ozone values in late spring
1 November based on ERA5 data are displayed in red and pur- (April, May). The thin black lines indicate the maximum and mini-
ple (lines and dots with crosses). The Southern Hemisphere data mum values for the complete time period of satellite measurements
are shifted by 6 months. Additionally, the minima of the monthly starting in 1995. The light grey shading denotes the 10th percentile
mean temperature data for the Northern Hemisphere winters from and the 90th percentile, and the dark grey shading denotes the 30th
1979/1980 to 2019/2020 are shown as grey dots in the center of percentile and the 70th percentile, respectively. The magenta line
each month. For simplicity, the leap day in 2020 (29 February) was shows the minimum values for the TROPOMI total ozone in the
neglected in the daily time series. The dashed dark green horizon- 2019/2020 season. The blue and green lines show the minimum
tal lines at 195 and 188 K mark the thresholds for the formation of values for the total ozone in the years 1996/1997 and 2010/2011,
NAT-PSCs and ice PSCs, respectively (see text). respectively. For comparison, the annual cycle of the minimum to-
tal column ozone values in the south polar region is shown in the
years 2016 (red line) and 2019 (purple line). The Southern Hemi-
sphere data are shifted by 6 months.
gan et al. (2020), who reported an ozone hole area of roughly
5–10 million km2 during September and October 2019 (see
also Fig. 9e).
4 Situations in Northern Hemisphere winter and
spring 1996/1997 and 2010/2011
There are two other prominent spring seasons in the NH,
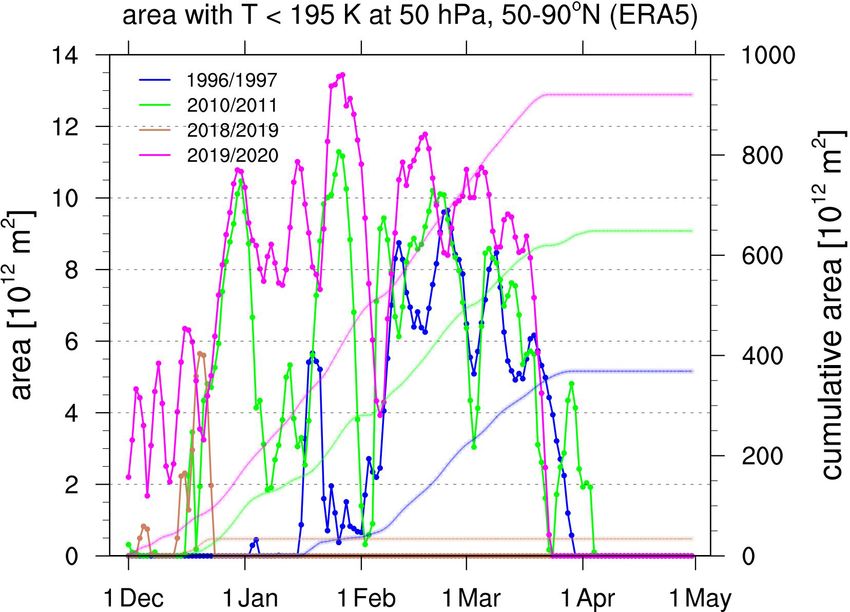
Figure 7. Daily area (in 1012 m2 ) with temperature less than 195 K which showed similarly strong and cold stratospheric po-
at 50 hPa (about 20 km altitude) in the region 50–90◦ N from 1 De- lar vortices. In particular, comparable dynamical conditions
cember to 30 April based on ERA5 data (solid lines). Daily cumu- in the NH stratosphere were observed in February and
lative values are indicated as faint lines. The Northern Hemisphere March 1997 (e.g., Coy et al., 1997; Manney et al., 1997;
winters 1996/1997, 2010/2011, 2018/2019, and 2019/2020 are dis- Lefèvre et al., 1998; Hansen and Chipperfield, 1999) and
played by blue, green, brown, and magenta lines, respectively. For 2011 (e.g., Manney et al., 2011; Sinnhuber et al., 2011; Kut-
simplicity, the leap day in 2020 (29 February) was neglected in the tippurath et al., 2012; Hommel et al., 2014). We note that
daily time series. the characteristics of the polar vortex – which in turn have
direct or indirect consequences for the TOC, either by chem-
ical ozone depletion or (meridional) transport of air masses –
Atmos. Chem. Phys., 21, 617–633, 2021 https://doi.org/10.5194/acp-21-617-2021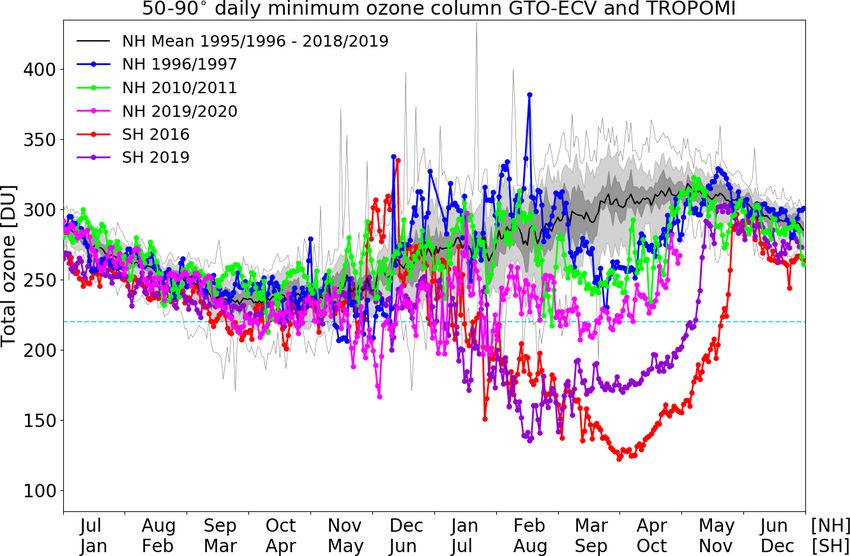
M. Dameris et al.: Record low ozone values over the Arctic                                                                      625

Figure 9. Monthly mean total ozone columns over the Northern Hemisphere in March 1997 (a), 2011 (b), and 2020 (c) and the Southern
Hemisphere in October 2016 (d) and 2019 (e). The plot for March 1997 is based on GOME/ERS-2 data with a limited spatial sampling,
which induces the orbit structures on the monthly mean values; the plots from 2011 and 2016 are based on GTO-ECV; and the plots from
2019 and 2020 are based on TROPOMI/S5P. Grey areas near the poles indicate missing data during polar night.

vary in different NH winters (e.g., Petzoldt, 1999; Tegtmeier       ional transport was enhanced in 1997 because the polar vor-
et al., 2008; see also Manney et al., 2011).                        tex was weaker in December and January (Manney et al.,
   In Fig. 3 the temporal evolution of the two stratospheric        2011).
polar vortices in the NH in 1996/1997 (blue line) and                  In all 3 years, February and March dynamical conditions
2010/2011 (green line) is indicated by the zonal mean zonal         led to low stratospheric temperatures in the polar cap region
wind speed at 60◦ N, 10 hPa. In comparison with the dynami-         (50–90◦ N). The temporal evolution of the observed daily
cal situation in January, February, and March 2020 (magenta         minimum temperatures at 50 hPa is shown in Fig. 6. The
line in Fig. 3), the respective time periods in 1997 and 2011       minimum temperatures were below the threshold tempera-
also showed a persistent polar vortex with high zonal wind          ture for the formation of NAT-PSCs (195 K) in February and
speeds, which reached values of up to more than 50 m s−1 .          March of all 3 years. Minimum temperatures at 50 hPa in
These values are higher than the long-term mean values,             December 2019 and January 2020 most of the time were
which show an increase up to 40 m s−1 until the beginning of        slightly lower than the minimum temperatures in Decem-
January and a decrease thereafter (see also Fig. 1 in Lee and       ber/January 2010/2011. In turn, the minimum temperatures
Butler, 2020). While the temporal evolution of the dynami-          in December/January are clearly higher in 1996/1997 than
cal situation in Arctic spring 2011 was very similar to that        in 2010/2011 and 2019/2020. The minimum values of the
of 2020 with a persistent polar vortex and high zonal wind          monthly mean temperatures are given in Table 1, indicating
speeds until mid-March, the period of strong zonal winds            low temperatures in December 2019 and January and Febru-
in 1997 continued until April. The polar vortex in Decem-           ary 2020 (see also the colored dots in Fig. 6).
ber 1996 was weak, and therefore polar temperatures were               A series of studies published in the past highlight the dif-
relatively high (higher than 195 K; see next paragraph). The        ferences of the two winters 1996/1997 and 2010/2011, in par-
evolution of the winter vortices in December 2010 and 2019          ticular regarding polar chemical processes (e.g., Manney et
is similar, reaching zonal wind speeds of about 40 m s−1 in         al., 2011; Kuttippurath et al., 2012; Chap. 3 in WMO, 2014).
mid-December. Similar values were shown by Lawrence et              Severe chemical ozone loss was observed in spring 2011
al. (2020), who looked at MERRA-2 data. In this context,            (Manney et al., 2011). In spring 1997 the chemical ozone loss
Manney et al. (2011) showed that in 2011 the meridional             was only moderate (Manney et al., 1997; Tegtmeier et al.,
transport was weak at the edge of the polar vortex (i.e., a         2008). The most important reason according to these studies
strong barrier) throughout the winter. Less ozone was trans-        was the late development of the polar vortex and late drop
ported from lower latitudes to higher latitudes. The merid-         of temperatures below PSC thresholds in winter 1996/1997

https://doi.org/10.5194/acp-21-617-2021                                                 Atmos. Chem. Phys., 21, 617–633, 2021
626                                                                 M. Dameris et al.: Record low ozone values over the Arctic

Table 1. Minimum temperatures (in kelvin) of the polar cap region (50–90◦ N) at 50 hPa (about 20 km altitude) based on the monthly mean
temperatures from ERA5 in December, January, February, and March of 1996/1997, 2010/2011, and 2019/2020 and the long-term mean
values (1979/1980–2019/2020), respectively.

                             Min. temp. 50 hPa                 December     January   February    March
                             1996/1997                             201.3      196.5       191.8    192.7
                             2010/2011                             195.6      194.2       191.2    194.7
                             2019/2020                             194.3      190.7       190.8    194.6
                             Long-term means (1979/1980–           197.0      195.6       199.5    205.5
                             2019/2020)

(see also Table 1 and Figs. 6 and 7). Recent studies found            Fahey et al., 1990; Rex et al., 1999; Pommereau et al., 2018).
that the maximum ozone loss in spring 2020 was similar to             Manney et al. (2020) analyzed the data of the spaceborne
that of spring 2011 (e.g., Manney et al., 2020; Wohltmann et          Microwave Limb Sounder (MLS) instrument, indicating that
al., 2020; Grooß and Müller, 2020). These papers also found           denitrification was stronger in 2020 than in 2011. Further, in
that TOC values were lower in 2020 because chemical loss              Manney et al. (2011) it was shown that denitrification was
started earlier and because of less horizontal mixing due to a        clearly stronger in 2011 than in 1997.
permanent strong vortex.                                                 The seasonal evolution of minimum TOC values north
   As demonstrated in Fig. 7, the daily areas with tem-               of 50◦ N between July 1996 and June 1997 (blue line in
peratures below 195 K at the 50 hPa pressure level are                Fig. 8) and between July 2010 and June 2011 (green line
obviously larger in 2019/2020 (magenta line) than in                  in Fig. 8) indicates normal or slightly enhanced ozone val-
1996/1997 (blue line) and 2010/2011 (green line). In par-             ues until February with respect to the long-term mean value
ticular, the cumulative areas with temperatures below 195 K           (thick black line in Fig. 8). The long-term mean value is
at 50 hPa are markedly different: whereas in 2019/2020 the            based on satellite observations from 1995 to 2019. Typical
cumulative area was about 920 × 1012 m2 , in 1996/1997                features of a strong polar vortex can be observed in Febru-
it was about 370 × 1012 m2 , and in 2010/2011 it was                  ary 1997 and February 2011, with low TOC values in the
about 650 × 1012 m2 . Furthermore, in the last week of Jan-           polar vortex and relatively high TOC values in the collar re-
uary 2020 the temperatures at 50 hPa went below 188 K (ma-            gion of the polar vortex (not shown). Around the beginning
genta line in Fig. 6), the typical ice PSC threshold (PSC             of March 1997 and March 2011 the TOC values declined,
type 2, ice PSCs; see, for instance, Fig. 4-1 of Chap. 4              and low TOC values were detected in both years until early
in WMO, 2018). The maximum daily area with tempera-                   April. In spring 1997 the dynamical conditions led to fre-
tures below 188 K at 50 hPa was 2.8 × 10¹² m2 on 30 Jan-              quent ozone mini-holes (Coy et al., 1997) and to a higher
uary, and the cumulative area with temperatures below                 tropopause that obviously contributed to lower TOC values
188 K at 50 hPa reached its maximum of 18 × 1012 m2 on                via dynamical processes (Manney et al., 2011).
2 March 2020. While the threshold for ice PSCs was not                   Figure 9a–c show the TOC monthly means for
reached in 1996/1997, in 2010/2011 the cumulative area with           March 1997, 2011, and 2020. Low TOC values over
temperatures below 188 K at 50 hPa was estimated to be                the polar cap can be seen in all three cases. The lowest
4.3 × 10¹² m2 .                                                       Arctic TOC values are detected in boreal spring 2020. In
   To summarize, in all 3 years the temperatures in the               spring 1997 and 2011 TOC values below 220 DU were not
lower stratosphere in February and March were in a sim-               detected over larger areas and over several consecutive days.
ilar range, showing colder conditions than usual. Decem-              The monthly mean minimum TOC value for March 2020,
ber 2019 and January 2020 were also clearly colder than               which is 221 DU, is much lower compared to the monthly
the long-term mean conditions (Table 1). Winter 2019/2020             mean minimum TOCs for March 1997 (267 DU) and for
showed a larger area below the formation temperature of               March 2011 (252 DU). The temporal evolution of minimum
PSCs than the other two NH winters for an extended pe-                Antarctic TOC values south of 50◦ S (the red and purple
riod of time (see Fig. 7). Permanent presence of PSCs over            line in Fig. 8 for 2016 and 2019, respectively) and the TOC
about 4 months enabled efficient chlorine activation. Addi-           monthly means for October 2016 and 2019 (Fig. 9d and e)
tionally, PSCs supported strong denitrification of the lower          show that the size and strength of the Antarctic ozone hole
stratosphere by irreversible removal of total reactive nitro-         are much larger than the corresponding values detected for
gen (NOy ), in particular HNO3 , by uptake of NOy on the              the Arctic in spring 2020.
surface of PSCs, followed by sedimentation of PSC parti-
cles (Fahey et al., 1990). This ultimately enabled a period of
chemical ozone depletion that was longer than usual (e.g.,

Atmos. Chem. Phys., 21, 617–633, 2021                                                    https://doi.org/10.5194/acp-21-617-2021
M. Dameris et al.: Record low ozone values over the Arctic 627
5 Discussion in the last 65 years and that it showed an exceptionally per-
sistent strong polar vortex.
The stratospheric dynamical conditions were completely
In recent decades, Arctic and Antarctic winter and early different in the NH winter 2018/2019 (brown line in Fig. 3)
spring TOC variability reflects in large parts the natural fluc- compared to 2019/2020 (magenta line in Fig. 3). In NH win-
tuations of the stratospheric dynamics of the respective hemi- ter 2018/2019 a sudden major stratospheric warming event
spheres (e.g., Chap. 4 in WMO, 2018). In particular, dy- began in late December 2018. This strong disturbance of the
namical conditions of the NH stratosphere at higher lati- polar vortex by planetary waves led to a pronounced warm-
tudes in winter can range from a very disturbed polar vortex ing of the lower stratosphere (e.g., Lee and Butler, 2020),
(i.e., by strong planetary wave activity), which could lead to indicating minimum temperatures in the polar cap region at
high stratospheric temperatures, to conditions with a persis- 50 hPa, which were clearly above the threshold for the for-
tent strong polar vortex (i.e., by low planetary wave activ- mation of NAT-PSCs (195 K) for the complete winter season
ity), which could create low stratospheric temperatures (e.g., (brown line in Fig. 6). Consequently, TOC values similar to
Chap. 4 in WMO, 2018). the long-term mean in the Arctic region were found from late
The NH winter season of 2019/2020 presented a situation winter to early spring (not shown).
with significantly suppressed meridional air mass exchange The SH spring seasons of 2002 and 2019 provide two addi-
and transport into the polar vortex area in combination with tional examples of the importance of stratospheric dynamics
enhanced ozone depletion by heterogeneous chemical pro- in the development of low TOC values. In September 2002
cesses inside the polar vortex (Manney et al., 2020), which a sudden major stratospheric warming in connection with a
causes a clear reduction of TOC. Winter 2019/2020 shows an breakdown of the polar vortex was detected, which led to a
extraordinary dynamical situation, with an unusual persistent split of the ozone hole (Sinnhuber et al., 2003; Allen et al.,
strong and cold polar vortex over the season compared to the 2003; Hoppel et al., 2003; Stolarski et al., 2005). In Septem-
last 4 decades (the period of the ERA5 data set used in this ber 2019 the polar vortex was also significantly disturbed
study). There is some evidence that a similar dynamical event (Wargan et al., 2020; Lim et al., 2020; see purple lines in
did not occur in the period from 1955 to 1980, i.e., before the Figs. 3 and 6). The minimum TOC values in the Antarctic
starting point of our analyses based on ERA5. An analysis of were noticeably higher in 2019 than in previous years (War-
historical data was provided by the Stratospheric Research gan et al., 2020; see the purple line in Fig. 8). Nevertheless, it
Group at FU Berlin. In Labitzke and Naujokat (2000) it was is obvious that the small ozone hole in Antarctic spring 2019
stated that “the spring of 1997 was the coldest within our se- is still much larger than the area with record low TOC values
ries of 45 winters”; the Berlin time series ranges from 1955 detected in Arctic spring 2020 (see also Fig. 9).
to 2000. Among others, they compared the monthly mean The Arctic observations in winter and spring 2019/2020
North Pole temperatures at 30 hPa in all years and found that are consistent with our expectation that Arctic ozone reduc-
February 1997 (190 K) and March 1997 (194 K) were clearly tions in spring are largest after stratospheric winters with a
colder than all other years. The second coldest spring was strong, circular polar vortex in connection with low polar
detected in 1967 (February: 195 K; March: 201 K). Temper- lower stratospheric temperatures (Chap. 4 in WMO, 2018).
atures in January 1997 were near the climatological mean However, as can be seen in Fig. 6, the temperatures in the
value. This suggests that the dynamical situation of winter Antarctic are considerably lower than in the Arctic (even
and spring 2019/2020 has stood out since the beginning of for 2019/2020), and the period of low temperatures is much
the monitoring of the stratosphere in the 1950s. Although the longer in the Antarctic. As a result, the record low Arctic
historical Berlin data set does not have the same quality as TOC values are much higher than the TOC values observed
ERA5, it is suitable for a qualitative evaluation of the respec- in the Antarctic. This is also the case for the small ozone hole
tive dynamical situations of NH winter and spring seasons. in Antarctic spring 2019, as indicated in Fig. 8.
Lawrence et al. (2020) looked at the Japanese Meteorologi- The dynamical conditions in the Arctic stratosphere in
cal Agency’s 55-year reanalysis (JRA-55), which goes back February and March 2020 were similar to the conditions in
to winter 1958/1959. Based on the zonal mean zonal wind early spring 1997 and 2011. All 3 years showed low TOCs in
at 60◦ N, 10 hPa, they found that winter 2019/2020 ranked March (Fig. 8). Minimum TOC values were below 220 DU
third. The two winters of 1966/1967 and 1975/1976 (which for several days in March 2020, which was not the case
are indicated as moderate cold winters in the Berlin analysis) for March 1997 nor 2011, although the stratospheric chlo-
were the strongest on record with respect to the zonal mean rine content was higher in 1997 (about 15 %) and slightly
wind (mean from December to March). The slightly different higher in 2011 (Chap. 1 in WMO, 2018). Especially in De-
order regarding record years indicates that the results depend cember 2019 and January 2020 the area of temperatures be-
on the considered meteorological variable as well as the alti- low 195 K in the lower stratosphere was larger than in the
tude and latitude region. It is clear that the data before 1980 two other years discussed here (see Fig. 7). In 2019/2020
(pre-satellite era) are more uncertain. Nevertheless, it is ob- the minimum polar cap temperatures at 50 hPa were below
vious that winter 2019/2020 was one of the coldest winters 195 K (the threshold for formation of NAT-PSCs) in Decem-
https://doi.org/10.5194/acp-21-617-2021 Atmos. Chem. Phys., 21, 617–633, 2021628 M. Dameris et al.: Record low ozone values over the Arctic ber, January, February, and the beginning of March (Fig. 6). recovery instead of delaying it (see also Chaps. 3 and 4 in In this context, Manney et al. (2020) identified an activa- WMO, 2018). Since the changes of stratospheric temperature tion of chlorine already in the beginning of December. The are affected not only by radiative cooling due to enhanced daily areas allowing for the formation of PSCs at 50 hPa greenhouse gas concentrations, but also by atmospheric cir- were clearly larger in 2019/2020 in comparison with the win- culation changes (e.g., Langematz et al., 2014), the quanti- ters 1996/1997 and 2010/2011. This finding is in line with tative determination of the net effect on ozone still remains the results presented by Lawrence et al. (2020). The ERA5 a challenge. Furthermore, model calculations by Waibel et data set also indicates minimum temperature values in win- al. (1999) more than 20 years ago showed that higher degrees ter 2019/2020, which were slightly above or below 188 K for of Arctic denitrification in future, related to stratospheric a week (in particular at the end of January 2020), providing cooling by enhanced greenhouse gas concentrations, could conditions for the formation of ice PSCs (see also Manney et lead to larger seasonal ozone depletion despite the projected al., 2020). decline in inorganic chlorine. The observed minimum TOC values in March 2020, with Finally, based on our current knowledge, we deem it un- new low TOC records for the NH polar cap, are related to likely that the observed enhanced CFC-11 emissions in re- substantial ozone depletion in spring (Manney et al., 2020; cent years (Montzka et al., 2018) have significantly influ- Wohltmann et al., 2020). Since the polar vortex in winter and enced the strength of ozone depletion in the NH in 2020 spring 2019/2020 provided continuous conditions for the for- (Dameris et al., 2019; Fleming et al., 2020; Keeble et al., mation of PSCs, significant denitrification of the stratosphere 2020). occurred (Manney et al., 2020). This contributed to the 5- week period of significant TOC reduction by an extended phase of active stratospheric chlorine (Manney et al., 2011). 6 Conclusions Here, we note again that 2020 also started with lower base values of TOC (inside the polar vortex; see Fig. 8), which This study presents a description of the NH winter and might have been caused by a reduced meridional transport of spring season 2019/2020 and considers the dynamical sit- ozone from lower to higher latitudes due to the strong polar uation of the stratosphere and the evolution of the ozone vortex during this winter. This might have also contributed layer in the Arctic region. Record low TOC values around to the fact that the spring TOC values in the Arctic region in 220 DU were detected over a large area (up to 0.9 mil- 2020 were clearly lower than those found in 1997 and 2011. lion km2 ) as well as for an extended time period (of about Record low stratospheric ozone values over the Arctic in 5 weeks). The situation in 2019/2020 is compared with other 2020 are not an unequivocal result of climate change. The dy- years which showed similar stratospheric dynamics in spring. namical situations in February and March of 1997, 2011, and We have used recent meteorological data from ERA5 and 2020 were similar. The cold stratosphere in December 2019 TOC data from GTO-ECV (based on the satellite sensors and January 2020 as a single event does not point towards GOME/ERS-2, SCIAMACHY/ENVISAT, OMI/Aura, and climate change due to increasing greenhouse gas concentra- GOME-2/MetOp) in combination with recent TOC data from tions. The NH winter 2019/2020 is a perfect showcase for a TROPOMI (on board Sentinel-5P). The detected Arctic area NH winter with low planetary wave activity and for a per- of record low TOC values is much smaller in comparison sistent strong vortex with low temperatures. This could be with a typical Antarctic ozone hole, which is of the order a sign of climate change if similar conditions were to occur of about 20 to 25 million km2 from early September until more regularly in the next years. Although the stratosphere mid-October and shows TOC values below 220 DU for up is cooling due to increasing greenhouse gas concentrations to about 4 months (WMO, 2018). The Arctic TOC observa- (Maycock et al., 2018; Steiner et al., 2020), consequences tions in spring 2020 were extraordinary because TOC values for stratospheric dynamics, particularly in winter and ozone below 220 DU were not observed in previous years over a depletion in spring, are still under debate (e.g., Bednarz et period of 5 weeks in the Arctic. The persistent strong polar al., 2016; Ivy et al., 2016; Pommereau et al., 2018). For in- vortex in 2019/2020 (from mid-December to early April) led stance, the empirical quantification of the relation between to particularly cold stratospheric conditions throughout the winter–spring loss of Arctic ozone and changes in strato- complete winter and early spring season, which likely sup- spheric climate by Rex et al. (2004) showed that cold (NH) ported enhanced ozone depletion compared to other years winters may possibly get colder in the future. The investiga- (Manney et al., 2020; Wohltmann et al., 2020). The special tions by Wohltmann et al. (2020) seem to support this hy- dynamical situation in winter 2019/2020 is the cause for the pothesis. It is possible that the cooling of the (lower) strato- significant reduction of the TOC in spring 2020. sphere could delay the recovery of the ozone layer (Pom- We note that numerous studies of the 2019/2020 winter mereau et al., 2018). However, this statement is in contra- season can be found in a special issue of Geophysical Re- diction with results derived from chemistry–climate model search Letters and Journal of Geophysical Research: Atmo- predictions (e.g., Dhomse et al., 2018), indicating that cli- spheres (e.g., Manney et al., 2020; Wohltmann et al., 2020; mate change in the NH will accelerate stratospheric ozone Lawrence et al., 2020; Grooß and Müller, 2020; Inness et Atmos. Chem. Phys., 21, 617–633, 2021 https://doi.org/10.5194/acp-21-617-2021
M. Dameris et al.: Record low ozone values over the Arctic                                                                            629

al., 2020; Bernhard et al., 2020), which are based on ob-             DLR/BIRA/ESA. These data are used here, in particular with re-
servational, reanalysis, and modeling data. Our results agree         spect to Figs. 1, 8, and 9.
with these published studies about the Arctic winter season
2019/2020.
   If the regulations of the Montreal Protocol regarding the          Author contributions. MD structured and composed the paper.
prohibition of CFCs are strictly implemented, one can ex-             MD, DGL, MCE, and MN jointly analyzed the different data sets
pect a full recovery of the ozone layer including the polar re-       and compiled the results, including the preparation of the figures.
                                                                      MD, DGL, MCE, and MN contributed to the writing of the paper.
gions by the middle of this century (Chaps. 3 and 4 in WMO,
                                                                      MCE, DGL, CL, and MvR generated the GTO-ECV data in the
2018). In recent years, the beginning of ozone recovery has           ESA project Ozone_cci+ and the EU/ECMWF project C3S_312b.
already been detected (e.g., Solomon et al., 2016; Weber et           CL, FR, DGL, and MvR are responsible for the TROPOMI TOC
al., 2018). However, in winters with a cold and strong polar          Level 2 data in the ESA project S5P-MPC.
stratospheric vortex, a persistent region of low TOC might
also develop again in the NH in the future. The recovery of
the ozone layer and its interactions with climate change must         Competing interests. The authors declare that they have no conflict
be watched carefully, as discussed for instance by Dameris            of interest.
and Loyola (2011). Continued monitoring of stratospheric
ozone with a suite of instruments will be key to understand
the future development of Arctic ozone. This capability is            Acknowledgements. First, we would like to thank Birgit Hassler
crucial to allow for an evaluation of specific events in the          for an internal review of the first draft of the paper. We would like
light of the Montreal Protocol.                                       to thank the three referees for their helpful comments and sugges-
                                                                      tions. In particular we appreciate the personal commitment of Glo-
                                                                      ria Manney and Ingo Wohltmann, which helped to improve the pa-
Data availability. Meteorological data are based on ERA5              per. The NCAR Command Language (NCL, 2018) was used for
from ECMWF (https://cds.climate.copernicus.eu//#!/search?text=        data analysis and to create some of the figures in this study. NCL is
ERA5&type=dataset, last access: 1 October 2020; Copernicus            developed by UCAR/NCAR/CISL/TDD and is available online at
Climate Change Service, 2017), which is available at the Climate      https://doi.org/10.5065/D6WD3XH5 (NCL, 2018). CDO (Climate
Data Store (CDS). This work contains modified Copernicus              Data Operators; Schulzweida, 2019) was employed for processing
Climate Change Service information (Copernicus Climate Change         the data.
Service (C3S), 2017; Hersbach et al., 2018, 2019a). Neither the
European Commission nor ECMWF is responsible for any use that
may be made of the Copernicus information or data it contains.        Financial support. The work for this study was supported under
In particular, subsets, i.e., wind and temperature data, from the     the umbrella of the DLR-project MABAK (Innovative Methoden
pressure level data sets of monthly averaged data (Hersbach et        zur Analyse und Bewertung von Veränderungen der Atmosphäre
al., 2019a) and hourly reanalysis data (Hersbach et al., 2018)        und des Klimasystems). The work described in this paper has
have been used. Daily mean data are produced using hourly             also received funding from the ESA-projects “Ozone_cci” and
data on pressure levels and using CDO (Climate Data Operators;        “Ozone_cci+” (as part of the ESA Climate Change Initiative (CCI)
https://doi.org/10.5281/zenodo.2558193; Schulzweida, 2019)            program) and the Initiative and Networking Fund of the Helmholtz
command “daymean” to produce daily means from the hourly data.        Association through the “Advanced Earth System Modelling
Analogously, hourly PV data on isentropes from the full ERA5 data     Capacity (ESM)” project.
set (Copernicus Climate Change Service (C3S), 2017) have been
exploited and regridded to a regular grid using CDO. We thank         The article processing charges for this open-access
the ECMWF for producing ERA5 data and making them available           publication were covered by a Research
through the CDS. The data used contain modified Copernicus            Centre of the Helmholtz Association.
Climate Change Service information, in particular with respect to
Figs. 2–7 and Table 1. Please note that the data used here may also
contain “preliminary” ERA-5 data (see Hersbach et al., 2020).         Review statement. This paper was edited by Farahnaz Khosrawi
    The GTO-ECV Climate Research Data Package is available            and reviewed by Ingo Wohltmann, Gloria Manney, and one anony-
at http://cci.esa.int/ozone/ (last access: 13 January 2021; ESA,      mous referee.
2021); detailed information about this data record can be found at
https://doi.org/10.5194/amt-8-3923-2015 (Coldewey-Egbers et al.,
2015). This data source is used here, in particular with respect to
the preparation of Figs. 8 and 9.
    The (Level 2) TROPOMI total ozone column data (TROPOMI            References
OFFL TOC; Copernicus Sentinel-5P, 2018) are freely avail-
able at https://doi.org/10.5270/S5P-fqouvyz (see also https://        Allen, D. R., Bevilacqua, R. M., Nedoluha, G., Randall, C. E., and
s5phub.copernicus.eu/, last access: 18 May 2020; https://s5pexp.        Manney, G. L.: Unusual stratospheric transport and mixing dur-
copernicus.eu/, last access: 18 May 2020). This paper con-              ing the 2002 Antarctic winter, Geophys. Res. Lett., 30, 1599,
tains modified Copernicus Sentinel-5 Precursor data processed by        https://doi.org/10.1029/2003GL017117, 2003.

https://doi.org/10.5194/acp-21-617-2021                                                    Atmos. Chem. Phys., 21, 617–633, 2021
You can also read