Polar Capital Technology Trust plc Interim Results Presentation - Polar Capital Technology ...
←
→
Page content transcription
If your browser does not render page correctly, please read the page content below

Polar Capital Technology Trust plc
          Interim Results Presentation

          12 December 2019

          This presentation is for non-US investor use only
For non-USwww.polarcapital.co.uk
           investor use only. Please refer to the Important Information at the end of this presentation.   1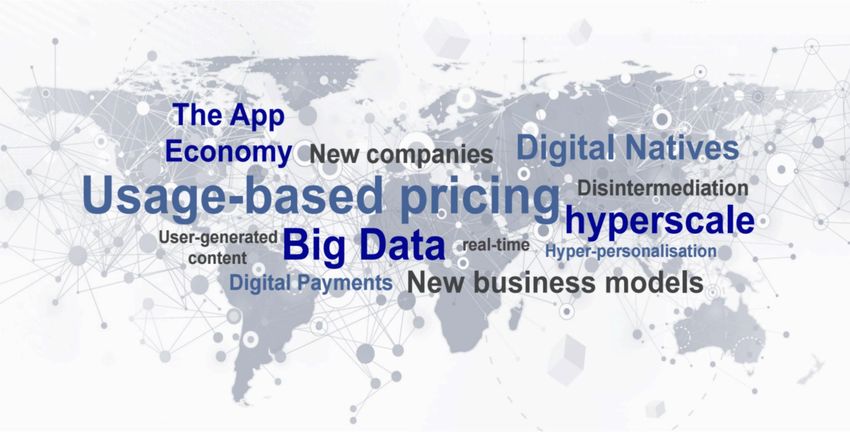
Results As At 31 October 2019

                                                                            Year ended                         As at
                                                                                                                            Change
                                                                             30/04/19                         31/10/19

  Net Assets                                                             £1,935,646,000                    £1,973,858,000   +2.0%

  NAV per ordinary share                                                       1446.40p                      1474.95p       +2.0%

  Price per ordinary share                                                     1354.00p                      1416.00p       +4.6%

  Benchmark Change                                                                                                          +4.7%

  Ordinary shares in issue                                                  133,825,000                     133,825,000     +0.0%

Source: Polar Capital, 31 October 2019.

For non-US investor use only. Please refer to the Important Information at the end of this presentation.                             2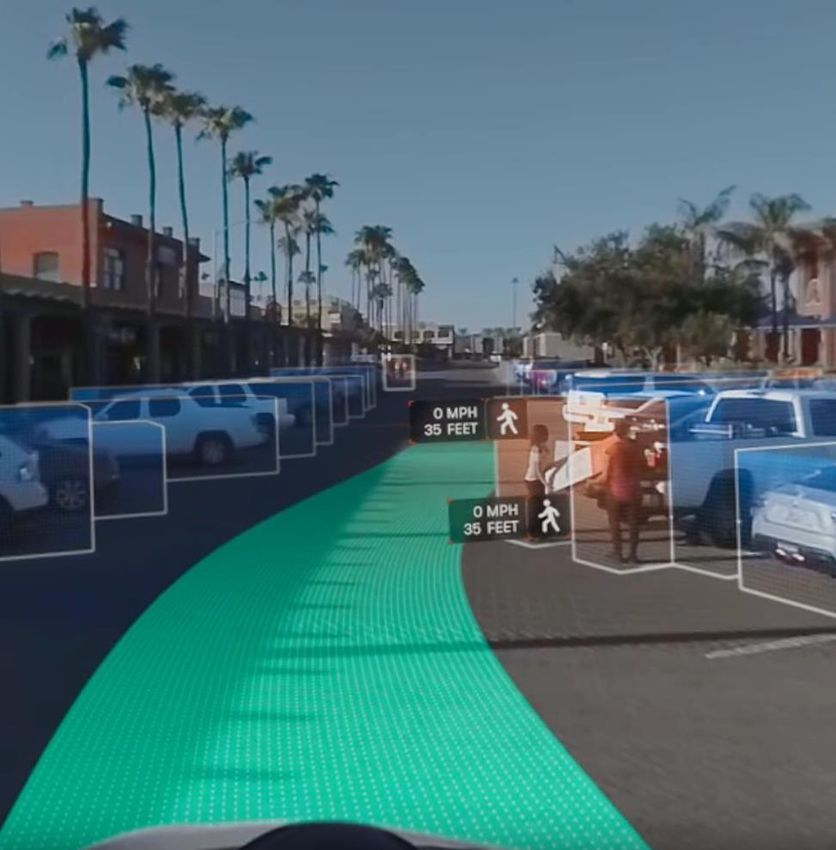
PCT As At 29 November 2019

                                                                            Year ended                         As at                     As at
                                                                                                                            Change
                                                                             30/04/19                         31/10/19                  29/11/19

  Net Assets                                                             £1,935,646,000                    £1,973,858,000   +2.0%    £2,074,526,000

  NAV per ordinary share                                                       1446.40p                      1474.95p       +2.0%      1550.18p

  Price per ordinary share                                                     1354.00p                      1416.00p       +4.6%      1498.00p

  Benchmark Change                                                                                                          +4.7%

  Ordinary shares in issue                                                  133,825,000                     133,825,000     +0.0%     133,825,000

Source: Polar Capital, 29 November 2019.

For non-US investor use only. Please refer to the Important Information at the end of this presentation.                                              3
Half Year Review

DJ World Technology vs. FTSE World TR since Apr 2019
                                                                                                            • Global equities (FTSE World + 4.6%) added to their
                                                                                                              post financial crisis gains despite downward pressure
                                                                                                              on global growth due to trade-war machinations that
                                                                                                              weighed on corporate confidence. This was
                                                                                                              ameliorated by central bank support, three US interest
                                                                                                              rate cuts, and hopes of a trade war détente. The US
                                                                                                              Dollar provided less of a tailwind to returns as Brexit
                                                                                                              fears receded following the announcement of a UK
                                                                                                              general election, allowing Sterling to regain its poise.

                                                                                                            • Technology stocks performed inline with the broader
                                                                                                              market (DJ World Technology Index +4.7% in Sterling
                                                                                                              terms). After a weak start, the sector regained its
                                                                                                              leadership status before being challenged by a rotation
                                                                                                              from ‘growth to value’ that began in July ahead of the
                                                                                                              first US interest rate cut since 2008.

Source: Bloomberg, Polar Capital. Chart shown as at 9 December 2019. Past performance is not indicative or a guarantee of future returns.

For non-US investor use only. Please refer to the Important Information at the end of this presentation.                                                                 4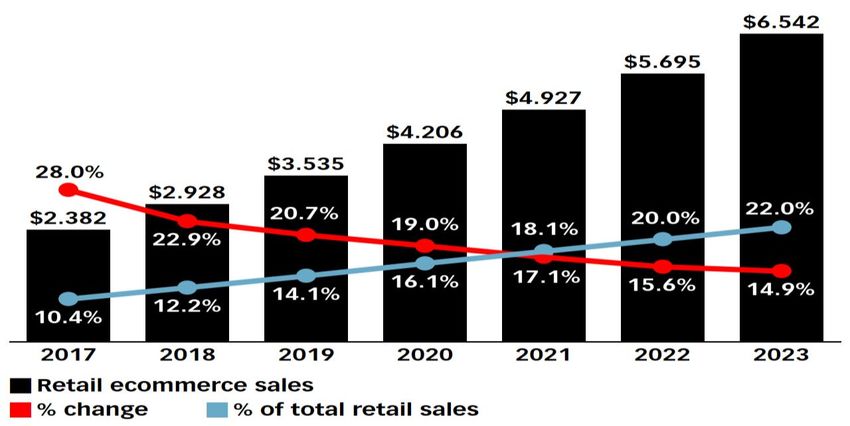
Half Year Review

Technology Performance by Geography: April 2019 - Present
                                                                                                            • Semiconductor stocks (SOX +8.1% in Sterling terms)
                                                                                                              delivered the strongest subsector returns, despite mixed
                                                                                                              fundamentals. In part, this reflected improvement at
                                                                                                              Apple and the smartphone supply-chain before and after
                                                                                                              the launch of the iPhone 11. Internet stocks had to
                                                                                                              contend with regulatory headwinds and an adverse
                                                                                                              narrative, despite continued growth at the key platforms.
                                                                                                            • Large-cap US technology companies outperformed
                                                                                                              small-caps by c.8% (+6.7% vs. -1.2% in Sterling terms).

                                                                                                            • NAV performance (+2.0%) trailed the benchmark by
                                                                                                              2.7%.
                                                                                                              – Positives: AMD, incumbent underperformance, select
                                                                                                                software stocks.
                                                                                                              – Negatives: Liquidity / NASDAQ puts, Apple, large-cap
                                                                                                                outperformance, ‘long duration’ weakness.

Source: Bloomberg, Polar Capital. Chart shown as at 9 December 2019. Past performance is not indicative or a guarantee of future returns.

For non-US investor use only. Please refer to the Important Information at the end of this presentation.                                                                  5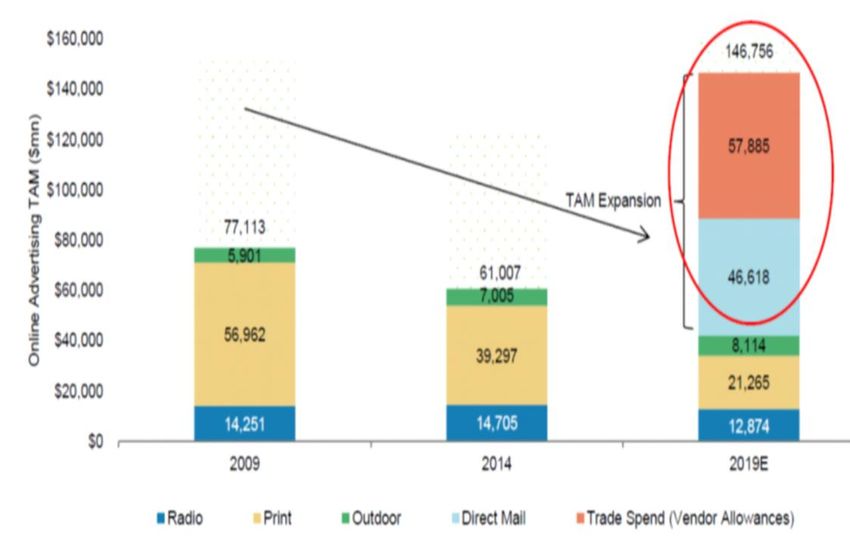
The Technology Team
• Technology is at the core of the Polar Capital business

• One of the largest technology franchises in Europe with c.US$6.6bn under management

• Nine dedicated technology specialists – strong multi-cycle track record

                                     Global Technology                                        Polar Capital Technology                                           Automation & AI
       Funds                                Fund                                                  Trust (LSE listed)                                                 Fund
                                         US$3.5bn                                                     US$2.7bn                                                      US$414m

                               Nick Evans                                                  Ben Rogoff                                                  Xuesong Zhao
                               Partner                                                     Partner                                                     Fund Manager/Analyst
                               Investment experience: 22 years                             Investment experience: 24 years                             Investment experience: 12 years

                               Sectors: US (small/mid-cap)                                 Sectors: US (mid/large-cap)                                 Sectors: Asia (all-cap), global
                                                                                                                                                       semi / Semi cap equipment

 Fund Managers
                                                             Fatima Iu (Maternity Leave)                                 Alastair Unwin
                                                             Fund Manager/Analyst                                        Fund Manager/Analyst
                                                             Investment experience: 13 years                             Investment experience: 8 years

                                                             Sectors: Europe (all-cap), security,                        Sectors: Global (all-cap) Payments,
                                                             networking, energy & med tech                               SMB software, IT services

                        Chris Wittstock (based in US)                         Bradley Reynolds                                    Paul Johnson                                           Nick Williams
                        Senior Investment Analyst                             Investment Analyst                                  Investment Analyst                                     Investment Analyst
                        Investment experience: 35 years                       Investment experience: 12 years                     Investment experience: 7 years                         Investment experience: 4 years
     Analysts
                        Sectors: US Technology/Software                       Sectors: US (all-cap) – Internet &                  Sectors: Emerging Tech inc.                            Sectors: Global (all-cap) –
                                                                              digital media                                       3D printing, gaming & autos                            A&AI Fund

Source: Polar Capital, 29 November 2019.

For non-US investor use only. Please refer to the Important Information at the end of this presentation.                                                                                                                  6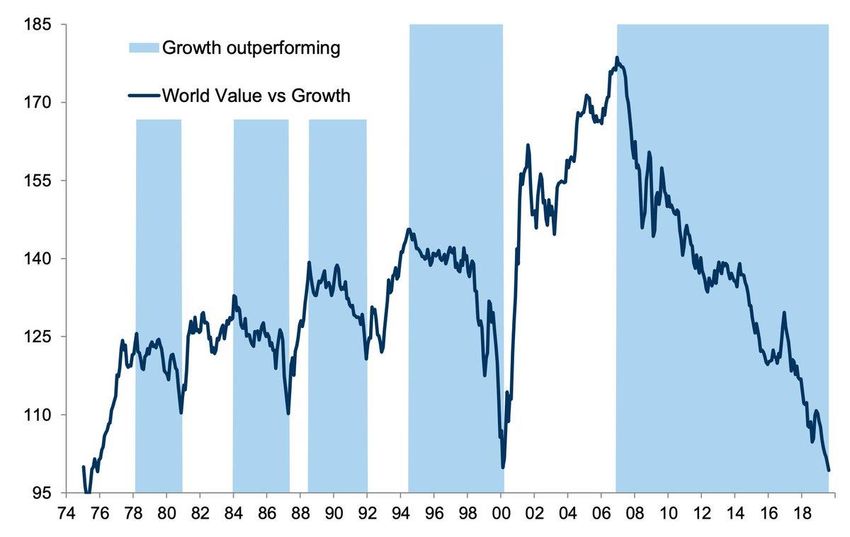
Investment Framework

                              4,000+ universe
                                                                                                                   Dynamic definition of technology
                                                                              Thematic overview                Real-world changes in user behaviour

                                                                                                                                   S-Curve inflections
                                                                              What we look for                            Secular themes / pure-plays

                                                                                                                             Last-generation winners
                                                                              What we avoid                                    Public venture capital

                                                                                                               Growth bias – rev/earnings / cash flow
                                                                              Valuation                    Price targets (bull/base/bear) / Risk reward

                                                                                                                             Bottom-up stock picking
                                                                              Portfolio construction                               Benchmark aware

                                                                                                                       Mis-execution / model change
                                                                              Sell disciplines                                 Price level attainment
                                     Portfolio

Source: Polar Capital.

For non-US investor use only. Please refer to the Important Information at the end of this presentation.                                                  7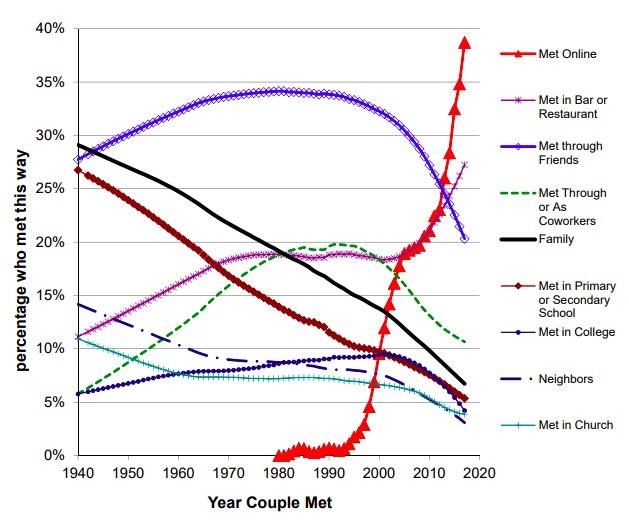
Thematic Investing: Hype vs. Reality
Polar Capital Global Technology Team
Searching for revenue growth and
cash flow inflections
Early stage
investors Index / ETF
R&D High growth Low growth No growth
Connected Home
negative OM% expanding OM% stable OM% uncertain / declining OM%
Deep Learning
Virtual Personal Assistants Machine Learning
Autonomous Vehicles
IoT Platform
Nanotube Electronics
Smart Robots Cognitive Computing
Edge Computing
Blockchain
Augmented Data Discovery
Commercial UAVs (Drones)
Smart Workforce
Conversational
Brain Computer Interface User Interface Cognitive Expert Advisors Developed market smartphones
Volumetric Displays
Wireless Networking (802.11n / ac) Enterprise software
IT Services
“Value Trap”?
Quantum Computing Server & Storage Virtualisation
Tablets / Ultrabooks (including Mac Air) LCD TV / HDTV
Digital Twin eCommerce / online advertising
Notebooks
Mobile broadband (4G / LTE)
Expectations
Home Broadband
Serverless PaaS EM smartphones & Ecommerce/Internet
PVR/DVR (Sky+)
Multiplayer / mobile gaming / streaming media
Sales
5G ERP / Traditional software
Moore’s stress / rising semi capital intensity
Smart agriculture / factory automation / robotics Feature phones / 3G
Human Augmentation
Software as a Service (SaaS)
Enterprise Taxonomy and Mainframe
Neuromorphic Hardware Enterprise SSD / 64 bit ARM architecture
Ontology Management Cloud computing (public/private – PaaS/IaaS) Desktop PC / printers
Virtual Reality
Deep Reinforcement Cyber security / app control / IPS
PND/GPS
Learning Big data / predictive analytics / Hadoop
Voice over LTE / WiFI (VoLTE / VoWiFI) Digital Camera (DSC)
Artificial General Software Defined Security
4D printing Intelligence Mobile / social / location based advertising DVD
Augmented Reality Mobile payments / mCommerce / NFC / biometrics VCR
Internet of Things (IoT) / M2M communication
Software defined networking (SDN) / NFV / 100G optical / FTTx)
Virtual Reality
Smart dust Clean energy (solar & wind)
Electric 3D printing
Energy
vehicles
Innovation Peak of Trough of Slope of Plateau of Storage
Trigger Inflated disillusionment enlightenment productivity
expectation
Time
Years to mainstream adoption: “Blue Sky” Emerging Mainstream Maturity / Decline
Less than 2 years 2 to 5 years 5 to 10 years More than 10 years Obsolete before plateau
Positioning of themes/products above is only intended to be indicative of approximate penetration/maturity
Source: Polar Capital & Gartner, July 2017. It should not be assumed that recommendations made in future will be profitable or will equal performance of the securities in this document. A list of all recommendations
made within the immediately preceding 12 months is available upon request.
For non-US investor use only. Please refer to the Important Information at the end of this presentation. 8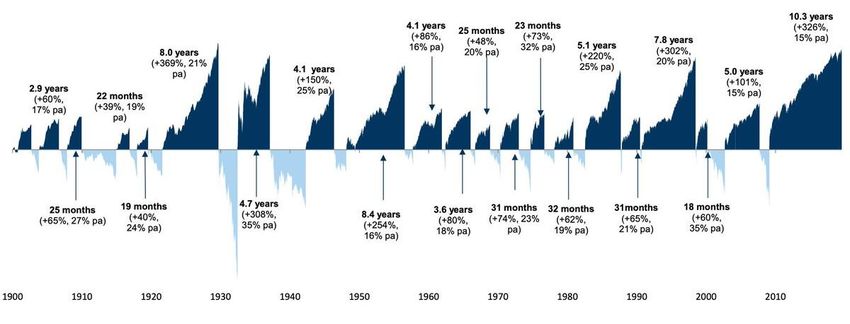
Thematic Investing: Hype vs. Reality

                                                                                                                Consumer Cash Payments, forecasts vs. actual (m)4

      •      Introduced in late 2016 to derision1
      •      Although Apple has never broken out unit
             sales, analysts estimate that 16m AirPods                                                            “How did you go bankrupt?
             were sold in 20182. This is forecast to                                                              Two ways. Gradually, then suddenly.”
             increase to 40m units this year3 and 100m by                                                                                                               - Ernest Hemingway
             20212
      •      Apple’s second fastest selling new product of
             all time? 5
Source: 1. OneZero, 2019. 2. Ming-Chi Kuo of TF International Securities. 3. Neil Cybart, Above Avalon, February 2019. 4. UK Finance, Link Network. 5. Cult of Mac, 2019. The stocks represented herein do
not reflect the entire holdings contained within the Fund. It should not be assumed that recommendations made in future will be profitable or will equal performance of the securities in this document. A list of all
recommendations made within the immediately preceding 12 months is available upon request. All opinions and estimates constitute the best judgment of Polar Capital as of the date hereof, but are subject to
change without notice, and do not necessarily represent the views of Polar Capital.

For non-US investor use only. Please refer to the Important Information at the end of this presentation.                                                                                                                 9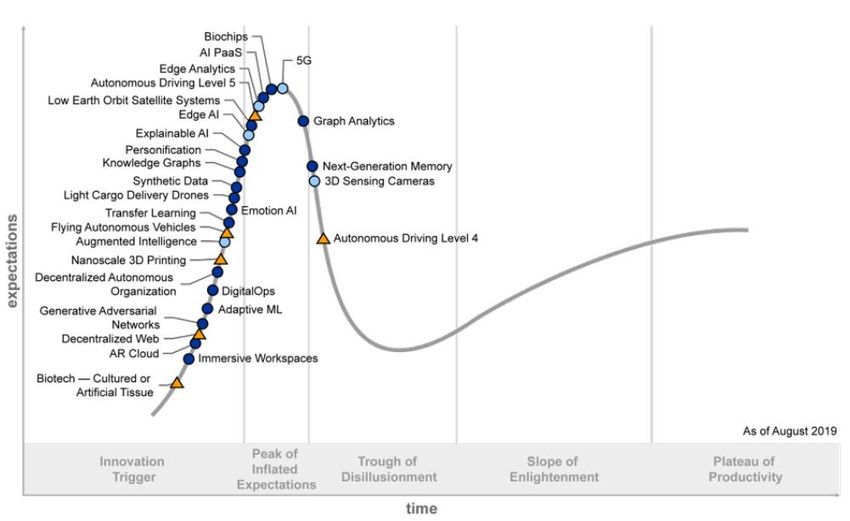
An Unusual Cycle

 Longest bull market                                                                                          Weakest economic recovery
 S&P 500: periods without a 20% drawdown1                                                                     US real GDP from trough 10 years onward1

Source: 1. FT, Goldman Sachs. Trailing 12-month earnings. It should not be assumed that recommendations made in future will be profitable or will equal performance of the securities in this document. A list of all
recommendations made within the immediately preceding 12 months is available upon request. All opinions and estimates constitute the best judgment of Polar Capital as of the date hereof, but are subject to change
without notice, and do not necessarily represent the views of Polar Capital.

For non-US investor use only. Please refer to the Important Information at the end of this presentation.                                                                                                           10
An Unusual Cycle

 Limited labour participation                                                                                 Unprecedented monetary policy
 Labour share of non-farm business sector %1                                                                  UK bond yields since 17001

Source: 1. FT, Goldman Sachs. Trailing 12-month earnings. It should not be assumed that recommendations made in future will be profitable or will equal performance of the securities in this document. A list of all
recommendations made within the immediately preceding 12 months is available upon request. All opinions and estimates constitute the best judgment of Polar Capital as of the date hereof, but are subject to change
without notice, and do not necessarily represent the views of Polar Capital.

For non-US investor use only. Please refer to the Important Information at the end of this presentation.                                                                                                            11
An Unusual Cycle

 Tech has driven all the earnings growth since 2009                                                           Helping growth stocks sharply outperform value
 Tech vs. Ex. Tech earnings (1985 – Present)1                                                                 World Value vs. Growth stocks (1974 – Present)1

Source: 1. FT, Goldman Sachs. Trailing 12-month earnings. It should not be assumed that recommendations made in future will be profitable or will equal performance of the securities in this document. A list of all
recommendations made within the immediately preceding 12 months is available upon request. All opinions and estimates constitute the best judgment of Polar Capital as of the date hereof, but are subject to change
without notice, and do not necessarily represent the views of Polar Capital.

For non-US investor use only. Please refer to the Important Information at the end of this presentation.                                                                                                           12
Technology: PE Expansion In-line With Market

 Absolute sector valuation (PE):                                                                           Relative sector valuation (PE):
 Compelling vs. history (1992 – present)                                                                   At / around market level – with superior balance sheet

Source: Ned Davis, 29 November 2019. Copyright 2018 Ned Davis Research, Inc. Further distribution prohibited without prior permission. All Rights Reserved. See NDR Disclaimer at www.ndr.com/copyright.html.
For data vendor disclaimers refer to www.ndr.com/vendorinfo/. Past performance is not indicative or a guarantee of future returns.

For non-US investor use only. Please refer to the Important Information at the end of this presentation.                                                                                                        13
‘Next-Generation’ Valuations

Internet valuation (equal cap weighted):                                                                                                                          Software as a Service (SaaS) valuation:
EV/forward 2 year EV/EBITDA levels1                                                                                                                               EV/forward 12 month revenue multiples2
 25

 20

 15

 10

  5

  0
      02/01/2013

                   02/08/2013

                                02/03/2014

                                             02/10/2014

                                                          02/05/2015

                                                                       02/12/2015

                                                                                    02/07/2016

                                                                                                 02/02/2017

                                                                                                              02/09/2017

                                                                                                                           02/04/2018

                                                                                                                                        02/11/2018

                                                                                                                                                     02/06/2019

                                                                       ML Internet Index

Source: 1. Bloomberg, 29 November 2019. UCITS Internet sector (AMZN/FB/GOOG/BABA/700HK/PYPL) vs Bank of America Merrill Lynch Internet sector Index. 2. KeyBanc, Capital Markets, December 2019. Past
performance is not indicative or a guarantee of future returns.

For non-US investor use only. Please refer to the Important Information at the end of this presentation.                                                                                                    14
‘Next-Generation’ Valuations
IT security valuation: Cloud vs legacy valuation
EV/forward 12 month revenue multiples1 EV/trailing 12 month revenue multiples2
14x
12x
EV/ trailing 12 month sales
10x
8x
6x
4x
2x
0x
May-13
Oct-13
Mar-14
May-18
Oct-18
Mar-19
Jan-10
Jun-10
Apr-11
Sep-11
Aug-14
Nov-10
Feb-12
Jul-12
Dec-12
Jan-15
Jun-15
Nov-15
Apr-16
Feb-17
Sep-16
Jul-17
Dec-17
Aug-19
LEGACY CLOUD
Source: 1. Citi Research, FactSet, November 2019. 2. Bloomberg, BofA Merrill Lynch Global Research, November 2019. Past performance is not indicative or a guarantee of future returns.
For non-US investor use only. Please refer to the Important Information at the end of this presentation. 15Valuations Supported By Elevated M&A…
Software M&A since 19951 Select M&A activity2
Date Target Acquirer Premium Value $m
Jan-17 AppDynamics Cisco 100%* 3,700
Mar-17 Nimble Storage HP Enterprise 45% 1,000
Mar-17 Mobileye Intel 34% 14,131
Mar-18 MuleSoft Salesforce.com 36% 5,667
Jun-18 GitHub Microsoft Private 7,500
Sep-18 Marketo Adobe Private 4,750
Oct-18 Red Hat IBM 63% 34,000
Nov-18 Qualtrics SAP Private 8,000
Dec-18 MINDBODY Vista Equity 68% 1,900
Feb-19 Elie Mae Thoma Bravo 47% 3,700
Jun-19 Looker Google Private 2,600
Jun-19 Tableau Salesforce.com 63% 15,700
Jun-19 Medidata Dassault Systemes 17%* 5,700
BOLD: owned in Fund
Source: 1. Dealogic, The MergerSight Group, 2018. 2. Bloomberg and Polar Capital, June 2019. It should not be assumed that recommendations made in future will be profitable or will equal performance of the
securities in this document. A list of all recommendations made within the immediately preceding 12 months is available upon request.
For non-US investor use only. Please refer to the Important Information at the end of this presentation. 16… And The ‘Digital Transformation’ Imperative
Digital Transformation – “the business imperative of responding to needs of a new generation of customers,
partners and suppliers who expect transactions to be seamless, real-time, Facebook-like in
experience, Amazon-like in reliability”1
Proportion of CEO’s undertaking a ‘transformation’2 “The Digital Giants Are Coming!”2
Source: 1. Baird. 2. Gartner 2019. It should not be assumed that recommendations made in future will be profitable or will equal performance of the securities in this document. A list of all recommendations made within
the immediately preceding 12 months is available upon request. All opinions and estimates constitute the best judgment of Polar Capital as of the date hereof, but are subject to change without notice, and do not
necessarily represent the views of Polar Capital.
For non-US investor use only. Please refer to the Important Information at the end of this presentation. 17Digital Disruption Source: Polar Capital, 31 July 2019. For non-US investor use only. Please refer to the Important Information at the end of this presentation. 18
New Networks / Unprecedented Scale

 Centralised, decentralised and distributed networks1

                                                                                                                                   >6bn daily searches                        636m active users
                                                                                                                                    8 apps > 1bn MAU                         $768bn GMV in F18

                                                                                                                                 2.3bn MAU, 1.5bn DAU                       WeChat: >1bn MAU
                                                                                                                                  27+ minutes/user/day                     45bn daily messages

                                                                                                                                   101m US prime subs                             >10bn rides
                                                                                                                                  48% of US ecommerce                             600+ cities

Source: 1. RAND corporation, ‘Where wizards stay up late’’. Other Sources: Google: Ardorseo, 2018, The Verge 2018. Facebook: Expanded Ramblings, Fool.com. 2018. Tencent: Tencent, Q3 2018, Business
of Apps, 2018. Amazon: Fortune.com, 2018. eMerketer.com. Alibaba: Fool.com, 2019. Uber: Uber, July 2018. The stocks represented herein do not reflect the entire holdings contained within the Fund. It should
not be assumed that recommendations made in future will be profitable or will equal performance of the securities in this document. A list of all recommendations made within the immediately preceding 12
months is available upon request.

For non-US investor use only. Please refer to the Important Information at the end of this presentation.                                                                                                         19
Digital Disruption: Artificial Intelligence (AI)
Collapsing Computing Costs (1850 – 2010)1
“Artificial Intelligence technologies will be the most
disruptive class of technologies over the next 10 years
due to radical computational power, near-endless
amounts of data, and unprecedented advances in
deep neural networks; these will enable organizations
with AI technologies to harness data in order to adapt to
new situations and solve problems that no one has
ever encountered previously”
- Gartner, July 20172
Source: 1. Aiimpacts.org. 2. Gartner. The stocks represented herein do not reflect the entire holdings contained within the Fund. All opinions and estimates constitute the best judgment of Polar Capital as of the date
hereof, but are subject to change without notice, and do not necessarily represent the views of Polar Capital.
For non-US investor use only. Please refer to the Important Information at the end of this presentation. 20Digital Disruption: Retail
US Retail Store Closings: 1995 – 2017 YTD1 Amazon Prime Subscriber Growth: 2012 – 20171
“I don't think retail is dead. “This business is all about reducing response time.
Mediocre retail experiences are dead” In fashion, stock is like food. It goes bad quickly”
- Neil Blumenthal, Co-CEO @ Warby Parker2 - Jose Maria Castellano, former CEO Inditex Group3
Source: 1. KPCB, BI Intelligence. 2. KPCB. 3. Kornit Digital IR presentation. The stocks represented herein do not reflect the entire holdings contained within the Fund. It should not be assumed that recommendations
made in future will be profitable or will equal performance of the securities in this document. A list of all recommendations made within the immediately preceding 12 months is available upon request. All opinions and
estimates constitute the best judgment of Polar Capital as of the date hereof, but are subject to change without notice, and do not necessarily represent the views of Polar Capital.
For non-US investor use only. Please refer to the Important Information at the end of this presentation. 21Digital Disruption: Brands
Amazon Basics, US online market share1
“Big brands are being nibbled to death”2
– IAB CEO Randall Rothenberg
Source: 1. Amazon market share as at August 2016. 2. http://www.businessinsider.com/new-breed-programmatic-first-ad-agencies-grabbing-business-ignored-by-traditional-firms-2018-4?IR=T The stocks represented
herein do not reflect the entire holdings contained within the Fund. It should not be assumed that recommendations made in future will be profitable or will equal performance of the securities in this document. A list of all
recommendations made within the immediately preceding 12 months is available upon request.
For non-US investor use only. Please refer to the Important Information at the end of this presentation. 22Digital Disruption: Brands
An extra large, wet,
double-shot
Coffee caramel macchiato
(and WiFi)
£1.00 £4.00
It should not be assumed that recommendations made in future will be profitable or will equal performance of the securities in this document. A list of all recommendations made within the immediately preceding
12 months is available upon request.
For non-US investor use only. Please refer to the Important Information at the end of this presentation. 23Digital Disruption: Distribution > Content Global recorded music, inflation adjusted sales1 Listening hours / unique artists played (2014-2017)2 • Streaming now c. 47% of recorded music sales1 led by Spotify (217m active, >100m paid subs)2 • Video disruption: YouTube (>1.8bn MAU)3, Netflix (>150m subs)4, Twitch (10.8bn hours/year)5 • Fortnite (250m registered / 10.8m record concurrent players) disrupting gaming via FtP model6 • Delivery becoming disruptive in the restaurant industry: takeaway TAM > entertainment in the UK7 Source: 1. Quartz Creative, 2019. 2. Spotify, 2017. 3. Business Insider, 2018. 4. Market Realist, 2019. 5. Sullygnome.com, 29 August 2019. 6. Games Radar. 7. https://jeweb-11431-s3.s3.eu-west- 2.amazonaws.com/application/files/2215/0045/3682/TAKEAWAY_ECONOMY_REPORT_2017.pdf The stocks represented herein do not reflect the entire holdings contained within the Fund. It should not be assumed that recommendations made in future will be profitable or will equal performance of the securities in this document. A list of all recommendations made within the immediately preceding 12 months is available upon request. For non-US investor use only. Please refer to the Important Information at the end of this presentation. 24
Digital Disruption: Demographics

  How Couples Meet (1940 – Present)1                                                                         Spending Breakdown: Chinese Millennials2

                                                                           96% own a smartphone, more than 50% are online >10 hrs/day4
                            Generation Z                                   70% watch more than 2 hours of YouTube/day3, 83% watch Netflix5
                                                                           62% will not use apps that are hard to navigate6
                       c.26% of the US       pop8
                                                                           80% feel distressed when away from their devices4
                                                                           Average attention span = 8 seconds7
Source: 1. https://web.stanford.edu/~mrosenfe/Rosenfeld_et_al_Disintermediating_Friends.pdf 2. Goldman Sachs, December 2016. 3. www.tvlicensing.co.uk 4. Visual Capitalist. 5. IBM. 6. Uniquely Generation Z
Report. 7. Nola Research Group. 8. Digital Marketing Community, GenZ: New Insights Into the Mobile-First Mindset of US Teens, August 2016 | Think With Google.
It should not be assumed that recommendations made in future will be profitable or will equal performance of the securities in this document. A list of all recommendations made within the immediately preceding
12 months is available upon request.

For non-US investor use only. Please refer to the Important Information at the end of this presentation.                                                                                                            25
Digital Disruption: The Next Interface Is Voice Words recognised by machine: 1970 - 20161 Amazon Echo Installed Base / Skills2 • Humans speak 150 vs. type 40 words per minute on average1 • Recognition accuracy shift from 95% to 99% will drive ubiquity of voice as an interface1 • By 2020, 75% of US households will own a voice-activated smart speaker3 • By 2020, c.50% of all searches via images or speech4 Source: 1. Baidu / KPCB, 2016. 2. Bond Internet Trends 2019. 3. Instead Knowledge, How Speech Recognition Is Set to Disrupt, 2018. 4. Forbes, 2017, Optimizing For Voice Search Is More Important Than Ever. It should not be assumed that recommendations made in future will be profitable or will equal performance of the securities in this document. A list of all recommendations made within the immediately preceding 12 months is available upon request. All opinions and estimates constitute the best judgment of Polar Capital as of the date hereof, but are subject to change without notice, and do not necessarily represent the views of Polar Capital. For non-US professional investor use only. Please refer to the Important Information at the end of this presentation. 26
Investment Themes

                                                                                                             Digital Marketing / Advertising
                                                                         Internet advertising worth $273bn in 20182, 43% of total ad spending2
                                                                    Alphabet and Facebook combined account for c.90% of US market growth3
                                                                                                     Brand Building → Transaction facilitation

    eCommerce
     eCommerce est. $3.5tr in 2019, c14% of total retail sales1
     China the largest market at $1.9tr, more than 3x the US1
     Number of SKU → Payments, Logistics + Ecosystem

                                                                                                                                             Payments / Fintech
                                                                                                                   Global mobile payments worth $2.73tr by 20234
                                                                                                                2.1bn consumers to pay via mobile wallet in 20195
                                                                                                                   eCommerce → behavioural change / disruption

    Cloud Infrastructure / Security
     By 2021, 44% of application workloads expected to run in Cloud services5
     Security tailwinds include data breaches, regulation, digitalisation, cyberwarfare
     Under-utilisation / cost arbitrage → Elastic Compute / TAM expansion

Source: 1. eMarketer, June 2019; 2. eMarketer, March 2018; 3. BoA / ML / Zenith, US market Jan 18; 4. Payments cards and mobile, 2019. 5. Globe News Wire. It should not be assumed that recommendations
made in future will be profitable or will equal performance of the securities in this document. A list of all recommendations made within the immediately preceding 12 months is available upon request.

For non-US investor use only. Please refer to the Important Information at the end of this presentation.                                                                                                   27
Investment Themes
Software / SaaS “Reshaping The World”
Usage based pricing disrupting $150bn2 maintenance market
As penetration rises (~30% today5 ) expect more strategic M&A by incumbents
SMB adoption / TAM expansion→ Enterprise / ‘rip and replace’
Digital Entertainment
$122bn gaming market1 growing to $152bn by 2020E driven by mobile, DLC / MTX1
eSports: 165m enthusiasts1 and a market worth $906m in 2018E, +38% y/y6
Leisure → Connected / Competitive
Industry 4.0 / Automation
$381bn TAM by 2023 (c.10% CAGR)3 enabled by advanced components (e.g. sensors, gears)
Position repeatability: 0.01mm (robots) / 0.5mm (humans) VS 0.02mm (iPhone64) / 0.1mm (cars)
Cost savings → Necessity, Flexibility (‘CoBot’) and Consistency
Connectivity / 5G
Current networks insufficient to support an increasingly connected world
5G infrastructure spending worth $26bn by 2022E, +118% CAGR (2018-2022)7
Capacity + latency → IoT enablement
Source: 1. Newzoo, April 2018; 2. UBS, Jan 2016; 3. marketsandmarkets, May 2018; 4. Cult of Mac, 2014. 5. IDC. 6. NewZoo May 2017. 7. ZDNet, 2018. It should not be assumed that recommendations made in
future will be profitable or will equal performance of the securities in this document. A list of all recommendations made within the immediately preceding 12 months is available upon request.
For non-US investor use only. Please refer to the Important Information at the end of this presentation. 28Investment Themes
Eight core theme breakdown (31 January 2017 – 29 November 2019)
19%
18%
17%
16%
15%
14%
13%
12%
11%
10%
9%
8%
7%
6%
5%
4%
3%
2%
1%
0%
Data Economy / Artificial Intelligence Cloud Infrastructure / Security Digital Entertainment Online Advertising / eCommerce
Market hedge / beta offset Industry 4.0 / Automation Mobility / Connectivity / 5G SaaS / Software "Eating the World"
Payments / Fintech Other / Cyclical Other / Growth Other / Legacy
Source: Polar Capital, 29 November 2019. Past performance is not indicative or a guarantee of future returns.
For non-US investor use only. Please refer to the Important Information at the end of this presentation. 29Online Advertising / Digital Marketing
• Global online advertising worth $283bn in 2018, c. 46% of total worldwide advertising spend1
• Online share of US advertising now commensurate with % time spent in media (51% vs. 20%/33% in 2010)…2
• …but TV + radio + print still c.49% of US ad spending and new dollar pools (trade spend / direct marketing) emerging2
• US digital media consumption accelerated in 2018 (to +7% y/y) aided by highly favourable demographic trends3
Worldwide Digital Advertising Spending ($bn): 2018 – 20233 TAM expansion as new dollar pools emerge (2009 – 2019E)4
Sample Holdings
Sample Holdings
Source: Polar Capital, unless otherwise stated. 1. eMarketer, 2019. 2. Bond Internet Trends 2019 3. Bond Internet Trends 2019 BoAML/Zenith, US market January 2018. 4. KPCB, 2018. It should not be assumed that
recommendations made in future will be profitable or will equal performance of the securities in this document. A list of all recommendations made within the immediately preceding 12 months is available upon request. All
opinions and estimates constitute the best judgment of Polar Capital as of the date hereof, but are subject to change without notice, and do not necessarily represent the views of Polar Capital.
For non-US professional investor use only. Please refer to the Important Information at the end of this presentation. 30eCommerce
• eCommerce growth continues unabated and is forecast at $3.5tr in 2019E, representing c.14% of total retail sales1
• Amazon’s share of US e-commerce now 47%, 4.6% of all retail spend2
• Mobile now an integral part of the shopping experience, accounting for 63.5% of all retail eCommerce 2
• Improvements in payments / delivery continue to reduce online buying friction / change user behaviour and expectations
Global eCommerce sales, $bn (2017-2023E)1 Global Mobile Commerce: 2016 – 2021E3
Sample Holdings
Source: Polar Capital, unless otherwise stated. 1. eMarketer, June 2019. 2. eMarketer, Feb 2019. 3. Statista. It should not be assumed that recommendations made in future will be profitable or will equal performance of
the securities in this document. A list of all recommendations made within the immediately preceding 12 months is available upon request. All opinions and estimates constitute the best judgment of Polar Capital as of the
date hereof, but are subject to change without notice, and do not necessarily represent the views of Polar Capital.
For non-US professional investor use only. Please refer to the Important Information at the end of this presentation. 31Payments / Fintech
• Global mobile payment market set to reach $2.73tr by 2023, representing a 25% CAGR 2018-20231
• 2.1bn consumers expected to make a purchase via a mobile wallet in 2019, >50% in China2
• B2B opportunity: $120tr (vs. $45tr consumer volume) largely cheque-based today ($4-20/transaction vs. 30-50c digital) 3
• Disruption inevitable: mobile payments cost Chinese banks $23bn in 2015, expected to reach $60bn by 2020E4
Proximity Payment Penetration of Mobile Users, 20195 Personal Loan Balance Market Share6
Sample Holdings
Source: 1. Payments cards and mobile, 2019. 2. Globe News Wire, 2018. 3. E&Y. 4. Caixin Global, 2019. 5. eMarketer. 6. William Blair. It should not be assumed that recommendations made in future will be
profitable or will equal performance of the securities in this document. A list of all recommendations made within the immediately preceding 12 months is available upon request. All opinions and estimates constitute
the best judgment of Polar Capital as of the date hereof, but are subject to change without notice, and do not necessarily represent the views of Polar Capital.
For non-US professional investor use only. Please refer to the Important Information at the end of this presentation. 32Software (Is Eating The World)
• Rental / usage-based model is expanding the software market while threatening incumbent franchises / maintenance
• Software as a service (SaaS) targets a $325bn opportunity by 2022, representing 25% of IT spending1
• Focus on the customer experience (CX) driving a front office transformation → CRM, UCaaS, CPaaS, voice, payments
• Agility in the data age requires automation / upgraded core business functions → AI, BPA, HR, procurement
US Nominal Tech Capex (1980 – Present)2 SaaS / Cloud Software (2012 – 2022E)1
Sample Holdings
Source: 1. KeyBanc, 2019. 2. Cornerstone, Q1’19. It should not be assumed that recommendations made in future will be profitable or will equal performance of the securities in this document. A list of all
recommendations made within the immediately preceding 12 months is available upon request. All opinions and estimates constitute the best judgment of Polar Capital as of the date hereof, but are subject to change
without notice, and do not necessarily represent the views of Polar Capital.
For non-US professional investor use only. Please refer to the Important Information at the end of this presentation. 33Digital Entertainment
• Video games: $122bn market in 2017 → $152bn by 2020E (~10% CAGR), driven by new console cycle, mobile and AR/VR1
• Meteoric rise of Free-To-Play Fortnite (>78m MAU / $2.4bn sales): both risk and opportunity2
• Streaming video : c.200m (vs. 1bn paid TV) subscribers worldwide, Netflix dominates today with 140m (6x closest comp)3
• eSports: modest TAM ($906m) but massive audience (165m enthusiasts + 215m occasional viewers) watching 6.6bn hours4
Global Games Market ($bn) 2017 – 2020E1 Share of global recorded music sales, by format5
Sample Holdings
Source: 1. Newzoo, Apr 2018. 2. Polygon, September 2018 & The Telegraph, 2019. 3. RBC, August 2019. 4. Influencer Marketing Hub. 5. Superdata (April data) May 2018. It should not be assumed that
recommendations made in future will be profitable or will equal performance of the securities in this document. A list of all recommendations made within the immediately preceding 12 months is available upon request.
All opinions and estimates constitute the best judgment of Polar Capital as of the date hereof, but are subject to change without notice, and do not necessarily represent the views of Polar Capital.
For non-US professional investor use only. Please refer to the Important Information at the end of this presentation. 34Cloud Infrastructure / Security
• Having debunked many of the earlier barriers to adoption, we expect Cloud migration to accelerate over the coming years
• Expect ‘all’ incremental capacity added in cloud: c. 50% of spend by 20192 and 44% of application workloads by 20213
• Cloud deflation likely to be felt throughout the IT stack - $1tr of enterprise IT spending at risk4
• Cost of cybercrime estimated at $6tr by 2021 with cybersecurity playing a vital role in protecting the digital economy1
Amazon + Azure + Google Cloud Revenue: Q1’15-Q1’195 Enterprise Computing Workloads: 2016 – 2024E6
Sample Holdings
Source: Polar Capital unless otherwise stated. 1. PWC, The cost of inaction on cybercrime in the Middle East, 2018. 2. Deutsche Bank, January 2016. 3. Morgan Stanley / Geekwire August 2018 4. Gartner, August 2018
5. KeyBanc, Q119 6. Gartner, August 2016. It should not be assumed that recommendations made in future will be profitable or will equal performance of the securities in this document. A list of all recommendations
made within the immediately preceding 12 months is available upon request. All opinions and estimates constitute the best judgment of Polar Capital as of the date hereof, but are subject to change without notice, and do
not necessarily represent the views of Polar Capital.
For non-US professional investor use only. Please refer to the Important Information at the end of this presentation. 35The Data Economy / Artificial Intelligence (AI)
• 2.5bn gigabytes of data is generated per day but only 1% is stored and analysed; this could increase to 37% by 20251
– e.g. a single AV may generate 4TB of data/ day, equivalent to 3,000 people today1
• AI likely to be the single largest driver of tech spending over the next 5-10 years, worth $127bn by 2025E1
– Only 8% of companies have deployed ML beyond testing1, focus likely to remain narrow / specific use-cases
• Data Economy includes semi / components (DRAM / NAND, GPU / FPGA), Cloud (scale), tools (data prep / analytics) and apps.
The ‘Data Economy’ ecosystem2 AI revenue growth by technology, $bn (2015 – 2025E)1
Apps
Tools
Cloud
Semi / components
Sample Holdings
Source: 1. BAML, August 2018 2. Polar Capital. It should not be assumed that recommendations made in future will be profitable or will equal performance of the securities in this document. A list of all recommendations
made within the immediately preceding 12 months is available upon request. All opinions and estimates constitute the best judgment of Polar Capital as of the date hereof, but are subject to change without notice, and do
not necessarily represent the views of Polar Capital.
For non-US investor use only. Please refer to the Important Information at the end of this presentation. 36Connectivity: 5G / IoT / Edge Computing • Current networks insufficient capacity / latency to support an increasingly connected world (c.29bn devices by 2022)1 • 5G up to 100x faster with low latency (
Smartphones / Apple
• The c.1.5bn unit smartphone market is mature: global penetration at c.66%1 and units expected to decline 2.5% y/y in 2019E1
• Apple remains unique: premium pricing + services. Wearables (+50% y/y in FQ3’19) AirPod / Watch attach at estimated 7% / 12%2
• Can 5G shorten replacement cycles? Although the PC experience is sobering, sentiment could improve ahead of 5G launch in 2020
• 5G content gains coming at a time of higher capital intensity due to ‘Moore’s Stress’ – favours RF, SPE, IC design, test and materials

  Smartphone worldwide unit shipments (2008 - 2022)3                                                            Smartphone replacement cycles (2007 – 2020E)4

      Sample Holdings

Source: 1. Gartner, August 2019. 2. UBS, 16 August 2019. 3. Business Insider, 2018. 4. Statista, 2019. It should not be assumed that recommendations made in future will be profitable or will equal performance of the
securities in this document. A list of all recommendations made within the immediately preceding 12 months is available upon request. All opinions and estimates constitute the best judgment of Polar Capital as of the
date hereof, but are subject to change without notice, and do not necessarily represent the views of Polar Capital.

For non-US investor use only. Please refer to the Important Information at the end of this presentation.                                                                                                            38
Industry 4.0: Automation / Simulation
• The Fourth Industrial Revolution underway driven by Cyber Physical Systems, Internet of Things and Cloud Services
• Sensor data + connectivity = design software / simulation expands into product lifecycle management / ‘digital twin’
• Over 25% of manufacturing tasks that can be automated may be performed by robots over the next decade1
• Human-robot collaboration will radically alter the way factories operate, making highly versatile production lines possible
Declining IoT sensor costs (2004 – 2020E)2 Global shipments of industrial robots (2016-205E)3
Sample Holdings
Source: 1. Boston Consulting Group, September 2015. 2. IoT One, MongoDB. 3. IC Insights. It should not be assumed that recommendations made in future will be profitable or will equal performance of the securities in
this document. A list of all recommendations made within the immediately preceding 12 months is available upon request. All opinions and estimates constitute the best judgment of Polar Capital as of the date hereof, but
are subject to change without notice, and do not necessarily represent the views of Polar Capital.
For non-US investor use only. Please refer to the Important Information at the end of this presentation. 39Emerging Themes Source: Gartner, August 2019. For non-US investor use only. Please refer to the Important Information at the end of this presentation. 40
Autonomous Vehicles
                                                                                                     • Automotive market ripe for reinvention: connectivity / infotainment,
                                                                                                       advanced driver assistance systems (ADAS) / autonomous driving,
                                                                                                       vehicle electrification
                                                                                                     • 1.25m deaths worldwide due to vehicle crashes in 2014 while
                                                                                                       94% of US accidents involve human choice / error1
                                                                                                     • Global ADAS / autonomous vehicle penetration forecast to grow from
                                                                                                       12% in 2015, to 48% in 2020 and 70% by 20252
                                                                                                     • Fully autonomous driving by 2020? Technically yes – Waymo
                                                                                                       cars have already completed 5m miles3
                                                                                                     • Car ownership? Depreciating, underutilised asset used just c. 4% of
                                                                                                       the time → shared private rides becoming mainstream4
                                                                                                                                                          “We are approaching the end of the
                                                                                                                                                         automotive era. The tipping point will
                                                                                                                                                           come when 20-30% of vehicles are
                                                                                                                                                         fully autonomous. Countries will look
                                                                                                                                                           at the accident statistics and figure
                                                                                                                                                           out that human drivers are causing
                                                                                                                                                                      99.9% of the accidents”5

                                                                                                                                                                    – Bob Lutz, former vice Chairman GM

Source: 1. https://waymo.com/tech/. 2. KPCB, 2016. 3. https://waymo.com/tech/. 4. Baidu / KPCB, 2016. 5. www.autonews.com. Chart from https://waymo.com/tech/. It should not be assumed that recommendations
made in future will be profitable or will equal performance of the securities in this document. A list of all recommendations made within the immediately preceding 12 months is available upon request. Forecasts contained
herein are for illustrative purposes only and does not constitute advice or a recommendation. All opinions and estimates constitute the best judgment of Polar Capital as of the date hereof, but are subject to change
without notice, and do not necessarily represent the views of Polar Capital.

For non-US professional investor use only. Please refer to the Important Information at the end of this presentation.                                                                                                 41
PCT Positioning
Sector exposure (%) Market cap exposure (%)
Software 28.7%
Semiconductors & Semiconductor Equipment 16.5% Large Cap (>$10bn) 82.5%
Interactive Media & Services 15.8%
Mid Cap (>$1bn - $10bn) 16.4%
Technology Hardware, Storage & Peripherals 11.0%
Internet & Direct Marketing Retail 5.9% Small Cap (PCT Positioning
Largest overweights Largest underweights Market cap exposure versus benchmark
Advanced Micro Devices Alphabet
Alteryx Amadeus IT Holding
Amazon Apple
Large-cap -7.3%
Analog Devices Broadcom
Dolby Laboratories Cisco Systems
Everbridge Cognizant Technology Solutions
Intuitive Surgical Facebook
Keyence IBM Mid-cap 7.0%
Marvell Technology Group Infosys
Mastercard Intel
PayPal Holdings LAM Research
Qualcomm Micron Technology Small-cap 0.5%
Samsung Electronics Microsoft
STMicroelectronics NV NXP Semiconductor
Taser International Oracle -20% -15% -10% -5% 0% 5% 10% 15%
Tokyo Electron SAP
TSMC Shopify
Visa SK Hynix
Workday Tencent
Zendesk Texas Instruments
Source: Polar Capital, as at 29 November 2019. Bold denotes a zero position. It should not be assumed that recommendations made in future will be profitable or will equal performance of the securities in this
document. A list of all recommendations made within the immediately preceding 12 months is available upon request.
For non-US investor use only. Please refer to the Important Information at the end of this presentation. 43PCT Positioning
Thematic breakdown1,2 Thematic breakdown relative to benchmark (%)1,2
10.0%
Legacy
11%
5.0%
Internet
23%
0.0%
Semiconductors -5.0%
23%
-10.0%
Cloud: applications
16%
-15.0%
Smartphones
1% Apple
8% -20.0%
Emerging
Internet
Automotive
Payments
Factory automation/robotics
Cloud: infrastructure
Smartphones
IoT
3D Printing
Other
Big data / AI
Video Games
Medical Technology
Cybersecurity
Solar
Legacy
Cloud: applications
Semiconductors
Materials
Apple
Electric Vehicles
Medical Technology
Cloud: infrastructure
1% Electric Vehicles
0% Cybersecurity 2%
Emerging 1%
Solar Payments
0% 0% Automotive Big data / AI
Other
3D Printing
0% IoT 4% 2% 2%
0% 1%
Factory
automation/robotics
4%
Source: Polar Capital, 29 November 2019. 1. Benchmark: Dow Jones Global Technology Index (TR). 2. Index exposure based on Top 100 index constituents. Figures are shown as gross weightings.
It should not be assumed that recommendations made in future will be profitable or will equal performance of the securities in this document. A list of all recommendations made within the immediately preceding 12
months is available upon request.
For non-US investor use only. Please refer to the Important Information at the end of this presentation. 44PCT Positioning
Index Index ex
PCT1 Sales growth 2020 – PCT vs. benchmark2
Top 100 Apple
45.0
PE (Median) CY 29.4 22.9 23.0
NY 26.4 20.6 20.6
Earnings growth (Median) CY 10.8 5.5 5.6 40.0
NY 17.2 11.9 11.9
EV/Sales (Mean) CY 8.3 6.3 6.3 35.0
NY 6.7 5.5 5.5
EV/Sales (Median) CY 7.1 4.8 4.9 30.0
% of Portfolio
NY 5.8 4.6 4.6
EV/Sales (Weighted)** CY 7.4 6.2 6.6
25.0
NY 6.3 5.4 5.7
Sales Growth (Mean) CY 13.3 7.3 7.4
NY 23.9 10.9 10.9 20.0
Sales Growth (Median) CY 11.6 5.0 5.8
NY 16.6 7.9 8.2
15.0
Sales Growth (Weighted)** CY 12.5 8.8 10.1
NY 18.2 12.4 13.3
Gross Margin (Mean) 60.4 56.5 56.7 10.0
Gross Margin (Median) 64.8 56.0 56.5
Gross Margin (Weighted)** 56.7 56.7 59.8
5.0
Net Cash as % mkt cap Avg 5.1 -1.6 -1.7
Wgtd** 6.7 4.9 4.3
Market Cap ($m) Mean 86,614 90,281 79,603 0.0
50
Median 14,126 25,103 24,709
PCT GROSS WEIGHT BENCH GROSS WEIGHT
Wgtd** 389,072 527,848 426,817
Source: 1. Polar Capital, 3 December 2019. Figures in blue exclude Apple (14.2% gross) from the Index Top 100. CY = Current Year, NY = 2018 calendar year estimates. 2. Polar Capital, 7 November 2019.
Benchmark: Dow Jones Global Technology Index (TR). Past performance is not indicative or a guarantee of future results. All opinions and estimates constitute the best judgment of Polar Capital as of the date
hereof, but are subject to change without notice, and do not necessarily represent the views of Polar Capital. It should not be assumed that recommendations made in future will be profitable or will equal
performance of the securities in this document. A list of all recommendations made within the immediately preceding 12 months is available upon request.
For non-US investor use only. Please refer to the Important Information at the end of this presentation. 45Appendix For non-US investor use only. Please refer to the Important Information at the end of this presentation. 46
Team Biographies
                                   Ben Rogoff – Partner
                                   Experience: 24 years
                                   Ben joined Polar Capital in May 2003. He is lead manager of Polar Capital Technology Trust plc and is a Fund Manager of the Polar Capital
                                   Global Technology Fund and Polar Capital Automation and Artificial Intelligence Fund. He has been a technology specialist for 24 years. Prior to
                                   joining Polar Capital he began his career in fund management at CMI, as a global technology analyst. He moved to Aberdeen Fund Managers in
                                   1998 where he spent four years as a senior technology manager. Ben graduated from St Catherine’s College, Oxford in 1995.

                                   Nick Evans – Partner
                                   Experience: 22 years
                                   Nick joined Polar Capital in September 2007 and has 22 years’ experience as a technology specialist. He has been lead manager of the Polar
                                   Capital Global Technology Fund since January 2008 and is also a fund manager on the Polar Capital Technology Trust and Polar Capital
                                   Automation and Artificial Intelligence Fund. Prior to joining Polar he was head of technology at AXA Framlington and lead manager of the AXA
                                   Framlington Global Technology Fund and the AXA world fund (AWF) – Global Technology from 2001 to 2007 (both rated five stars by S&P). He
                                   also spent three years as a Pan-European investment manager and technology analyst at Hill Samuel Asset Management. Nick has a degree in
                                   Economics and Business Economics from Hull University, has completed all levels of the ASIP, and is a member of the CFA Institute.

                                   Xuesong Zhao
                                   Experience: 12 years
                                   Xuesong joined Polar Capital in May 2012 and has 12 years’ investment experience. He is a lead manager of the Polar Capital Automation and
                                   Artificial Intelligence Fund and is a Fund Manager on the Polar Capital Technology Trust and Polar Capital Global Technology Fund. Prior to
                                   joining Polar Capital, he spent four years working as an investment analyst within the emerging markets & Asia team at Aviva Investors, where he
                                   was responsible for the technology, media and telecom sectors. Prior to that, he worked as a quantitative analyst and risk manager for the
                                   emerging market debt team at Pictet Asset Management. He started his career as a financial engineer at Algorithmics, now owned by IBM, in
                                   2005. He holds an MSc in Finance from Imperial College of Science & Technology, a BA (Hons) in Economics from Peking University. He is also
                                   a CFA charterholder.

For non-US investor use only. Please refer to the Important Information at the end of this presentation.                                                                       47
Team Biographies Cont.
Fatima Iu (Maternity Leave)
Experience: 13 years
Fatima joined Polar Capital in April 2006 and has 13 years’ experience. She is a fund manager on the Polar Capital Technology Fund, Polar
Capital Technology Trust and Polar Capital Automation and Artificial Intelligence Fund. She is responsible for the coverage of European
Technology, Global Security, Networking, Clean Energy and Medical Technology. Prior to joining Polar, Fatima spent 18 months working at
Citigroup Asset Management with a focus on consumer products and pharmaceuticals. Fatima holds an MSc in Medicinal Chemistry from
Imperial College of Science & Technology in London. She is also a CFA Charterholder.
Alastair Unwin
Experience: 8 years
Alastair joined Polar Capital in June 2019 as a Fund Manager and Senior Analyst. Prior to joining Polar Capital, Alastair co-managed the Arbrook
American Equities Fund. Between 2014 and 2018 he launched and then managed the Neptune Global Technology Fund and managed the
Neptune US Opportunities Fund. Prior to Neptune, Alastair was a technology analyst at Herald Investment Management. Alastair has a BA (1st
Class Hons) in History from Trinity College, Cambridge and is a CFA Charterholder.
Chris Wittstock
Experience: 35 years
Chris joined Polar Capital in July 2017 as a senior technology analyst based in the US. Prior to joining, Chris led the International research sales
effort at Pacific Crest, a technology investment bank that was ultimately acquired by KeyBanc Capital in 2014. Prior to joining Pacific Crest in
2004, Chris led the International sales effort at Schwab SoundView, the successor company to Soundview Technology Group where he was
since 1996. Chris spent significant time in Europe as a derivative products specialist in the late 80s and 90s, lastly with Morgan Stanley
International. He is a graduate of University of Toronto, Faculty of Engineering (Industrial).
For non-US investor use only. Please refer to the Important Information at the end of this presentation. 48Team Biographies Cont.
Brad Reynolds
Experience: 12 years
Brad joined Polar Capital in October 2011 as an Investment Analyst and Trader working as part of the European Market Neutral team with a focus
on media and internet. In 2014, he joined the Technology team as an Investment Analyst. Prior to joining Polar Capital, Brad worked at Ratio
Asset Management as an analyst and trader, and from 2007 to 2011 he worked at F&C as a hedge fund analyst. Brad started his career in 2001
at Gartmore Investment Management working within the hedge fund team. Brad graduated from the University of Hertfordshire with a degree in
Business Studies.
Paul Johnson
Experience: 7 years
Paul joined Polar Capital in March 2012 as an Investment Analyst on the Polar Capital Technology team. Prior to joining Polar Capital, Paul
helped manage a private investment fund between 2010 and 2012. Paul holds a BA in History and Politics and a Masters in History from Keele
University. He has successfully passed all three levels of the CFA program.
Nick Williams
Experience: 4 years
Nick joined Polar Capital in June 2019 as an analyst on the Polar Capital Technology team. Prior to joining Polar Capital, Nick worked at Neptune
Investment Management as the Assistant Fund Manager on the US Opportunities growth fund. Prior to that he worked in academia at the
University of Oxford. Nick holds an MChem Chemistry from the University of Oxford.
For non-US investor use only. Please refer to the Important Information at the end of this presentation. 49Important Information
Polar Capital
16 Palace Street
London SW1E 5JD
Important Information: This document is provided for the sole use of the intended recipient and is not a financial promotion. It shall not and does not constitute an offer or solicitation of an offer to make an
investment into any fund or Company managed by Polar Capital. It may not be reproduced in any form without the express permission of Polar Capital and is for the intended recipient only. Clients who have
access to this document should make themselves aware of all relevant risk factors relating to these products contained in the Fund or Company’s Prospectus or latest financial report. The law restricts distribution
of this document in certain jurisdictions; therefore, it is the responsibility of the reader to inform themselves about and observe any such restrictions. It is the responsibility of any person/s in possession of this
document to inform themselves of, and to observe, all applicable laws and regulations of any relevant jurisdiction. Polar Capital Technology Trust plc is an Investment Company with investment trust status and as
such its ordinary shares are excluded from the FCA’s (Financial Conduct Authority’s) restrictions which apply to non-mainstream investment products. The Company conducts its affairs and intends to continue to
do so for the foreseeable future so that the exclusion continues to apply. It is not designed to contain information material to an investor’s decision to invest in Polar Capital PLC – Global Technology Fund or
Polar Capital Technology Trust plc which is an Alternative Investment Fund under the Alternative Investment Fund Managers Directive 2011/61/EU (“AIFMD”) managed by Polar Capital LLP the appointed
Alternative Investment Manager. In relation to each member state of the EEA (each a “Member State”) which has implemented the AIFMD, this document may only be distributed and shares may only be offered
or placed in a Member State to the extent that (1) the fund is permitted to be marketed to professional investors in the relevant Member State in accordance with AIFMD; or (2) this document may otherwise be
lawfully distributed and the shares may otherwise be lawfully offered or placed in that Member State (including at the initiative of the investor). As at the date of this document, the Fund has not been approved,
notified or registered in accordance with the AIFMD for marketing to professional investors in any member state of the EEA. However, such approval may be sought or such notification or registration may be
made in the future. Therefore this document is only transmitted to an investor in an EEA Member State at such investor’s own initiative. SUCH INFORMATION, INCLUDING RELEVANT RISK
FACTORS, IS CONTAINED IN THE COMPANY OR FUND’S OFFER DOCUMENT WHICH MUST BE READ BY ANY PROSPECTIVE INVESTOR.
Statements/Opinions/Views: All opinions and estimates constitute the best judgment of Polar Capital as of the date hereof, but are subject to change without notice, and do not necessarily represent the views
of Polar Capital. This material does not constitute legal or accounting advice; readers should contact their legal and accounting professionals for such information. All sources are Polar Capital unless otherwise
stated.
Third-party Data: Some information contained herein has been obtained from third party sources and has not been independently verified by Polar Capital. Neither Polar Capital nor any other party involved in or
related to compiling, computing or creating the data makes any express or implied warranties or representations with respect to such data (or the results to be obtained by the use thereof), and all such parties
hereby expressly disclaim all warranties of originality, accuracy, completeness, merchantability or fitness for a particular purpose with respect to any data contained herein.
Holdings: Portfolio data is “as at” the date indicated and should not be relied upon as a complete or current listing of the holdings (or top holdings) of the Company or Fund. The holdings may represent only a
small percentage of the aggregate portfolio holdings, are subject to change without notice, and may not represent current or future portfolio composition. Information on particular holdings may be withheld if it is in
the Company or Fund’s best interest to do so. It should not be assumed that recommendations made in future will be profitable or will equal performance of the securities in this document. A list of all
recommendations made within the immediately preceding 12 months is available upon request. This document is not a recommendation to purchase or sell any particular security. It is designed to provide
updated information to professional investors to enable them to monitor the Company or Fund.
Benchmarks: The following benchmark index is used: Dow Jones World Technology Index (Total Return). This benchmark is generally considered to be representative of the Technology Equity universe. This
benchmark is a broad-based index which is used for comparative/illustrative purposes only and has been selected as it is well known and is easily recognizable by investors. Please refer to www.djindexes.com
for further information on this index. Comparisons to benchmarks have limitations as benchmarks volatility and other material characteristics that may differ from the Company or Fund. Security holdings, industry
weightings and asset allocation made for the Company or Fund may differ significantly from the benchmark. Accordingly, investment results and volatility of the Company or Fund may differ from those of the
benchmark. The indices noted in this document are unmanaged, are unavailable for direct investment, and are not subject to management fees, transaction costs or other types of expenses that the Company or
Fund may incur. The performance of the indices reflects reinvestment of dividends and, where applicable, capital gain distributions. Therefore, investors should carefully consider these limitations and differences
when evaluating the comparative benchmark data performance. Information regarding indices is included merely to show general trends in the periods indicated, it is not intended to imply that the fund was similar
to the indices in composition or risk.
For non-US investor use only. Please refer to the Important Information at the end of this presentation. 50You can also read