Polar Capital Technology Trust Full-year results presentation - 15 July 2019
←
→
Page content transcription
If your browser does not render page correctly, please read the page content below

Polar Capital Technology Trust
          Full-year results presentation

          15 July 2019

          This presentation is for non-US investor use only
For non-USwww.polarcapital.co.uk
           investor use only. Please refer to the Important Information at the end of this presentation.   1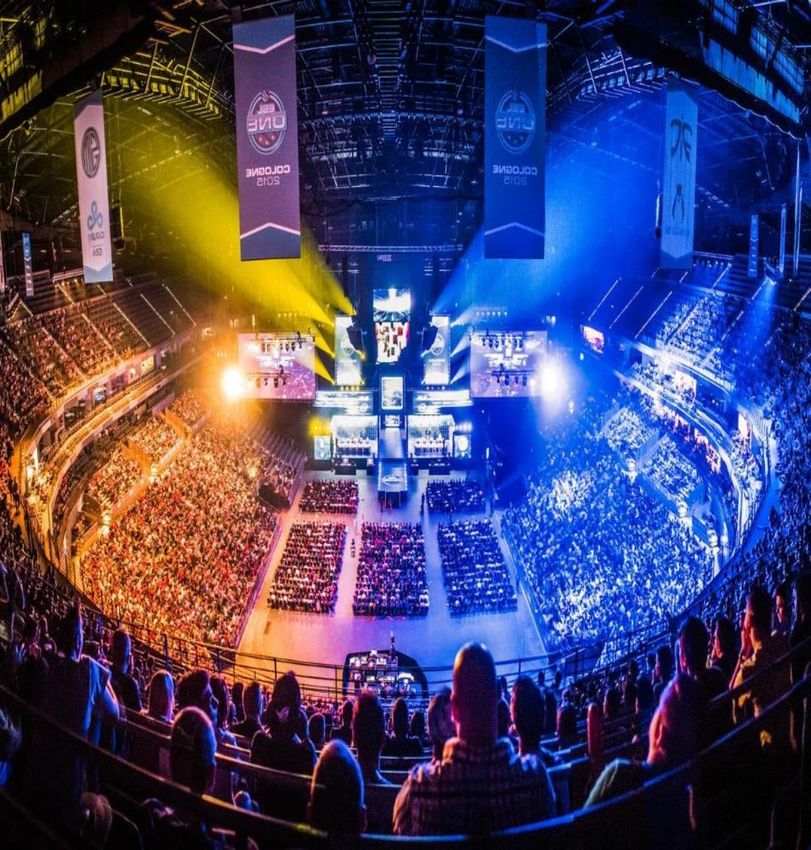
Results As At 30 April 2019

                                                                            Year ended                      Year ended      Change
                                                                             30/04/18                        30/04/19        (y/y)

  Net Assets                                                              £1,551,611,000                   £1,935,646,000   +24.8%

  NAV per ordinary share                                                       1159.69p                      1446.40p       +24.7%

  Price per ordinary share                                                     1148.00p                      1354.00p       +17.9%

  Benchmark Change                                                                                                          +21.4%

  Ordinary shares in issue                                                  133,795,000                     133,825,000     0.02%

Source: Polar Capital, 30 April 2019.

For non-US investor use only. Please refer to the Important Information at the end of this presentation.                             2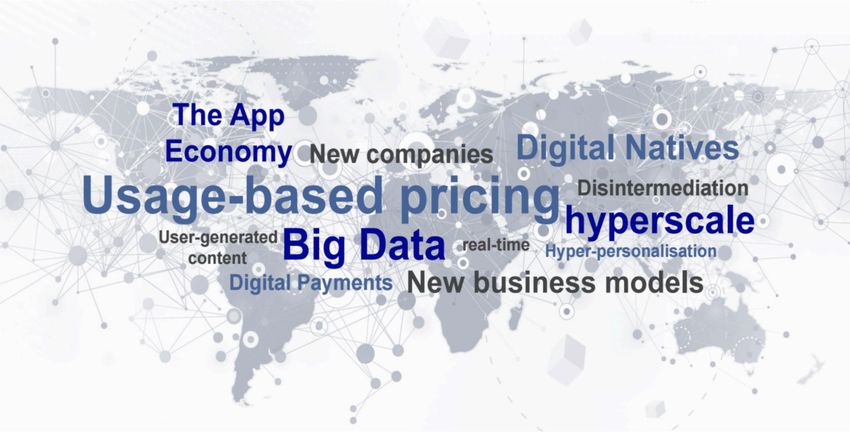
PCT As At 28 June 2019

                                                                            Year ended                      Year ended      Change       As at
                                                                             30/04/18                        30/04/19        (y/y)      28/06/19

  Net Assets                                                              £1,551,611,000                   £1,935,646,000   +24.8%   £1,931,775,000

  NAV per ordinary share                                                       1159.69p                      1446.40p       +24.7%     1443.51p

  Price per ordinary share                                                     1148.00p                      1354.00p       +17.9%     1338.00p

  Benchmark Change                                                                                                          +21.4%

  Ordinary shares in issue                                                  133,795,000                     133,825,000     0.02%     133,825,000

Source: Polar Capital, 28 June 2019.

For non-US investor use only. Please refer to the Important Information at the end of this presentation.                                              3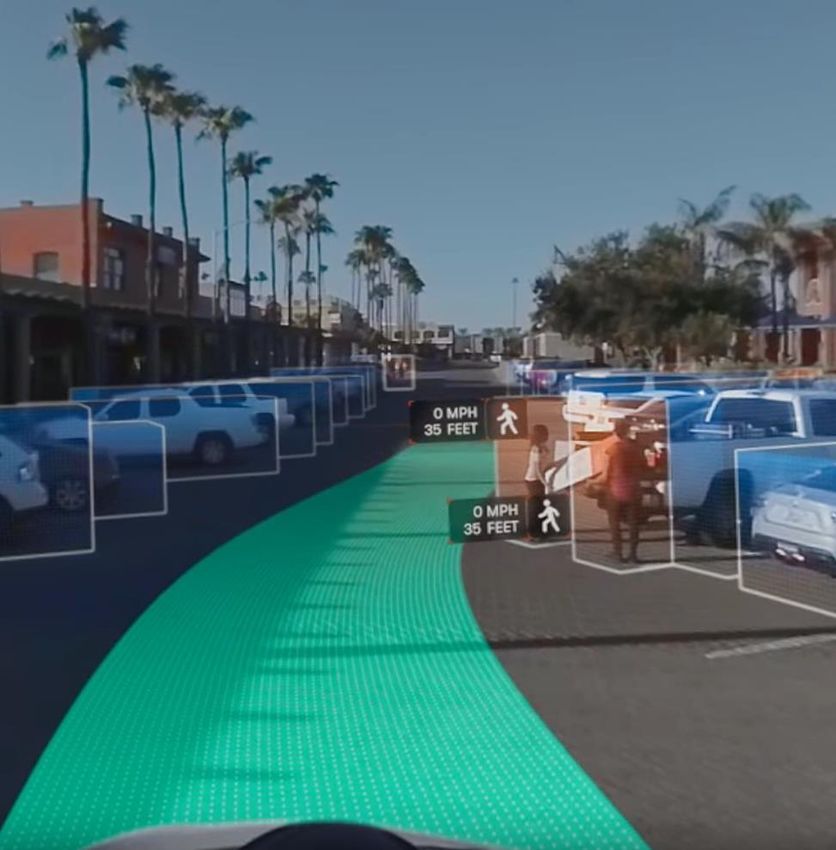
Full Year Review

DJ World Technology vs. FTSE World TR since Apr 2018                                                       • Global equities (FTSE World + 11.6%) added to
                                                                                                             their post financial crisis gains despite a weaker
                                                                                                             macroeconomic backdrop with the Fed volte-face
                                                                                                             in January sparking a dramatic reversal of fortunes
                                                                                                             for risk assets during the final third of the year.
                                                                                                           • Equity returns were substantially driven by the US
                                                                                                             (+19.8% in sterling terms) while most other
                                                                                                             markets delivered total returns +/- 5%. US
                                                                                                             exceptionalism reflected diverging fundamentals,
                                                                                                             resilient US earnings / buybacks / M&A and US
                                                                                                             Dollar strength (DXY +6.1%).
                                                                                                           • Technology stocks (DJ World Tech +21.4% in
                                                                                                             Sterling terms) enjoyed another impressive year of
                                                                                                             absolute and relative returns driven by superior
                                                                                                             earnings growth, disproportionate US exposure
                                                                                                             and the outperformance of software, cloud and
                                                                                                             payment stocks.

Source: Bloomberg, 10 July 2019.

For non-US investor use only. Please refer to the Important Information at the end of this presentation.                                                          4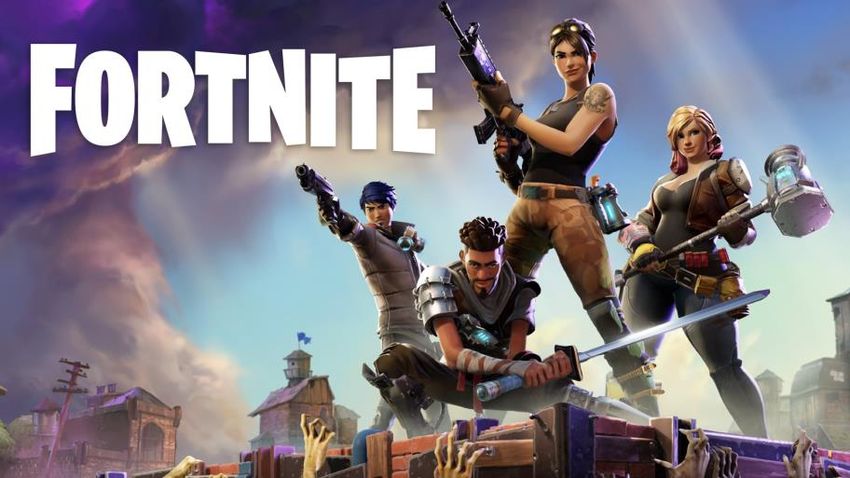
Full Year Review

US technology small caps vs. large caps since Apr 2018                                                     • NAV performance (+24.7%) exceeded the
                                                                                                             benchmark by 3.3%.
                                                                                                             – Key positives: AMD, software-as-a-service,
                                                                                                               payments
                                                                                                             – M&A supportive but only one take-out (Red Hat)
                                                                                                             – US exposure drove outperformance (Europe /
                                                                                                               Japan weaker due to semiconductor / robotics
                                                                                                               exposure) but stock selection remained positive
                                                                                                               across all market-capitalisation tiers
                                                                                                             – Negatives: GrubHub / select incumbents /
                                                                                                               computer gaming / liquidity

Source: Bloomberg, 10 July 2019. Past performance is not indicative or a guarantee of future returns.

For non-US investor use only. Please refer to the Important Information at the end of this presentation.                                                     5
Introduction To The Team
• Technology is at the core of the Polar Capital business

• One of the largest technology franchises in Europe with c.US$6.3bn under management

• Nine dedicated technology specialists – strong multi-cycle track record

                                       Global Technology                                      Polar Capital Technology                                          Automation & AI
       Funds                                  Fund                                                Trust (LSE listed)                                                Fund
                                           US$3.4bn                                                   US$2.5bn                                                     US$409m

                               Nick Evans                                                  Ben Rogoff                                                 Xuesong Zhao
                               Partner                                                     Partner                                                    Fund Manager/Analyst
                               Investment experience: 21 years                             Investment experience: 23 years                            Investment experience: 12 years

                               Sectors: US (small/mid-cap)                                 Sectors: US (mid/large-cap)                                Sectors: Asia (all-cap), global
                                                                                                                                                      semi / Semi cap equipment

 Fund Managers
                                                             Fatima Iu (Maternity Leave)                                 Alastair Unwin
                                                             Fund Manager/Analyst                                        Fund Manager/Analyst
                                                             Investment experience: 13 years                             Investment experience: 8 years

                                                             Sectors: Europe (all-cap), security,                        Sectors: Payments, SMB software,
                                                             networking, energy & med tech                               IT services

                         Chris Wittstock (based in US)                        Bradley Reynolds                                    Paul Johnson                                          Nick Williams
                         Senior Investment Analyst                            Investment Analyst                                  Investment Analyst                                    Investment Analyst
                         Investment experience: 34 years                      Investment experience: 11 years                     Investment experience: 7 years                        Investment experience: 3 years
     Analysts
                         Sectors: US Technology/Software                      Sectors: US (all-cap) – Internet &                  Sectors: Emerging Tech inc.                           Sectors: Global all-cap –
                                                                              digital media                                       3D printing, gaming & autos                           A&AI Fund

Source: Polar Capital, 28 June 2019.

For non-US investor use only. Please refer to the Important Information at the end of this presentation.                                                                                                                 6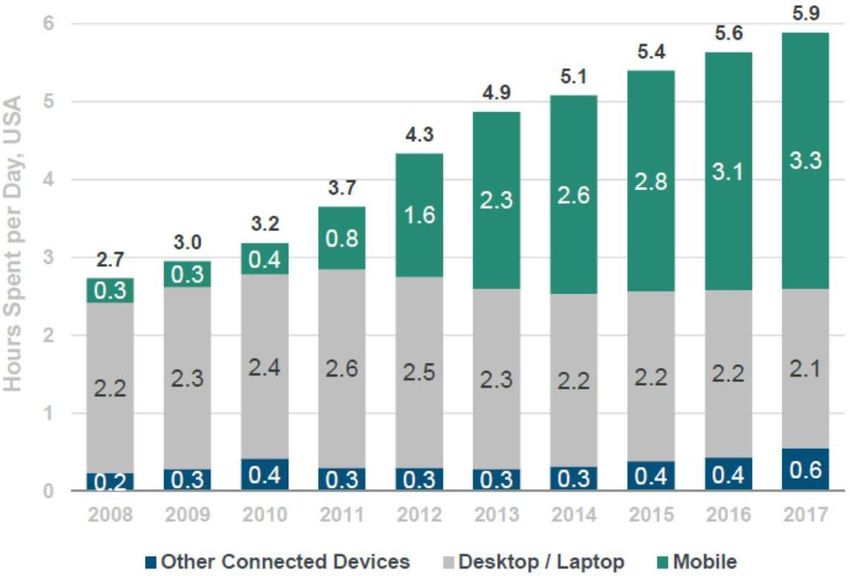
Investment Framework

                              4,000+ universe
                                                                                                                   Dynamic definition of technology
                                                                              Thematic overview                Real-world changes in user behaviour

                                                                                                                                   S-Curve inflections
                                                                              What we look for                            Secular themes / pure-plays

                                                                                                                             Last-generation winners
                                                                              What we avoid                                    Public venture capital

                                                                                                               Growth bias – rev/earnings / cash flow
                                                                              Valuation                    Price targets (bull/base/bear) / Risk reward

                                                                                                                             Bottom-up stock picking
                                                                              Portfolio construction                               Benchmark aware

                                                                                                                       Mis-execution / model change
                                                                              Sell disciplines                                 Price level attainment
                                     Portfolio

Source: Polar Capital.

For non-US investor use only. Please refer to the Important Information at the end of this presentation.                                                  7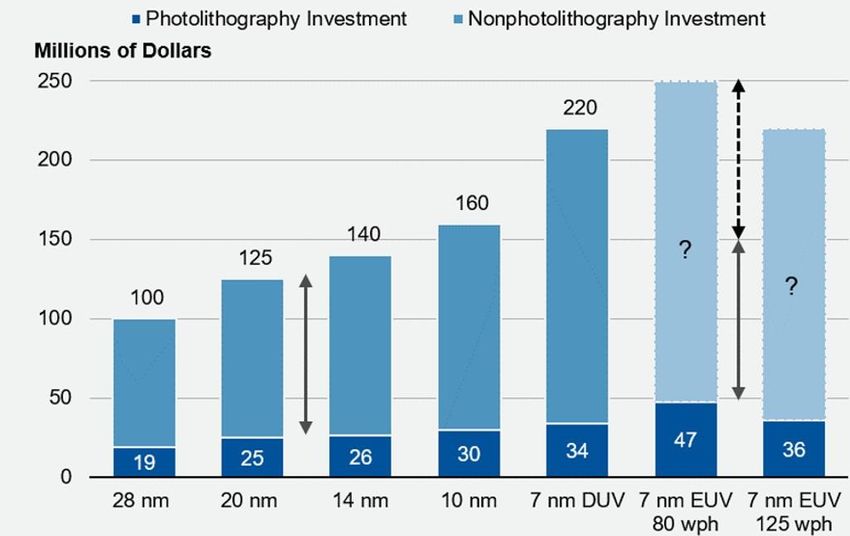
Thematic Investing: Hype vs. Reality
Polar Capital Global Technology Team
Searching for revenue growth and
cash flow inflections
Early stage
investors Index / ETF
R&D High growth Low growth No growth
Connected Home
negative OM% expanding OM% stable OM% uncertain / declining OM%
Deep Learning
Virtual Personal Assistants Machine Learning
Autonomous Vehicles
IoT Platform
Nanotube Electronics
Smart Robots Cognitive Computing
Edge Computing
Blockchain
Augmented Data Discovery
Commercial UAVs (Drones)
Smart Workforce
Conversational
Brain Computer Interface User Interface Cognitive Expert Advisors Developed market smartphones
Volumetric Displays
Wireless Networking (802.11n / ac) Enterprise software
IT Services
“Value Trap”?
Quantum Computing Server & Storage Virtualisation
Tablets / Ultrabooks (including Mac Air) LCD TV / HDTV
Digital Twin eCommerce / online advertising
Notebooks
Mobile broadband (4G / LTE)
Expectations
Home Broadband
Serverless PaaS EM smartphones & Ecommerce/Internet
PVR/DVR (Sky+)
Multiplayer / mobile gaming / streaming media
Sales
5G ERP / Traditional software
Moore’s stress / rising semi capital intensity
Smart agriculture / factory automation / robotics Feature phones / 3G
Human Augmentation
Software as a Service (SaaS)
Enterprise Taxonomy and Mainframe
Neuromorphic Hardware Enterprise SSD / 64 bit ARM architecture
Ontology Management Cloud computing (public/private – PaaS/IaaS) Desktop PC / printers
Virtual Reality
Deep Reinforcement Cyber security / app control / IPS
PND/GPS
Learning Big data / predictive analytics / Hadoop
Voice over LTE / WiFI (VoLTE / VoWiFI) Digital Camera (DSC)
Artificial General Software Defined Security
4D printing Intelligence Mobile / social / location based advertising DVD
Augmented Reality Mobile payments / mCommerce / NFC / biometrics VCR
Internet of Things (IoT) / M2M communication
Software defined networking (SDN) / NFV / 100G optical / FTTx)
Virtual Reality
Smart dust Clean energy (solar & wind)
Electric 3D printing
Energy
vehicles
Innovation Peak of Trough of Slope of Plateau of Storage
Trigger Inflated disillusionment enlightenment productivity
expectation
Time
Years to mainstream adoption: “Blue Sky” Emerging Mainstream Maturity / Decline
Less than 2 years 2 to 5 years 5 to 10 years More than 10 years Obsolete before plateau
Positioning of themes/products above is only intended to be indicative of approximate penetration/maturity
Source: Polar Capital & Gartner, July 2017. It should not be assumed that recommendations made in future will be profitable or will equal performance of the securities in this document. A list of all recommendations
made within the immediately preceding 12 months is available upon request.
For non-US investor use only. Please refer to the Important Information at the end of this presentation. 8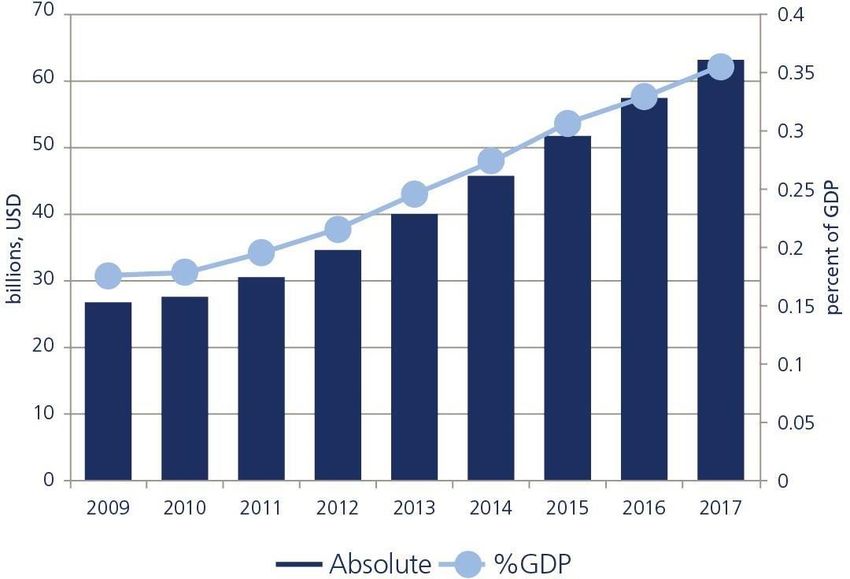
Technology: PE Expansion In-line With Market

Absolute sector valuation (PE):                                                                            Relative sector valuation (PE):
Compelling vs. history (1992 – present)                                                                    At / around market level – with superior balance sheet

Source: Ned Davis, 28 June 2019. Copyright 2018 Ned Davis Research, Inc. Further distribution prohibited without prior permission. All Rights Reserved. See NDR Disclaimer at www.ndr.com/copyright.html. For
data vendor disclaimers refer to www.ndr.com/vendorinfo/. Past performance is not indicative or a guarantee of future returns.

For non-US investor use only. Please refer to the Important Information at the end of this presentation.                                                                                                        9
‘Next-Generation’ Valuations

Internet valuation (equal cap weighted):                                                                            Software as a Service (SaaS) valuation:
EV/forward 2 year EV/EBITDA levels1                                                                                 EV/forward 12 month revenue multiples2
  25

  20

  15

  10

   5

   0
       Jan-13

                                   Oct-14

                                            May-15

                                                     Dec-15

                                                                                         Apr-18

                                                                                                           Jun-19
                                                                                                  Nov-18
                Aug-13

                         Mar-14

                                                              Jul-16

                                                                       Feb-17

                                                                                Sep-17

                                  UCITS Internet Average               ML Internet Index

Source: 1. Bloomberg, 28 June 2019. UCITS Internet sector (AMZN/FB/GOOG/BABA/700HK/PYPL) vs Bank of America Merrill Lynch Internet sector Index. 2. KeyBanc, Capital Markets, May 2019. Past performance is
not indicative or a guarantee of future returns.

For non-US investor use only. Please refer to the Important Information at the end of this presentation.                                                                                              10
‘Next-Generation’ Valuations
IT security valuation: Cloud vs legacy valuation
EV/forward 12 month revenue multiples1 EV/trailing 12 month revenue multiples2
14x
12x
EV/ trailing 12 month sales
10x
8x
6x
4x
2x
0x
Jan-10
May-13
Jun-14
Jan-15
May-18
Jun-19
Sep-11
Mar-12
Oct-12
Nov-13
Sep-16
Mar-17
Oct-17
Nov-18
Jul-10
Feb-11
Jul-15
Feb-16
LEGACY CLOUD
Source: 1. Citi Research, FactSet, July 2019. 2. Bloomberg, BofA Merrill Lynch Global Research, June 2019. Past performance is not indicative or a guarantee of future returns.
For non-US investor use only. Please refer to the Important Information at the end of this presentation. 11Valuations Supported By Elevated M&A…
Technology M&A since 19951 Select M&A activity2
Date Target Acquirer Premium Value $m
May-12 Ariba SAP 19% 4,324
Aug-12 Kenexa IBM 42% 1,260
Oct -12 OPNET Riverbed 31% 912
June-13 ExactTarget Salesforce 50% 2,419
Jul -13 Sourcefire Cisco 29% 2,185
Dec-13 Responsys Oracle 38% 1,438
Sept-14 Concur SAP 28% 7,241
Nov-14 Sapient Publicis 70% 3,264
Feb-15 Freescale NXP 2% 17,469
Apr-15 Informatica PE consortium 11% 4,784
May-15 Altera Intel 18% 14,354
Oct-15 KLA-Tencor Lam Research 27% 10,955
Nov-15 King Digital Activision Blizzard 16% 4,881
Cash & equivalents at top 25 tech companies3 Apr-16 Ruckus Wireless Brocade 45% 1,044
Apr-16 Cvent Vista Equity 68% 1,408
Jun-16 QLIK Technologies Thoma Bravo (PE) 5% 2,899
Jun-16 LinkedIn Microsoft 50% 26,401
Jun-16 Demandware Salesforce 56% 2,779
Jul-16 ARM Holdings SoftBank 43% 22,897
Jul-16 Netsuite Oracle 19% 8,716
Sept -16 Arcam GE 53% 688
Jan-17 AppDynamics Cisco 100%* 3,700
Mar-17 Nimble Storage HP Enterprise 45% 1,000
Mar-17 Mobileye Intel 34% 14,131
Mar-18 MuleSoft Salesforce.com 36% 5,667
June-18 GitHub Microsoft Private 7,500
Sept-18 Marketo Adobe Private 4,750
Oct-18 Red Hat IBM 63% 34,000
Nov-18 Qualtrics SAP Private 8,000
BOLD: owned in Fund
Source: 1. Centaur Partners, December 2015. 2. Bloomberg and Polar Capital, August 2018. 3. E&Y, June 2016. It should not be assumed that recommendations made in future will be profitable or will equal
performance of the securities in this document. A list of all recommendations made within the immediately preceding 12 months is available upon request.
For non-US investor use only. Please refer to the Important Information at the end of this presentation. 12….And Strengthening Fundamentals
Worldwide IT spending (2016 – 2022E)1
“I’ve never seen a demand environment
like this. Every CEO is using the positive
economic environment, as well as the
domestic tax cuts, as a way to accelerate
their digital transformation.”3
- Mark Benioff, CEO Salesforce.com
S&P 500 Revenue Growth CY18E2
“the business imperative of responding
to needs of a new generation of
customers, partners and suppliers who
expect transactions to be seamless, real-
time, Facebook-like in experience,
Amazon-like in reliability”4
Source: 1. Gartner Q417. 2. Factset, Q118. 3. https://siliconangle.com/blog/2018/02/28/citing-acceleration-demand-salesforce-com-beats-earnings-estimates/. 4. Baird.
It should not be assumed that recommendations made in future will be profitable or will equal performance of the securities in this document. A list of all recommendations made within the immediately preceding 12
months is available upon request. All opinions and estimates constitute the best judgment of Polar Capital as of the date hereof, but are subject to change without notice, and do not necessarily represent the views of
Polar Capital.
For non-US investor use only. Please refer to the Important Information at the end of this presentation. 13Digital Disruption Source: Polar Capital. For non-US investor use only. Please refer to the Important Information at the end of this presentation. 14
Digital Disruption: New Networks / Scale

Centralised, decentralised and distributed networks1

                                                                                                                                        >2tr annual searches                          552m active users
                                                                                                                                         5 apps > 1bn MAU                            $768bn GMV in F18

                                                                                                                                      2.2bn MAU, 1.45bn DAU                      1.3m properties online
                                                                                                                                       20+ minutes/user/day                      1.5m room nights/day

                                                                                                                                         WeChat: >1bn MAU                       >5bn rides, 78 countries

                                                                                                                                 562m products, 100m prime subs                       c.5m listings
                                                                                                                                   44% of 2017 US ecommerce                           >300m guest arrivals

Source: 1. RAND corporation, ‘Where wizards stay up late’’. Other sources: Amazon https://www.scrapehero.com/many-products-amazon-sell-january-2018/ https://www.nasdaq.com/article/youll-never-believe-
amazons-share-of-the-e-commerce-market-cm904080, techcrunch; Alibaba https://seekingalpha.com/article/4170052-alibaba-group-holding-limited-2018-q1-results-earnings-call-slides May 2018; Tencent, August 2017;
Facebook, https://zephoria.com/top-15-valuable-facebook-statistics/ ; Google, August 2017; Booking.com, July 2017; Airbnb, https://press.atairbnb.com/fast-facts/ March 2018; Uber, August 2017. The stocks represented
herein do not reflect the entire holdings contained within the Fund. It should not be assumed that recommendations made in future will be profitable or will equal performance of the securities in this document. A list of all
recommendations made within the immediately preceding 12 months is available upon request.

For non-US investor use only. Please refer to the Important Information at the end of this presentation.                                                                                                                 15
Digital Disruption: Artificial Intelligence (AI)
Collapsing Computing Costs (1850 – 2010)1
“Artificial Intelligence technologies will be the most
disruptive class of technologies over the next 10 years
due to radical computational power, near-endless
amounts of data, and unprecedented advances in
deep neural networks; these will enable organizations
with AI technologies to harness data in order to adapt to
new situations and solve problems that no one has
ever encountered previously”
- Gartner, July 20172
Source: 1. Aiimpacts.org (https://aiimpacts.org/trends-in-the-cost-of-computing/) 2. Gartner http://www.gartner.com/newsroom/id/3784363. The stocks represented herein do not reflect the entire holdings
contained within the Fund. All opinions and estimates constitute the best judgment of Polar Capital as of the date hereof, but are subject to change without notice, and do not necessarily represent the views of Polar
Capital.
For non-US investor use only. Please refer to the Important Information at the end of this presentation. 16Digital Disruption: Retail
US Retail Store Closings: 1995 – 2017 YTD1 Amazon Prime Subscriber Growth: 2012 – 20171
“I don't think retail is dead. “This business is all about reducing response time.
Mediocre retail experiences are dead.” In fashion, stock is like food. It goes bad quickly”
- Neil Blumenthal, Co-CEO @ Warby Parker2 - Jose Maria Castellano, former CEO Inditex Group3
Source: 1. KPCB, BI Intelligence. 2. KPCB. 3. Kornit Digital IR presentation. The stocks represented herein do not reflect the entire holdings contained within the Fund. It should not be assumed that recommendations
made in future will be profitable or will equal performance of the securities in this document. A list of all recommendations made within the immediately preceding 12 months is available upon request. All opinions and
estimates constitute the best judgment of Polar Capital as of the date hereof, but are subject to change without notice, and do not necessarily represent the views of Polar Capital.
For non-US investor use only. Please refer to the Important Information at the end of this presentation. 17Digital Disruption: Brands
Amazon Basics, US online market share1
“Big brands are being nibbled to death”2
– IAB CEO Randall Rothenberg
Source: 1. Amazon market share as at August 2016 . 2. http://www.businessinsider.com/new-breed-programmatic-first-ad-agencies-grabbing-business-ignored-by-traditional-firms-2018-4?IR=T The stocks represented
herein do not reflect the entire holdings contained within the Fund. It should not be assumed that recommendations made in future will be profitable or will equal performance of the securities in this document. A list of all
recommendations made within the immediately preceding 12 months is available upon request.
For non-US investor use only. Please refer to the Important Information at the end of this presentation. 18Digital Disruption: Brands
An extra large, wet,
double-shot
Coffee caramel macchiato
(and WiFi)
£1.00 £4.00
It should not be assumed that recommendations made in future will be profitable or will equal performance of the securities in this document. A list of all recommendations made within the immediately preceding
12 months is available upon request.
For non-US investor use only. Please refer to the Important Information at the end of this presentation. 19Digital Disruption: Content (Is Not King) US Recorded Music Revenues by Format (US$bn)1 Unique Artist Listening (2014 – 2017)2 • Number of TV channels watched Netflix1 • Spotify = 180m active users, 83m paid subscribers3, c.20% of global music industry revenues1 Source: 1. KPCB, 2017. 2. KPCB, 2018 3. https://expandedramblings.com/index.php/spotify-statistics/ The stocks represented herein do not reflect the entire holdings contained within the Fund. It should not be assumed that recommendations made in future will be profitable or will equal performance of the securities in this document. A list of all recommendations made within the immediately preceding 12 months is available upon request. For non-US investor use only. Please refer to the Important Information at the end of this presentation. 20
Digital Disruption: Brands

                                                                                               • Free-to-play ‘shooter’ where you battle 99 other players solo / team
                                                                                               • Released in July 2017 but became popular once a ‘Battle Royale’
                                                                                                 mode was introduced following the success of PC-based
                                                                                                 PlayerUnknown’s Battlegrounds (PUBG)
                                                                                               • More than just a ‘Call of Duty for kids’ – a new genre, easy to play
                                                                                                 including random elements to the gameplay, amusing emotes and
                                                                                                 skins (rather than pure skill / ‘pay to play’)
                                                                                               • >45m players and over 3m concurrent users1 and now the most
                                                                                                 watched game in YouTube history: 2.4bn views in Feb 182
                                                                                               • Monetisation via exclusive (time-sensitive) skins, items and emotes

Source: 1. https://www.pcgamesn.com/fortnite/fortnite-vs-pubg-map-players-graphics-gameplay-weapons-review#playercount 2. www.nme.com/news/fortnite-most-watched-game-youtube-history-2280172
It should not be assumed that recommendations made in future will be profitable or will equal performance of the securities in this document. A list of all recommendations made within the immediately preceding
12 months is available upon request.

For non-US investor use only. Please refer to the Important Information at the end of this presentation.                                                                                                       21
Eight Core Investment Themes
eCommerce / Digital Payments
eCommerce worth $2.3tr in 2017, c10% of total retail sales2
Mobile commerce reached $1.4tr in 2017, >60% of total2
Number of SKU → Payments, Logistics + Ecosystem
Digital Marketing / Advertising
Internet advertising worth $273bn in 20183, 43% of total ad spending3
Alphabet and Facebook combined account for c.90% of US market growth4
Brand Building → Transaction facilitation
Cyber / Physical Security
Security spending expected to reach $114bn in 2018E, +12.4% y/y5
Drivers include data breaches, regulation, digitalisation, cyberwarfare
Block & Protect → Detection, Mitigation & Response
Cloud Infrastructure / Artificial Intelligence (AI)
Public Cloud market worth $186bn in 2018 (+21% y/y growth)1
By 2021, 44% of application workloads expected to run in Cloud services6
Under-utilisation / cost arbitrage → Elastic Compute / TAM expansion
Source: 1. Gartner, April 2018; 2.eMarketer, January 2018; 3. eMarketer, March 2018; 4. BoA / ML / Zenith, US market Jan 18; 5. Gartner, August 2018; 6. MS, Geekwire July 2018. It should not be assumed that
recommendations made in future will be profitable or will equal performance of the securities in this document. A list of all recommendations made within the immediately preceding 12 months is available upon request.
For non-US investor use only. Please refer to the Important Information at the end of this presentation. 22Eight Core Investment Themes
Software / SaaS “Reshaping The World”
Usage based pricing disrupting $150bn2 maintenance market
As penetration rises (~30% today5 ) expect more strategic M&A by incumbents
SMB adoption / TAM expansion→ Enterprise / ‘rip and replace’
Digital Content / Games Software
$122bn gaming market1 growing to $152bn by 2020E driven by mobile, DLC / MTX1
eSports: 165m enthusiasts1 and a market worth $906m in 2018E, +38% y/y6
Leisure → Connected / Competitive
Robotics / Automation
$381bn TAM by 2023 (c.10% CAGR)3 enabled by advanced components (e.g. sensors, gears)
Position repeatability: 0.01mm (robots) / 0.5mm (humans) VS 0.02mm (iPhone64) / 0.1mm (cars)
Cost savings → Necessity, Flexibility (‘CoBot’) and Consistency
Rising Semiconductor Complexity
Rising capital intensity due to end of ‘Moore’s Law’ (transistor costs stop falling at 20nm)
Greater focus on integration / power consumption vs. performance / density
Lithography → Materials Improvement / Process Innovation
Source: 1. Newzoo, April 2018; 2. UBS, Jan 2016; 3. marketsandmarkets, May 2018; 4. http://www.cultofmac.com/305200/foxconns-promised-iphone-building-robot-army-running-late/ 5. IDC. 6. NewZoo May 2017. It
should not be assumed that recommendations made in future will be profitable or will equal performance of the securities in this document. A list of all recommendations made within the immediately preceding 12
months is available upon request.
For non-US investor use only. Please refer to the Important Information at the end of this presentation. 23Eight Core Investment Themes
Eight core theme breakdown (31 January 2017 – 28 June 2019)
24%
23%
22%
21%
20%
19%
18%
17%
16%
15%
14%
13%
12%
11%
10%
9%
8%
7%
6%
5%
4%
3%
2%
1%
0%
eCommerce / Digital Payments Digital Marketing / Advertising Cyber / Physical Security
Cloud Infrastructure / Artificial Intelligence Software / SaaS Digital Content / Games Software
Robotics / Automation Semiconductor / Material Science Apple/smartphone related
Other / Legacy Other / Growth Market hedge / beta offset
Source: Polar Capital, 28 June 2019. Past performance is not indicative or a guarantee of future returns.
For non-US investor use only. Please refer to the Important Information at the end of this presentation. 24eCommerce / Payments
• eCommerce growth continues unabated and reached $2.3tr in 2017, representing c.10% of total retail sales1
• Amazon’s share of US e-commerce now 49%, c.5% of all retail spend2
• Mobile now an integral part of the shopping experience, reaching $1.4tr in 2017 (c6% of total retail sales)3
• Improvements in payments / delivery continue to reduce online buying friction / change user behaviour and expectations
eCommerce as % of US retail sales4
Sample Holdings
Source: Polar Capital, unless otherwise stated. 1. Based on eMarketer forecast, January 2018 . 2. Techcrunch, July 2018 3. eMarketer January 2018. 4. Bond Capital, July 2019. It should not be assumed that
recommendations made in future will be profitable or will equal performance of the securities in this document. A list of all recommendations made within the immediately preceding 12 months is available upon request. All
opinions and estimates constitute the best judgment of Polar Capital as of the date hereof, but are subject to change without notice, and do not necessarily represent the views of Polar Capital.
For non-US professional investor use only. Please refer to the Important Information at the end of this presentation. 25eCommerce / Payments
• Mobile remains the dominant trend in payments while merchant adoption represents the biggest obstacle
• Smartphone is replacing the physical wallet, aided by the use of biometric authentication – Apple Pay etc
• Bank are being reduced to ‘dumb pipes’ as value moves to the networks
• Blockchain: a longer-term opportunity, enabling payment systems to operate in a decentralised framework
Global Mobile Payments (2010 – 2017E)1 China Mobile Payment Volume2
Sample Holdings
Source: 1. Statista, 2016 2. KPCB, August 2018. It should not be assumed that recommendations made in future will be profitable or will equal performance of the securities in this document. A list of all
recommendations made within the immediately preceding 12 months is available upon request. All opinions and estimates constitute the best judgment of Polar Capital as of the date hereof, but are subject to
change without notice, and do not necessarily represent the views of Polar Capital.
For non-US professional investor use only. Please refer to the Important Information at the end of this presentation. 26Digital Advertising / Marketing
• Global online advertising expected to reach $273bn in 2018, c. 43% of total advertising spend1
• Paid Search and Social Media markets expected to grow 14% and 27% respectively in 20172
• Size matters: US market dominated by Alphabet and Facebook, combined c. 90% of overall growth in 20172
• Growth drivers: continued improvement in ROI measurement, video content, location-based marketing
% Media Time vs. Advertising Spending (2010 vs. 2018)3
Sample Holdings
Source: Polar Capital, unless otherwise stated. 1. Based on eMarketer forecast, March 2018. 2. BoAML/Zenith, US market January 2018. 3. Bond Capital, July 2019. It should not be assumed that recommendations made
in future will be profitable or will equal performance of the securities in this document. A list of all recommendations made within the immediately preceding 12 months is available upon request. All opinions and estimates
constitute the best judgment of Polar Capital as of the date hereof, but are subject to change without notice, and do not necessarily represent the views of Polar Capital.
For non-US professional investor use only. Please refer to the Important Information at the end of this presentation. 27Software As A Service (SaaS)
• Rental / usage-based model is expanding the software market while threatening incumbent franchises / maintenance
• Software as a service (SaaS) targets a $164bn opportunity by 2022, c. 30% penetrated today1
• Recent acceleration in M&A supportive of our view that Cloud disruption is intensifying
• Top Categories: Communications (UCaaS), Sales/Marketing, Analytics, Education, Procurement, Vertical/Horizontal & SMB
Worldwide SaaS and Cloud Software (2012 – 2017E)2
Sample Holdings
Source: Polar Capital unless otherwise stated. 1. IDC. 2. KeyBanc, August 2018. It should not be assumed that recommendations made in future will be profitable or will equal performance of the securities in this
document. A list of all recommendations made within the immediately preceding 12 months is available upon request. All opinions and estimates constitute the best judgment of Polar Capital as of the date hereof, but are
subject to change without notice, and do not necessarily represent the views of Polar Capital.
For non-US investor use only. Please refer to the Important Information at the end of this presentation. 28Digital / Online Gaming
• Video games: $122bn market in 2017 → $152bn by 2020E (~10% CAGR), driven by new console cycle, mobile and AR/VR1
• Improving market dynamics: industry consolidation = greater scale / profitability / barriers to entry
• The shift to digital distribution (full game digital downloads / additional content) improves margins and expands the TAM
• Meteoric rise of ‘Battle Royale’ games PUBG and Fortnite (>40m MAUs2, $296m sales)3 = risk and opportunity?
Global Games Market ($bn) 2017 – 2020E1
Sample Holdings
Source: 1. Newzoo, Apr 2018. 2. Tencent, May 2018 3. Superdata (April data) May 2018. It should not be assumed that recommendations made in future will be profitable or will equal performance of the securities in this
document. A list of all recommendations made within the immediately preceding 12 months is available upon request. All opinions and estimates constitute the best judgment of Polar Capital as of the date hereof,
but are subject to change without notice, and do not necessarily represent the views of Polar Capital.
For non-US professional investor use only. Please refer to the Important Information at the end of this presentation. 29Cyber / Physical Security
• Security remains one of the more attractive areas within traditional IT budgets, expected to grow c. 12% to $114bn in 2018E1
• Favourable backdrop likely to persist – regulation (GDPR, Federal Action Plan), digitalisation, cyberwarfare, IoT / BYOD
• Priorities shifting from ‘block and protect’ to rapid detection and response (c. 60% of budgets by 2020)2
• Preferred areas: email security, privileged account management (PAM), vulnerability management (VM) and SIEM
US cyber security spending: 2009 – 20173
Sample Holdings
Source: 1. Gartner August 2018. 2. Gartner, January 2016. 3. atlanticcouncil.org, 2015. It should not be assumed that recommendations made in future will be profitable or will equal performance of the securities in this
document. A list of all recommendations made within the immediately preceding 12 months is available upon request. All opinions and estimates constitute the best judgment of Polar Capital as of the date hereof, but are
subject to change without notice, and do not necessarily represent the views of Polar Capital.
For non-US professional investor use only. Please refer to the Important Information at the end of this presentation. 26Cloud / AI Infrastructure
• Having debunked many of the earlier barriers to adoption, we expect Cloud migration to accelerate over the coming years
• Computing / storage costs headed lower: Amazon Web Services (AWS) has lowered prices 61 times since launch1
• Expect ‘all’ incremental capacity added in cloud: c. 50% of spend by 20192 and 44% of application workloads by 20213
• Cloud deflation likely to be felt throughout the IT stack while pressuring pricing / volume in the $866bn IT services / BPO market4
Cloud Service Revenue: Amazon + Azure + Cloud: Q1’15 – Q1’195
Sample Holdings
Source: Polar Capital unless otherwise stated. 1. Amazon, May 2017. 2. Deutsche Bank, January 2016. 3. Morgan Stanley / Geekwire August 2018 4. BNP, Gartner, July 2016. 5. Bond Capital, July 2019. It should not be
assumed that recommendations made in future will be profitable or will equal performance of the securities in this document. A list of all recommendations made within the immediately preceding 12 months is available upon
request. All opinions and estimates constitute the best judgment of Polar Capital as of the date hereof, but are subject to change without notice, and do not necessarily represent the views of Polar Capital.
For non-US professional investor use only. Please refer to the Important Information at the end of this presentation. 31Cloud / AI Infrastructure
• Having debunked many of the earlier barriers to adoption, we expect Cloud migration to accelerate over the coming years
• Computing / storage costs headed lower: Amazon Web Services (AWS) has lowered prices 61 times since launch1
• Expect ‘all’ incremental capacity added in cloud: c. 50% of spend by 20192 and 44% of application workloads by 20213
• Cloud deflation likely to be felt throughout the IT stack while pressuring pricing / volume in the $866bn IT services / BPO market4
Enterprise Computing Workloads: 2016 – 2024E5
Sample Holdings
Source: Polar Capital unless otherwise stated. 1. Amazon, May 2017. 2. Deutsche Bank, January 2016. 3. Morgan Stanley / Geekwire August 2018 4. BNP, Gartner, July 2016. 5. Gartner, August 2016. It should not be
assumed that recommendations made in future will be profitable or will equal performance of the securities in this document. A list of all recommendations made within the immediately preceding 12 months is available upon
request. All opinions and estimates constitute the best judgment of Polar Capital as of the date hereof, but are subject to change without notice, and do not necessarily represent the views of Polar Capital.
For non-US professional investor use only. Please refer to the Important Information at the end of this presentation. 32Robotics / Automation
• The Fourth Industrial Revolution underway driven by Cyber Physical Systems, Internet of Things and Cloud Services
• Over 25% of manufacturing tasks that can be automated may be performed by robots over the next decade1
• Human-robot collaboration will radically alter the way factories operate, making highly versatile production lines possible
• $80bn TAM by 2022 (c.12% CAGR)2 - we prefer high precision components / sensors over robotic manufacturers
Sensor prices (1992 – 2014)3
Sample Holdings
Source: 1. Boston Consulting Group, September 2015. 2. marketsandmarkets, February 2016. 3. Rob Lineback, IC Insights. It should not be assumed that recommendations made in future will be profitable or will equal
performance of the securities in this document. A list of all recommendations made within the immediately preceding 12 months is available upon request. All opinions and estimates constitute the best judgment of Polar
Capital as of the date hereof, but are subject to change without notice, and do not necessarily represent the views of Polar Capital.
For non-US investor use only. Please refer to the Important Information at the end of this presentation. 33Robotics / Automation
• The Fourth Industrial Revolution underway driven by Cyber Physical Systems, Internet of Things and Cloud Services
• Over 25% of manufacturing tasks that can be automated may be performed by robots over the next decade1
• Human-robot collaboration will radically alter the way factories operate, making highly versatile production lines possible
• $80bn TAM by 2022 (c.12% CAGR)2 - we prefer high precision components / sensors over robotic manufacturers
Global shipments of industrial robots (2016-205E)3
Sample Holdings
Source: 1. Boston Consulting Group, September 2015. 2. marketsandmarkets, February 2016. 3. Recode, ABI Research. It should not be assumed that recommendations made in future will be profitable or will equal
performance of the securities in this document. A list of all recommendations made within the immediately preceding 12 months is available upon request. All opinions and estimates constitute the best judgment of Polar
Capital as of the date hereof, but are subject to change without notice, and do not necessarily represent the views of Polar Capital.
For non-US investor use only. Please refer to the Important Information at the end of this presentation. 34‘More Than Moore’ – Rising Semiconductor Complexity • Cost reductions tied to shrinkage stops
Smartphones / Apple / 5G
• The smartphone market is now mature: global penetration at c.66%1 and unit growth of just +2.7% in 2017 and -5.6% y/y in Q417 2
• Replacement cycles are extending: 2.4 years (2016) → 2.6 years in 20173. The PC experience is sobering (5-6 years today)4
• Apple remains a unique story: mass affluent customer base / premium pricing and a walled-garden services business
• 5G: ultra-low latency enabling new business models, infrastructure refresh and a $18bn semiconductor opportunity by 20225

Smartphone unit shipments (2009 - 2018)6

                                                                                                                                                                                Sample Holdings

Source: 1. https://www.zenithmedia.com/smartphone-penetration-reach-66-2018/ 2. https://www.gartner.com/newsroom/id/ 3. https://www.cnbc.com/2018/02/23/smartphone-sales-are-slowing-and-here-are-two-key-
reasons-why.html 4. https://www.pcworld.com/article/3078010/hardware/the-pc- upgrade-cycle-slows-to-every-five-to-six-years-intels-ceo-says.html) 5. BoA 6. Bond Capital, July 2019. It should not be assumed that
recommendations made in future will be profitable or will equal performance of the securities in this document. A list of all recommendations made within the immediately preceding 12 months is available upon request. All
opinions and estimates constitute the best judgment of Polar Capital as of the date hereof, but are subject to change without notice, and do not necessarily represent the views of Polar Capital.

For non-US investor use only. Please refer to the Important Information at the end of this presentation.                                                                                                                36
Emerging Themes Source: Gartner, August 2018. For non-US investor use only. Please refer to the Important Information at the end of this presentation. 37
Voice As The Computing Interface
Words recognised by machine: 1970 - 20162 • Humans speak 150 vs. type 40 words per minute on average
• Recognition accuracy shift from 95% to 99% will drive
ubiquity of voice as an interface for a variety of apps
• By 2020, c50% of all searches via images or speech1
Sample
Holdings
Source: 1. Baidu / KPCB, 2016. 2. KPCB, 2016. It should not be assumed that recommendations made in future will be profitable or will equal performance of the securities in this document. A list of all
recommendations made within the immediately preceding 12 months is available upon request. All opinions and estimates constitute the best judgment of Polar Capital as of the date hereof, but are subject to change
without notice, and do not necessarily represent the views of Polar Capital.
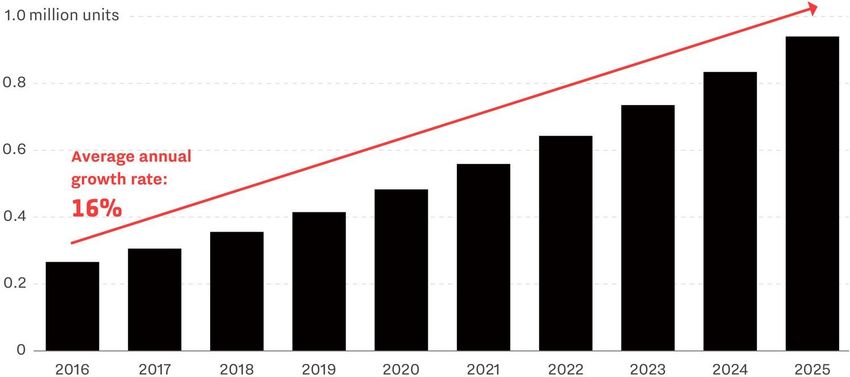
For non-US investor use only. Please refer to the Important Information at the end of this presentation. 38Electric / Autonomous Vehicles
• Automotive market ripe for reinvention: connectivity / infotainment,
advanced driver assistance systems (ADAS) / autonomous driving,
vehicle electrification
• 1.25m deaths worldwide due to vehicle crashes in 2014 while
94% of US accidents involve human choice / error1
• Global ADAS / autonomous vehicle penetration forecast to grow from
12% in 2015, to 48% in 2020 and 70% by 20252
• Fully autonomous driving by 2020? Technically yes – Waymo
cars have already completed 5m miles3 https://waymo.com/tech
• Car ownership? Depreciating, underutilised asset used just c. 4% of
the time → shared private rides becoming mainstream4
“We are approaching the end of the
automotive era. The tipping point will
come when 20-30% of vehicles are
fully autonomous. Countries will look
at the accident statistics and figure
out that human drivers are causing
99.9% of the accidents”5
– Bob Lutz, former vice Chairman GM
Sample
Holdings
Source: 1. https://waymo.com/tech/. 2. KPCB, 2016. 3. https://waymo.com/tech/. 4. Baidu / KPCB, 2016. 5. www.autonews.com Chart from https://waymo.com/tech/. It should not be assumed that recommendations
made in future will be profitable or will equal performance of the securities in this document. A list of all recommendations made within the immediately preceding 12 months is available upon request. Forecasts contained
herein are for illustrative purposes only and does not constitute advice or a recommendation. All opinions and estimates constitute the best judgment of Polar Capital as of the date hereof, but are subject to change
without notice, and do not necessarily represent the views of Polar Capital.
For non-US investor use only. Please refer to the Important Information at the end of this presentation. 39eSports
• eSports = Competitive gaming as a spectator sport
• Rapidly growing TAM: $906m in 2018E, +38% y/y2
• Social media has grown eSports viewership making professional
leagues with full time players / teams possible
– 165m enthusiasts and a further 215m occasional viewers expected in 20181
– 42% of eSports viewers do not play the games themselves2
– Twitch reaches 55% of US millennial males3
– >10m people watched Overwatch League’s opening weekend4
• Sales opportunities: broadcast rights, franchise sales, advertising,
sponsorship, tickets and merchandise
– Overwatch franchises $20m each; Twitch paid $90m for 2yr broadcast rights5
Sample
Holdings
Source: 1. Newzoo, February 2018. 2. Newzoo, May 2017. 3. comScore, September 2017. 4. https://blizzardwatch.com/2018/01/17/10-million-viewers-watched-overwatch-leagues-opening-week/. 5. www.sporttechie.com,
July 2018. It should not be assumed that recommendations made in future will be profitable or will equal performance of the securities in this document. A list of all recommendations made within the immediately preceding
12 months is available upon request. Forecasts contained herein are for illustrative purposes only and does not constitute advice or a recommendation.
For non-US investor use only. Please refer to the Important Information at the end of this presentation. 40PCT Positioning
Sector exposure (%) Market cap exposure (%)
Software 28.3%
Semiconductors & Semiconductor Equipment 15.9% Large Cap (>$10bn) 76.9%
Interactive Media & Services 14.5%
Mid Cap (>$1bn - $10bn) 21.5%
Technology Hardware, Storage & Peripherals 8.4%
Internet & Direct Marketing Retail 6.3% Small Cap (PCT Positioning
Largest overweights Largest underweights Market cap exposure versus benchmark
Advanced Micro Devices Alphabet
Amazon Amadeus IT Holding
Analog Devices Apple
Large-cap -12.4%
ANSYS Inc Baidu
Arista Networks Broadcom
Cognex Corp Cisco Systems
Five9 Cognizant Technology Solutions
IAC/InterActiveCorp Facebook Mid-cap 11.9%
Keyence IBM
Mastercard Infosys
Medidata Solutions Intel
Mimecast Intuit
Small-cap 0.8%
PayPal Holdings Micron Technology
Proofpoint Microsoft
ServiceNow NASDAQ 100 Stock Index Put Option 6900 Oct 2019
-20% -15% -10% -5% 0% 5% 10% 15%
Tokyo Electron Oracle
Uber Technologies Red Hat
Universal Display Corp SAP
Visa SK Hynix
Zendesk Workday
Source: Polar Capital, as at 28 June 2019. Bold denotes a zero position. It should not be assumed that recommendations made in future will be profitable or will equal performance of the securities in this document. A
list of all recommendations made within the immediately preceding 12 months is available upon request.
For non-US investor use only. Please refer to the Important Information at the end of this presentation. 42PCT Positioning
Thematic breakdown1,2 Thematic breakdown relative to benchmark (%)1,2
10.0%
Legacy
10% 5.0%
Internet
22%
0.0%
-5.0%
Semiconductors
22%
-10.0%
Cloud: applications
17%
-15.0%
Smartphones
1%
Medical Technology Apple -20.0%
1% 5%
Electric Vehicles
0% -25.0%
Solar
Internet
Big data / AI
Video Games
Emerging
Factory automation/robotics
Cloud: infrastructure
Payments
Cybersecurity
Automotive
IoT
Smartphones
3D Printing
Other
Medical Technology
Solar
Legacy
Cloud: applications
Materials
Apple
Semiconductors
Electric Vehicles
0% Emerging Cloud: infrastructure
1% Other IoT 5%
3D Printing 0% 1% Payments Cybersecurity
0% 4% 2%
Automotive Big data / AI
Factory 2% 3%
automation/robotics
5%
Source: Polar Capital, 28 June 2019. 1. Benchmark: Dow Jones Global Technology Index (TR). 2. Index exposure based on Top 100 index constituents. Figures are shown as gross weightings.
It should not be assumed that recommendations made in future will be profitable or will equal performance of the securities in this document. A list of all recommendations made within the immediately preceding 12
months is available upon request.
For non-US investor use only. Please refer to the Important Information at the end of this presentation. 43PCT Positioning
Index Index ex
PCT1 Sales growth 2020 – PCT vs. benchmark2
Top 100 Apple
60.0
PE (Median) CY 30.6 22.2 22.4
NY 24.8 18.7 18.7
Earnings growth (Median) CY 2.7 5.5 5.5
NY 16.7 14.8 14.8 50.0
EV/Sales (Mean) CY 8.6 6.2 6.3
NY 6.8 5.4 5.5
EV/Sales (Median) CY 6.8 4.8 4.9
NY 5.9 4.4 4.4 40.0
% of Portfolio
EV/Sales (Weighted)** CY 7.7 5.9 6.3
NY 6.4 5.2 5.5
Sales Growth (Mean) CY 13.4 7.8 7.9
NY 24.2 11.0 11.1 30.0
Sales Growth (Median) CY 12.0 5.9 5.9
NY 17.2 8.9 9.0
Sales Growth (Weighted)** CY 13.4 8.3 9.6
20.0
NY 18.3 11.9 12.7
Gross Margin (Mean) 60.3 58.3 58.5
Gross Margin (Median) 65.1 61.5 61.7
Gross Margin (Weighted)** 58.5 57.8 60.4 10.0
Net Cash as % mkt cap Avg 5.5 -1.6 -1.7
Wgtd** 6.8 5.4 4.5
Market Cap ($m) Mean 80,975 85,209 76,570
0.0
Median 10,312 27,701 27,686 50
Wgtd** 325,523 451,910 385,715 PCT GROSS WEIGHT BENCH GROSS WEIGHT
Source: 1. Polar Capital, 05 July 2019. Figures in blue exclude Apple (11.9% gross) from the Index Top 100. CY = Current Year, NY = 2018 calendar year estimates. 2. Polar Capital, 05 July 2019. Benchmark: Dow
Jones Global Technology Index (TR). Past performance is not indicative or a guarantee of future results. All opinions and estimates constitute the best judgment of Polar Capital as of the date hereof, but are subject to
change without notice, and do not necessarily represent the views of Polar Capital. It should not be assumed that recommendations made in future will be profitable or will equal performance of the securities in this
document. A list of all recommendations made within the immediately preceding 12 months is available upon request.
For non-US investor use only. Please refer to the Important Information at the end of this presentation. 44Appendix For non-US investor use only. Please refer to the Important Information at the end of this presentation. 45
Team Biographies
                                   Ben Rogoff – Partner
                                   Experience: 23 years
                                   Ben joined Polar Capital in May 2003. He is lead manager of Polar Capital Technology Trust plc and is a Fund Manager of the Polar Capital
                                   Global Technology Fund and Polar Capital Automation and Artificial Intelligence Fund. He has been a technology specialist for 23 years. Prior to
                                   joining Polar Capital he began his career in fund management at CMI, as a global technology analyst. He moved to Aberdeen Fund Managers in
                                   1998 where he spent four years as a senior technology manager. Ben graduated from St Catherine’s College, Oxford in 1995.

                                   Nick Evans – Partner
                                   Experience: 21 years
                                   Nick joined Polar Capital in September 2007 and has 21 years’ experience as a technology specialist. He has been lead manager of the Polar
                                   Capital Global Technology Fund since January 2008 and is also a fund manager on the Polar Capital Technology Trust and Polar Capital
                                   Automation and Artificial Intelligence Fund. Prior to joining Polar he was head of technology at AXA Framlington and lead manager of the AXA
                                   Framlington Global Technology Fund and the AXA world fund (AWF) – Global Technology from 2001 to 2007 (both rated five stars by S&P). He
                                   also spent three years as a Pan-European investment manager and technology analyst at Hill Samuel Asset Management. Nick has a degree in
                                   Economics and Business Economics from Hull University, has completed all levels of the ASIP, and is a member of the CFA Institute.

                                   Xuesong Zhao
                                   Experience: 12 years
                                   Xuesong joined Polar Capital in May 2012 and has 12 years’ investment experience. He is a lead manager of the Polar Capital Automation and
                                   Artificial Intelligence Fund and is a Fund Manager on the Polar Capital Technology Trust and Polar Capital Global Technology Fund. Prior to
                                   joining Polar Capital, he spent four years working as an investment analyst within the emerging markets & Asia team at Aviva Investors, where he
                                   was responsible for the technology, media and telecom sectors. Prior to that, he worked as a quantitative analyst and risk manager for the
                                   emerging market debt team at Pictet Asset Management. He started his career as a financial engineer at Algorithmics, now owned by IBM, in
                                   2005. He holds an MSc in Finance from Imperial College of Science & Technology, a BA (Hons) in Economics from Peking University. He is also
                                   a CFA charterholder.

For non-US investor use only. Please refer to the Important Information at the end of this presentation.                                                                       46
Team Biographies cont.
Fatima Iu (Maternity Leave)
Experience: 13 years
Fatima joined Polar Capital in April 2006 and has 13 years’ experience. She is a fund manager on the Polar Capital Technology Fund, Polar
Capital Technology Trust and Polar Capital Automation and Artificial Intelligence Fund. She is responsible for the coverage of European
Technology, Global Security, Networking, Clean Energy and Medical Technology. Prior to joining Polar, Fatima spent 18 months working at
Citigroup Asset Management with a focus on consumer products and pharmaceuticals. Fatima holds an MSc in Medicinal Chemistry from
Imperial College of Science & Technology in London. She is also a CFA Charterholder.
Alastair Unwin
Experience: 8 years
Alastair joined Polar Capital in June 2019 as a Fund Manager and Senior Analyst. Prior to joining Polar Capital, Alastair co-managed the Arbrook
American Equities Fund. Between 2014 and 2018 he launched and then managed the Neptune Global Technology Fund and managed the
Neptune US Opportunities Fund. Prior to Neptune, Alastair was a technology analyst at Herald Investment Management. Alastair has a BA (1st
Class Hons) in history from Trinity College, Cambridge and is a CFA Charterholder.
Chris Wittstock
Experience: 34 years
Chris joined Polar Capital in July 2017 as a senior technology analyst based in the US. Prior to joining, Chris led the International research sales
effort at Pacific Crest, a technology investment bank that was ultimately acquired by KeyBanc Capital in 2014. Prior to joining Pacific Crest in
2004, Chris led the International sales effort at Schwab SoundView, the successor company to Soundview Technology Group where he was
since 1996. Chris spent significant time in Europe as a derivative products specialist in the late 80s and 90s, lastly with Morgan Stanley
International. He is a graduate of University of Toronto, Faculty of Engineering (Industrial).
For non-US investor use only. Please refer to the Important Information at the end of this presentation. 47Team Biographies cont.
Brad Reynolds
Experience: 11 years
Brad joined Polar Capital in October 2011 as an Investment Analyst and Trader working as part of the European Market Neutral team with a focus
on media and internet. In 2014, he joined the Technology team as an Investment Analyst. Prior to joining Polar Capital, Brad worked at Ratio
Asset Management as an analyst and trader, and from 2007 to 2011 he worked at F&C as a hedge fund analyst. Brad started his career in 2001
at Gartmore Investment Management working within the hedge fund team. Brad graduated from the University of Hertfordshire with a degree in
Business Studies.
Paul Johnson
Experience: 7 years
Paul joined Polar Capital in March 2012 as an Investment Analyst on the Polar Capital Technology team. Prior to joining Polar Capital, Paul
helped manage a private investment fund between 2010 and 2012. Paul holds a BA in History and Politics and a Masters in History from Keele
University. He has successfully passed all three levels of the CFA program.
Nick Williams
Experience: 3 years
Nick joined Polar Capital in June 2019 as an analyst on the Polar Capital Technology team. Prior to joining Polar Capital, Nick worked at Neptune
Investment Management as the Assistant Fund Manager on the US Opportunities growth fund. Prior to that he worked in academia at the
University of Oxford. Nick holds an MChem Chemistry from the University of Oxford.
For non-US investor use only. Please refer to the Important Information at the end of this presentation. 48Important Information
Polar Capital
16 Palace Street
London SW1E 5JD
Important Information: This document is provided for the sole use of the intended recipient and is not a financial promotion. It shall not and does not constitute an offer or solicitation of an offer to make an
investment into any fund or Company managed by Polar Capital. It may not be reproduced in any form without the express permission of Polar Capital and is for the intended recipient only. Clients who have
access to this document should make themselves aware of all relevant risk factors relating to these products contained in the Fund or Company’s Prospectus or latest financial report. The law restricts distribution
of this document in certain jurisdictions; therefore, it is the responsibility of the reader to inform themselves about and observe any such restrictions. It is the responsibility of any person/s in possession of this
document to inform themselves of, and to observe, all applicable laws and regulations of any relevant jurisdiction. Polar Capital Technology Trust plc is an Investment Company with investment trust status and as
such its ordinary shares are excluded from the FCA’s (Financial Conduct Authority’s) restrictions which apply to non-mainstream investment products. The Company conducts its affairs and intends to continue to
do so for the foreseeable future so that the exclusion continues to apply. It is not designed to contain information material to an investor’s decision to invest in Polar Capital PLC – Global Technology Fund or
Polar Capital Technology Trust plc which is an Alternative Investment Fund under the Alternative Investment Fund Managers Directive 2011/61/EU (“AIFMD”) managed by Polar Capital LLP the appointed
Alternative Investment Manager. In relation to each member state of the EEA (each a “Member State”) which has implemented the AIFMD, this document may only be distributed and shares may only be offered
or placed in a Member State to the extent that (1) the fund is permitted to be marketed to professional investors in the relevant Member State in accordance with AIFMD; or (2) this document may otherwise be
lawfully distributed and the shares may otherwise be lawfully offered or placed in that Member State (including at the initiative of the investor). As at the date of this document, the Fund has not been approved,
notified or registered in accordance with the AIFMD for marketing to professional investors in any member state of the EEA. However, such approval may be sought or such notification or registration may be
made in the future. Therefore this document is only transmitted to an investor in an EEA Member State at such investor’s own initiative. SUCH INFORMATION, INCLUDING RELEVANT RISK
FACTORS, IS CONTAINED IN THE COMPANY OR FUND’S OFFER DOCUMENT WHICH MUST BE READ BY ANY PROSPECTIVE INVESTOR.
Statements/Opinions/Views: All opinions and estimates constitute the best judgment of Polar Capital as of the date hereof, but are subject to change without notice, and do not necessarily represent the views
of Polar Capital. This material does not constitute legal or accounting advice; readers should contact their legal and accounting professionals for such information. All sources are Polar Capital unless otherwise
stated.
Third-party Data: Some information contained herein has been obtained from third party sources and has not been independently verified by Polar Capital. Neither Polar Capital nor any other party involved in or
related to compiling, computing or creating the data makes any express or implied warranties or representations with respect to such data (or the results to be obtained by the use thereof), and all such parties
hereby expressly disclaim all warranties of originality, accuracy, completeness, merchantability or fitness for a particular purpose with respect to any data contained herein.
Holdings: Portfolio data is “as at” the date indicated and should not be relied upon as a complete or current listing of the holdings (or top holdings) of the Company or Fund. The holdings may represent only a
small percentage of the aggregate portfolio holdings, are subject to change without notice, and may not represent current or future portfolio composition. Information on particular holdings may be withheld if it is in
the Company or Fund’s best interest to do so. It should not be assumed that recommendations made in future will be profitable or will equal performance of the securities in this document. A list of all
recommendations made within the immediately preceding 12 months is available upon request. This document is not a recommendation to purchase or sell any particular security. It is designed to provide
updated information to professional investors to enable them to monitor the Company or Fund.
Benchmarks: The following benchmark index is used: Dow Jones World Technology Index (Total Return). This benchmark is generally considered to be representative of the Technology Equity universe. This
benchmark is a broad-based index which is used for comparative/illustrative purposes only and has been selected as it is well known and is easily recognizable by investors. Please refer to www.djindexes.com
for further information on this index. Comparisons to benchmarks have limitations as benchmarks volatility and other material characteristics that may differ from the Company or Fund. Security holdings, industry
weightings and asset allocation made for the Company or Fund may differ significantly from the benchmark. Accordingly, investment results and volatility of the Company or Fund may differ from those of the
benchmark. The indices noted in this document are unmanaged, are unavailable for direct investment, and are not subject to management fees, transaction costs or other types of expenses that the Company or
Fund may incur. The performance of the indices reflects reinvestment of dividends and, where applicable, capital gain distributions. Therefore, investors should carefully consider these limitations and differences
when evaluating the comparative benchmark data performance. Information regarding indices is included merely to show general trends in the periods indicated, it is not intended to imply that the fund was similar
to the indices in composition or risk.
For non-US investor use only. Please refer to the Important Information at the end of this presentation. 49You can also read