Observations and simulations of a wind farm modifying a thunderstorm outflow boundary
←
→
Page content transcription
If your browser does not render page correctly, please read the page content below
Wind Energ. Sci., 6, 1–13, 2021
https://doi.org/10.5194/wes-6-1-2021
© Author(s) 2021. This work is distributed under
the Creative Commons Attribution 4.0 License.

        Observations and simulations of a wind farm modifying a
                   thunderstorm outflow boundary
                                        Jessica M. Tomaszewski1 and Julie K. Lundquist1,2
         1 Department   of Atmospheric and Oceanic Sciences, University of Colorado, Boulder, CO 80309-0311, USA
         2 National   Wind Technology Center, National Renewable Energy Laboratory, Golden, CO 80401-3305, USA
                            Correspondence: Jessica M. Tomaszewski (jtomaszewski@resurety.com)

                                         Received: 8 April 2020 – Discussion started: 4 May 2020
                            Revised: 25 October 2020 – Accepted: 26 October 2020 – Published: 4 January 2021

        Abstract. On 18 June 2019, National Weather Service (NWS) radar reflectivity data indicated the presence of
        thunderstorm-generated outflow propagating east-southeastward near Lubbock, Texas. A section of the outflow
        boundary encountered a wind farm and then experienced a notable reduction in ground-relative velocity, sug-
        gesting that interactions with the wind farm impacted the outflow boundary progression. We use the Weather
        Research and Forecasting model and its wind farm parameterization to address the extent to which wind farms
        can modify the near-surface environment of thunderstorm outflow boundaries. We conduct two simulations of the
        June 2019 outflow event: one containing the wind farm and one without. We specifically investigate the outflow
        speed of the section of the boundary that encounters the wind farm and the associated impacts on near-surface
        wind speed, moisture, temperature, and changes to precipitation features as the storm and associated outflow
        pass over the wind farm domain. The NWS radar and nearby West Texas Mesonet surface stations provide ob-
        servations for validation of the simulations. The presence of the wind farm in the simulation clearly slows the
        progress of the outflow boundary by over 20 km h−1 , similar to what was observed. Simulated perturbations of
        surface wind speed, temperature, and moisture associated with outflow passage were delayed by up to 6 min
        when the wind farm was present in the simulation compared to the simulation without the wind farm. However,
        impacts on precipitation were localized and transient, with no change to total accumulation across the domain.

Copyright statement. This work was authored (in part) by the            1   Introduction
National Renewable Energy Laboratory, operated by Alliance for
Sustainable Energy, LLC, for the US Department of Energy (DOE)          Wind energy deployment is growing rapidly to provide a
under contract no. DE-AC36-08GO28308. Funding was provided              near-zero emissions source of electricity that can meet in-
by the US Department of Energy Office of Energy Efficiency and          creasing energy demands. The International Energy Agency
Renewable Energy Wind Energy Technologies Office. The views             (IEA) predicts wind energy will reach 14 % of global capac-
expressed in the article do not necessarily represent the views of      ity (∼ 1700 GW) by 2040 (IEA, 2018). Wind turbines gen-
the DOE or the US Government. The US Government retains and
                                                                        erate electricity by using momentum from the wind to turn
the publisher, by accepting the article for publication, acknowledges
that the US Government retains a nonexclusive, paid-up, irrevoca-
                                                                        their blades and generator, causing a downwind wake char-
ble, worldwide license to publish or reproduce the published form       acterized by an increase in turbulence and reduction in wind
of this work, or allow others to do so, for US Government purposes.     speed (Lissaman, 1979). Groups of turbines will then gener-
                                                                        ate an aggregate wind farm wake, which has been observed
                                                                        to extend over 50 km downwind of a wind farm, particularly
                                                                        during stable conditions, when little atmospheric turbulence
                                                                        is present to erode the wake (Christiansen and Hasager, 2005;
                                                                        Platis et al., 2018).

Published by Copernicus Publications on behalf of the European Academy of Wind Energy e.V.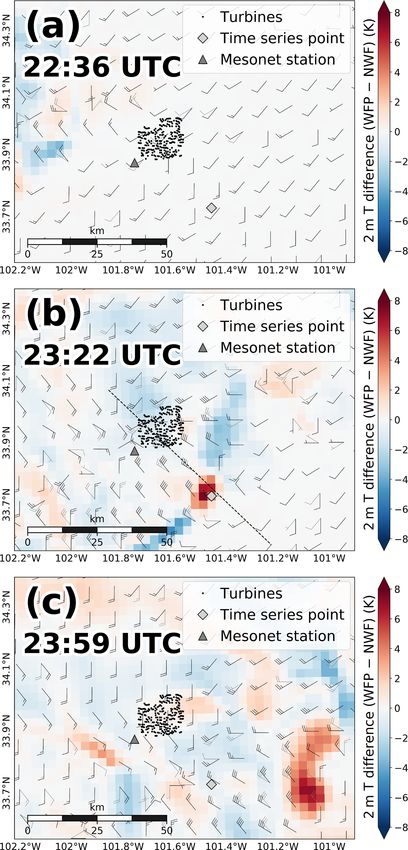
2                                     J. M. Tomaszewski and J. K. Lundquist: Observations and simulations of a wind farm

   Wind farm wakes have been observed to impact their am-         thrust curves give the manufacturer-specified relationship be-
bient environment, particularly at night via turbine-induced      tween hub-height inflow wind speed, power generation, and
mixing of the nocturnal inversion. Baidya Roy and Traiteur        force exerted onto the ambient air by a specific wind tur-
(2010) first used in situ observations within a wind farm to      bine. These specifications can better predict meteorological
identify that a net downward transport of warm air at night       impacts of wind turbines from hub height to the surface and
causes a statistically significant increase in surface tempera-   form the basis for multiple wind farm parameterizations in
ture in stably stratified boundary layers. Further in situ mea-   mesoscale numerical weather prediction models, including
surements of lidar profiles and surface fluxes from the Crop      the Wind Farm Parameterization (WFP) (Fitch et al., 2012;
Wind Energy Experiment (CWEX) over an Iowa utility-scale          Fitch, 2016).
wind farm indicate that turbines modify the flow fields and          The open-source WFP of the Weather Research and Fore-
surface heat flux above and below the rotor layer, causing        casting (WRF) model collectively represents wind turbines
average transient surface temperature increases between 0         in each model grid cell as a momentum sink and a turbulence
and 0.5 K overnight, reaching 1.5 K in some cases (Rajew-         source within the vertical levels intersecting the turbine rotor
ski et al., 2013, 2014, 2016). Another field campaign by          disk (Fitch et al., 2012; Fitch, 2016). The virtual wind tur-
Smith et al. (2013) in a large wind farm in the United States     bines convert kinetic energy from the wind into power, which
Midwest identifies a strong surface warming (1 to 1.5 K)          is reported as an aggregate sum in each model grid cell. The
in the wake of the wind farm at night, with no substantial        default setting of the WFP dictates that the turbine-induced
warming or cooling signals during the daytime. Armstrong          turbulence generation is derived from the difference between
et al. (2016) find that operational wind turbines raised night-   the power and thrust coefficients, and this option must re-
time air temperature by 0.18 K and absolute humidity by           main enabled to produce the vertical mixing necessary to at-
0.03 g m−3 at a peatland wind farm in Scotland. Satellite-        tain the expected nocturnal surface warming (Tomaszewski
derived analyses also report surface warming (up to 1 K)          and Lundquist, 2020). Users can adjust the specifications of
within wind farms and also up to 5 km downwind (Zhou              the parameterized turbine, including its rotor diameter, hub
et al., 2012; Xia et al., 2016). In situ airborne measure-        height, thrust coefficients, and power curve as well as its
ments of offshore wind farms also find temperature increases      latitude and longitude location. WFP simulations have been
of 0.5 K and water vapor decreases of 0.5 g kg−1 in the ro-       validated with power production data (Lee and Lundquist,
tor layer downwind during stably stratified conditions (Platis    2017a) and airborne measurements of winds (Siedersleben
et al., 2018; Siedersleben et al., 2018a). Measurements from      et al., 2018b), temperature and moisture (Siedersleben et al.,
two 120 m tall towers in Iowa detect differences in the tim-      2018a), and turbulence (Siedersleben et al., 2020) and have
ing of nocturnal transitions due to the presence of a wind        reproduced the observed localized, nighttime, near-surface
farm, where a single turbine wake decoupled the turbulent         warming produced by wind turbines mixing warmer air from
connection between the surface and above the wind turbine,        the nocturnal inversion down to the surface (Fitch et al.,
accelerating the onset of near-surface stabilization by a few     2013; Cervarich et al., 2013; Lee and Lundquist, 2017b; Xia
hours and lengthening the transition period by up to an hour      et al., 2017, 2019). To our knowledge, the WRF WFP has not
(Rajewski et al., 2020).                                          yet been applied to explore interactions between wind farms
   Due to sparse data from operational wind farms, modeling       and transient phenomena like thunderstorm outflow bound-
studies are often used to examine local and regional impacts      aries.
of existing and hypothetical wind farms. Baidya Roy (2004)           A thunderstorm gust front, or outflow boundary, marks
conducted the first study within a coupled land–atmosphere        the advancing surface boundary of the outflow of an evap-
mesoscale model, representing wind turbines as sinks of mo-       oratively cooled downdraft from a thunderstorm (e.g., Goff,
mentum and sources of turbulence to demonstrate that the          1976; Droegemeier and Wilhelmson, 1987). Outflow bound-
simulated wind farm slows hub-height winds and generates          ary passage is often associated with a significant change
turbulent eddies that enhance vertical mixing, leading to a       in surface meteorological conditions, including a sharp de-
warming and drying of the surface air. Wind turbines can          crease in temperature, a pronounced wind direction shift, and
also be represented numerically in mesoscale simulations by       damaging straight-line winds fueled by a strong horizontal
exaggerating surface roughness to represent the local reduc-      pressure gradient across the outflow boundary line (Waki-
tion in wind speed of wind farm wakes (Keith et al., 2004;        moto, 1982). The propagation of outflow into a thermody-
Frandsen et al., 2009; Barrie and Kirk-Davidoff, 2010; Fitch,     namically favorable ambient environment can initiate con-
2015). This enhanced surface roughness approach was later         vection far from the source thunderstorm (Carbone et al.,
shown to produce erroneous predictions, including the wrong       1990), and the strong low-level wind shear associated with
sign of surface temperature change through the diurnal cycle      propagating outflows has caused several aircraft accidents
(Fitch et al., 2013). Recent mesoscale modeling studies have      (Zrnic and Lee, 1983) that would otherwise be unlikely in
used the turbine power and thrust curves to define the ele-       a typical wind farm wake environment (Tomaszewski et al.,
vated momentum sink and turbulence generation of a simu-          2018). Outflow boundary motion is thus of interest in short-
lated wind turbine (Fitch et al., 2012). The turbine power and

Wind Energ. Sci., 6, 1–13, 2021                                                         https://doi.org/10.5194/wes-6-1-2021
J. M. Tomaszewski and J. K. Lundquist: Observations and simulations of a wind farm                                                3

range severe weather and aviation forecasting and nowcast-         eastward ahead of the MCS, eventually reaching the Hale
ing.                                                               wind farm at 00:50 UTC on 19 June. The wind farm can be
   Doppler radar observations can provide kinematic infor-         detected on the radar display (Fig. 1a) as a cluster of speckled
mation of the full depth of thunderstorm outflow (e.g., Waki-      points of high reflectivity, indicative of the hard-target echoes
moto, 1982; Klingle et al., 1987; Mueller and Carbone, 1987;       of radar beams reflecting off of spinning turbines, known as
Quan et al., 2014), with an outflow boundary’s presence and        wind turbine clutter (Isom et al., 2009). A defined notch ap-
ground-relative velocity often identified via a “fine line” in     peared within the outflow boundary immediately following
radar reflectivity. On 18 June 2019, around 01:00 UTC, Na-         passage over the wind farm, suggesting a significant reduc-
tional Weather Service radar reflectivity indicated the pres-      tion in ground-relative velocity where the outflow encoun-
ence of thunderstorm-generated outflow propagating east-           tered and interacted with the wind farm (Fig. 1b, c).
southeastward north of Lubbock, Texas. A section of the out-
flow boundary that encountered a wind farm experienced a           2.2   Observations available
notable reduction in speed, qualitatively suggesting that the
wind farm impacted the outflow boundary progression.               The National Weather Service NEXRAD WSR-88D radar in
   Here, we use a numerical weather prediction mesoscale           Lubbock, Texas (KLBB), (Klazura and Imy, 1993) provides
model capable of simulating outflow boundary movement to           the initial visualization for this study of the outflow propagat-
explore its interaction with a parameterized wind farm during      ing and interacting with the wind farm during the June 2019
the aforementioned June 2019 event. Numerical models have          event. Level II radar data (e.g., base reflectivity, base veloc-
previously been utilized to gain insight into the life cycle and   ity) are provided by the National Oceanic and Atmospheric
dynamics of thunderstorm outflow (e.g., Droegemeier and            Administration (NOAA) National Centers for Environmen-
Wilhelmson, 1987) and more recently in the Weather Re-             tal Information (NOAA National Weather Service, 1991) at
search and Forecasting model by Duda and Gallus (2013)             4 min temporal resolution and quantify the speed and posi-
and Nugraha and Trilaksono (2018) with success. The inclu-         tion of the outflow boundary throughout the event.
sion of a Wind Farm Parameterization (WFP) in WRF (e.g.,              Surface observations are available through the West Texas
Fitch et al., 2012; Fitch, 2016) to capture wind farm near-        Mesonet, a statewide observation network consisting of 40
environment interactions makes this model a favorable tool         automated surface meteorological stations that measure up to
for such a study considering the impacts wind farms may            15 meteorological parameters over an observation period of
have on outflow boundaries and their resulting changes in          5 min (Schroeder et al., 2005). Sampling intervals vary from
temperature, wind, and precipitation.                              3 to 60 s depending on the sensor, and data are reported as
   We hypothesize that wind farms can modify transient and         5 min averages centered on the 5 min period. A 5 min obser-
mesoscale features like thunderstorm outflow boundaries.           vation reporting time has been previously proven sufficient in
Section 2 describes the case study and the model setup. Sec-       resolving other density current passages (Toms et al., 2017).
tion 3 presents the modifications to the outflow progression       The Abernathy surface station is located 5 km southwest of
by the wind farm and the impacts on surface temperature,           the southwest corner of the wind farm in our study (gray di-
winds, moisture, and precipitation. Section 4 summarizes our       amond in Fig. 3) and provides 5 min resolution validation
results, confirming that the WRF WFP and radar data capture        data of 1.5 m temperature, 10 m wind speed and direction,
the wind farm modifying the outflow.                               and 1.5 m humidity, among other variables, for the precur-
                                                                   sor outflow state prior to wind farm interaction for our sim-
                                                                   ulations. We explored accessing meteorological information
2     Methodology
                                                                   from the Hale wind farm and others in the vicinity, but those
2.1    Case description
                                                                   data are proprietary and not available.

The 18–19 June 2019 outflow event near Lubbock, Texas, is          2.3   Simulations conducted
highlighted in this study as the first known and archived case
of an outflow boundary passing over and being modified by a        We conduct the simulation composing our study with ver-
wind farm, which was brought to our attention on social me-        sion 3.8.1 of the Advanced Research WRF (ARW) model
dia by Jessie McDonald (@jmeso212). The event began with           (Skamarock and Klemp, 2008; Powers et al., 2017). We de-
a cluster of thunderstorms propagating eastward over east-         fine a simulation with three nested domains with horizon-
ern New Mexico and the western Texas panhandle. These              tal grid spacings of 27, 9, and 3 km, respectively, where the
storms formed an organized mesoscale convective system             innermost 3 km domain is centered over the wind farm and
(MCS) around 23:00 UTC on 18 June at the New Mexico–               outflow event location (Fig. 2a). Our previous investigation
Texas border and shifted to move southeastward. An outflow         (Tomaszewski and Lundquist, 2020) of the sensitivity of the
boundary originated from this MCS, visible as a fine line on       WRF WFP to spatial resolution suggests that 3 km horizon-
NEXRAD WSR-88D displays beginning at approximately                 tal grid spacing is adequate for resolving the wind farm ef-
23:40 UTC (Fig. 1a). This outflow boundary advanced south-         fects. Also based on the results of that study, which argue

https://doi.org/10.5194/wes-6-1-2021                                                           Wind Energ. Sci., 6, 1–13, 2021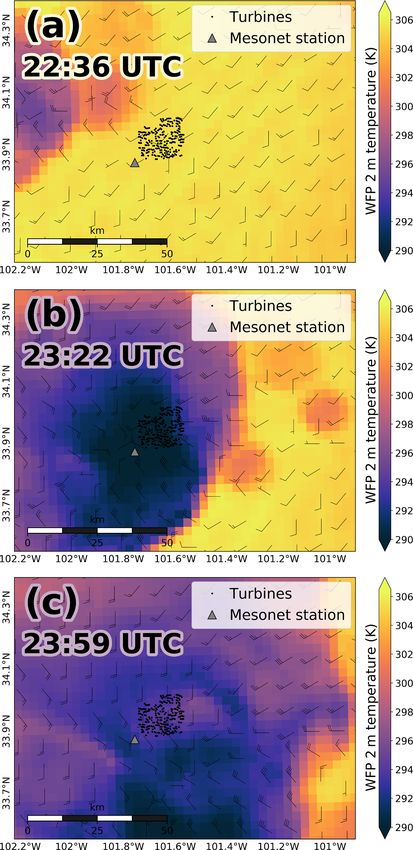
4                                        J. M. Tomaszewski and J. K. Lundquist: Observations and simulations of a wind farm

                                                                      model time step is 30 s on the outer domain, refined by a fac-
                                                                      tor of 3 for each nest. Turbine-induced turbulence is param-
                                                                      eterized via a source of turbulent kinetic energy (TKE). The
                                                                      0.7◦ ERA-Interim (ECMWF, 2009; Dee et al., 2011) data
                                                                      set provides initial and boundary conditions for the simula-
                                                                      tions, and topographic data are provided at 30 s resolution
                                                                      (nominally 0.8 km at this latitude). Physics options include
                                                                      the Dudhia shortwave radiation (Dudhia, 1989) with a 30 s
                                                                      time step, the Rapid Radiative Transfer Model longwave ra-
                                                                      diation scheme (Mlawer et al., 1997), a surface layer scheme
                                                                      that accommodates strong changes in atmospheric stability
                                                                      (Jimenez et al., 2012), the second-order Mellor–Yamada–
                                                                      Nakanishi–Niino planetary-boundary-layer scheme (Nakan-
                                                                      ishi and Niino, 2006) without TKE advection, land surface
                                                                      physics with the Noah Land Surface Model (Ek et al., 2003),
                                                                      the single-moment six-class microphysics scheme (Hong and
                                                                      Lim, 2006), and the explicit Kain–Fritsch cumulus parame-
                                                                      terization (Kain, 2004) on domains with horizontal grid spac-
                                                                      ings coarser than 3 km. We simulate the 6 h window around
                                                                      the time when the outflow passed over the wind farm (18
                                                                      June 22:00 UTC to 19 June 04:00 UTC). We begin spinup
                                                                      10 h prior, at 12:00 UTC on 18 June.
                                                                         The US Geological Survey Turbine Database (Hoen et al.,
                                                                      2020) provides the latitude–longitude model input locations
                                                                      of the wind turbines at the Hale wind farm (Fig. 2c, d). We
                                                                      use power and thrust curves from the 1.5 MW Pennsylva-
                                                                      nia State University generic turbine (Schmitz, 2012), based
                                                                      on the General Electric SLE turbine (80 m hub height and
                                                                      77 m rotor diameter). This turbine model closely matches
                                                                      the 2 MW Vestas turbines actually installed at the Hale wind
                                                                      farm, and Siedersleben et al. (2018b) show little sensitivity
                                                                      to the exact turbine power curve. We assess the impact the
                                                                      wind farm has on the model solution of the outflow by com-
                                                                      paring a simulation without the WFP to a simulation with the
                                                                      WFP, as in Fitch et al. (2012), Lee and Lundquist (2017a),
                                                                      Lundquist et al. (2018), and Redfern et al. (2019). We specif-
                                                                      ically investigate differences in the near-surface wind speed,
                                                                      temperature, moisture, and precipitation solutions between
                                                                      simulations with and without the wind farm as the storm and
                                                                      associated outflow pass over the wind farm domain.

                                                                      3     Results
Figure 1. NEXRAD WSR-88D radar reflectivity from the Lubbock          3.1    Performance of WRF against observations
radar site (KLBB) (a) prior to the outflow boundary arriving at the
wind farm, (b) immediately following outflow boundary passage         The WRF simulation with the Wind Farm Parameterization
over the wind farm, and (c) several minutes after passage. Panels     (WFP) produces reasonable solutions of the thunderstorm
(b) and (c) are zoomed in closer to better view the shape of the      outflow event on 18–19 June 2019. Three consecutive plan
boundary, and that subset is denoted in panel (a) by the black box.   views of 2 m temperature within a section of the domain
                                                                      illustrate the outflow progression (Fig. 3). By 22:36 UTC
                                                                      on 18 June, a cold pool had developed from the thunder-
that the WFP requires fine vertical resolution near the sur-          storm downdraft, forming the outflow (Fig. 3a). This out-
face, we set the vertical grid spacing to be ∼ 10 m in the low-       flow propagated southeastward toward the wind farm, even-
est 200 m (Fig. 2b), stretching vertically thereafter for a total     tually passing over it by 23:22 UTC (Fig. 3b) and spread-
of 58 vertical levels between the surface and 170 hPa. The            ing further southeast by the end of the UTC day (Fig. 3c).

Wind Energ. Sci., 6, 1–13, 2021                                                             https://doi.org/10.5194/wes-6-1-2021
J. M. Tomaszewski and J. K. Lundquist: Observations and simulations of a wind farm 5
Figure 2. Maps representing (a) the nested domains for the simulations, with the Hale wind farm denoted by the white square, (b) the model
vertical levels intersecting the simulated turbine rotor (black circle), (c) the topography around the Hale wind farm, and (d) the wind turbine
layout over the same terrain contour as in (c). The white polygon in panels (c) and (d) denotes the approximate outline of the Hale wind
farm. Geography data are provided by Matplotlib’s (Hunter, 2007) Basemap © Jeffrey Whitaker 2011.
The spatial coverage and shape of the outflow reasonably possibly an artifact of the 5 min sampling in the observations
match the shape of the outflow boundary visible on radar as opposed to the 1 min sampling in the simulation, verified
(Fig. 1). However, the simulated moist convection and sub- by plotting a 5 min average of the simulation results (dashed
sequent outflow boundary occurs too early. The simulated line in Fig. 4a). The simulation displays biases in the 2 m
outflow passes over the wind farm location by 23:22 UTC temperature and moisture precursor states (Fig. 4b, c). WRF
on 18 June, whereas the radar indicates that this passage oc- initially has a 2.5 K warm bias, a ∼ 35 % relative humidity
curs around 01:15 UTC on 19 June, about 2 h later (Fig. 1b). (RH) dry bias, and ∼ 3 g kg−1 dry bias against the observa-
This discrepancy could be caused by the boundary conditions tions. These model biases could be due to inaccuracies in the
or other model configuration choices, though as previously soil moisture that stem from differences in precipitation that
mentioned, the structures of the simulated and observed cold occurred earlier in the day. The magnitude of the 2 m temper-
pools are similar and therefore the simulation suits the needs ature decrease (Fig. 4b) and moisture increases (Fig. 4c) due
of the study. to the outflow arrival in WRF seem adequate, albeit slightly
To better understand WRF’s skill in simulating the in- more intense than in the observations.
tensity of the outflow event, we plot a time series from
the nearby Abernathy West Texas Mesonet surface station
3.2 Differences in outflow passage between wind farm
against that from the corresponding closest point in the
and no wind farm simulations
model domain (gray triangle in Fig. 3). Model results are
shifted ahead 2 h to allow for direct comparison between the Having validated WRF’s ability to adequately capture the
simulation and observations during the outflow passage, as outflow event, we next compare the two WRF simulations
done in the Arthur et al. (2020) investigation of a frontal pas- to assess the impact a parameterized wind farm has on the
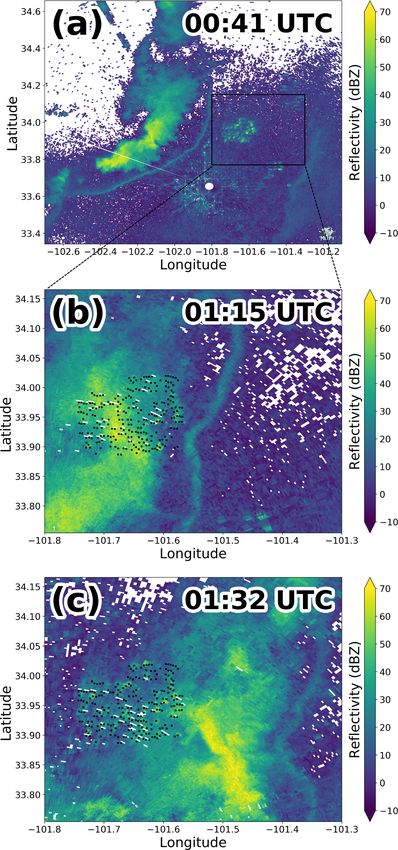
sage. The WRF simulation (solid lines in Fig. 4) predicts sim- simulated outflow. Three instantaneous map views show the
ilar 10 m wind speeds as observed (dotted lines) before the difference in 2 m temperature between the simulations, with
passage in addition to an accurate magnitude of wind speed the no wind farm (NWF) case subtracted from the Wind Farm
increase associated with the outflow arrival. The simulated Parameterization (WFP) case (Fig. 5). Regions of cooler tem-
winds remain elevated near ∼ 23 m s−1 for 15 min before de- peratures (blue) indicate that the temperature in the WFP
creasing close to the prefrontal state, whereas the surface simulation is cooler than in the NWF simulation, suggesting
station observations decrease almost immediately (Fig. 4a), faster movement of the outflow bringing cooler temperatures.
https://doi.org/10.5194/wes-6-1-2021 Wind Energ. Sci., 6, 1–13, 2021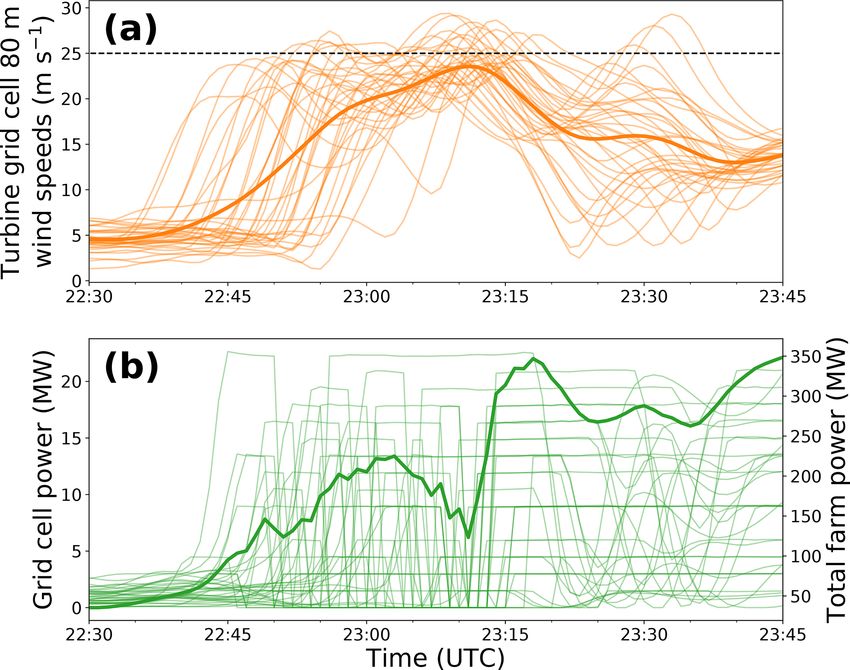
6                                       J. M. Tomaszewski and J. K. Lundquist: Observations and simulations of a wind farm

                                                                     Figure 4. Time series comparing the Wind Farm Parameterization
                                                                     (WFP) simulation solutions against Mesonet surface station obser-
                                                                     vations of (a) 10 m wind speed, (b) 2 m temperature, and (c) 2 m
                                                                     relative humidity and mixing ratio.

                                                                     only subtle differences exist between the simulations upwind
                                                                     from the wind farm (Fig. 5a), likely arising from the gener-
                                                                     ation of gravity waves (Smith, 2009; Allaerts and Meyers,
                                                                     2018, 2019). These differences increase in magnitude after
                                                                     the outflow passes over the wind farm. A compact region of
                                                                     warmer temperatures (up to 8 K) in the wind farm simulation
                                                                     emerges following outflow passage over the wind farm, in-
                                                                     dicating that interaction with the wind farm has caused that
                                                                     section of the advancing outflow to slow its speed (Fig. 5b).
Figure 3. Snapshots of simulated 2 m temperatures from the Wind
                                                                     This region of slowed outflow expands in spatial area as the
Farm Parameterization (WFP) simulation (a) prior to the outflow
boundary arriving at the wind farm, (b) immediately following out-   outflow progresses southeastward (Fig. 5c). A similar speed
flow boundary passage over the wind farm, and (c) several minutes    reduction is visible in the bent outflow shape of the radar ob-
after passage. Wind barbs are shown in knots.                        servations (Fig. 1b, c). The cooler regions emerging on both
                                                                     sides of the wind during outflow passages suggest that flow
                                                                     is being redirected around the wind farm (Fig. 5b). A vertical
Indeed, the dark wind barbs in Fig. 5 representing winds from        cross section of the temperature difference between the sim-
the WFP simulation indicate stronger winds present (by 5–            ulations taken at 23:22 UTC (dashed line in Fig. 5b) shows
10 kn) in cooler (blue) regions than in the NWF simulation           that the wind farm (black X) impacts the outflow from the
(light wind barbs). Conversely, red regions indicate warmer          surface to ∼ 2 km (Fig. 6).
temperatures in the wind-farm-containing simulation, indi-              We next sample a point from both the WFP and NWF sim-
cating that the outflow is moving slower in this simulation          ulations downwind of the wind farm location (white diamond
than in the NWF simulation. Early in the outflow event,              in Fig. 5) to assess how differences between the simula-

Wind Energ. Sci., 6, 1–13, 2021                                                             https://doi.org/10.5194/wes-6-1-2021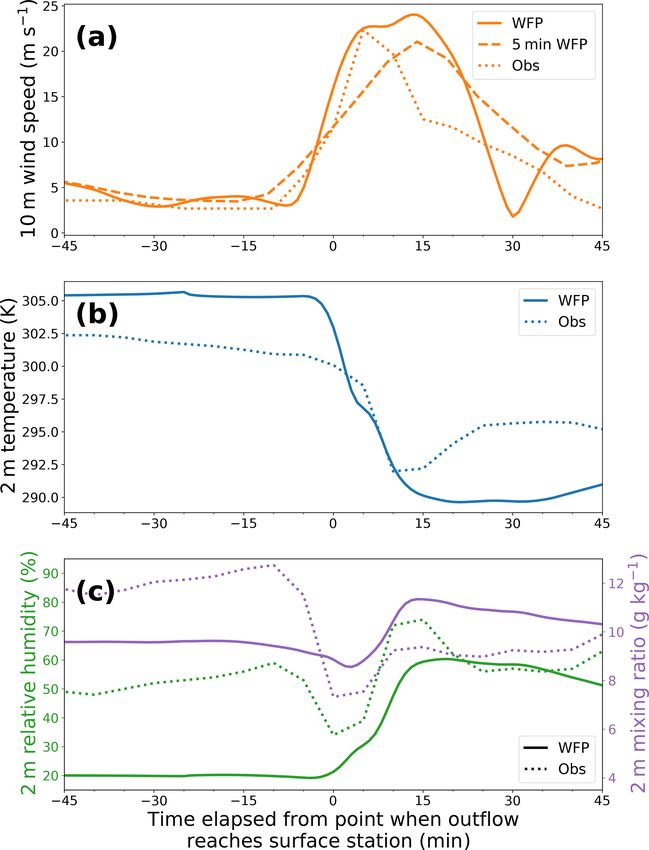
J. M. Tomaszewski and J. K. Lundquist: Observations and simulations of a wind farm                                                       7

                                                                        Figure 6. Vertical cross section of the temperature difference be-
                                                                        tween the Wind Farm Parameterization (WFP) and no wind farm
                                                                        (NWF) simulations immediately following outflow boundary pas-
                                                                        sage over the wind farm, corresponding to the dashed line in
                                                                        (Fig. 5b). Note the y-axis ticks are not spaced linearly due to the
                                                                        increasingly coarse vertical grid spacing at higher model levels.

                                                                        arrival of the outflow, the 10 m wind speed increases first
                                                                        in the NWF simulation (dashed line), reaching a maximum
                                                                        of ∼ 30 m s−1 . The WFP simulation (solid line) begins its
                                                                        outflow-induced increase a few minutes after the NWF sim-
                                                                        ulation and attains a smaller initial wind speed maximum of
                                                                        ∼ 25 m s−1 . A secondary pulse of increased wind speeds oc-
                                                                        curs in both simulation cases and reaches similar magnitudes,
                                                                        suggesting that the modified outflow in the wind farm case
                                                                        does not experience notable changes after the initial disrup-
                                                                        tion by the wind farm (Fig. 7a).
                                                                           The temporal evolution of the 2 m temperature is similar
                                                                        to that of the wind speed. The WFP and NWF simulations
                                                                        produce the same initial temperature until the WFP simu-
                                                                        lation diverges from the NWF simulation due to the wind-
                                                                        farm-modified outflow approaching ∼ 3 min later. The asso-
                                                                        ciated outflow cooling is of similar magnitude (∼ 12.5 K)
                                                                        between the simulations, but the WFP simulation reaches
                                                                        its minimum temperature ∼ 4 min after the NWF simulation
                                                                        (Fig. 7b).
                                                                           Differences in the 2 m relative humidity between the sim-
Figure 5. Snapshots of differences in 2 m temperature between the       ulations evolve similarly to those in the 2 m temperature.
Wind Farm Parameterization (WFP) and no wind farm (NWF) sim-            Both simulations maintain a value near ∼ 20 % until the
ulations (a) prior to the outflow boundary arriving at the wind farm,   passing outflow causes an increase up to 50 %, with the in-
(b) immediately following outflow boundary passage over the wind        crease occurring for the WFP simulation 4–5 min after the
farm, and (c) several minutes after passage. Wind barbs are shown in
                                                                        NWF (green lines in Fig. 7c). The absolute moisture quantity
knots, with the darker (lighter) barbs representing the WFP (NWF)
                                                                        (2 m mixing ratio, purple lines) reaches its peak in moisture
winds. The dashed line in panel (b) indicates the location of the
vertical cross section in Fig. 6.                                       (10.5 g kg−1 ) ∼ 6 min after the NWF does.
                                                                           We corroborate the proxies for outflow ground-relative ve-
                                                                        locity in the time series of meteorological variables (Fig. 5)
                                                                        by directly quantifying the speed of the simulated and ob-
tions evolve at that point following outflow passage (Fig. 7).          served outflow boundaries (Fig. 8a). We measure the ob-
Close agreement exists between the simulations across all               served outflow speed by tracking the reflectivity fine line
variables plotted preceding arrival of the outflow. Upon the            along a transect and recording its distance traveled every data

https://doi.org/10.5194/wes-6-1-2021                                                                 Wind Energ. Sci., 6, 1–13, 2021
8                                       J. M. Tomaszewski and J. K. Lundquist: Observations and simulations of a wind farm

Figure 7. Time series comparing the Wind Farm Parameterization       Figure 8. Plot (a) comparing the ground-relative velocity of the
(WFP) and no wind farm (NWF) simulation solutions of (a) 10 m        outflow in time between the Wind Farm Parameterization (WFP)
wind speed, (b) 2 m temperature, and (c) 2 m relative humidity and   simulation, no wind farm (NWF) simulation, and radar observa-
mixing ratio.                                                        tions. The schematic in (b) shows the process for calculating the
                                                                     simulation outflow speed, where the line through the domain shows
                                                                     the transect along which speed was measured, with the largest gra-
update (typically 4 min). As the radar is southwest (220◦ ) of       dients in 10 m wind speed providing the position of the boundary to
the portion of the outflow boundary of interest, which is mov-       track and the underlying 5 km × 5 km grid providing a visual guide-
ing nearly to the southeast at a heading of 120◦ (Fig. 1), we        line to aid in tracking.
note that the feature therefore maintains an approximately
constant distance to the radar and thus height above ground
                                                                     4 m s−1
even as the feature moves, thus not impacting our calcula-             km     transect was chosen, the measurement tracker tried to
tions of ground-relative outflow speed.                              follow that same point, even if the transect intersected the
    Without a fine line present in the simulations to denote         4 m s−1
                                                                       km contour in multiple places. The averages of each case
the outflow boundary, we choose to track the simulated out-          are plotted in Fig. 8a, around which ±1 standard deviation
flow using the spatial gradient in wind speed, specifically the      forms the shaded cloud and serves as our error bounds. As
4 m s−1
   km contour (e.g., Fig. 8b). The simulations are examined          in Fig. 4 and Arthur et al. (2020), the simulation results are
at 4 min intervals to match the temporal resolution of the           shifted forward 2 h to align with the radar results. A running
radar data. Both simulation and radar outflow are measured           average with an 8 min window was applied to all three time
against a 5 km × 5 km grid to estimate distance traveled (see        series to smooth the results for viewing.
Fig. 8b). The transect along which we measure distance trav-            As suggested in Figs. 5 and 7, speeds of both simula-
eled is oriented to track through the wind farm and the region       tion cases and the radar data begin at similar values near
of maximum outflow distortion by the wind farm. Three sep-           80 km h−1 (Fig. 8a). The simulated and observed outflows
arate measurements are conducted for each case (i.e., radar,         decelerate slightly as they propagate away from the source
WFP simulation, and NWF simulation) to account for human             thunderstorm. When the radar outflow (blue line) encounters
error. Each examination is conducted 3 times the same way            the wind farm, its speed reduces from 60 km h−1 to nearly
by the same person over the same transect to generate mul-           40 km h−1 . The radar outflow recovers within 10 min back to
tiple estimates of outflow speed. Conducting this qualitative        > 60 km h−1 before being obscured by precipitation. Simi-
measurement is a dynamic process, and once a point on the            larly, the Wind Farm Parameterization (WFP) simulation (or-

Wind Energ. Sci., 6, 1–13, 2021                                                              https://doi.org/10.5194/wes-6-1-2021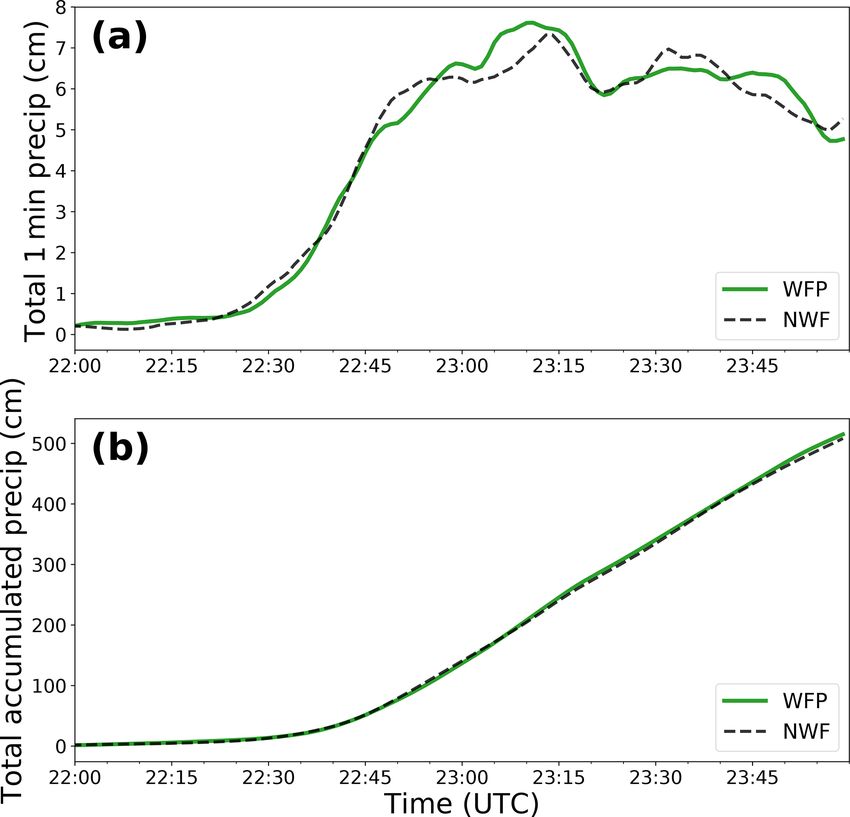
J. M. Tomaszewski and J. K. Lundquist: Observations and simulations of a wind farm                                                   9

ange line) fluctuates around 70 km h−1 until encountering the
wind farm, when it then drops in speed to about 40 km h−1 .
The WFP simulation experiences a larger reduction in speed
than observed but reaches its speed minimum ∼ 8 min later
than the observations. Additionally, the WFP simulation re-
covers its speed twice as slowly as the observed outflow.
Such delays in the WFP outflow evolution could be arti-
facts of the 3 km model grid spacing or more likely the initial
and boundary conditions. The no wind farm (NWF) simula-
tion (green line), lacking wind farm interference, maintains a
ground-relative velocity between 60 and 75 km h−1 through-
out the period of interest.

3.3   Simulated impacts of modified outflow boundary on
      precipitation

Subtle but significant impacts of wind-farm-modified out-
flow on meteorological variables like wind speed, tempera-
ture, and moisture outlined in Sect. 3.2 prompt the question
of the extent to which a wind-farm-modified outflow bound-
ary can impact precipitation location and quantity. We ad-        Figure 9. Time series comparing the Wind Farm Parameterization
dress this question by integrating the total precipitation over   (WFP) and no wind farm (NWF) simulation solutions of (a) to-
a 100 km radius around the wind farm and comparing these          tal 1 min precipitation and (b) total accumulated precipitation, with
quantities for the WFP (green line) and NWF (dashed black         both quantities integrated spatially within a 100 km radius around
line) simulations every minute (Fig. 9a) and accumulated in       the Hale wind farm.
time (Fig. 9b) over 3 h. While the 1 min precipitation totals
across the region differ slightly between the simulations, the
total accumulated precipitation remains unchanged despite
the altered outflow in the WFP case. We conclude that the
introduction of roughness elements may change the distribu-
tion of the precipitation by a maximum of ∼ 1 cm across the
domain at a single moment in time (Fig. 9a), but the overall
precipitation accumulation is unaffected (Fig. 9b). Further-
more, a histogram detailing the number of 3 km grid cells that
do experience a change in precipitation at a 1 min moment in
time over 3 h due to the presence of the wind farm reveals that
no single grid cell experiences a delta greater than ±7 mm,
and over 93.4 % of grid cells experience no change in pre-
cipitation (Fig. 10). Changes to precipitation due to the wind
farm are thus both transient and localized.

3.4   Power production at the simulated wind farm

Given that wind farms can modify outflow and their asso-          Figure 10. Histogram detailing the 1 min differences between the
ciated meteorology, we next explore the effects an incom-         Wind Farm Parameterization (WFP) and no wind farm (NWF) sim-
ing outflow can have on a wind farm and its power produc-         ulations in precipitation at each grid cell within a 100 km radius of
                                                                  the Hale wind farm over 180 min.
tion. Time series of the simulated 80 m wind speeds from all
turbine-containing grid cells in the Wind Farm Parameteriza-
tion (WFP) simulation indicate that several grid cells exceed
the wind turbine’s cutout speed (25 m s−1 ; dashed black line     (Fig. 11b) reflect this reduction in power during those times
in Fig. 11a), most notably at 23:10 and 23:35 UTC. Winds in       when the cutout wind speed is reached. Power data from the
excess of this cutout speed force the turbines to brake their     Hale wind farm are proprietary and unavailable for valida-
blades to prevent structural damage, halting power genera-        tion, though simulation data suggest that outflow winds are
tion. The corresponding time series of power from turbine-        high enough to cause wind turbines to cut out and reduce
containing grid cells and the total integrated farm power         total farm power generation (Fig. 11).

https://doi.org/10.5194/wes-6-1-2021                                                            Wind Energ. Sci., 6, 1–13, 2021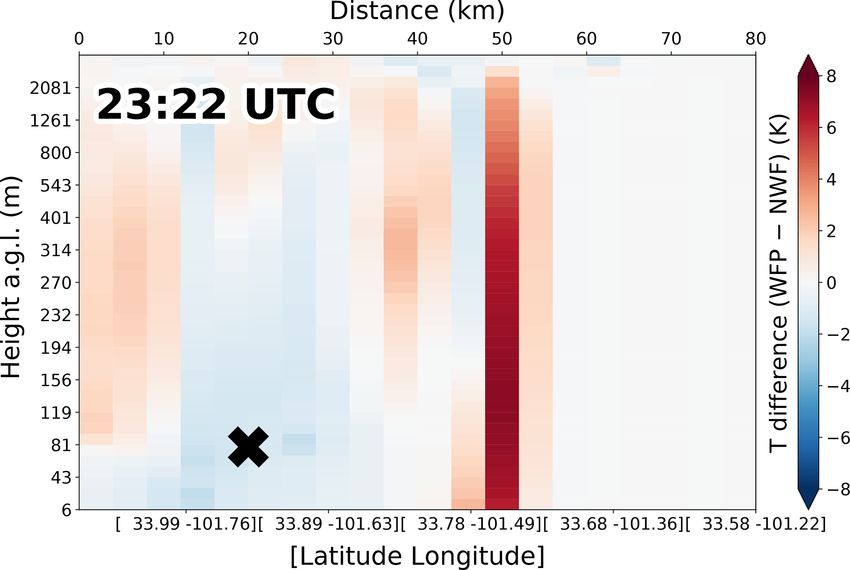
10                                        J. M. Tomaszewski and J. K. Lundquist: Observations and simulations of a wind farm

                                                                        reductions of over 20 km h−1 after encountering the wind
                                                                        farm, whereas the NWF simulation maintained near-constant
                                                                        speed throughout the period (Fig. 8). Impacts on precipitation
                                                                        were minimal, with no change to total accumulation across
                                                                        the domain (Fig. 9). Localized shifts in precipitation loca-
                                                                        tion in the WFP simulation caused a maximum instantaneous
                                                                        grid-cell precipitation difference of 7 mm km−2 , but 93.4 %
                                                                        of grid cells within the area over the event period experienced
                                                                        no change in precipitation (Fig. 10).
                                                                           While we have shown that a wind farm can interact with
                                                                        and modify thunderstorm outflow, impacts on the modified
                                                                        outflow speed and associated kinematic and thermodynamic
                                                                        variables are transient and localized. These subtle changes
                                                                        arising from wind farm interaction may be useful to consider
                                                                        when conducting nowcasting of precipitation and wind speed
                                                                        on a scale of a few kilometers and minutes, perhaps for avi-
                                                                        ation or other time-sensitive purposes. Impacts beyond that
Figure 11. Time series of simulated (a) 80 m wind speeds from           scale appear to be negligible.
all turbine-containing grid cells (average wind speed plotted in the       This study uses a single known case of a wind farm in-
thicker line) and (b) power from all turbine-containing grid cells      teracting with outflow and is corroborated by simulations of
(total farm power production plotted in the thicker line) in the Wind
                                                                        that case. This case study could motivate a larger-scale clima-
Farm Parameterization (WFP) simulation.
                                                                        tology of additional outflow–wind farm interaction events,
                                                                        including different environments with variable soil moisture
                                                                        or other meteorological properties. Such a climatology could
4    Discussion and conclusions                                         consider wind farms of different layouts and sizes as well as
                                                                        different turbine types and sizes to assess generalized sen-
Increasing deployment of wind energy infrastructure neces-              sitivity of atmospheric modifications to the turbine layouts
sitates obtaining further knowledge on the environmental im-            and density. In previous studies (Lundquist et al., 2018), we
pacts of wind farms to ensure their long-term sustainability            have noticed wind farms apparently modifying the passage
and suitability. A lower-atmospheric phenomenon not yet ex-             of frontal boundaries, so a large-scale climatology of such
plored in relation to interacting with wind energy is thunder-          events, tracking frontal ground-relative velocity, could shed
storm outflow. Herein, we assess the impact a wind farm can             more light on how widespread and impactful the modifica-
have on outflow movement via observations and simulations.              tion of atmospheric processes by wind farms can be.
   We first observed wind farm impacts on outflow in
NEXRAD WSR-88D radar reflectivity. On 18 June 2019, a
section of an advancing outflow boundary visible on radar               Code and data availability. The WRF-ARW model code is pub-
encountered the Hale wind farm near Lubbock, Texas, and                 licly available at https://doi.org/10.5065/D6MK6B4K (Skamarock
decelerated in response. We ran two Weather Research and                et al., 2008). This work uses the WRF-ARW model and the
Forecasting (WRF) simulations to capture this event: one                WRF Preprocessing System version 3.8.1 (released on 12 Au-
                                                                        gust 2016), and the Wind Farm Parameterization is distributed
with a Wind Farm Parameterization (WFP) enabled and an-
                                                                        therein. Initial and boundary conditions are provided by ERA-
other with no wind farm present (NWF). Using observations               Interim (Dee et al., 2011) and are available at https://rda.ucar.
from a West Texas Mesonet surface station, we verified that             edu/datasets/ds627.0/. Topographic data are provided at a 30 s res-
the simulations were producing reasonable solutions of the              olution from http://www2.mmm.ucar.edu/wrf/users/download/get_
outflow event and could be used to quantify the extent to               source.html (Skamarock et al., 2008). The Pennsylvania State Uni-
which a wind farm can modify propagating outflow.                       versity generic 1.5 MW turbine (Schmitz, 2012) is available at
   Just as with the radar reflectivity, spatial differences be-         https://doi.org/10.13140/RG.2.2.22492.18567. The user input and
tween the WFP and NWF simulations exhibited a similar                   data needed to recreate the figures and analysis are located at
pattern, indicating that the wind farm slowed the progress              https://doi.org/10.5281/zenodo.3974719 (Tomaszewski, 2020).
of the outflow boundary (Figs. 1, 5). Time series of simu-
lated surface wind speed, temperature, and moisture revealed
that perturbations associated with outflow passage were de-             Author contributions. JKL and JMT conceived the research and
layed by up to 6 min when the wind farm was present in                  designed the WRF simulations; JMT carried out the WRF simula-
                                                                        tions and wrote the manuscript with significant input from JKL.
the simulation (Fig. 7). Approximations of outflow speed in
the radar and simulation data confirmed that both the radar-
observed and WFP simulation outflows experienced speed

Wind Energ. Sci., 6, 1–13, 2021                                                                 https://doi.org/10.5194/wes-6-1-2021
J. M. Tomaszewski and J. K. Lundquist: Observations and simulations of a wind farm 11
Competing interests. The authors declare that they have no com- Christiansen, M. B. and Hasager, C. B.: Wake ef-
peting interests. fects of large offshore wind farms identified from
satellite SAR, Remote Sens. Environ., 98, 251–268,
https://doi.org/10.1016/j.rse.2005.07.009, 2005.
Acknowledgements. WRF simulations were conducted using Dee, D. P., Uppala, S. M., Simmons, A. J., Berrisford, P., Poli,
the Extreme Science and Engineering Discovery Environment P., Kobayashi, S., Andrae, U., Balmaseda, M. A., Balsamo, G.,
(XSEDE), which is supported by National Science Foundation grant Bauer, P., Bechtold, P., Beljaars, A. C. M., van de Berg, L., Bid-
number ACI1053575. We thank Jessie McDonald (@jmeso212) for lot, J., Bormann, N., Delsol, C., Dragani, R., Fuentes, M., Geer,
identifying this event and catalyzing the interesting discourse on A. J., Haimberger, L., Healy, S. B., Hersbach, H., Hólm, E. V.,
Twitter that inspired this research. Isaksen, L., Kållberg, P., Köhler, M., Matricardi, M., McNally,
A. P., Monge-Sanz, B. M., Morcrette, J.-J., Park, B.-K., Peubey,
C., de Rosnay, P., Tavolato, C., Thépaut, J.-N., and Vitart, F.:
Financial support. This work and Jessica M. Tomaszewski were The ERA-Interim reanalysis: configuration and performance of
supported by an NSF Graduate Research Fellowship under grant the data assimilation system, Q. J. Roy. Meteorol. Soc., 137,
number 1144083. Julie K. Lundquist’s effort was supported by an 553–597, https://doi.org/10.1002/qj.828, 2011 (data available at:
agreement with the NREL under APUP UGA-0-41026-65. https://rda.ucar.edu/datasets/ds627.0/, last access: 20 December
2020).
Droegemeier, K. K. and Wilhelmson, R. B.: Numerical Sim-
ulation of Thunderstorm Outflow Dynamics. Part I: Out-
Review statement. This paper was edited by Andrea Hahmann
flow Sensitivity Experiments and Turbulence Dynamics, J.
and reviewed by two anonymous referees.
Atmos. Sci., 44, 1180–1210, https://doi.org/10.1175/1520-
0469(1987)0442.0.CO;2, 1987.
Duda, J. D. and Gallus, W. A.: The Impact of Large-Scale Forcing
References on Skill of Simulated Convective Initiation and Upscale Evo-
lution with Convection-Allowing Grid Spacings in the WRF,
Allaerts, D. and Meyers, J.: Gravity Waves and Wind-Farm Effi- Weather Forecast., 28, 994–1018, https://doi.org/10.1175/WAF-
ciency in Neutral and Stable Conditions, Bound.-Lay. Meteo- D-13-00005.1, 2013.
rol., 166, 269–299, https://doi.org/10.1007/s10546-017-0307-5, Dudhia, J.: Numerical Study of Convection Ob-
2018. served during the Winter Monsoon Experiment Us-
Allaerts, D. and Meyers, J.: Sensitivity and feedback of wind- ing a Mesoscale Two-Dimensional Model, J. Atmos.
farm-induced gravity waves, J. Fluid Mech., 862, 990–1028, Sci., 46, 3077–3107, https://doi.org/10.1175/1520-
https://doi.org/10.1017/jfm.2018.969, 2019. 0469(1989)0462.0.CO;2, 1989.
Armstrong, A., Burton, R. R., Lee, S. E., Mobbs, S., Ostle, ECMWF: ERA-Interim Project, Research Data Archive at
N., Smith, V., Waldron, S., and Whitaker, J.: Ground-level the National Center for Atmospheric Research, Computa-
climate at a peatland wind farm in Scotland is affected tional and Information Systems Laboratory, Boulder, CO,
by wind turbine operation, Environ. Res. Lett., 11, 044024, https://doi.org/10.5065/D6CR5RD9, 2009.
https://doi.org/10.1088/1748-9326/11/4/044024, 2016. Ek, M. B., Mitchell, K. E., Lin, Y., Rogers, E., Grunmann,
Arthur, R. S., Mirocha, J. D., Marjanovic, N., Hirth, B. D., P., Koren, V., Gayno, G., and Tarpley, J. D.: Implementa-
Schroeder, J. L., Wharton, S., and Chow, F. K.: Multi-Scale Sim- tion of Noah land surface model advances in the National
ulation of Wind Farm Performance during a Frontal Passage, Centers for Environmental Prediction operational mesoscale
Atmosphere, 11, 245, https://doi.org/10.3390/atmos11030245, Eta model, J. Geophys. Res.-Atmos., 108, 2002JD003296,
2020. https://doi.org/10.1029/2002JD003296, 2003.
Baidya Roy, S.: Can large wind farms affect lo- Fitch, A. C.: Climate Impacts of Large-Scale Wind Farms as Param-
cal meteorology?, J. Geophys. Res., 109, D19101, eterized in a Global Climate Model, J. Climate, 28, 6160–6180,
https://doi.org/10.1029/2004JD004763, 2004. https://doi.org/10.1175/JCLI-D-14-00245.1, 2015.
Baidya Roy, S. and Traiteur, J. J.: Impacts of wind farms on sur- Fitch, A. C.: Notes on using the mesoscale wind farm parameteriza-
face air temperatures, P. Natl. Acad. Sci., 107, 17899–17904, tion of Fitch et al. (2012) in WRF, Wind Energ., 19, 1757–1758,
https://doi.org/10.1073/pnas.1000493107, 2010. https://doi.org/10.1002/we.1945, 2016.
Barrie, D. B. and Kirk-Davidoff, D. B.: Weather response to a Fitch, A. C., Olson, J. B., Lundquist, J. K., Dudhia, J., Gupta, A. K.,
large wind turbine array, Atmos. Chem. Phys., 10, 769–775, Michalakes, J., and Barstad, I.: Local and Mesoscale Impacts of
https://doi.org/10.5194/acp-10-769-2010, 2010. Wind Farms as Parameterized in a Mesoscale NWP Model, Mon.
Carbone, R. E., Conway, J. W., Crook, N. A., and Moncrieff, M. W.: Weather Rev., 140, 3017–3038, https://doi.org/10.1175/MWR-
The Generation and Propagation of a Nocturnal Squall Line. Part D-11-00352.1, 2012.
I: Observations and Implications for Mesoscale Predictability, Fitch, A. C., Lundquist, J. K., and Olson, J. B.: Mesoscale In-
Mon. Weather Rev., 118, 26–49, https://doi.org/10.1175/1520- fluences of Wind Farms throughout a Diurnal Cycle, Mon.
0493(1990)1182.0.CO;2, 1990. Weather Rev., 141, 2173–2198, https://doi.org/10.1175/MWR-
Cervarich, M. C., Roy, S. B., and Zhou, L.: Spatiotem- D-12-00185.1, 2013.
poral Structure of Wind Farm-atmospheric Bound- Frandsen, S. T., Jørgensen, H. E., Barthelmie, R., Rathmann, O.,
ary Layer Interactions, Energy Procedia, 40, 530–536, Badger, J., Hansen, K., Ott, S., Rethore, P.-E., Larsen, S. E.,
https://doi.org/10.1016/j.egypro.2013.08.061, 2013.
https://doi.org/10.5194/wes-6-1-2021 Wind Energ. Sci., 6, 1–13, 202112 J. M. Tomaszewski and J. K. Lundquist: Observations and simulations of a wind farm and Jensen, L. E.: The making of a second-generation wind arising from uncoordinated wind energy development, Nature farm efficiency model complex, Wind Energ., 12, 445–458, Energy, 4, 26–34, https://doi.org/10.1038/s41560-018-0281-2, https://doi.org/10.1002/we.351, 2009. 2018. Goff, R. C.: Vertical Structure of Thunderstorm Outflows, Monthly Mlawer, E. J., Taubman, S. J., Brown, P. D., Iacono, M. J., Weather Review, 104, 1429–1440, https://doi.org/10.1175/1520- and Clough, S. A.: Radiative transfer for inhomogeneous 0493(1976)1042.0.CO;2, 1976. atmospheres: RRTM, a validated correlated-k model for Hoen, B., Diffendorfer, J., Rand, J., Kramer, L., Garrity, C., the longwave, J. Geophys. Res.-Atmos., 102, 16663–16682, and Hunt, H.: United States Wind Turbine Database, available https://doi.org/10.1029/97JD00237, 1997. at: https://eerscmap.usgs.gov/uswtdb (last access: 20 December Mueller, C. K. and Carbone, R. E.: Dynamics of a Thun- 2020), 2020. derstorm Outflow, Journal of the Atmospheric Sci- Hong, S. and Lim, J. J.: The WRF Single-Moment 6-Class Micro- ences, 44, 1879–1898, https://doi.org/10.1175/1520- physics Scheme (WSM6), Asia-pacific Journal of Atmospheric 0469(1987)0442.0.CO;2, 1987. Sciences, 42, 129–151, 2006. Nakanishi, M. and Niino, H.: An Improved Mellor–Yamada Level- Hunter, J. D.: Matplotlib: A 2D graphics environment, Comput. Sci. 3 Model: Its Numerical Stability and Application to a Regional Eng., 9, 90–95, https://doi.org/10.1109/MCSE.2007.55, 2007. Prediction of Advection Fog, Bound.-Lay. Meteorol., 119, 397– IEA: World Energy Outlook 2018, available at: https://www.iea. 407, https://doi.org/10.1007/s10546-005-9030-8, 2006. org/reports/world-energy-outlook-2018 (last access: 20 Decem- NOAA National Weather Service, R. O. C.: NOAA Next ber 2020), 2018. Generation Radar (NEXRAD) Level II Base Data, Isom, B. M., Palmer, R. D., Secrest, G. S., Rhoton, R. D., Sax- https://doi.org/10.7289/V5W9574V, type: dataset, 1991. ion, D., Allmon, T. L., Reed, J., Crum, T., and Vogt, R.: Nugraha, A. A. A. and Trilaksono, N. J.: Simulation of wind Detailed Observations of Wind Turbine Clutter with Scan- gust – Producing thunderstorm outflow over Mahakam block ning Weather Radars, J. Atmos. Ocean. Tech., 26, 894–910, using WRF, AIP Conference Proceedings, 1987, 020051, https://doi.org/10.1175/2008JTECHA1136.1, 2009. https://doi.org/10.1063/1.5047336, 2018. Jimenez, P. A., Dudhia, J., González-Rouco, J. F., Navarro, J., Mon- Platis, A., Siedersleben, S. K., Bange, J., Lampert, A., Bärfuss, K., távez, J. P., and García-Bustamante, E.: A Revised Scheme for Hankers, R., Cañadillas, B., Foreman, R., Schulz-Stellenfleth, J., the WRF Surface Layer Formulation, Mon. Weather Rev., 140, Djath, B., Neumann, T., and Emeis, S.: First in situ evidence 898–918, https://doi.org/10.1175/MWR-D-11-00056.1, 2012. of wakes in the far field behind offshore wind farms, Scientific Kain, J. S.: The Kain–Fritsch Convective Pa- Reports, 8, 2163, https://doi.org/10.1038/s41598-018-20389-y, rameterization: An Update, J. Appl. Meteo- 2018. rol., 43, 170–181, https://doi.org/10.1175/1520- Powers, J. G., Klemp, J. B., Skamarock, W. C., Davis, C. A., Dud- 0450(2004)0432.0.CO;2, 2004. hia, J., Gill, D. O., Coen, J. L., Gochis, D. J., Ahmadov, R., Peck- Keith, D. W., DeCarolis, J. F., Denkenberger, D. C., Lenschow, ham, S. E., Grell, G. A., Michalakes, J., Trahan, S., Benjamin, D. H., Malyshev, S. L., Pacala, S., and Rasch, P. J.: The influence S. G., Alexander, C. R., Dimego, G. J., Wang, W., Schwartz, of large-scale wind power on global climate, P. Natl. Acad. Sci., C. S., Romine, G. S., Liu, Z., Snyder, C., Chen, F., Barlage, M. J., 101, 16115–16120, https://doi.org/10.1073/pnas.0406930101, Yu, W., and Duda, M. G.: The Weather Research and Forecasting 2004. Model: Overview, System Efforts, and Future Directions, B. Am. Klazura, G. E. and Imy, D. A.: A Description of the Meteorol. Soc., 98, 1717–1737, https://doi.org/10.1175/BAMS- Initial Set of Analysis Products Available from the D-15-00308.1, 2017. NEXRAD WSR-88D System, B. Am. Meteorol. Quan, W., Xu, X., and Wang, Y.: Observation of a straight- Soc., 74, 1293–1312, https://doi.org/10.1175/1520- line wind case caused by a gust front and its associ- 0477(1993)0742.0.CO;2, 1993. ated fine-scale structures, J. Meteorol. Res., 28, 1137–1154, Klingle, D. L., Smith, D. R., and Wolfson, M. M.: Gust https://doi.org/10.1007/s13351-014-3080-0, 2014. Front Characteristics as Detected by Doppler Radar, Mon. Rajewski, D. A., Takle, E. S., Lundquist, J. K., Oncley, S., Prueger, Weather Rev., 115, 905–918, https://doi.org/10.1175/1520- J. H., Horst, T. W., Rhodes, M. E., Pfeiffer, R., Hatfield, J. L., 0493(1987)1152.0.CO;2, 1987. Spoth, K. K., and Doorenbos, R. K.: Crop Wind Energy Ex- Lee, J. C. Y. and Lundquist, J. K.: Evaluation of the wind periment (CWEX): Observations of Surface-Layer, Boundary farm parameterization in the Weather Research and Fore- Layer, and Mesoscale Interactions with a Wind Farm, B. Am. casting model (version 3.8.1) with meteorological and tur- Meteorol. Soc., 94, 655–672, https://doi.org/10.1175/BAMS-D- bine power data, Geosci. Model Dev., 10, 4229–4244, 11-00240.1, 2013. https://doi.org/10.5194/gmd-10-4229-2017, 2017a. Rajewski, D. A., Takle, E. S., Lundquist, J. K., Prueger, J. H., Lee, J. C. Y. and Lundquist, J. K.: Observing and Simulating Wind- Pfeiffer, R. L., Hatfield, J. L., Spoth, K. K., and Dooren- Turbine Wakes During the Evening Transition, Bound.-Lay. Me- bos, R. K.: Changes in fluxes of heat, H2O, and CO2 caused teorol., 164, 449–474, https://doi.org/10.1007/s10546-017-0257- by a large wind farm, Agr. Forest Meteorol., 194, 175–187, y, 2017b. https://doi.org/10.1016/j.agrformet.2014.03.023, 2014. Lissaman, P. B. S.: Energy Effectiveness of Arbitrary Rajewski, D. A., Takle, E. S., Prueger, J. H., and Dooren- Arrays of Wind Turbines, J. Energy, 3, 323–328, bos, R. K.: Toward understanding the physical link between https://doi.org/10.2514/3.62441, 1979. turbines and microclimate impacts from in situ measure- Lundquist, J. K., DuVivier, K. K., Kaffine, D., and Tomaszewski, ments in a large wind farm: Microclimate With Turbines J. M.: Costs and consequences of wind turbine wake effects Wind Energ. Sci., 6, 1–13, 2021 https://doi.org/10.5194/wes-6-1-2021
J. M. Tomaszewski and J. K. Lundquist: Observations and simulations of a wind farm                                                          13

   ON Versus OFF, J. Geophys. Res.-Atmos., 121, 13392–13414,             Smith, R. B.: Gravity wave effects on wind farm efficiency, Wind
   https://doi.org/10.1002/2016JD025297, 2016.                             Energ., 13, 449–458, https://doi.org/10.1002/we.366, 2009.
Rajewski, D. A., Takle, E. S., VanLoocke, A., and Purdy,                 Tomaszewski, J. M.: jessica-tomaszewski/WRF-WFP-outflow v1.1
   S. L.: Observations Show That Wind Farms Substantially Mod-             (Version 1.1), Zenodo, https://doi.org/10.5281/zenodo.3974719,
   ify the Atmospheric Boundary Layer Thermal Stratification               2020.
   Transition in the Early Evening, Geophys. Res. Lett., 47,             Tomaszewski, J. M. and Lundquist, J. K.: Simulated wind farm
   https://doi.org/10.1029/2019GL086010, 2020.                             wake sensitivity to configuration choices in the Weather Re-
Redfern, S., Olson, J. B., Lundquist, J. K., and Clack, C.                 search and Forecasting model version 3.8.1, Geosci. Model
   T. M.: Incorporation of the Rotor-Equivalent Wind Speed                 Dev., 13, 2645–2662, https://doi.org/10.5194/gmd-13-2645-
   into the Weather Research and Forecasting Model’s Wind                  2020, 2020.
   Farm Parameterization, Mon. Weather Rev., 147, 1029–1046,             Tomaszewski, J. M., Lundquist, J. K., Churchfield, M. J., and Mo-
   https://doi.org/10.1175/MWR-D-18-0194.1, 2019.                          riarty, P. J.: Do wind turbines pose roll hazards to light aircraft?,
Schmitz, S.: XTurb-PSU: A Wind Turbine Design and Analysis                 Wind Energ. Sci., 3, 833–843, https://doi.org/10.5194/wes-3-
   Tool, https://doi.org/10.13140/RG.2.2.22492.18567, 2012.                833-2018, 2018.
Schroeder, J. L., Burgett, W. S., Haynie, K. B., Sonmez, I., Skwira,     Toms, B. A., Tomaszewski, J. M., Turner, D. D., and Koch, S. E.:
   G. D., Doggett, A. L., and Lipe, J. W.: The West Texas Mesonet:         Analysis of a Lower-Tropospheric Gravity Wave Train Us-
   A Technical Overview, J. Atmos. Ocean. Tech., 22, 211–222,              ing Direct and Remote Sensing Measurement Systems, Mon.
   https://doi.org/10.1175/JTECH-1690.1, 2005.                             Weather Rev., 145, 2791–2812, https://doi.org/10.1175/MWR-
Siedersleben, S. K., Lundquist, J. K., Platis, A., Bange, J., Bärfuss,     D-16-0216.1, 2017.
   K., Lampert, A., Cañadillas, B., Neumann, T., and Emeis, S.:          Wakimoto, R. M.: The Life Cycle of Thunderstorm Gust Fronts
   Micrometeorological impacts of offshore wind farms as seen in           as Viewed with Doppler Radar and Rawinsonde Data, Mon.
   observations and simulations, Environ. Res. Lett., 13, 124012,          Weather Rev., 110, 1060–1082, https://doi.org/10.1175/1520-
   https://doi.org/10.1088/1748-9326/aaea0b, 2018a.                        0493(1982)1102.0.CO;2, 1982.
Siedersleben, S. K., Platis, A., Lundquist, J. K., Lampert, A.,          Xia, G., Zhou, L., Freedman, J. M., Roy, S. B., Harris, R. A.,
   Bärfuss, K., Cañadillas, B., Djath, B., Schulz-Stellenfleth, J.,        and Cervarich, M. C.: A case study of effects of atmo-
   Bange, J., Neumann, T., and Emeis, S.: Evaluation of a Wind             spheric boundary layer turbulence, wind speed, and stabil-
   Farm Parametrization for Mesoscale Atmospheric Flow Mod-                ity on wind farm induced temperature changes using observa-
   els with Aircraft Measurements, Meteorol. Z., 27, 401–415,              tions from a field campaign, Clim. Dynam., 46, 2179–2196,
   https://doi.org/10.1127/metz/2018/0900, 2018b.                          https://doi.org/10.1007/s00382-015-2696-9, 2016.
Siedersleben, S. K., Platis, A., Lundquist, J. K., Djath, B., Lam-       Xia, G., Cervarich, M. C., Roy, S. B., Zhou, L., Minder, J. R.,
   pert, A., Bärfuss, K., Cañadillas, B., Schulz-Stellenfleth, J.,         Jimenez, P. A., and Freedman, J. M.: Simulating Impacts of
   Bange, J., Neumann, T., and Emeis, S.: Turbulent kinetic energy         Real-World Wind Farms on Land Surface Temperature Us-
   over large offshore wind farms observed and simulated by the            ing the WRF Model: Validation with Observations, Mon.
   mesoscale model WRF (3.8.1), Geosci. Model Dev., 13, 249–               Weather Rev., 145, 4813–4836, https://doi.org/10.1175/MWR-
   268, https://doi.org/10.5194/gmd-13-249-2020, 2020.                     D-16-0401.1, 2017.
Skamarock, W. C. and Klemp, J. B.: A time-split nonhy-                   Xia, G., Zhou, L., Minder, J. R., Fovell, R. G., and Jimenez,
   drostatic atmospheric model for weather research and fore-              P. A.: Simulating impacts of real-world wind farms on land sur-
   casting applications, J. Comput. Phys., 227, 3465–3485,                 face temperature using the WRF model: physical mechanisms,
   https://doi.org/10.1016/j.jcp.2007.01.037, 2008.                        Clim. Dynam., 53, 1723–1739, https://doi.org/10.1007/s00382-
Smith, C. M., Barthelmie, R. J., and Pryor, S. C.: In                      019-04725-0, 2019.
   situ observations of the influence of a large onshore                 Zhou, L., Tian, Y., Baidya Roy, S., Thorncroft, C., Bosart,
   wind farm on near-surface temperature, turbulence intensity             L. F., and Hu, Y.: Impacts of wind farms on land
   and wind speed profiles, Environ. Res. Lett., 8, 034006,                surface temperature, Nature Clim. Change, 2, 539–543,
   https://doi.org/10.1088/1748-9326/8/3/034006, 2013.                     https://doi.org/10.1038/nclimate1505, 2012.
Skamarock, W. C., Klemp, J. B., Dudhia, J., Gill, D. O.,                 Zrnic, D. S. and Lee, J. T.: Investigation of the Detectability
   Barker, D. M., Duda, M. G., Huang, X.-Y., Wang, W., and                 and Lifetime of Gust Fronts and Other Weather Hazards to
   Powers, J. G.: A Description of the Advanced Research                   Aircraft., Tech. rep., NATIONAL OCEANIC AND ATMO-
   WRF Version 3, NCAR Tech. Note NCAR/TN-475+STR, 113                     SPHERIC ADMINISTRATION NORMAN OK NATIONAL
   pp., https://doi.org/10.5065/D68S4MVH, 2008 (data available             SEVERE STORMS LAB, available at: https://apps.dtic.mil/
   at: https://doi.org/10.5065/D6MK6B4K and http://www2.mmm.               dtic/tr/fulltext/u2/a141552.pdf (last access: 20 December 2020),
   ucar.edu/wrf/users/download/get_source.html, last access: De-           1983.
   cember 2020).

https://doi.org/10.5194/wes-6-1-2021                                                                    Wind Energ. Sci., 6, 1–13, 2021
You can also read