Implementation of WRF-Hydro at two drainage basins in the region of Attica, Greece, for operational flood forecasting - Natural Hazards and Earth ...
←
→
Page content transcription
If your browser does not render page correctly, please read the page content below
Nat. Hazards Earth Syst. Sci., 21, 1983–2000, 2021
https://doi.org/10.5194/nhess-21-1983-2021
© Author(s) 2021. This work is distributed under
the Creative Commons Attribution 4.0 License.

Implementation of WRF-Hydro at two drainage basins in the
region of Attica, Greece, for operational flood forecasting
Elissavet Galanaki1 , Konstantinos Lagouvardos1 , Vassiliki Kotroni1 , Theodore Giannaros1 , and Christos Giannaros2,1
1 National   Observatory of Athens, Ioannou Metaxa & Vas. Pavlou, 15236 Penteli, Greece
2 Frederick   Research Center, 7 Filokyprou Street, 1036 Pallouriotisa, Nicosia, Cyprus

Correspondence: Elissavet Galanaki (galanaki@meteo.noa.gr)

Received: 27 January 2020 – Discussion started: 3 April 2020
Revised: 22 March 2021 – Accepted: 25 May 2021 – Published: 2 July 2021

Abstract. An integrated modeling approach for forecasting         1   Introduction
flood events is presented in the current study. An advanced
flood forecasting model, which is based on the coupling of
hydrological and atmospheric components, was used for a           Floods are among the most common natural disasters re-
twofold objective: first to investigate the potential of a cou-   lated to deaths, destruction, and economic losses. World-
pled hydrometeorological model to be used for flood fore-         wide, 500 000 deaths due to floods have been reported
casting at two medium-size drainage basins in the area of         from 1980 to 2009, with more than 2.8 billion people be-
Attica (Greece) and second to investigate the influence of        ing affected (Doocy et al., 2013). Petrucci et al. (2018), who
the use of the coupled hydrometeorological model on the           developed a flood mortality database in five study areas in
precipitation forecast skill. For this reason, we used pre-       the Mediterranean (including Greece) for the period 1980–
cipitation and hydrometric in situ data for six flood events      2015, have found an increasing trend of flood fatalities dur-
at two selected drainage regions of Attica. The simulations       ing the studied period. In Greece and especially in its capi-
were carried out with the Weather Research and Forecast-          tal, Athens, flooding events were responsible for 182 deaths
ing (WRF) model (WRF-only) and the WRF-Hydro system               from 1880 to 2010 (Diakakis et al., 2013). Papagiannaki et
in a fully coupled mode, under which surface, subsurface,         al. (2013), who developed a database of high-impact weather
and channel hydrological processes were parameterized at a        events over Greece for the period 2001–2011, which has been
fine-resolution grid of 95 m approximately. Results showed        continuously updated since then, showed that flash floods
that the coupled WRF-Hydro system was capable of pro-             constitute the most common weather-related phenomenon
ducing the observed discharge during the flood episodes,          with damages in Greece. Recently, a devastating flash flood,
after the adequate calibration method applied at the stud-        which affected Mandra (in the western Attica region) on
ied basins. This outcome provides confidence that the model       15 November 2017, resulted in 24 deaths and great economic
configuration under the two-way atmospheric–hydrological          losses, highlighting the consequences of urbanization, un-
coupling is robust and, thus, can be used for operational         controlled construction, and changes in land use. Hydrologi-
flood forecasting purposes in the area of Attica. In addition,    cal regimes are affected by climate change. In particular, an
the WRF-Hydro model showed a tendency to slightly im-             increase in the intensity and the frequency of floods, due to
prove the simulated precipitation in comparison to the pre-       human-induced climate modifications, has been reported in
cipitation produced by the atmospheric-only version of the        the literature (Falter et al., 2015; Wu et al., 2014; Romang et
model (WRF), demonstrating the capability of the coupled          al., 2011; Milly et al., 2002; White et al., 2001).
WRF-Hydro model to enhance the precipitation forecast skill          Given the rapid urbanization, the land-use changes, and
for operational flood predictions.                                the human-induced climate change, the risk from future
                                                                  floods is significant, and, thus, reliable and accurate flood
                                                                  forecast systems applied over vulnerable areas are ur-
                                                                  gently needed. Flood forecasting strengthens the prepared-

Published by Copernicus Publications on behalf of the European Geosciences Union.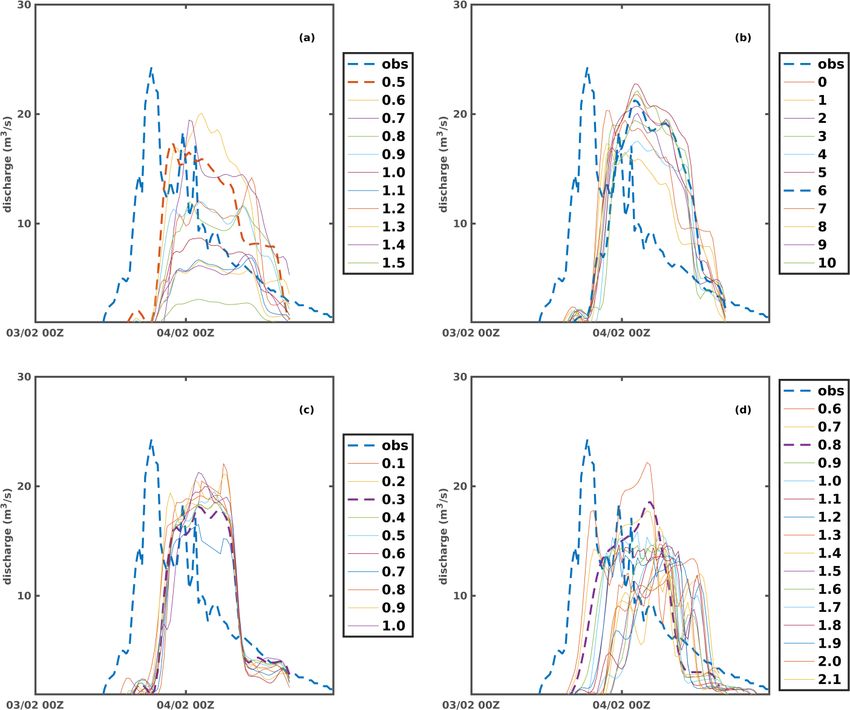
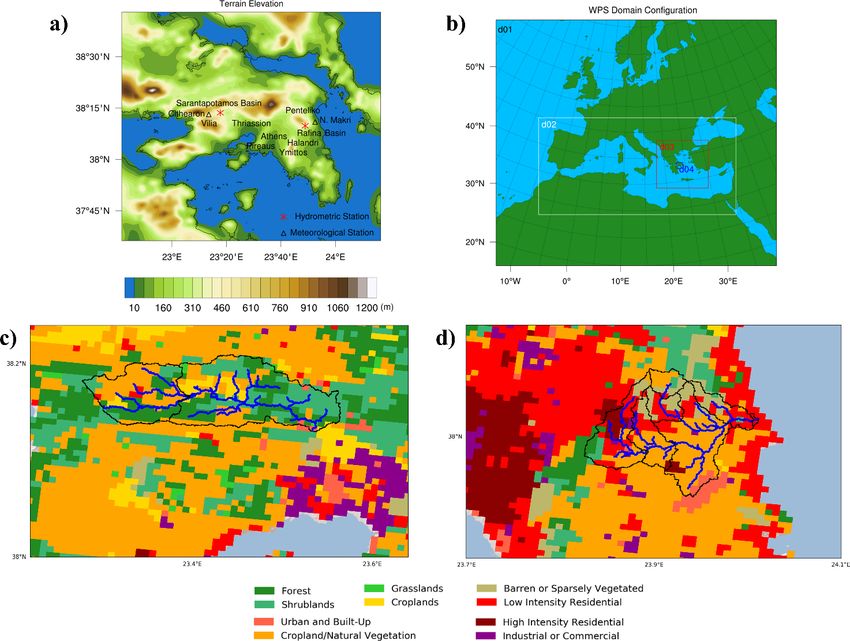
1984                     E. Galanaki et al.: Implementation of WRF-Hydro at two drainage basins in the region of Attica

ness phases of disaster management, providing a reduction            catchment areas in Cyprus and shown how the accuracy of
of the impacts of severe rain events. A reliable and effec-          the input precipitation can strongly affect the hydrological
tive flood forecasting system should provide an accurate re-         simulation. Furthermore, Varlas et al. (2019) and Papaioan-
production of both rainfall and hydrological response inside         nou et al. (2019) have shown that WRF-Hydro demonstrates
the targeted drainage areas. In this direction, simulating the       adequate skill in reproducing two past flood events in Greece.
land–atmosphere interactions through coupling of hydrolog-              Considering the increased risk and impacts of flooding
ical and atmospheric models, in order to consider the chan-          (Papagiannaki et al., 2013; Diakakis, 2012), a reliable flood
nel and terrain routing of the surface and subsurface water          forecasting system serving operational needs constitutes an
flows, plays an important role (Larsen et al., 2016; Hauck et        urgent need in Attica, where 36 % of the total population
al., 2011). The terrestrial hydrological processes affect soil       lives, while changes in land use and high rates of urban-
moisture, a variable that is crucial for the computation of the      ization are major problems (from 1961 to 2001, the city of
sensible and latent heat fluxes, which in turn affect the at-        Athens increased in size by 82 %). This need motivated the
mospheric response (Seneviratne et al., 2010; Maxwell et al.,        present study, which has a twofold objective. Firstly, we in-
2007; Etalhir, 1998). Several studies have shown that an im-         vestigate the ability of a two-way coupled hydrometeorologi-
provement, although not always significant, on the forecast-         cal model (WRF-Hydro) to be used for flood forecasting pur-
ing of the spatiotemporal distribution of extreme synoptic           poses at two drainage basins in the area of Attica after ade-
and convective precipitation is provided through the use of          quate calibration and validation. Secondly, we examine the
coupled hydrometeorological models (e.g., Pal et al., 2020;          influence of the use of the WRF-Hydro model on the precip-
Wehbe et al., 2019; Senatore et al., 2015; Shrestha et al.,          itation forecasts compared to the simulations performed with
2014; Maxwell et al., 2007). Although the mechanisms of              the WRF model.
the land–atmosphere and hydrology coupling that influence               The next sections of this paper are structured as follows:
the forecast skill of precipitation are still under investigation,   Sect. 2 provides a detailed presentation of the methodol-
it is well accepted that coupled hydrometeorological mod-            ogy followed by the model calibration and the datasets used,
els show a significant potential for effective flood forecasting     Sect. 3 discusses the results, and finally Sect. 4 hosts the con-
(e.g., Givati et al., 2016). WRF-Hydro, an enhanced version          clusions and the future prospects of this study.
of the Weather Research and Forecasting (WRF; Skamarock
et al., 2005) model, is one of the various modeling systems
that provides a two-way coupling between the hydrological            2     Methods
and land–atmosphere processes. More specifically, it param-
eterizes overland and river flow routing and subsurface rout-        2.1    Study area and data
ing in the 2 m soil column, while it also includes a ground-
water bucket model, thus providing a feedback between ter-           The study area is the greater area of Attica basin where the
restrial hydrology and land–atmosphere interactions in the           capital and largest city of Greece, Athens, and the largest port
WRF system. The WRF-Hydro model has been used in nu-                 of the country, Piraeus, are located. Attica basin has an area
merous flood-related research applications (Senatore et al.,         of 450 km2 and is characterized by a complex geomorphol-
2020; Papaioannou et al., 2019; Varlas et al., 2019; Avolio et       ogy (Fig. 1a). It is a triangular peninsula with the Cithaeron
al., 2019; Lin et al., 2018; Silver et al., 2017; Xiang et al.,      mountain range to the north acting as a physical division
2017; Arnault et al., 2016; Givati et al., 2016; Wagner et al.,      from Boeotia. The population of Attica is ∼3.8 million peo-
2016; Senatore et al., 2015; Yucel et al., 2015) and for opera-      ple (about 36 % of the national total) and includes a great part
tional flood forecasting in the United States (Krajewski et al.,     of the national financial and commercial activities.
2017; NOAA, 2016) and Israel (Givati and Sapir, 2014). In               Papagiannaki et al. (2013) and Diakakis (2012) provided
particular, in the Mediterranean area, Senatore et al. (2020)        evidence that Attica is the most affected area in Greece
implemented WRF-Hydro in a catchment of Italy in order               concerning weather-related hazards and particularly flash
to highlight the impact of sea surface temperature (SST) in          floods. Flash-flood events in Attica have been studied from
operational forecasts. Avolio et al. (2019) showed that WRF-         the meteorological point of view (Lagouvardos et al., 1996;
Hydro was capable of simulating the hydro-meteorological             among others), the climatological aspect (Galanaki et al.,
impact of a high-intensity rainfall event in Italy. Senatore         2016, 2018), flood risk (Lasda et al., 2010; Kandilioti and
et al. (2015) studied the impact of the fully coupled WRF-           Makropoulos, 2012), and vulnerability (Papagiannaki et al.,
Hydro model in the forecasting precipitation and showed              2015, 2017). Papagiannaki et al. (2015), in particular, found
that the coupled model provides improved simulation pre-             that impacts of floods increase significantly when 24 h accu-
cipitation compared to those provided by WRF-only simula-            mulated rainfall exceeds 60 mm.
tions. Furnari et al. (2020) showed that the implementation             In the current study, we focus on two drainage areas of the
of WRF-Hydro has the potential to improve the precipitation          flood-prone Attica region. The first one is the Sarantapota-
forecasts over a small catchment area in Italy by up to 200 %.       mos basin (Fig. 1a and c) that drains an area of 310 km2 and
Camera et al. (2020) have implemented WRF-Hydro in small             is responsible for flooding events in the urbanized broader

Nat. Hazards Earth Syst. Sci., 21, 1983–2000, 2021                                   https://doi.org/10.5194/nhess-21-1983-2021
E. Galanaki et al.: Implementation of WRF-Hydro at two drainage basins in the region of Attica                                  1985

Figure 1. (a) Terrain elevation of the studied domain (obtained by MODIS-IGBP global land cover data) along with two channel networks
and the positions of the meteorological (triangle marker) and hydrometric stations (star marker). (b) Modeling domains. The borders of
analyzed catchments along with the land cover for (c) Sarantapotamos and (d) Rafina basins.

area of Thriassion plain, located in west Attica, Greece.            way), have intensified and increased the frequency of floods
Among the most important natural flood causes in the area            in the region (Papathanasiou et al., 2015). It is important to
are the geomorphological characteristics of the drainage net-        note that both the studied basins are medium-size catchments
work, the intense rainfall, and the increasing urbanization,         (< 310 km2 ), which makes the hydrological simulation chal-
which is deprived of integrated flood defense measures. In           lenging.
particular when heavy rainfall occurs, the relatively mild              The data for stage and discharge for Sarantapotamos
slopes result in a decrease in the surface runoff velocity, ac-      basin were provided at 15 min intervals from the hy-
cumulating a large volume of water in short times (Zigoura           drometric stations of the Deucalion project (Fig. 1a;
et al., 2014).                                                       http://deucalionproject.itia.ntua.gr, last access: 28 Decem-
   The second study area is the Rafina basin, in eastern Attica      ber 2019), while the data for Rafina basin were derived
(Fig. 1a and d). It drains an area of almost 120 km2 (Karym-         from the Hydrological Observatory of Athens of the National
palis et al., 2005) bounded to the north and northeast by Pen-       Technical University of Athens. For the meteorological eval-
teliko Mountain and to the west and southwest by Ymittos             uation of the conducted simulations, 10 min precipitation
Mountain. The area of Rafina was characterized by a rapid            measurements were obtained from the network of surface
residential development over the last decades. In addition,          meteorological stations operated by the National Observa-
the recent fires, which have burned a significant part of the        tory of Athens (NOA; Lagouvardos et al., 2017). The nearest
catchment area, combined with the deflection of Halandri’s           meteorological stations to the hydrometric stations used are
stream (during the construction of the “Attiki Odos” high-

https://doi.org/10.5194/nhess-21-1983-2021                                  Nat. Hazards Earth Syst. Sci., 21, 1983–2000, 2021
1986                    E. Galanaki et al.: Implementation of WRF-Hydro at two drainage basins in the region of Attica

located in Vilia and N. Makri in Sarantapotamos and Rafina        spaced full sigma layers in the vertical direction, and the
(Fig. 1a).                                                        model top was set at 50 hPa. For domains 1–3, the 30 arcsec
   Six flood events have been considered for the analy-           spatial resolution United States Geological Survey (USGS)
sis. Table 1 includes the simulation periods of each event,       GTOPO30 terrestrial data and the 30 arcsec spatial resolution
which were selected after spin-up sensitivity experiments         Moderate Resolution Imaging Spectroradiometer – Interna-
(Sect. 2.2.1), and their observed total rainfall and maximum      tional Geosphere-Biosphere Project (MODIS-IGBP) global
discharge as they have been recorded at the meteorologi-          land cover data have been used. Despite the high spatial res-
cal and hydrometric stations. All examined episodes were          olution of the MODIS-IGBP dataset, it only includes one
associated with synoptic atmospheric circulation, driven by       category for the urban areas. The latter datasets are consid-
low-pressure systems, which, in most cases, were combined         ered to be inadequate for ultrahigh-resolution (< 1 km) mod-
with 500 hPa troughs and cut-off lows. In particular, sur-        eling (Giannaros et al., 2018; Nunalee et al., 2015), which is
face low-pressure systems, found west of Greece, affected         necessary for hydrometeorological forecasting (e.g., Verri et
the country in combination with upper-level cut-off lows on       al., 2017). Thus, the high-resolution Shuttle Radar Topogra-
6 February 2012 (event 3) and 29 December 2012 (event 4).         phy Mission (SRTM) 90 m × 90 m topography data and the
In the course of events 1 and 6, the atmospheric circula-         3 arcsec resolution Corine Land Cover (CLC) dataset were
tion was characterized by troughs in the middle troposphere       used for a better land use and topography representation in
over Greece, associated with surface cyclones located west        the innermost d04 domain.
of north Italy (event 6) and in the Ionian Sea (event 1). The        The WRF parametrization schemes used for the simu-
systems induced considerable precipitation in Greece during       lations are given in Table 2. The selection of the physics
the above episodes, resulting in noticeable impacts over the      schemes was based on sensitivity tests conducted for the ex-
examined basins (Giannaros et al., 2020). The higher im-          ploration of the best-performing schemes in terms of pre-
pacts in the Sarantapotamos catchment were reported in Vilia      cipitation forecasting in the framework of setting up the
in the night between 21 and 22 February 2013 (event 5),           model for operational forecasting in Greece. For the cloud
when 24 h precipitation and maximum discharge reached up          microphysics processes, the WRF Single-Moment 6-Class
to 77 mm and 19.2 m3 s−1 , respectively. During this episode,     Microphysics scheme (WSM6; Hong and Lim, 2006) was
a very deep surface low crossed the Mediterranean Sea to-         used, which has also been implemented in other studies over
wards Greece. The system was associated with an upper-            Greece (e.g., Emmanouil et al., 2020; Politi et al., 2018; Gi-
level trough having a negatively tilted axis (Giannaros et        annaros et al., 2016; Pytharoulis et al., 2016). The short-
al., 2020). Between 2 and 5 February 2011 (event 2), ex-          wave and longwave radiation fluxes were parameterized with
ceptional atmospheric conditions affected Greece (Giannaros       the Dudhia (1989) and the Rapid Radiative Transfer Model
et al., 2020). Significant impacts were evident in the Rafina     (RRTM; Mlawer et al., 1997) schemes. For the surface layer
catchment, where the total 48 h rainfall surpassed 123 mm in      parameterization the Eta geophysical fluid dynamics labo-
N. Makri, and the maximum discharge exceeded 24 m3 s−1            ratory (GFDL) scheme (Schwarzkopf and Fels, 1991) was
in Rafina. As highlighted above, events 2 and 5 affected the      adopted. The Noah land surface model scheme (Chen and
examined areas more severely and were the most devastating        Dudhia, 2001) and Mellor–Yamada–Janjić (MYJ) parame-
for the whole area of Attica, where floods, deaths, destruc-      terization (Janjic, 2002) were chosen as land surface and
tion, and great economic losses were induced. More details        planetary boundary layer schemes, respectively. Noah-MP
on the hydrometeorological and socio-economic characteris-        introduces multiple options and tunable parameters to sim-
tics of events 2 and 5 can be found in Giannaros et al. (2020).   ulate the land surface processes. However, the default val-
                                                                  ues of these options and parameters are not suitable for every
2.2     The fully coupled modeling system                         study area (e.g., Giannaros et al., 2019). In contrast, the Noah
                                                                  Land Surface Model (LSM) has been tested and applied suc-
2.2.1    Advanced research WRF                                    cessfully in several studies focusing on Greece (e.g., Var-
                                                                  las et al., 2019; Papaioannou et al., 2019; Giannaros et al.,
The Advanced Research Weather Research and Forecasting            2020). In addition, the MYJ parameterization scheme has
model version 3.9.1.1 was used in this study (Skamarock et        been successfully implemented in other studies over Greece
al., 2008) for the land–atmosphere simulations which were         (e.g., Emmanouil et al., 2020; Politi et al., 2018). Cumu-
carried out using four two-way nested grids (Fig. 1b): d01,       lus parameterization, namely the Kain–Fritsch scheme (Kain
d02, d03, and d04 with 18 km (325 × 285 grid points), 6 km        and Fritsch, 1992), was activated only for d01 and d02.
(685 × 337 grid points), 2 km (538 × 499 grid points), and           The simulations were initialized and forced at its lat-
667 m (208 × 184 grid points) grid increments, respectively.      eral boundaries by meteorological data derived from ERA5
The coarse domain (d01) encompasses the area of Europe.           reanalysis data (Hersbach and Dee, 2016) provided by
The higher-resolution domains cover the area of the Mediter-      the European Center for Medium-Range Weather Fore-
ranean (d02) and Greece (d03), while the finest-resolution        casts (ECMWF). The reanalysis data have a spatial resolu-
grid covers the area of Attica. Each domain has 40 unevenly       tion of 0.25◦ × 0.25◦ , having 37 pressure levels in the verti-

Nat. Hazards Earth Syst. Sci., 21, 1983–2000, 2021                               https://doi.org/10.5194/nhess-21-1983-2021
E. Galanaki et al.: Implementation of WRF-Hydro at two drainage basins in the region of Attica 1987
Table 1. Simulation periods of each event and hydrometeorological characteristics.
Basin Simulation Simulation Spin-up Total rainfall Maximum
date date discharge
start end
Event 1/E1 Rafina 2 Jan 2011 3 Jan 2011 6h 37.6 mm of rain 8 m3 s−1
00:00 UTC 18:00 UTC (24 h in Rafina
accumulated)
in N. Makri
Event 2/E2 Rafina 2 Feb 2011 5 Feb 2011 24 h 123.8 mm of rain 24.3 m3 s−1
00:00 UTC 18:00 UTC (48 h in Rafina
accumulated)
in N. Makri
Event 3/E3 Rafina 6 Feb 2012 8 Feb 2012 6h 33.6 mm of rain 9.1 m3 s−1
06:00 UTC 18:00 UTC (48 h in Rafina
accumulated)
in N. Makri
Event 4/E4R Rafina 28 Dec 2012 31 Dec 2012 18 h 86.8 mm of rain 44.3 m3 s−1
06:00 UTC 18:00 UTC (72 h in Rafina
accumulated)
in N. Makri
Event 4/E4S Sarantapotamos 28 Dec 2012 1 Jan 2013 18 h 104.6 mm of rain 12.8 m3 s−1
18:00 UTC 18:00 UTC (72 h in Vilia
accumulated)
in Vilia
Event 5/E5 Sarantapotamos 21 Feb 2013 23 Feb 2013 6h 77 mm of rain 19.2 m3 s−1
18:00 UTC 18:00 UTC (24 h in Vilia
accumulated)
in Vilia
Event 6/E6 Sarantapotamos 2 Mar 2014 4 Mar 2014 24 h 85 mm of rain 10.7 m3 s−1
00:00 UTC 18:00 UTC (48 h in Vilia
accumulated)
in Vilia
Table 2. The WRF physics schemes used.
Europe (d01) Mediterranean (d02) Greece (d03) Attica Basin (d04)
Microphysics WSM6 WSM6 WSM6 WSM6
Cumulus physics KF KF – –
Shortwave/longwave radiation physics RRTMG/RRTMG RRTMG/RRTMG RRTMG/RRTMG RRTMG/RRTMG
Planetary boundary layer physics MYJ MYJ MYJ MYJ
Surface layer physics Eta similarity Eta similarity Eta similarity Eta similarity
Land surface model Noah Noah Noah Noah
cal direction, and are provided at 6 h intervals. It should be the WRF simulations having a coarse domain (do1) resolu-
noted that the use of ERA5 reanalysis data was preferred in- tion of 18 km. Furthermore, the ERA5 reanalysis dataset has
stead of the operational Global Forecast System (GFS) data, been proven reliable for hydrological modeling applications
as the on-line availability of the GFS forecasts is limited for (Alves et al., 2020; Crossett et al., 2020; Martens et al., 2020;
historical periods. GFS initialization data could be ordered Tarek et al., 2020).
for the investigated events but at a high spatial resolution of Using the aforementioned setup, a series of sensitivity
0.5◦ × 0.5◦ , which was not considered adequate for forcing tests were performed in order to explore the best spin-up time
https://doi.org/10.5194/nhess-21-1983-2021 Nat. Hazards Earth Syst. Sci., 21, 1983–2000, 20211988 E. Galanaki et al.: Implementation of WRF-Hydro at two drainage basins in the region of Attica
10, 10–40, 40–100, and 100–200 cm) in the fine-resolution
grid and then was aggregated in the coarser grid of d04.
Subsurface lateral flow of soil was calculated by apply-
ing the methodology proposed by Wigmosta et al. (1994)
and Wigmosta and Lettenmaier (1999) prior to the routing of
overland flow, allowing the exfiltration from fully saturated
grid cells to be added to the surface flow of the coarser grid.
The effects of topography and the saturation depth of soil
were included in the calculation of subsurface flow. Thus,
when the depth of ponded water on a grid cell exceeded
a threshold, the overland flow was solved with a diffusive
wave formulation adapted from Julien et al. (1995) and Og-
den (1997).
2.3 Calibration method
Figure 2. The temporal evolution of the precipitation at the rain
gauge station at Vilia for event 5.
The aim of the WRF-Hydro calibration is to improve the spa-
tial resolution of parameters that control the total water vol-
ume and the shape of the predicted hydrograph. Generally,
for each event. More precisely, four numerical simulations the calibration processes for WRF-Hydro can be divided into
were conducted for each event, starting at 24, 18, 12, and 6 h three categories: the manual step-wise process (e.g., Li et
before the initiation of the rainfall. The choice of the best al., 2017), the automated calibration process, and mixed cal-
spin-up time for each simulation was made by comparing ibration approaches combining manual and automated cali-
the temporal evolution of precipitation produced by the WRF bration (e.g., Verri et al., 2017). The step-wise approach of
model with the observed precipitation at the rain gauge sta- calibration is widely applied in order to minimize the high
tion at Vilia for the basin of Sarantapotamos and at the rain number of model runs that are required for the automated
gauge station at N. Makri for the Rafina basin. An example calibration approach.
of the temporal evolution of the rainfall in Vilia for event 5 is WRF-Hydro has numerous tabulated parameters that in-
given in Fig. 2. fluence the simulated hydrological processes and the output
discharge. Yucel et al. (2015) showed that four parameters
2.2.2 WRF-Hydro are the most critical for the simulated hydrograph. Thus, in
this study, calibration procedure was based on the stepwise
The WRF-Hydro modeling system, version 3.0, was used for method suggested by Yucel et al. (2015) and also imple-
this study under a fully coupled mode. WRF-Hydro is a dis- mented by other authors (e.g., Wang et al., 2020). The step-
tributed hydrometeorological modeling system which is two- wise calibration was performed in two basic steps: firstly,
way coupled with WRF, providing multiple physics options we defined the parameters that influence the total water vol-
for surface overland flow, saturated subsurface flow, channel ume, and then we calibrated the parameters controlling the
routing, and base-flow processes (Gochis et al., 2015). The shape of the hydrograph. The parameters that control the to-
main advantage of WRF-Hydro is the ability to simulate the tal water volume are the runoff infiltration factor (REFKDT)
specialized components of water cycle such as soil moisture and the surface retention depth (RETDEPRTFAC). The RE-
and groundwater, considering the routing processes of the in- FKDT parameter controls the amount of water that flows into
filtration capacity excess and the saturated subsurface water. the channel network, while the RETDEPRTFAC influences
In the present study, WRF-Hydro was configured for the the surface slope and thus the accumulation of the water.
d04 domain, in a coupled manner with physics options of The parameters that control the shape of the hydrograph
surface flow, sub-surface flow, and channel routing acti- are related to the surface (OVROUGHRT) and channel
vated. The catchments’ routing grids were computed based roughness (Manning’s roughness, MannN). Thus, the pa-
on SRTM 90 m topography data using the WRF-Hydro GIS rameters were calibrated in the following order: REFKDT,
pre-processing toolkit. In order to exploit this high-resolution RETDEPRTFAC, OVROUGHRTAC, and MannN. The pa-
input dataset, avoiding interpolation to a coarser grid (Verri rameters are abbreviated following the nomenclature of the
et al., 2017; Gochis and Chen, 2003), a ∼ 95 m spatial reso- WRF-Hydro name list. The calibrated values for each pa-
lution WRF-Hydro domain was configured over the WRF in- rameter are shown in Table 3, along with the default values.
nermost domain. Thus, the ratio between the high-resolution The MannN parameter is defined for each stream order in
terrain routing grid and the WRF land surface model (aggre- the drainage area. The ArcGIS pre-processing tool, used for
gation factor; AGGFACTRT) was set to 7. The soil water in- the reproduction of the hydrological features of the studied
filtration and redistribution was computed in four layers (0– catchments, resulted in four Strahler stream orders (Strahler,
Nat. Hazards Earth Syst. Sci., 21, 1983–2000, 2021 https://doi.org/10.5194/nhess-21-1983-2021E. Galanaki et al.: Implementation of WRF-Hydro at two drainage basins in the region of Attica 1989
Table 3. The range of calibrated parameters.
Parameter Definition Range of Increment Default
scaling value
factor
REFKDT Runoff infiltration 0.5–1.5 0.1 3.0
RETDEPRTFAC Surface retention depth 0–10 1 1.0
OVROUGHRTAC Surface roughness 0.1–1 0.1 1.0
Manning’s roughness/stream order 1 Channel roughness 0.33–1.16 0.1 0.55
Manning’s roughness/stream order 2 Channel roughness 0.21–0.74 0.1 0.35
Manning’s roughness/stream order 3 Channel roughness 0.09–0.32 0.1 0.15
Manning’s roughness/stream order 4 Channel roughness 0.06–0.21 0.1 0.10
1957) in both Sarantapotamos and Rafina. Thus, MannN val- Table 4. The correlation coefficient and the Nash–Sutcliffe test be-
ues in Table 3 are shown for the first four stream orders. In the tween the observed hydrograph and the simulations for the optimum
stepwise calibration method, sensitivity tests were performed values of each parameter for Sarantapotamos basin, after the 5 h dis-
for each parameter, and when a parameter was calibrated its placement of the temporal evolution of the simulated discharge.
optimum value was kept constant when the sensitivity tests
for the next parameter were performed. Further details on Parameter Correlation Nash–Sutcliffe
the calibration of the aforementioned parameters for each (R)
basin (Sarantapotamos & Rafina) are given in the following REFKDT = 0.5 0.86 0.67
section. The calibration of the WRF-Hydro model was per- RETDEPRTFAC = 10 0.87 0.65
formed using the WRF atmospheric forcing, including the OVROUGHRTAC = 0.4 0.89 0.69
precipitation fields, following the same approach of forcing MannN = 1.1 0.85 0.67
the model with WRF data from previous studies (e.g., Li et
al., 2017, 2020; Liu et al., 2021).
steps. Firstly, a visual comparison of the simulated and ob-
3 Results and discussion served discharge was performed. Secondly, we applied sta-
tistical analysis tests. More precisely, the statistical analysis
3.1 Sarantapotamos basin included the computation of correlation coefficient and the
Nash–Sutcliffe coefficient between the observed and simu-
3.1.1 Calibration of Sarantapotamos basin lated discharge calculated per 15 min for each possible value
of REFKDT (Fig. 4). Thus, the value which has the best cor-
Due to limited availability of streamflow data, the calibration relation for the Nash–Sutcliffe coefficient was chosen as the
process was performed only for event 5 at the basin of Saran- optimum value, after the visual comparison of the simulated
tapotamos, while the rest of the events were used to evaluate and observed discharge. Namely, the value of 0.5 for RE-
the performance of the calibration process. Figure 3 shows FKDT parameter was selected. Table 4 shows the correlation
the evolution of the discharge (observed and simulated) for and the Nash–Sutcliffe coefficient for the optimum value for
each calibrated parameter. The choice of the optimum value each parameter.
for each parameter was based on the selected objective crite- It is noted that there is a lag at the time of maximum dis-
ria, namely the Nash–Sutcliffe efficiency and the correlation charge between the observations and the model results. This
coefficient (R), between simulated and observed discharges. discrepancy is attributed to the time lag between the sim-
Figure 3a shows the results for the first parameter of the ulated and observed temporal evolution of precipitation at
step-wise calibration method (REFKDT). As possible values Vilia station (Fig. 2). After the implementation of cross cor-
for the REFKDT parameter range from 0.5 to 5, we firstly relation analysis, it was found that the maximum correlation
performed several simulations for possible REFKDT’s val- between the simulated and the observed temporal evolution
ues of 1, 2, 3, 4, and 5 (not shown) in order to find the appro- of precipitation is achieved with a delay of 5 h. It must be
priate range of the scaling factor. Thus, the appropriate range noted that the results of the statistical analysis presented in
of REFKDT was found to be from 0.5 to 1.5, and then addi- Table 4 are computed after the displacement of the tempo-
tional simulations were performed within this range with in- ral evolution of the simulated discharge. This displacement
crements of 0.1. Figure 3a shows that the discharge decreases of 5 h was necessary in order to derive the optimum value
as the REFKDT’s values increase. For the selection of the op- of each parameter. For instance, if we do not take into ac-
timum value of each parameter, we implemented two basic count the 5 h gap, the correlation and the Nash–Sutcliffe co-
https://doi.org/10.5194/nhess-21-1983-2021 Nat. Hazards Earth Syst. Sci., 21, 1983–2000, 20211990 E. Galanaki et al.: Implementation of WRF-Hydro at two drainage basins in the region of Attica Figure 3. The evolution of the discharge (observed and simulated) for event 5 for (a) REFKDT, (b) RETDEPRTFAC, (c) OVROUGHRTAC, and (d) MannN parameter. Figure 4. (a) The correlation and (b) the Nash–Sutcliffe coefficient between the observed and simulated discharge for each possible value of REFKDT for Sarantapotamos basin, after the 5 h displacement of the temporal evolution of the simulated discharge. efficients are not in the acceptable limits; thus the choice of was used for the simulations. The RETDEPRTFAC is re- the optimum value for each parameter cannot be determined. lated to the retention depth of water from the surface. Thus, Figure 3b shows the temporal evolution of discharge for if the RETDEPRTFAC value is 0, there is no accumulation the possible RETDEPRTFAC values. The possible values of of water in the area. Figure 3b shows that the simulated RETDEPRTFAC range from 0 to 10, while an increment of 1 discharge decreases with increasing values of RETDEPRT- Nat. Hazards Earth Syst. Sci., 21, 1983–2000, 2021 https://doi.org/10.5194/nhess-21-1983-2021
E. Galanaki et al.: Implementation of WRF-Hydro at two drainage basins in the region of Attica 1991
FAC. The value of 10 for the RETDEPRTFAC parameter was Table 5. The correlation coefficient and the Nash–Sutcliffe test be-
selected based on visual comparison of the model and ob- tween the observed hydrograph and the simulations for the optimum
served discharge and on the statistical analysis, following the values of each parameter for Rafina basin.
aforementioned procedure for the selection of REFKDT (not
shown). It should be noted that the optimal parameters for Parameter Correlation Nash–Sutcliffe
REFKDT and RETDEPRTFAC hit the lower and calibration (R)
limits, respectively. Relaxing their constraints may result in REFKDT = 0.5 0.48 −0.06
better calibration results. RETDEPRTFAC = 6 0.38 −0.6
Figure 3c and d show the temporal evolution of dis- OVROUGHRTAC = 0.3 0.46 0.19
charge for the parameters which control the hydrograph MannN = 1.2 0.62 0.51
shape (OVROUGHRTAC and Manning’s roughness). The
OVROUGHRTAC parameter is related to the surface rough-
ness of the channel and was calibrated for values between 0.1 3.2 Rafina basin
and 1.0 with 0.1 increments (Fig. 3c). Finally, a scaling fac-
tor value of 0.4 for the OVROUGHRTAC parameter was se- 3.2.1 Calibration of Rafina basin
lected.
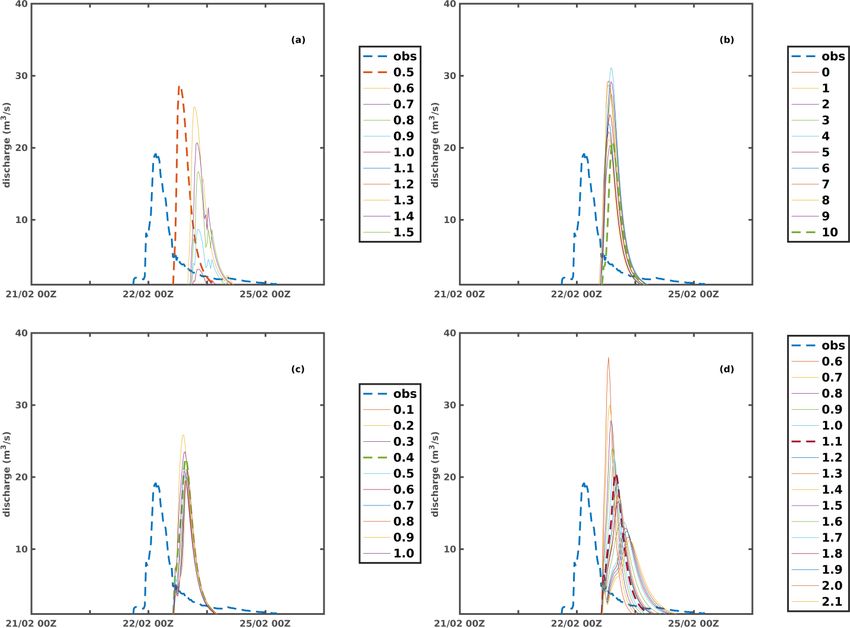
As Manning coefficient values are based on textbook val- The stepwise calibration method suggested above was imple-
ues for each stream order, Yucel et al. (2015) suggested mul- mented for the calibration of Rafina basin using event 2. Fig-
tiplying the default MannN coefficient parameter with a scal- ure 6 shows the temporal distribution of the precipitation as
ing factor. Figure 3d shows the temporal evolution of dis- observed at the station of N. Makri and simulated using WRF
charge for the possible values of MannN scaling factors rang- atmospheric-only simulations and WRF-Hydro coupled sim-
ing from 0.6 to 2.1 with increments of 0.1. Finally, the value ulations, while Fig. 7 shows the temporal evolution of the
of 1.1 was selected as optimum for the MannN parameter. observed and simulated discharges for the possible values of
each calibrated parameter. The observed and simulated pre-
3.1.2 Validation of the calibration of Sarantapotamos cipitation values (provided by WRF-Hydro) are highly corre-
basin lated (correlation coefficient: 0.83) while quantitatively they
also compare very well (Fig. 6). The choice of the optimum
After the calibration of WRF-Hydro over Sarantapotamos values for each parameter was based on the visual compari-
basin based on event 5, the four parameters defined above son of the simulated and observed discharge (Fig. 7) and sta-
were validated for events 4 and 6 of Sarantapotamos basin. tistical analysis (Table 5), as was explained for Sarantapota-
Figure 5b and d show the comparison of the temporal distri- mos basin.
bution of the observed and simulated discharges for events 4 In consistency to the calibration of Sarantapotamos, we
and 6, respectively. For event 4, the simulated temporal dis- firstly performed several simulations for possible REFKDT
tribution of the discharge shows similarity to the observed values between 1 and 5, and we also found that the appro-
one (Fig. 5b), as the time that the maximum discharge oc- priate range of the scaling factor is from 0.5 to 1.5. Thus, the
curred almost coincides while the two temporal distribu- additional simulations were performed within this range with
tions do not show similar maximum values of discharge increments of 0.1, and the value of 0.5 was selected as the
(the observed discharge is 12.8 m3 s−1 and the simulated is optimum value for the REFKDT parameter. As in the case
5.7 m3 s−1 ). of Sarantapotamos, the optimum value for REFKDT reaches
The correlation coefficient of the two temporal distribu- the lower calibration limit. For the needs of this study the
tions is 0.83. For event 6, the simulated and observed tempo- range of 0.5 to 1.5 was used as this same range was pro-
ral distributions of the discharges show similarity in the oc- posed in the literature by previous studies (Kerandi et al.,
currence time of the maximum discharge values, but the sim- 2018; Naabil et al., 2017; Givati et al., 2016; Yucel et al.,
ulated discharge underestimates the observed one throughout 2015). However lower values than the lower boundary of 0.5
the duration of the event (Fig. 5d), as the maximum value might provide improved results, and this issue deserves fur-
of the simulated discharge is 10.6 m3 s−1 while the observed ther investigation in the future. The simulations for RETDE-
one is 7 m3 s−1 . This is due to the underestimation of the PRTFAC were performed within the range from 0 to 10, with
simulated rainfall at the station of Vilia compared to the ob- increments of 1. As in the case of Sarantapotamos, the simu-
served one (Fig. 5c). The correlation coefficient between the lated discharge decreases with increasing values of RETDE-
simulated and observed discharges is 0.84. PRTFAC (Fig. 7b). After the comparison of the aforemen-
tioned statistical criteria, the selected optimum value for the
RETDEPRTFAC parameter was 6.
Regarding the parameters controlling the shape of the hy-
drograph, 10 (from 0.1 to 1.0 with increments of 0.1) and
1.6 (from 0.6 to 2.1 with increments of 0.1) simulations per-
https://doi.org/10.5194/nhess-21-1983-2021 Nat. Hazards Earth Syst. Sci., 21, 1983–2000, 20211992 E. Galanaki et al.: Implementation of WRF-Hydro at two drainage basins in the region of Attica
Figure 5. The temporal distribution of the observed and simulated (a) precipitation and (b) discharge for event 4S and the same variables
(c, d) for event 6.
discharge) have a correlation coefficient of 0.62, while the
Nash–Sutcliffe parameter is close to 0.5 (Table 5).
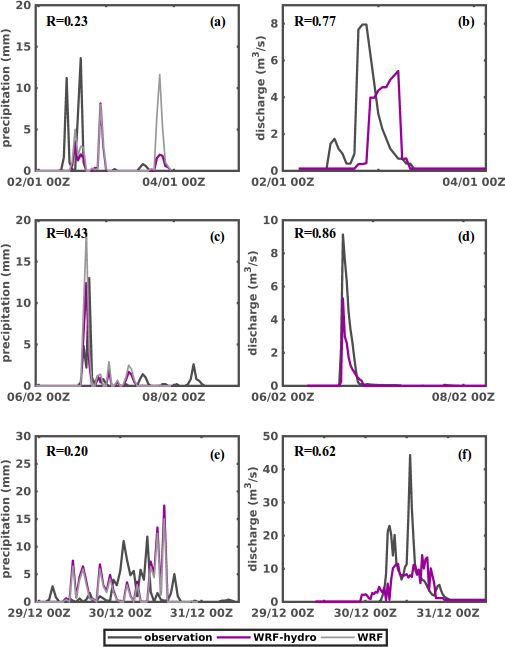
3.2.2 Validation of the calibration of Rafina basin
The validation of the calibration process of Rafina basin was
held by comparing the temporal distributions of simulated
and observed discharges of events 1, 3, and 4 (Fig. 8b, d
and e), using the optimum values of the calibration’s param-
eters. The correlation coefficients between the simulated and
observed discharges are 0.77, 0.86, and 0.62, respectively.
Therefore, it is obvious that WRF-Hydro is capable of fore-
casting the discharge after the calibration process. The sim-
ulated discharge is dependent on the simulated precipitation;
thus a possible underestimation of the simulated discharge is
Figure 6. The temporal evolution of the precipitation at the rain influenced by a possible underestimation of the precipitation.
gauge station at N. Makri for event 2. For instance, at event 1, the maximum simulated discharge is
5.0 m3 s−1 while the observed one is 8.0 m3 s−1 (Fig. 8b).
This is attributed to the underestimation of the total precip-
formed for the parameters related to the surface and channel itation, as the total simulated precipitation is 27.6 mm while
roughness. After the computation of correlation coefficient the observed is 37.0 mm. In addition, the lag between the ob-
and Nash–Sutcliffe parameter for each simulation, the op- served and simulated discharges is attributed to the lag of the
timum values of 0.3 and 1.2 for the OVROUGHRTAC and observed and simulated precipitation (Fig. 8a).
MannN parameters were selected. At the end of the calibra-
tion procedure, the two temporal distributions (observed and
Nat. Hazards Earth Syst. Sci., 21, 1983–2000, 2021 https://doi.org/10.5194/nhess-21-1983-2021E. Galanaki et al.: Implementation of WRF-Hydro at two drainage basins in the region of Attica 1993
Figure 7. The evolution of the discharge (observed and simulated) for event 2 for the (a) REFKDT, (b) RETDEPRTFAC,
(c) OVROUGHRTAC, and (d) MannN parameters.
3.3 Precipitation tribution of WRF-Hydro and WRF follows the same pattern
as is reflected in the same calculated correlation coefficients
shown in Table 6. WRF-Hydro performs better than the WRF
In this section the influence of the use of the coupled
in terms of quantitative precipitation forecasting, and this is
model (WRF-Hydro) on the precipitation forecast skill com-
reflected to the lower calculated root-mean-square errors and
pared to the atmosphere-only simulations performed with the
the lower mean absolute error (MAE), which have been com-
WRF model will be investigated. Namely, WRF-Hydro con-
puted based on the hourly values of precipitation (Table 6).
tributes to a better simulation of the soil moisture content,
It must be noted that for events 1 and 4 despite the fact that
due to the computation of the lateral redistribution and re-
the correlation coefficient is low, due to the lag between sim-
infiltration of the water (Gochis et al., 2013). The improved
ulated and observed discharge (Fig. 8b and f), the values of
simulation of the soil moisture affects the computation of the
total amount of the simulated and observed precipitation are
sensible and latent heat fluxes, which influence humidity and
similar. Also, the low correlation coefficient and the high
temperature in the lower atmosphere and consequently pre-
MAE at event 5 are attributed to the time lag between the
cipitation (Seneviratne et al., 2010). Therefore, the physical
simulated and observed temporal evolution of precipitation
process of the coupling of land–atmosphere is expected to
(Fig. 2).
improve the forecast skill of precipitation.
Figure 9 shows the difference between the total amount
Figures 2; 5a, c; 6; 8a, c, and f show the temporal distri-
of precipitation observed and the total amount of precipi-
bution of the precipitation observed and simulated by WRF
tation simulated by (a) WRF-Hydro and (b) WRF-only for
only and WRF-Hydro for each studied event observed in
each event. Therefore, values close to zero mean that the
Sarantapotamos and Rafina basins, for the gauge stations in
total amount of precipitation simulated is close to the ob-
Vilia and N. Makri, respectively. In all cases, the precipita-
served one. For each case, the difference between the total
tion reproduced by WRF-Hydro has differences compared
amount of observed and simulated precipitation by WRF-
to WRF (atmospheric-only) simulations. The temporal dis-
https://doi.org/10.5194/nhess-21-1983-2021 Nat. Hazards Earth Syst. Sci., 21, 1983–2000, 20211994 E. Galanaki et al.: Implementation of WRF-Hydro at two drainage basins in the region of Attica
Figure 8. The temporal distribution of the observed and simulated (a) precipitation and (b) discharge for event 1 and the same variables for
event 3 (c, d) and event 4R (e, f).
Hydro is smaller, pointing out that WRF-Hydro has the ten- 2013), which in turn influences the computation of the sen-
dency to improve the total amount of precipitation, consistent sible and latent heat fluxes. These fluxes are associated with
with the results provided by Givati et al. (2016) and Wang et humidity and temperature in the lower atmosphere and con-
al. (2020). sequently precipitation (Seneviratne et al., 2010). However,
Table 7 shows the basin average soil moisture (at the it should be noted that the effects of soil moisture on precip-
first level) and 6 h accumulated latent heat flux simulated itation fields are more evident and valid in long-term simu-
by the WRF-Hydro and WRF-only models, at the time be- lations when the land surface variables reach a steady state
fore the beginning of the examined storm events. As can be (Fersch et al., 2020; Senatore et al., 2015). Furthermore, the
seen the soil moisture differences between the models range soil moisture is strongly dependent to the sea–atmosphere in-
from 0.005 to 0.027 m3 m−3 , and accumulated latent heat teractions (Avolio et al., 2019; Senatore et al., 2015) and the
flux differences span from 4.1 to 41.8 W m−2 . These differ- synoptic-scale circulation.
ences simulated by the two models provide an indication that
the most accurate replication of the observed precipitation
provided by the WRF-Hydro model compared to the WRF- 4 Conclusions
only model is related to the physical process associated with
the coupling of land–atmosphere and hydrological routing in Despite flash flooding being one of the most costly weather-
the WRF-Hydro model. In particular, WRF-Hydro affects the related natural hazards in Greece (Papagiannaki et al., 2013),
soil moisture content, due to the computation of the lateral less effort has been made in the field of evaluating tools
redistribution and reinfiltration of the water (Gochis et al., to predict floods. The current paper addresses this issue by
presenting an integrated modeling approach for simulating
Nat. Hazards Earth Syst. Sci., 21, 1983–2000, 2021 https://doi.org/10.5194/nhess-21-1983-2021E. Galanaki et al.: Implementation of WRF-Hydro at two drainage basins in the region of Attica 1995
Table 6. Comparison of total amount of observed precipitation to WRF-Hydro and WRF-only simulated precipitation for each event for the
gauge stations in Vilia and N. Makri. RMSE, R, and MAE are calculated on hourly values of precipitation.
Total Root- Correlation Mean
precipitation mean- (R) absolute
square error
error (MAE)
(RMSE)
Event 1/E1 Rain gauge station in N. Makri 37.6 – – –
WRF-Hydro 27.6 0.14 0.23 0.78
WRF 51.6 0.19 0.23 1.06
Event 2/E2 Rain gauge station in N. Makri 123.8 – – –
WRF-Hydro 138.2 0.12 0.83 0.53
WRF 92.3 0.32 0.83 1.02
Event 3/E3 Rain gauge station in N. Makri 33.6 – – –
WRF-Hydro 30 0.025 0.43 0.49
WRF 45.1 0.24 0.43 0.65
Event 4/E4R (Rafina) Rain gauge station in N. Makri 86.8 – – –
WRF-Hydro 96.6 0.12 0.2 1.64
WRF 85.1 1.09 0.2 2.39
Event 4/E4S Rain gauge station in Vilia 104.6 – – –
(Sarantapotamos) WRF-Hydro 121.3 0.3 0.57 1.83
WRF 218.9 2.06 0.57 3.35
Event 5/E5 Rain gauge station in Vilia 77 – – –
WRF-Hydro 30.2 1.06 0.13 2012
WRF 22.1 1.2 0.13 2823
Event 6/E6 Rain gauge station in Vilia 85 – – –
WRF-Hydro 49 0.72 0.75 1.33
WRF 37.7 1.03 0.75 1.43
Figure 9. The difference between observed and simulated (WRF-Hydro and WRF) total amount of precipitation per event for gauge stations
of Vilia and N. Makri.
flood episodes in Attica, Greece, in medium-catchment-size itation forecasting. For that purpose, we first calibrated and
basins. The objective of this study was twofold: to investi- validated WRF-Hydro at two drainage basins (Sarantapota-
gate the ability of WRF-Hydro to simulate selected cases of mos basin and Rafina basin) in the area of Attica. Then,
flood occurrence in the area of Attica (Greece) and to study we investigated the relation between WRF-Hydro and WRF-
the influence of land–atmosphere interactions on the precip- only precipitation forecast skill. For this reason, we used
https://doi.org/10.5194/nhess-21-1983-2021 Nat. Hazards Earth Syst. Sci., 21, 1983–2000, 20211996 E. Galanaki et al.: Implementation of WRF-Hydro at two drainage basins in the region of Attica
Table 7. Comparison of the basin average soil moisture (at the first level) and 6 h accumulated latent heat flux simulated by the WRF-Hydro
and WRF-only models, at the time before the beginning of the events.
Basin Model Soil Accumulated
moisture latent heat
(m3 m−3 ) (W m−2 )
Event 1/E1 Rafina WRF-Hydro 0.2915 1.4
WRF 0.3034 −2.7
Event 2/E2 Rafina WRF-Hydro 0.2760 40.1
WRF 0.2660 39.3
Event 3/E3 Rafina WRF-Hydro 0.3427 388.1
WRF 0.3159 346.3
Event 4/E4R Rafina WRF-Hydro 0.2126 −29.3
WRF 0.2121 −29.1
Event 4/E4S Sarantapotamos WRF-Hydro 0.2248 235.2
WRF 0.2316 225.7
Event 5/E5 Sarantapotamos WRF-Hydro 0.2834 −9.4
WRF 0.2823 −10.7
Event 6/E6 Sarantapotamos WRF-Hydro 0.2792 20.3
WRF 0.2666 10.5
an enhanced version of WRF, the WRF-Hydro model (ver- tapotamos) and N. Makri (for the basin of Rafina). Thus,
sion 3.0), in a fully coupled mode, which is complemented we compared the simulated against observed precipitation in
with the land–atmosphere interaction schemes through the terms of both temporal distribution and total amount of pre-
coupling of hydrological and atmospheric models. The con- cipitation. We found that the temporal distribution of WRF-
figuration of WRF-Hydro was applied in a fine-resolution Hydro simulations has the same correlation coefficient, but
grid (666 m) where the surface and subsurface flow were it has lower root-mean-square errors than the simulation of
computed at a grid interval of 95 m. WRF only. Although it was shown that WRF-Hydro tends
Three flooding events at Sarantapotamos basin and four to slightly improve the total amount of forecasted precip-
flooding events at Rafina basin have been analyzed. The cali- itation, the overall results indicate that the components of
bration procedure was based on the manual stepwise method terrestrial hydrological models are contributing but not deci-
proposed by Yucel et al. (2015) defining the parameters RE- sive factors in the simulation of precipitation. A preliminary
FKDT, RETDEPRTFAC, OVROUGHRTAC, and MannN, analysis of key water budget components indicated that the
which influence the total water volume and the shape of the precipitation simulation improvement provided by the WRF-
hydrograph. Results showed that the correlation coefficient Hydro system may be related to the feedback of the terres-
between the observed and simulated discharges after the cali- trial hydrology parameterization on the modeled atmosphere.
bration was higher than 0.7 for all events. Thus, WRF-Hydro A follow up study could focus on the further investigation
is capable of forecasting observed discharge at the studied of impact of the more detailed representation of the inter-
regions, after implementation of a successful calibration pro- action between the land surface and hydrology processes to
cess. This outcome is important because WRF-Hydro is im- the surface energy budget under the WRF-Hydro coupling
plemented under calibration with ground-truth observations scheme by applying long-term simulations and validating the
for the first time in Greece, contributing in this way to the results against ground-based or satellite observation, consid-
better modeling and understanding of flooding mechanisms ering limitations arising from internal model variability (Bas-
in the study areas. Additionally, these calibrated parameters sett et al., 2020) and domain size (Fersch et al., 2020; Ar-
could be used from every scientific team that wants to study nault et al., 2018). Also, the incorporation of the SST update
past and future flooding events in the area of Attica, enhanc- into the model will be considered, as previous studies show
ing the research community’s understanding of the physical a positive feedback to simulations (Avolio et al., 2019; Sena-
effects of flash flooding. tore et al., 2015). Even though a more detailed analysis is re-
To investigate the influence of the use of WRF-Hydro on quired to explore the sensitivity of the simulated precipitation
the precipitation forecast skill, we compare the simulations to the coupling between hydrological and land–atmosphere
produced by WRF-Hydro and WRF-only models, configured processes, the current study demonstrates that the coupled
with the same microphysics schemes for all events. The re- WRF-Hydro model has the potential to enhance precipitation
sulting simulations were verified against observed precipita- forecast skill for operational flood predictions.
tion in two gauge stations: at Vilia (for the basin of Saran-
Nat. Hazards Earth Syst. Sci., 21, 1983–2000, 2021 https://doi.org/10.5194/nhess-21-1983-2021E. Galanaki et al.: Implementation of WRF-Hydro at two drainage basins in the region of Attica 1997
For an operational point of view, the application of a cou- by the Hydrological Observatory of Athens of the National Techni-
pled WRF-Hydro model to exploit its beneficial impact in cal University of Athens, kindly provided by Evangelos Baltas.
simulating precipitation is partially limited due to the ad-
ditional computational time needed for the execution of the
WRF-Hydro model. In particular, in our case, a 3 d coupled Financial support. This research was funded by the project Cyprus
WRF-Hydro forecast considering a prior 12 h spin-up under Flood Forecasting System – POST-DOC/0718/0040, which is co-
the investigated configuration requires ×1.35 time compared funded by the Republic of Cyprus and the European Regional
Development Fund (through the “DIDAKTOR” RESTART 2016–
to WRF-only implementation in 140 computing nodes. It
2020 Program for Research, Technological Development and Inno-
should be noted that the extra computational time depends on
vation).
the WRF-Hydro configuration and the computing resources
for which the model is applied.
It is in our prospects to further enhance the performance of Review statement. This paper was edited by Gregor C. Leckebusch
WRF-Hydro in the study areas and expand the applied mod- and reviewed by two anonymous referees.
eling approach in other drainage basins throughout Greece,
with the aim of building an operational flood forecasting sys-
tem based on coupled hydrological and atmospheric models.
Thus, this work is a preliminary effort in order to develop
References
a prototype flood forecasting system, based on the state-of-
the-art hydrometeorological modeling tool WRF-Hydro and Alves, M., Nadeau, D. F., Music, B., Anctil, F., and Parajuli, A.: On
establish efficient dissemination tools promoting flood risk the performance of the Canadian Land Surface Scheme driven by
awareness. A follow-up study could focus on evaluating the the ERA5 reanalysis over the Canadian boreal forest, J. Hydrom-
performance of the model initialized by GFS data during a eteorol., 21, 1383–1404, 2020.
pre-operational application covering a whole hydrological Arnault, J., Wagner, S., Rummler, T., Fersch, B., Bliefernicht, J.,
year. Such a study could enhance our knowledge about the Andresen, S., and Kunstmann, H.: Role of runoff-infiltration par-
added value of the WRF-Hydro coupled mode and shed light titioning and resolved overland flow on land-atmosphere feed-
on the performance of the model using GFS operational data. backs: a case-study with the WRF-Hydro coupled modeling
system for West Africa, J. Hydrometeorol., 17, 1489–1516,
The utmost goal is to provide citizens and stakeholders with
https://doi.org/10.1175/JHM-D-15-0089.1, 2016.
reliable information and warnings in order to enhance flood
Arnault, J., Rummler, T., Baur, F., Lerch, S., Wagner, S., Fersch,
risk awareness and protect lives and properties. B., Zhang, Z., Kerandi, N., Keil, C., and Kunstmann, H.: Precip-
itation Sensitivity to the Uncertainty of Terrestrial Water Flow
in WRF-Hydro: An Ensemble Analysis for Central Europe, J.
Data availability. Data from this research are not publicly avail- Hydrometeorol., 19, 1007–1025, https://doi.org/10.1175/JHM-
able. Interested researchers can contact the corresponding author of D-17-0042.1, 2018.
this article. Avolio, E., Cavalcanti, O., Furnari, L., Senatore, A., and Mendicino,
G.: Brief communication: Preliminary hydro-meteorological
analysis of the flash flood of 20 August 2018 in Raganello Gorge,
Author contributions. The study was conceptualized by all authors; southern Italy, Nat. Hazards Earth Syst. Sci., 19, 1619–1627,
EG carried out the simulations and wrote the original draft. KL, VK, https://doi.org/10.5194/nhess-19-1619-2019, 2019.
TG, and CG provided comments on the results and reviewed and Bassett, R., Young, P. J., Blair, G. S., Samreen, F., and Simm, W.: A
edited the manuscript. large ensemble approach to quantifying internal model variabil-
ity within the WRF numerical model, J. Geophys. Res.-Atmos.,
125, e2019JD031286, https://doi.org/10.1029/2019JD031286,
Competing interests. The authors declare that they have no conflict 2020.
of interest. Camera, C., Bruggeman, A., Zittis, G., Sofokleous, I., and Arnault,
J.: Simulation of extreme rainfall and streamflow events in small
Mediterranean watersheds with a one-way-coupled atmospheric–
Disclaimer. Publisher’s note: Copernicus Publications remains hydrologic modelling system, Nat. Hazards Earth Syst. Sci., 20,
neutral with regard to jurisdictional claims in published maps and 2791–2810, https://doi.org/10.5194/nhess-20-2791-2020, 2020.
institutional affiliations. Chen, F. and Dudhia, J.: Coupling an advanced land surface hy-
drology model with the Penn State-NCAR MM5 modeling sys-
tem, Part I: Model implementation and sensitivity, Mon. Weather
Rev., 129, 569–585, 2001.
Acknowledgements. The data for stage and discharge for Saran-
Crossett, C. C., Betts, A. K., Dupigny-Giroux, L.-A. L., and
tapotamos basin were provided by the hydrometric stations of the
Bomblies, A.: Evaluation of Daily Precipitation from
Deucalion project (http://deucalionproject.itia.ntua.gr, last access:
the ERA5 Global Reanalysis against GHCN Observa-
28 December 2019), while the data for Rafina basin were provided
tions in the Northeastern United States, Climate, 8, 148,
https://doi.org/10.3390/cli8120148, 2020.
https://doi.org/10.5194/nhess-21-1983-2021 Nat. Hazards Earth Syst. Sci., 21, 1983–2000, 2021You can also read