A comprehensive observation-based multiphase chemical model analysis of sulfur dioxide oxidations in both summer and winter
←
→
Page content transcription
If your browser does not render page correctly, please read the page content below
Atmos. Chem. Phys., 21, 13713–13727, 2021
https://doi.org/10.5194/acp-21-13713-2021
© Author(s) 2021. This work is distributed under
the Creative Commons Attribution 4.0 License.

A comprehensive observation-based multiphase chemical model
analysis of sulfur dioxide oxidations in both summer and winter
Huan Song, Keding Lu, Can Ye, Huabin Dong, Shule Li, Shiyi Chen, Zhijun Wu, Mei Zheng, Limin Zeng, Min Hu,
and Yuanhang Zhang
State Key Joint Laboratory or Environmental Simulation and Pollution Control, College of Environmental Sciences and
Engineering, Peking University, Beijing, China

Correspondence: Keding Lu (k.lu@pku.edu.cn)

Received: 5 May 2021 – Discussion started: 31 May 2021
Revised: 4 August 2021 – Accepted: 16 August 2021 – Published: 14 September 2021

Abstract. Sulfate is one of the main components of haze fine        tion of dissolved SO2 is more important than SO2 directly
particles, and its formation mechanism remains controver-           oxidized by gas-phase radicals (Atkinson et al., 2004; Barth
sial. A lack of detailed and comprehensive field data hin-          et al., 2002) because of the significantly reduced ultravio-
ders the accurate evaluation of relative roles of prevailing sul-   let (UV) radiation intensity due to the aerosol dimming ef-
fate formation pathways. Here, we analyzed the sulfate pro-         fect. Gas-phase reactions, especially those favoring multi-
duction rates using a state-of-the-art multiphase model con-        phase chemistry, cannot capture the high concentrations of
strained to the observed concentrations of transition metal,        sulfate aerosols during haze events. Moreover, rapid sulfate
nitrogen dioxide, ozone, hydrogen peroxide and other im-            production is observed during cloud-free conditions, indicat-
portant parameters in winter and summer in the North China          ing that aerosol multiphase oxidation may be important dur-
Plain. Our results showed that aqueous transition metal ion         ing haze periods (Moch et al., 2018). These effects cause a
(TMI)-catalyzed oxidation was the most important pathway            major gap between the measured sulfate concentrations un-
followed by the surface oxidation of Mn in both winter and          der weak UV radiation and the concentrations calculated us-
summer while the hydroxyl and Criegee radical oxidations            ing traditional atmospheric models.
contribute significantly in summer. In addition, we also mod-          Assessing the mechanism of multiphase secondary sul-
eled the published cases for the fog and cloud conditions. It is    fate formation during haze periods helps evaluate the effect
found that nitrogen dioxide oxidation is the dominant path-         of multiphase oxidation. While the gas-phase oxidation rate
way for the fog in a higher pH range while hydroperoxide            of SO2 and OH is well constrained, there are many uncer-
and ozone oxidations dominated for the cloud.                       tainties in the quantification of the relative contribution of
                                                                    each multiphase SO2 oxidation pathway during haze peri-
                                                                    ods. Multiphase oxidation pathways of dissolved SO2 (Sein-
                                                                    feld and Pandis, 2016; P. Liu et al., 2020; Zhu et al., 2020a;
1   Introduction                                                    Seigneur and Saxena, 1988; Li et al., 2020b) include oxida-
                                                                    tion by (1) hydrogen peroxide (H2 O2 ); (2) ozone (O3 ); (3) the
Secondary sulfate aerosols are an important component of            transition metal ion (TMI, i.e., Fe (III) and Mn (II))-catalyzed
fine particles in severe haze periods (Zheng et al., 2015; R.-      oxidation pathway (aqTMI); and (4) the Mn-catalyzed oxida-
J. Huang et al., 2014; Guo et al., 2014), which adversely af-       tion of SO2 on aerosol surface pathway (Mn-surface) (Wang
fect environmental quality and human health (Lippmann and           et al., 2021). Some studies (Cheng et al., 2016; Wang et al.,
Thurston, 1996; Fang et al., 2017; Shang et al., 2020). Tra-        2016; Xue et al., 2016; Li et al., 2018) have also suggested
ditional atmospheric models evaluate secondary sulfate for-         that nitrogen oxides may play a crucial role in the explosive
mation via the gas-phase oxidation of sulfur dioxide (SO2 )         growth of sulfate formation during severe haze days in Bei-
and a series of multiphase oxidation processes of dissolved         jing because of the high pH near a neutral system, by facil-
SO2 in cloud water. During haze events, multiphase oxida-

Published by Copernicus Publications on behalf of the European Geosciences Union.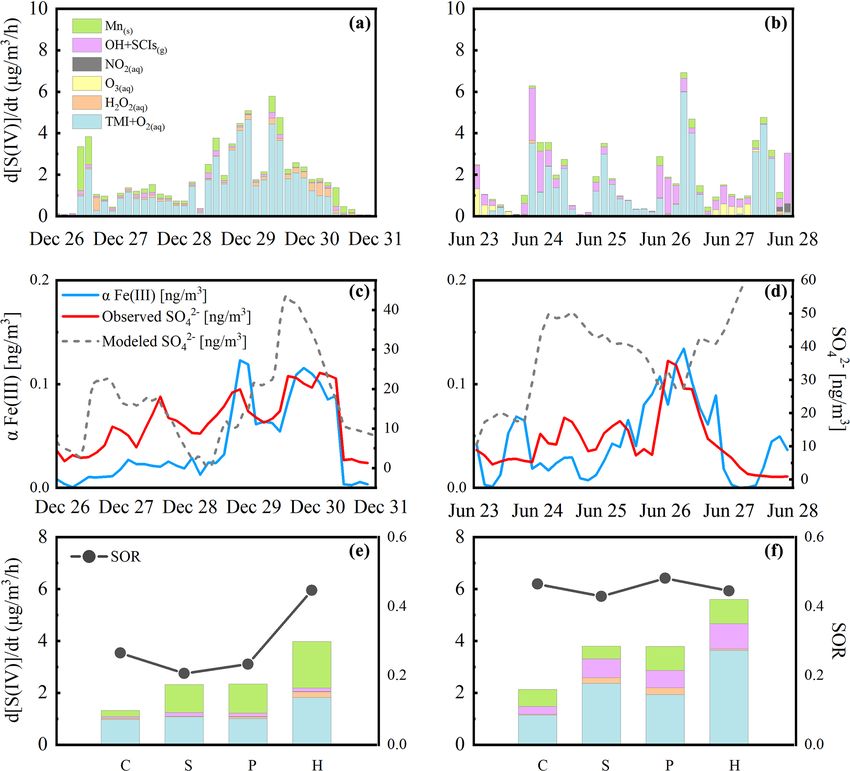
13714                              H. Song et al.: A comprehensive observation-based multiphase chemical model analysis

itating the catalysis of mineral dust (Liu et al., 2012; Zhao        ideality of the condensed particle phase and the solubility
et al., 2018) or the photolysis of nitrous acid (Zheng et al.,       of gas-phase reactants on the reactions enable comparisons
2020). However, the average pH during Beijing haze periods           with parameters previously obtained in model calculations.
is approximately 4.2 (Liu et al., 2017), and a high level of         In addition, episodes at different pollution levels in the win-
NH3 does not increase the aerosol pH sufficiently to yield           ter and summer campaigns were selected to evaluate the con-
NO2 -dominated sulfate formation (Guo et al., 2017). Other           tribution of prevailing sulfate formation pathways proposed
studies (Ye et al., 2018; T. Liu et al., 2020) have empha-           in previous studies. As a study evaluating the contribution of
sized the importance of H2 O2 oxidation to sulfate formation         different sulfate formation pathways during field campaign
due to the underestimation of H2 O2 concentrations during            observations, this work provides an improved understanding
haze episodes in previous studies or the influence of the high       of atmospheric sulfate formation at different pollution levels
ionic strength (Is ) of aerosol solutions on the H2 O2 oxida-        in the NCP.
tion rate, which implies that oxidant concentrations for SO2
oxidation constrained to the observed values from field mea-
surements are required. A previous study (Wang et al., 2020)         2     Methods
has shown that photosensitization is a new pathway for at-
mospheric sulfate formation and requires further verification.       2.1    Sampling location and experimental methods
According to several previous studies of the GEOS-Chem
model and including the measurements of oxygen isotopes              The data from the 2014 Wangdu (WD-14) and 2017 Peking
(117 O (SO2− 4 )) (He et al., 2018; Shao et al., 2019; Li et al.,    University (PKU-17) field campaigns, both conducted in
2020a; Yue et al., 2020), it has been shown that the aqTMI           summer, were used in our analysis. The WD field campaign
was important during some haze periods. Overall, the forma-          was carried out from June to July 2014 at a rural site in Hebei
tion mechanisms of the missing sulfate sources remain un-            (38.70◦ N, 115.15◦ E) characterized by severe photochemi-
clear and controversial.                                             cal smog pollution (Tan et al., 2017; Song et al., 2020). The
   Sulfate formation is a complex multiphase physicochemi-           2017 PKU campaign was performed from November to De-
cal reaction process in which parameters have multiple inter-        cember 2017 at the campus of Peking University (39.99◦ N,
relationships. Previous studies have mostly selected typical         116.31◦ E), which is in the city center of Beijing and is char-
conditions with fixed parameters for numerical calculations,         acterized by strong local anthropogenic emissions from two
ignoring the fact that sulfate formation is a complex dynamic        major roads (Ma et al., 2019).
process. A comprehensive and explicit evaluation of the sul-            Observations from both field campaigns include gas-phase
fate generation process requires real-time feedback and ex-          measurements of SO2 and O3 from commercial Thermo Sci-
plicit constraints of observational data. Therefore, it is crucial   entific monitors and NO2 detected after conversion through a
to apply constrained parameters from field campaigns in the          custom-built photolytic converter with a UV LED at 395 nm
calculations. Moreover, as proposed in previous studies (Liu         and aerosol number concentration and distribution from a
et al., 2020b; Cheng et al., 2016), due to the lower water con-      set of commercial particle instruments containing a scanning
tent in aerosol particles than in cloud water, the non-ideality      mobility nanoparticle sizer (SMPS) and aerodynamic parti-
effects of aerosol solutions should be carefully considered.         cle sizer (APS) to cover the size range of 3 nm to 10 µm. The
   In this study, we modeled the concentrations of the main          mass concentration of PM2.5 was measured by a commer-
reagents of sulfate formation reactions using a state-of-            cial ambient particulate monitor (TEOM). The in situ gas and
the-art Peking University Multiple-phAse Reaction Kinetic            aerosol compositions monitor (IGAC) (Young et al., 2016),
(PKU-MARK) model based on the data measured in two                   which can collect gases and particles simultaneously, was
field campaigns conducted in the winter and summer in                used to measure water-soluble ions online with a 1 h time
the North China Plain (NCP) where several particle pollu-            resolution. Both gas and aerosol samples were injected into
tion episodes happened. The non-ideality of aerosol solu-            10 mL glass syringes, which were connected to an ion chro-
tions was considered in the calculation of both gas solubility       matograph (IC) for analysis (30 min time resolution for each
and aqueous-phase reaction rates. Chemical regimes in the            sample). The concentrations of eight water-soluble inorganic
                                                                                                              2−
aerosol particle bulk phase were analyzed to understand the          ions (NH+       +    +    2+      2+             −
                                                                               4 , Na , K , Ca , Mg , SO4 , NO3 and Cl ) in
                                                                                                                                −

role of gas-phase radical precursors, particle TMIs, aerosol         fine particles were measured. Transition metal (Fe and Cu)
surface concentrations and the aerosol liquid water content          concentrations in PM2.5 were measured using an Xact 625
(ALWC) in the aqueous reactant levels and the sulfate for-           ambient metal monitor. With Xact, ambient air was intro-
mation rate. All particle concentrations reported are of fine        duced through a PM2.5 cyclone inlet at a constant flow rate
particulate matter with aerodynamic diameters of 2.5 µm or           of 16.7 L/min and collected on the reel-to-reel polytetraflu-
less (PM2.5 ).                                                       oroethylene filter. Then trace elements in ambient fine par-
   The overall goal of this work is to evaluate the contribution     ticles on the filter were automatically detected using the
of different secondary sulfate formation pathways under ac-          United States Environmental Protection Agency (US EPA)
tual field measurement conditions in the NCP. Effects of non-        standard method via x-ray fluorescence (XRF) analysis (Gao

Atmos. Chem. Phys., 21, 13713–13727, 2021                                            https://doi.org/10.5194/acp-21-13713-2021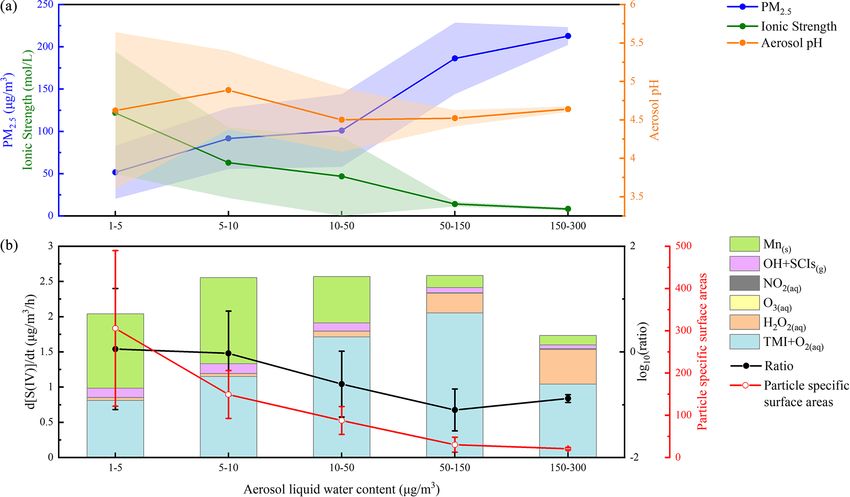
H. Song et al.: A comprehensive observation-based multiphase chemical model analysis                                        13715

et al., 2016; Zhang et al., 2019). Ambient temperature and          were replaced by the activity coefficient. The ionic strength
pressure data were measured using commercial meteorolog-            was estimated using the ISORROPIA II model assuming that
ical sensors; selected volatile organic compounds (VOCs)            the condensed phase is in a meta-stable state and there is a
were measured via off-line gas chromatography–mass spec-            complete external mixing state.
trometry (GC-MS) in tower measurements using sampling                  In order to consider the influence of the particle diameter
canisters and via online GC-MS in the surface campaign.             on aqueous SO2 concentrations, which is key to calculating
The OH and HO2 concentrations were measured via laser-              sulfate formation, we used an 11-bin actual particle diameter
induced fluorescence (LIF) with a time resolution of 30 s as        distribution rather than one even distribution used in previ-
described in a previous study (Ma et al., 2019). The concen-        ous studies (Cheng et al., 2016). The distribution of parti-
trations of gas-phase peroxides were measured using high-           cle number concentration and water content is illustrated in
performance liquid chromatography (HPLC; Agilent 1200,              Fig. S2. We also considered the distribution of ALWC in dif-
USA) with a time resolution of 21 min.                              ferent particle diameter bins based on the κ–Köhler theory
                                                                    (Petters and Kreidenweis, 2007) using observed kappa values
2.2   Brief overview of the PKU-MARK model                          from a high-humidity tandem differential mobility analyzer
                                                                    (HH-TDMA) and a twin differential mobility particle sizer
The Multiple-phAse Reaction Kinetic (PKU-MARK) model                (TDMPS)–APS (Bian et al., 2014). Calculated ALWC val-
was first developed to calculate the heterogeneous reac-            ues were strongly correlated with the ISORROPIA II results
tion rate of reactive gas molecules (Song et al., 2020). The        (Fig. S3).
units of aqueous reagents are converted to molecules/cm3 in            To combine both gas-phase molecular diffusion and
the model by a factor kmt , which combines both gas-phase           liquid-phase interface mass transport processes, the approach
molecular diffusion and liquid-phase interface mass transport       adopted in this study uses one variable called kmt (Schwartz,
processes (Schwartz, 1984, 1986) and is used in the calcula-        1984, 1986), which is used in multiphase reactions in many
tion for gas–liquid multiphase reactions in many modeling           modeling studies (Lelieveld and Crutzen, 1991; Chameides
studies (Lelieveld and Crutzen, 1991; Chameides and Stel-           and Stelson, 1992b; Sander, 1999; Hanson et al., 1994). The
son, 1992a; Sander, 1999; Hanson et al., 1994; Song et al.,         definition of kmt is given in Eq. (3):
2020). In this study, the PKU-MARK model was further de-
veloped with the correction of ionic strength for all ions and                               !−1
                                                                             Rd2   4Rd
reactants and applied to a size-segregated system to inves-         kmt =        +                 .                           (2)
tigate the influence of aerosol particle size distribution and              3Dg 3υHO2 α
ALWC distribution. Eleven bins of aerosol particle diameter
                                                                    The rate of gas-phase reactions (X) diffusing and dissolv-
and corresponding ALWC values were applied in the model.
                                                                    ing to the condensed phase can be calculated in the frame-
With the input of 1 h averaged parameters observed in the
                                                                    work of aqueous-phase reactions as kmt_X × ALWC, where
field campaign, the PKU-MARK model produced the steady-
                                                                    X is the reactant molecule (please see Table S8 for more
state concentrations of aqueous reactants including reactive
                                                                    details). Moreover, the conversion rate of aqueous-phase re-
oxygen species (H2 O2 , O3 , OH, HO2 , O− 2 ), Fe (III), Mn (II),                                                           k
                                                                    actions to gas-phase reactions can be calculated as H ccmt_X
                                                                                                                              ×RT .
SO2(aq) and NO2(aq) . Considering the mutual influence of
various factors in the reaction system can effectively prevent      The unit of kmt is inverse seconds (s−1 ), as kmt contains the
bias caused by arbitrarily fixing a certain value as was often      conversion from inverse cubic meters (m−3 ) of air of the gas-
carried out in previous studies.                                    phase molecule concentrations to inverse cubic meters (m−3 )
                                                                    of the aqueous-phase molecule concentrations. Particle di-
2.3   Calculation of aerosol pH, aerosol liquid water and           ameter can influence the mass transport rate of SO2 and its
      ionic strength                                                aqueous concentration. Based on the model results of Xue
                                                                    et al. (2016), diameter had an impact on sulfate formation
ALWC and aerosol pH were calculated using the ISOR-                 rates: for larger particles (radius > 1 µm), kmt is determined
ROPIA II model and measured concentrations of inorganic             by gas-phase diffusion; for smaller particles (radius < 1 µm),
ions in particles. ISORROPIA II is a thermodynamic equilib-         kmt is determined by the accommodation process. The PKU-
rium model that predicts the physical state and composition         MARK model can simultaneously simulate two-phase (gas
of atmospheric inorganic aerosols. Its ability to predict pH        and liquid) reaction systems in the same framework.
has been demonstrated in detail in previous studies (Guo et
al., 2015; Xu et al., 2015). Ionic strength was calculated via      2.4   Model evaluation
Eq. (2) (Ross and Noone, 1991):
                                                                    Concentrations of sulfate were calculated by integrating an
      1 X
Is = ·       mi · zi2 ,                                    (1)      extension of the Eulerian box model described in a previous
      2                                                             study (Seinfeld and Pandis, 2016). Sulfate concentrations are
where mi is the molality of an ion (mol/L) and zi is the cor-       related to dry deposition, transport, dilution as the boundary
responding charge. In the PKU-MARK model, reaction rates            layer height (BLH) expands, emissions and net production.

https://doi.org/10.5194/acp-21-13713-2021                                         Atmos. Chem. Phys., 21, 13713–13727, 2021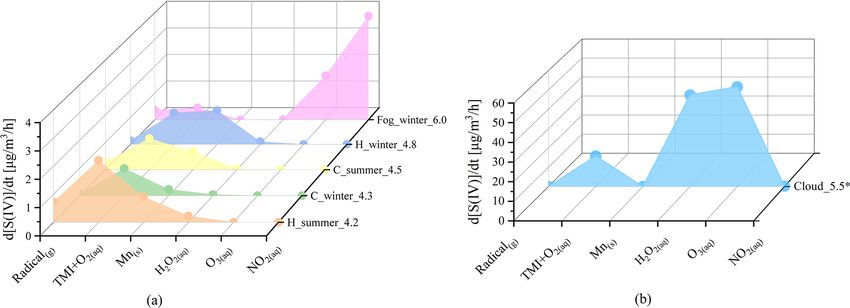
13716                            H. Song et al.: A comprehensive observation-based multiphase chemical model analysis

Due to the higher and more dramatically diurnally changing       enhancement effects on the sulfate formation. We also picked
BLH in summer (Lou et al., 2019) and the lack of relevant        four haze periods in the PKU-17 observation; the time se-
data in the WD-14 field campaign, we could not achieve the       ries of these key parameters are provided in the Supplement
modeled results of sulfate concentrations in summer haze pe-     Fig. S4.
riods. Direct emissions and transport of sulfate were not con-      Aerosol pH values were calculated using the ISOR-
sidered in the calculation because secondary sulfate is the      ROPIA II model. The calculated particle pH values as shown
predominant source in winter haze periods. Dilution was not      in Table 1 are in good agreement with the values reported
considered either because the atmosphere is relatively ho-       in other studies (Guo et al., 2017; Weber et al., 2016). The
mogeneous during winter haze episodes. Since haze events         lower pH in the range of 4.0–5.5 is beneficial to sulfate for-
are normally accompanied by a low boundary layer height          mation via the aqTMI. Aerosol liquid water is another key
(Ht ), Ht was set at 300 m in the nighttime and 450 m at noon    component: higher loading of aerosol liquid water is more
(Xue et al., 2016). At other times, Ht was estimated using       conducive to the occurrence of multiphase reactions. The
a polynomial (n = 2) regression as recommended in a pre-         ALWC in the PKU-17 and WD-14 campaigns was calculated
vious study (Xue et al., 2016). The diurnal trends of sulfate    via the ISORROPIA II model with input concentrations of
concentrations of the winter haze period and in summer us-       aerosol inorganic components (see Sect. 2.3). Aerosol liquid
ing the deposition velocity of 1.5 and 2 cm/s, respectively,     water did not freeze at winter temperatures below 273 K in
are shown in Fig. 1c and d. Model results had the same trend     the PKU field campaign because of the salt-induced freez-
as the observed values and could explain the missing source      ing point depression (Koop et al., 2000). Wind speeds during
of sulfate aerosols to some extent in winter with high uncer-    these haze events were persistently low (0.3–1.5 m/s), indi-
tainties in summer.                                              cating the minor contribution of regional transport to sulfate
                                                                 production.
                                                                    The aqueous TMI concentration level is crucial in the eval-
3     Results                                                    uation of secondary sulfate formation in real atmospheric
                                                                 conditions. Atmospheric anthropogenic sources of transition
3.1    Overview of the field observations                        metals such as iron (Fe) are crust related, and the peak con-
                                                                 centration of Fe in Beijing is correlated to vehicle driv-
Table 1 shows the key meteorological parameters, trace gases     ing in traffic rush hours. Copper (Cu) and manganese (Mn)
concentrations, calculated ALWC, ionic strength, pH and          are mainly from non-exhaust emissions of vehicles, fos-
sulfate formation rates under different pollution conditions     sil fuel combustion or metallurgy (Alexander et al., 2009;
in the PKU-17 and WD-14 comprehensive field campaigns.           Duan et al., 2012; Zhao et al., 2021). Concentrations of
The sampling location and experimental methods used in           transition metals are highly variable, ranging from < 0.1 to
these two campaigns are summarized in the Methods sec-           > 1000 ng/m3 globally (Alexander et al., 2009). Fe solubil-
tion. The pollution degree is classified according to the mass   ity in atmospheric aerosols has been reported to range from
concentration of PM2.5 . The clean condition means PM2.5         0.1 % to 80 % (Ito et al., 2019; Hsu et al., 2010; Heal et al.,
smaller than 35 µg/m3 ; the slightly polluted condition is       2005; Shi et al., 2012; Mahowald et al., 2005), and elevated
35–75 µg/m3 ; the polluted condition is 75–150 µg/m3 ; and       levels of Fe solubility have been observed in aerosols domi-
highly polluted is larger than 150 µg/m3 . Sulfate formation     nated by combustion sources. The average fractional Fe sol-
rates were modeled by the Multiple-phAse Reaction Ki-            ubility in areas away from dust source regions is typically
netic (PKU-MARK) model (mentioned in Methods) with               between 5 % and 25 % (Baker and Jickells, 2006; Baker et
constrained parameters. The effects of aerosol non-ideality      al., 2006; Hsu et al., 2010). A recent study reported the aver-
were considered in the size-segregated model. Data points        age Fe solubility as 2.7 %–5.0 % in Chinese cities, and more
with relatively humidity (RH) smaller than 20 % and ALWC         than 65 % of nano-sized Fe-containing particles were inter-
smaller than 1 µg/m3 were abandoned to improve the accu-         nally mixed with sulfates and nitrates (Zhu et al., 2020b). The
racy of the results.                                             solubility of Mn tends to be higher than that of Fe (Baker
   Transition metal concentrations including those of Fe and     et al., 2006), which is 22 %–57 % in urban aerosol particles
Mn increased with PM mass (as shown in Fig. 1). Photo-           (X. Huang et al., 2014). In this study, we chose the solubility
chemical oxidants including H2 O2 and O3 exhibited a de-         of total Fe as 5 % and total Mn solubility as 50 % assuming
creasing trend with the increase in PM mass because of the       that aerosol particles are internally mixed. In Beijing, high
significantly reduced solar ultraviolet (UV) radiation inten-    concentrations of Fe, Cu and Mn were observed (Table S9).
sity due to the aerosol dimming effect. Some studies have        Concentrations of transition metals are strongly correlated
reported high H2 O2 concentrations during haze episodes (Ye      during these haze periods; thus, we propose a fixed ratio of
et al., 2018), whereas in the PKU-17 field campaign, the av-     Fe/Mn to account for the lack of Mn data in the PKU-17 and
erage concentration of H2 O2 was only 20.9 ± 22.8 pptV in        WD-14 field campaigns (Sect. S2).
highly polluted conditions. Higher sulfate concentration was        Aerosol trace metal speciation and water solubility are af-
observed in the high range of RH and ALWC, indicating their      fected by factors such as photochemistry, aerosol pH and

Atmos. Chem. Phys., 21, 13713–13727, 2021                                        https://doi.org/10.5194/acp-21-13713-2021
H. Song et al.: A comprehensive observation-based multiphase chemical model analysis 13717
Table 1. Averaged results of observed meteorological parameters: trace gas concentrations; transition metal concentrations such as those of
Fe, Cu and Mn; calculated ALWC; ionic strength; pH; and sulfate formation rates in different pollution conditions in two field campaigns
(±1σ ).
Parameters Clean Slightly polluted Polluted Highly polluted
Winter
RH (%) 25.0 ± 8.3 37.1 ± 11.5 44.8 ± 11.9 63.6 ± 19.5
Temperature (K) 273.0 ± 4.6 274.1 ± 3.3 273.6 ± 2.6 273.8 ± 2.3
SO2 (ppbV) 2.4 ± 1.4 5.8 ± 2.0 6.5 ± 2.6 5.5 ± 3.0
NO2 (ppbV) 21.1 ± 10.4 37.6 ± 6.3 44.1 ± 6.1 57.6 ± 8.7
OH (molec./cm3 ) (4.67 ± 3.73) × 105 (5.02 ± 5.22) × 105 (4.42 ± 2.78) × 105 (4.36 ± 3.06) × 105
H2 O2 (pptV) 29.8 ± 20.8 23.5 ± 27.2 19.5 ± 39.6 20.9 ± 22.8
O3 (ppbV) 14.8 ± 11.9 3.2 ± 5.7 2.1 ± 2.7 1.1 ± 1.2
SO2−
4 (µg/m )
3 3.5 ± 1.5 6.4 ± 3.5 8.3 ± 4.2 16.6 ± 6.6
Fe (ng/m3 ) 348.4 ± 263.0 564.2 ± 188.2 725.5 ± 258.6 1300.6 ± 289.5
Cu (ng/m3 ) 7.0 ± 5.0 13.8 ± 4.2 18.7 ± 6.0 29.3 ± 6.6
Mn (ng/m3 ) 12.4 ± 9.4 20.1 ± 6.7 25.9 ± 9.2 46.5 ± 10.3
ALWC (µg/m3 ) 3.1 ± 2.6 3.8 ± 4.4 11.9 ± 15.6 82.4 ± 67.3
Surface area (µm2 /cm3 ) 263.2 ± 171.5 714.3 ± 242.2 1253.3 ± 448.9 2628.6 ± 1164.4
PM2.5 (µg/m3 ) 18.3 ± 10.1 52.0 ± 10.0 101.7 ± 18.2 190.0 ± 30.0
pH 4.43 ± 1.12 4.52 ± 0.76 4.93 ± 0.57 4.77 ± 0.39
Ionic strength (M) 170.34 ± 88.32 89.32 ± 55.19 61.59 ± 38.7 36.27 ± 36.93
d[S(VI)]/dt (µg/m3 /h) 1.3 ± 1.88 2.25 ± 2.15 2.35 ± 2.19 3.98 ± 2.75
Summer
RH (%) 69.5 ± 17.9 64.4 ± 18.4 66.4 ± 13.0 65.6 ± 7.7
Temperature (K) 296.5 ± 3.6 298.5 ± 4.4 299.1 ± 2.9 298.9 ± 3.1
SO2 (ppbV) 2.4 ± 2.0 4.6 ± 4.4 5.6 ± 5.0 7.9 ± 4.0
NO2 (ppbV) 8.7 ± 4.9 9.6 ± 5.6 9.0 ± 5.5 12.3 ± 6.1
OH (molec./cm3 ) (2.38 ± 2.44) × 105 (3.27 ± 3.21) × 105 (2.77 ± 2.26) × 105 (3.50 ± 3.38) × 105
H2 O2 (pptV) 466.2 ± 571.6 355.5 ± 488.0 596.1 ± 777.0 173.6 ± 348.6
O3 (ppbV) 46.0 ± 30.3 50.9 ± 30.6 53.0 ± 26.6 48.5 ± 28.5
SO4−
2 (µg/m )
3 7.2 ± 2.6 11.0 ± 4.9 17.8 ± 6.0 24.4 ± 6.0
Fe (ng/m3 ) 521.6 ± 286.6 469.3 ± 151.7 535.2 ± 177.0 730.9 ± 156.6
Cu (ng/m3 ) 26.6 ± 18.8 37.7 ± 31.8 33.8 ± 26.0 47.1 ± 36.3
Mn (ng/m3 ) 18.6 ± 10.2 16.8 ± 5.4 19.1 ± 6.3 26.1 ± 5.6
ALWC (µg/m3 ) 31.8 ± 30.9 35.7 ± 32.8 48.6 ± 31.4 58.8 ± 14.4
Surface area (µm2 /cm3 ) 767.8 ± 265.6 925.0 ± 213.9 1389.0 ± 312.6 1711.1 ± 729.6
PM2.5 (µg/m3 ) 20.1 ± 10.2 54.9 ± 11.7 104.8 ± 20.5 194.6 ± 32.9
pH 4.48 ± 0.48 4.19 ± 0.66 4.17 ± 0.48 4.33 ± 0.44
Ionic strength (M) 20.04 ± 17.53 25.44 ± 20.83 24.27 ± 14.06 24.2 ± 9.19
d[S(VI)]/dt (µg/m3 /h) 2.13 ± 2.03 3.81 ± 4.22 3.79 ± 5.66 5.6 ± 4.45
The concentration of Mn was estimated based on the ratio of Fe/Mn observed in urban Beijing in the literature (summarized in Table S9). All mentioned
aerosol data have particle matter diameters smaller than 2.5 µm, and PM2.5 refers to the dry mass concentration of fine particulate matters.
aerosol particle size (Baker and Jickells, 2006; Oakes et al., with Fe and form Fe-oxalate complexes, which have higher
2010). Soluble iron in aerosol water exists as Fe (II) and Fe photochemical activity than Fe hydroxide. All these mecha-
(III), with a series of redox recycling between the two species nisms are included in the PKU-MARK model. Diurnal trends
and other ions. Partitioning between Fe (II) and Fe (III) varies of sulfate formation were observed during haze periods, in-
diurnally with the highest fraction of Fe (II) found during dicating the diurnal distribution of different states of iron.
the day because of the photochemical reactions reducing Fe Redox cycling of other TMIs such as Cu and Mn is also con-
(III) to Fe (II). Photolysis reactions of iron hydroxides and sidered in the PKU-MARK model. The averaged percentage
organic complexes were documented as the most important of soluble Fe (III) and Mn (II) was 0.79 % and 19.83 % in
source of Fe (II) in cloud and fog water. Oxalic acid and its polluted winter conditions and 2.57 % and 52.15 % in pol-
deprotonated form, oxalate, have strong coordination ability luted summer conditions. The main reason for the difference
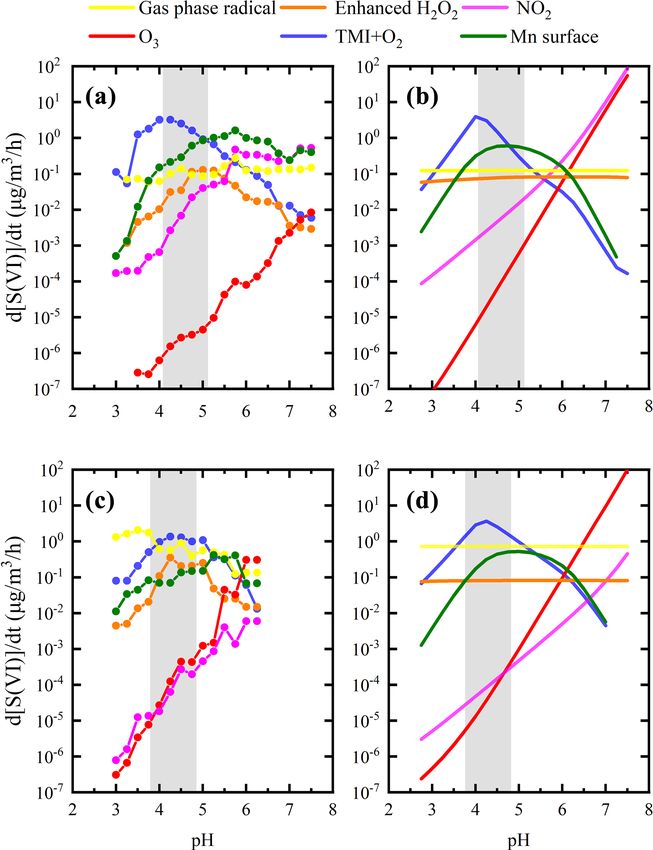
https://doi.org/10.5194/acp-21-13713-2021 Atmos. Chem. Phys., 21, 13713–13727, 202113718 H. Song et al.: A comprehensive observation-based multiphase chemical model analysis Figure 1. The 3 h average sulfate formation rates during haze periods in winter and summer (a, b). Corresponding effective Fe (III) con- centrations and sulfate concentrations (c, d). Sulfate formation rates (the histogram) and the sulfate oxidation ratio (SOR; dotted lines) at different pollution levels in two field campaigns (e, f). The contributions to sulfate formation from each multiphase oxidant pathway includ- ing Mn-surface oxidant (green), gas-phase OH radical and stabilized Criegee intermediate (SCI) oxidant (pink), aqueous-phase NO2 (grey), O3 (yellow), H2 O2 (orange), and the aqTMI (blue) are colored in the figure. Obvious particle growth and removal are observed in winter (26 to 31 December 2017), and diurnal variation patterns of sulfate concentration are observed in summer (23 to 28 June 2014). Diurnal trends of the modeled winter period’s sulfate concentration (dashed grey line) using deposition velocity at 1.5 cm/s in winter and 2 cm/s in summer are illustrated in panels (c) and (d). The dotted lines in the (e) winter and (f) summer indicate the SOR with pollution levels across the whole of each campaign and the capitalized letters C, S, P and H are abbreviations for “clean”, “slightly polluted”, “polluted” and “highly polluted”, respectively. between winter and summer metal solubility is that summer dominance of the aqTMI can be a widespread phenomenon, aerosols have higher water content and lower ionic strength, as recommended in previous studies (He et al., 2018; Shao et which is conducive to the dissolution of Fe and Mn. The sol- al., 2019; Li et al., 2020a; Yue et al., 2020). ubility range is in good agreement with the values reported in previous observations (Ito et al., 2019; Hsu et al., 2010). 3.2 Analysis of sulfate formation rate in different The influence of aerosol ionic strength on aqTMI reaction pollution conditions rates was considered carefully in the study. Higher ALWC is typically accompanied by lower ionic strength, which in- Figure 1a and b display the 3 h averaged sulfate formation creases the activity of TMIs. The relationship (T. Liu et al., rates in the PKU-17 and WD-14 during haze periods. Contri- 2020) between the rate coefficients of the TMI pathway and butions of the gas-phase radical oxidants were much higher ionic strength is displayed in Fig. S1. The sulfate formation during summertime. To fully explain the relative contribu- rate decreased by 424.82 times when ionic strength was 45 M tions to sulfate formation from different pathways, the stabi- compared to the dilute solution with an ionic strength of 0 M. lized Criegee intermediate (SCI) oxidant was also considered Despite considering the effect of the activity coefficient on in the calculations. Based on the previous report (Sarwar et the reaction rate of the aqTMI, the contribution of the aqTMI al., 2013), the inclusion of the SCI oxidation pathway fur- was still dominant during haze periods, indicating that the ther enhances sulfate production. We modified the Regional Atmos. Chem. Phys., 21, 13713–13727, 2021 https://doi.org/10.5194/acp-21-13713-2021
H. Song et al.: A comprehensive observation-based multiphase chemical model analysis                                      13719

Atmospheric Chemistry Mechanism (RACM2) (Goliff et al.,           about 0.11 ± 0.15 µg/m3 /h. Higher gas-phase H2 O2 concen-
2013; Goliff and Stockwell, 2008) to represent three explicit     tration may further increase the contribution of this path-
SCIs and their subsequent reactions (Welz et al., 2012) with      way to sulfate formation. Based on a recent report (Ye et al.,
SO2 , NO2 , aldehydes, ketones, water monomers and water          2018), higher gas-phase H2 O2 concentrations were observed
dimmers and calculated the contribution of this pathway in        in the NCP during different haze events, including severe
two field campaigns.                                              haze episodes in suburban areas. At 0.1 ppbV H2 O2 (about
   The contribution of the aqTMI increased rapidly with the       5 times higher than the observed H2 O2 concentration), the
aggravated pollution. High concentrations of transition met-      calculated sulfate formation rate was 0.52 ± 0.76 µg/m3 /h in
als observed in Beijing facilitated the dissolution of Fe, Cu     haze periods with great uncertainty and still lower than the
and Mn. The relationship of ionic strength and the aqTMI          contribution of the TMI pathway (1.17 ± 1.48 µg/m3 /h).
rate constant is illustrated in Fig. S1 and Table S2 (T. Liu         Due to the potential interaction between various factors in
et al., 2020). αFe (III) is defined as the product of the         the atmosphere, fixing certain parameters and changing only
Fe (III) activity coefficient, concentration, molecular weight    the pH to obtain the sulfate production rate may cause errors.
(56) and aerosol liquid water content. Compared to the to-        With the development of haze, concentrations of O3 and OH
tal Fe concentration, it is more effective to evaluate the im-    radicals decrease due to reduced UV radiation caused by the
pact of αFe (III) on sulfate formation. The relationship be-      aerosol dimming effect. Despite its minor contribution to sul-
tween αFe (III) and the sulfate oxidation ratio (SOR; ≡           fate production in winter, the increase in the ozone oxidation
n(SO2 )/n(SO2 +SO2−   4 ), defined as the ratio of the molar      rate with pH was slower under actual conditions. Contribu-
concentration of SO2 to the sum of SO2 and SO2−  4 molar con-
                                                                  tions of gas-phase radicals also showed a weak downward
centrations) in the PKU-17 winter field campaign is shown in      trend in the summer campaign (Fig. 2c). The bias between
Fig. S5. Because of the inhibition of the effects of high ionic   calculated and observed values indicated a dynamic balance
strength on the rate constant of the aqTMI, a high volume of      of atmospheric oxidation in the gas phase and aerosol phase.
aerosol water during the haze event increased the TMI ac-         If we arbitrarily use the average values during haze periods
tivity coefficient, benefiting sulfate formation. Obvious cor-    and only change the pH of the aerosols as in previous stud-
relations between αFe (III) and sulfate concentration shown       ies, the obtained sulfate production rate will deviate from the
in Fig. 1c and d were observed in the haze periods in both        observed values. Actual ambient sulfate formation rates cal-
summer (R 2 = 0.63) and winter (R 2 = 0.71), and the cor-         culated using the measured values in polluted periods in two
relation is consistent with the important contributions from      field campaigns are illustrated in Fig. 2a and c. Average val-
the aqTMI to the sulfate formation. Affected by the higher        ues except for pH during the haze periods were used to calcu-
boundary layer height and higher gas-phase radical concen-        late the sulfate formation rates as shown in Fig. 2b and d. The
tration in summer, the correlation between the SOR and PM         peak of the H2 O2 line in the figure is caused by the change
mass in summer is not as significant as that in winter. In        in the water content and ionic strength. In the pH range of
summer, as illustrated in Fig. S6, there was still an obvious     4.0–6.0, the calculated ALWC was in the highest range, in-
positive dependence between the SOR and RH and ALWC,              creasing the contribution of H2 O2 proportionally as calcu-
whereas a negative correlation was found between the SOR          lated using Eq. (1).
and odd oxygen ([Ox]≡[O3 ]+[NO2 ]). As shown in Fig. 1e              Aerosol water content is another key factor that influences
and f, the sulfate formation through gaseous reaction was         the contribution of different pathways to sulfate formation.
more important in summer than in winter, mainly provided          In the calculation, we changed the unit of the sulfate forma-
by gas-phase radicals (OH and SCIs). In the WD-14 field           tion rate from µg/m3 of air to M/s of water, and the sulfate
campaign, heterogeneous aqTMIs were still dominant in the         formation rate can be calculated via the following equation
secondary sulfate formation.                                      with the modeled dS(VI)
                                                                                        dt  (M/s):

3.3   Dependence of the secondary sulfate formation               dS (VI)
                                                                            µg/m3 /h = 0.01 × 3600(s/h) · 96 g/mol
      rates on aerosol pH and water content                         dt
                                                                      dS (VI)         ALWC
                                                                    ·         (M/s) ·        ,                               (3)
Aerosol pH and ALWC were calculated using the ISOR-                     dt            ρwater
ROPIA II model (Sect. 2.3). Because of the high sensitivity
of sulfate formation to pH, the lower range of aerosol pH         where ALWC is in units of µg/m3 and ρwater is the water
during these two campaigns made the aqTMI the most im-            density in kg/L. At high ionic strength, this expression is
portant one. The effects of high aerosol ionic strength on the    more accurate than the equivalent expression with the unit
dissolution equilibrium and reaction rates were considered        of M/s. The equilibrium amount of H2 O2 , O3 and NO2 in
in calculations (T. Liu et al., 2020) (Tables S2–S4). Due to      units of µg/m3 of air is controlled by the amount of ALWC;
the low H2 O2 concentration (∼ 0.023 ppbV) and low ALWC           i.e., there is equilibrium between gas and particle water for
observed in the PKU-17 field campaign, the average con-           these oxidants formed in the gas phase. And the total quantity
tribution of H2 O2 in haze periods (PM2.5 > 75 µg/m3 ) was        of metal elements, Fe, Cu or Mn is not dependent on aerosol

https://doi.org/10.5194/acp-21-13713-2021                                       Atmos. Chem. Phys., 21, 13713–13727, 2021
13720 H. Song et al.: A comprehensive observation-based multiphase chemical model analysis
ship between ALWC and sulfate formation pathways except
the aqTMI. One reason for the lower sulfate formation rate
observed in PKU-17 (1–3 µg/m3 /h) is that the ALWC values
were lower than those assumed in previous studies (ALWC =
300 µg/m3 /h). This deviation from the ALWC significantly
reduces the contribution of several other pathways but not the
contribution of transition metals to sulfate formation.
Due to the obvious heterogeneous reaction’s contribu-
tion to sulfate formation in winter, we evaluated the influ-
ence of ALWC on sulfate formation pathways in winter.
TMI-relevant pathways including the aqTMI and Mn-surface
pathway were dominant in all ranges of ALWC as illus-
trated in Fig. 3. In the PKU-17 field campaign, with the in-
creasing of ALWC from 1 to 150 µg/m3 , the ratio of Mn-
surface / the aqTMI continuously decreased mainly because
of the decreasing particle-specific surface areas. Mn-surface
contributed most in the lower ALWC range where particle-
specific surface area was high and provided more reaction
positions. Aqueous transition metal ion molar concentration
decreased with the aerosol hygroscopic growth, indicating a
“dilution effect” as shown in Fig. S7 with the aerosol hy-
groscopic growth; the increase in transition metal total mass
in air is slower than that in water mass in PKU-17. The
ratio of Fe total mass (Fet ) / ALWC decreased with PM2.5
mass. Previous global-scale observations (Sholkovitz et al.,
2012) of ∼ 1100 samples also showed the hyperbolic trends
of Fe solubility with total Fe mass. Higher activity coeffi-
Figure 2. Multiphase sulfate production under actual ambient con- cients and lower aqueous TMI concentration led to the emer-
ditions (a, c) and averaged conditions (b, d) in winter (a, b) and gence of a “high platform” of the aqTMI contribution to sul-
summer (c, d) in the North China Plain. Given the actual measured fate formation in the range of 50–150 µg/m3 of ALWC (i.e.,
concentration, the steady-state concentration of each reactant was higher effective aqueous TMIs in this range). While ALWC
calculated using the PKU-MARK model, accounting for the impact exceeded 150 µg/m3 in winter, the increase in activity coef-
of ionic strength on the Henry’s law coefficient of the gas-phase re- ficients could not promote the rate of the aqTMI. Due to
actants. Panels (a) and (c) show the cluster-averaged results with a the slight increase in aerosol pH and the dilution effect of
pH span of 0.5. Panels (b) and (d) show the sulfate formation rate aerosol hygroscopic growth on TMIs when ALWC exceeded
obtained by fixing the average precursors levels during the haze pe-
150 µg/m3 as discussed above, the importance of aqTMI
riods and by changing the aerosol pH, which is consistent with the
calculation method of previous studies (Cheng et al., 2016). Grey-
and Mn-surface contributions were lowered. At this time, the
shaded areas indicate the ISORROPIA II (Fountoukis and Nenes, contributions of external oxidizing substance pathways such
2007) model calculated pH ranges during the haze periods of two as H2 O2 , NO2 or O3 may rise in the proper pH range as illus-
field campaigns. The solid colored lines represent sulfate production trated in Fig. 4. In winter fog or cloud conditions with higher
rates calculated for different multiphase reaction pathways with ox- water content, the contribution from TMIs may decrease a lot
idants: enhanced H2 O2 , O3 , TMIs, NO2 , surface Mn and gas-phase because of their low concentrations.
radicals (OH+SCIs). The solid orange line represents the calculated The same analysis is also used in the summer WD-14 field
sulfate formation rate via H2 O2 with a factor of 100 in winter and campaign (as shown in Fig. S8). The dilution effect occurred
summer according to the latest research results (T. Liu et al., 2020). more dramatically in summer compared to in winter because
Reactant concentrations, aqueous reaction rate expressions and rate of a higher RH and higher percentage of water in the aerosol.
coefficients are summarized in the Supplement.
In this situation, the contribution of the aqTMI or Mn-surface
was inhibited due to the low soluble TMI concentrations.
Considering the positive relationships of the SOR and RH in
water content. Aerosol water content does not affect TMI lev- the summer WD-14 field campaign, aqueous and surface sul-
els in solution by affecting the solubility of the overall metal fate formation contributions mentioned in the study could not
form of the specific species (Fig. 3 shows insensitivity of pH explain the missing source of secondary sulfate. Because of
to ALWC, which has been pointed out in other papers ; Wong the low pH range observed in the WD-14 field campaign, the
et al., 2020). The reaction kinetics and rate constants summa- contributions from H2 O2 , NO2 , O3 or NO− 3 photolysis were
rized in Table S2 suggest that there is a proportional relation- negligible. The missing contribution may mainly come from
Atmos. Chem. Phys., 21, 13713–13727, 2021 https://doi.org/10.5194/acp-21-13713-2021H. Song et al.: A comprehensive observation-based multiphase chemical model analysis 13721
Figure 3. Variation in PM2.5 , ionic strength, aerosol pH, particle-specific surface areas and sulfate formation rates from different pathways
with aerosol liquid water content (ALWC) during the winter field campaign. The total number of valid data points shown in the figure is
479. The shaded area refers to the error bar (±1σ ) of PM2.5 mass concentration, aerosol ionic strength and pH calculated by ISORROPIA II
(Fountoukis and Nenes, 2007). The ratio in (b) refers to the ratio of contributions from Mn-surface to the aqTMI to produce sulfate. Particle-
specific surface areas represent the ratio of particle surface area (µm2 /cm3 ) to mass concentration (µg/m3 ).
Figure 4. Graph showing modeled contributions of various pathways to sulfate formation under different pollution conditions. Different
pollution conditions including clear (PM2.5 smaller than 35 µg/m3 ) in the winter PKU-17 campaign (C_winter_4.3) and summer WD-14
campaign (C_summer_4.5), pollution (PM2.5 larger than 75 µg/m3 ) in PKU-17 (H_winter_4.8) and WD-14 (H_summer_4.2), fog conditions
used in a previous study (Xue et al., 2016) (Fog_winter_6.0), and cloud conditions (Cloud_5.5) simulated by Seinfeld and Pandis (2016). The
number on each label indicates the average pH value chosen in these calculations. We assumed that the cloud water content is 0.1 g/m3 in
the last condition (Cloud_5.5) and reduced the H2 O2 concentration to 0.1 ppb compared to the high value used before (Seinfeld and Pandis,
2016).
other pathways such as photosensitizing molecules (Wang 4 Discussion and conclusion
et al., 2020) under stronger UV in summer or contributions
from hydroxy methane sulfonate (Moch et al., 2018; Ma et We evaluated the contribution of different pathways to
al., 2020) which need further studies. secondary sulfate formation using a state-of-the-art size-
segregated multiphase model constrained to the observed pa-
rameters from two field campaigns in the North China Plain.
https://doi.org/10.5194/acp-21-13713-2021 Atmos. Chem. Phys., 21, 13713–13727, 202113722 H. Song et al.: A comprehensive observation-based multiphase chemical model analysis
In addition, the effects of aerosol solution non-ideality on However, according to a recent laboratory report (Shi et al.,
aqueous-phase reaction rates as well as dissolution equilib- 2021), the nitrate photolysis enhancement factor is no larger
riums were considered in the calculations. The results in- than 2 at all RH ranges. We also included the calculation of
dicated that the aqueous TMI-catalyzed oxidation pathway nitrate photolysis in this study due to the high loading of par-
(aqTMI) was an important contributor to sulfate formation ticle nitrate and found that the contribution was rather small
during haze episodes, which is consistent with the results of (∼ 0.008 µg/m3 /h in winter haze periods); thus, we did not
the isotope and WRF-Chem studies (He et al., 2018; Shao et include this pathway in the figures.
al., 2019; Li et al., 2020a; Yue et al., 2020). According to our modeled results and a new study (Wang
Despite the dominant role of the aqTMI in the PKU-17 et al., 2021), Mn surface reactions contribute a lot to sul-
(3−x)
field campaign, contributions from other multiphase path- fate formation. Except for possible Mn(OH)x reacting
ways are not negligible. Dominant pathways varied with con- with SO2 , Zhang et al. (2006) proposed that other metal ox-
ditions such as clear or haze periods in clouds or aerosol wa- ides such as Fe2 O3 and Al2 O3 can also react with SO2 on
ter. Figure 4 exhibits the contribution of different oxidation the surface of particles. The ratio of contributions from Mn-
pathways to sulfate formation in aerosol water (under differ- surface / the aqTMI to produce sulfate will decrease with
ent pollution levels), fog and clouds to indicate the dominant aerosol hygroscopic growth owing to higher ALWC and
factors of sulfate formation under different conditions. In lower specific surface areas (as shown in Fig. 3b, dotted black
clear periods, gas-phase oxidation of SO2 by gas-phase radi- line). What is more, the organic coating of aerosol particles
cals (OH and SCIs) happens continuously, contributing 0.01– can largely reduce the reactivity of surface heterogeneous re-
0.6 µg/m3 /h to sulfate formation. At the clean time, sulfate actions (Zelenov et al., 2017; Anttila et al., 2006; Folkers et
production is mainly limited by relatively low SO2 concen- al., 2003; Ryder et al., 2015) and may cause the Mn-surface
trations and low ALWC, which has promotion effects on the pathway to be less important. High mass concentrations of
multiphase sulfate formation pathways. The average sulfate organic aerosols (OAs) were observed in Beijing in both win-
formation rate during clear days was 1.30 µg/m3 /h in winter ter and summer (Hu et al., 2016). Based on the measured re-
and 2.13 µg/m3 /h in summer because of the generally higher sult (Yu et al., 2019) from transmission electron microscopy,
ALWC in summer aerosols and much higher gas-phase rad- up to 74 % of non-sea-salt sulfate particles were coated with
ical concentrations. Gas-phase radicals (OH and SCIs) con- organic matter (OM). The organic coating can effectively re-
tinuously oxidize SO2 during haze and clear periods. duce the reactive sites on the surface of particles and hence
External oxidizing substances such as NO2 and O3 made reduce the reaction probability of SO2 with surface metal.
little contribution to sulfate formation during these haze pe- On the other hand, the widespread presence of aerosol or-
riods because of the high aerosol acidity. High pH (near ganic coating can also influence the bulk SO2 catalyzed by
7) values were observed in these field campaigns when the aqueous TMIs and not only the surface reactions. This effect
contribution of the NO2 pathway was dominant at some is mainly achieved by the change in SO2 solubility and dif-
point but not during the entire pollution process; its pro- fusion coefficient rather than the rates of catalytic reactions
portion was much lower than that of the aqTMI. Although with TMIs. Although the solubility of SO2 in organic solvent
the enhancement factor of H2 O2 oxidation was considered changes a lot with the component of organic matter (Zhang
based on the measurement of a previous study (T. Liu et al., et al., 2013; K. Huang et al., 2014), according to previous
2020), the contribution of H2 O2 oxidation was still below studies of the SO2 uptake coefficient with sea-salt aerosols
0.5 µg S(VI)/m3 /h because ALWC was about 10 times lower (Gebel et al., 2000) and secondary organic aerosols (SOAs)
than 300 µg/m3 , which was used in previous studies (Cheng (Yao et al., 2019), no obvious uptake coefficient reduction
et al., 2016; T. Liu et al., 2020). was observed, with the organic coating further proving the
The sulfate formation rate is limited by the ALWC accord- minor influence of the organic coating on bulk reaction rates.
ing to Eq. (1). Aerosol particles have lower water content The catalytic reaction of SO2 with the aqTMI may be less
than cloud droplets, which provides larger space for aqueous- affected by aerosol organic coating compared to SO2 with
phase reactions. Therefore, at the gas-phase SO2 concentra- Mn-surface. For these reasons, the surface reaction of SO2
tions of 5–50 ppb, 10–100-times-higher water content in fog with Mn and other metals in actual aerosol conditions re-
and cloud droplets can cause higher sulfate formation rates mains unclear with high uncertainties and needs further eval-
of up to 100 µg/m3 /h assuming 0.1 g/m3 water in clouds uation. The relevant calculation results of WD-14 and PKU-
(Fig. 4). A high H2 O2 concentration (1 ppb), which was 50 17 in this paper represent the upper limit of the Mn-surface
times higher than that in the PKU field campaign, was used contribution. The missing contribution in WD-14 polluted
in the calculation in the Cloud_5.0 regime (Seinfeld and Pan- conditions may mainly come from organic photosensitizing
dis, 2016). No obvious contribution from the NO2 oxida- molecules such as HULIS (Wang et al., 2020) under stronger
tion pathway was observed in the PKU-17 and WD-14 field UV in summer or other SOA coupled mechanisms.
campaigns because of the lower pH range. As proposed in a The results in this paper indicate that sulfate formation has
previous study, particulate nitrate photolysis can explain the different chemical behaviors in different conditions. Aque-
missing source of sulfate in Beijing haze (Zheng et al., 2020). ous TMI-catalyzed oxidation was the most important path-
Atmos. Chem. Phys., 21, 13713–13727, 2021 https://doi.org/10.5194/acp-21-13713-2021H. Song et al.: A comprehensive observation-based multiphase chemical model analysis 13723
way followed by the surface oxidation of Mn in both win- Supplement. The supplement related to this article is available on-
ter and summer, while the hydroxyl and Criegee radical ox- line at: https://doi.org/10.5194/acp-21-13713-2021-supplement.
idations contribute significantly in summer. Due to the dif-
ferences in the physical and chemical properties between
aerosol water, fog water and cloud, nitrogen dioxide oxida- Author contributions. KL conceived the study. HS and KL devel-
tion is the dominant pathway in higher pH ranges and hy- oped the PKU-MARK model for multiphase simulations. CY pro-
droperoxide and ozone oxidations dominated for the cloud. vided support in calculations. HS performed the model simulations
and wrote the manuscript with KL and CY. KL and YZ led the two
In model studies, the averaged and fixed values should be
field campaigns. KL, HD, SL, SC, ZW, MZ, LZ, MH and YZ pro-
used dialectically and carefully in the calculation of the sul-
vided campaign data for the analysis.
fate formation rate because of the mutual restriction between
factors such as pH, effective ion activity and concentration,
and aerosol water content. Model evaluation or numerical Competing interests. The contact author has declared that neither
calculations of secondary pollutants should focus on the ap- they nor their co-authors have any competing interests.
plication of actual atmospheric conditions observed in field
campaigns with the application of closure studies. Our re-
sults highlight the important role of the aerosol aqTMI in Disclaimer. Publisher’s note: Copernicus Publications remains
sulfate formation during haze periods, and the monitoring neutral with regard to jurisdictional claims in published maps and
network of aerosol metal is necessary for the studies of sec- institutional affiliations.
ondary sulfate formation. The aqTMI independent of solar
radiation also explains the explosive growth of sulfate pro-
duction in the nighttime, which is frequently observed during Acknowledgements. We gratefully acknowledge the comprehen-
haze episodes in the NCP. sive observation of the science teams of the Wangdu and PKU field
Compared to the gas-phase oxidants, the control of anthro- campaigns.
pogenic emissions of aerosol TMIs is conducive to a reduc-
tion in secondary sulfates. The promotion of clean-energy
strategies aiming at reducing coal burning and vehicle emis- Financial support. This research has been supported by the Data
Center of Management Science, National Natural Science Founda-
sions to improve air quality in North China has reduced not
tion of China – Peking University (grant no. 21976006), the Na-
only the primary emissions of SO2 but also the anthropogenic
tional Key Research and Development Program of China (grant no.
emissions of aerosol TMIs (Liu et al., 2018) and thus the pro- 2019YFC0214800), the National Key Research Program for Air
duction of secondary sulfate. What is more, China’s ecolog- Pollution Control (DQGG202002), and the Beijing Municipal Nat-
ical and environmental protection measures for tree planting ural Science Foundation (grant no. JQ19031).
and afforestation are conducive to reducing the generation of
dust especially in the spring, further reducing the quality of
metal Fe concentrations in aerosols. Review statement. This paper was edited by Qiang Zhang and re-
Our findings showed that urban aerosol TMIs contribute to viewed by two anonymous referees.
sulfate formation during haze episodes and play a key role in
developing mitigation strategies and public health measures
in megacities worldwide, but the physicochemical processes
of transition metals in particles require further research. Dis-
solved Mn concentrations in this study were estimated based References
on previous studies. The solubility of transition metals in
aerosol water varying largely due to several factors includ- Alexander, B., Park, R. J., Jacob, D. J., and Gong, S.: Transition
ing various source emissions, aerosol organic matter and pH metal-catalyzed oxidation of atmospheric sulfur: Global impli-
(Paris and Desboeufs, 2013; Wozniak et al., 2015; Tapparo cations for the sulfur budget, J. Geophys. Res.-Atmos., 114,
et al., 2020) was fully considered in this study. Influences of D02309, https://doi.org/10.1029/2008JD010486, 2009.
organic matter and photosensitizing molecules on the solu- Anttila, T., Kiendler-Scharr, A., Tillmann, R., and Mentel, T. F.:
bility of transition metal and the mechanism of sulfate for- On the Reactive Uptake of Gaseous Compounds by Organic-
mation need further research to understand this complex and Coated Aqueous Aerosols: Theoretical Analysis and Application
to the Heterogeneous Hydrolysis of N2 O5 , J. Phys. Chem. A,
dynamic multiphase process from a broader perspective.
110, 10435–10443, doi10.1021/jp062403c, 2006.
Atkinson, R., Baulch, D. L., Cox, R. A., Crowley, J. N., Hamp-
son, R. F., Hynes, R. G., Jenkin, M. E., Rossi, M. J., and
Data availability. Data supporting this publication are available Troe, J.: Evaluated kinetic and photochemical data for atmo-
upon request from the corresponding author (k.lu@pku.edu.cn). spheric chemistry: Volume I – gas phase reactions of Ox , HOx ,
NOx and SOx species, Atmos. Chem. Phys., 4, 1461–1738,
https://doi.org/10.5194/acp-4-1461-2004, 2004.
https://doi.org/10.5194/acp-21-13713-2021 Atmos. Chem. Phys., 21, 13713–13727, 202113724 H. Song et al.: A comprehensive observation-based multiphase chemical model analysis
Baker, A. R. and Jickells, T. D.: Mineral particle size as a con- nisms, University of California, Davis, CA, USA, 8–10 Decem-
trol on aerosol iron solubility, Geophys. Res. Lett., 33, L17608, ber 2008, University of California, Davis, CA, USA, 2008.
https://doi.org/10.1029/2006gl026557, 2006. Goliff, W. S., Stockwell, W. R., and Lawson, C. V.: The regional
Baker, A. R., Jickells, T. D., Witt, M., and Linge, K. L.: Trends in atmospheric chemistry mechanism, version 2, Atmos. Environ.,
the solubility of iron, aluminium, manganese and phosphorus in 68, 174–185, 2013.
aerosol collected over the Atlantic Ocean, Mar. Chem., 98, 43– Guo, H., Weber, R. J., and Nenes, A.: High levels of ammo-
58, https://doi.org/10.1016/j.marchem.2005.06.004, 2006. nia do not raise fine particle pH sufficiently to yield nitrogen
Barth, M. C., Hess, P. G., and Madronich, S.: Effect of ma- oxide-dominated sulfate production, Sci. Rep.-UK, 7, 12109,
rine boundary layer clouds on tropospheric chemistry https://doi.org/10.1038/s41598-017-11704-0, 2017.
as analyzed in a regional chemistry transport model, Guo, H., Xu, L., Bougiatioti, A., Cerully, K. M., Capps, S. L., Hite
J. Geophys. Res.-Atmos., 107, AAC 7-1-AAC 7-12, Jr., J. R., Carlton, A. G., Lee, S.-H., Bergin, M. H., Ng, N. L.,
https://doi.org/10.1029/2001JD000468, 2002. Nenes, A., and Weber, R. J.: Fine-particle water and pH in the
Bian, Y. X., Zhao, C. S., Ma, N., Chen, J., and Xu, W. Y.: A study southeastern United States, Atmos. Chem. Phys., 15, 5211–5228,
of aerosol liquid water content based on hygroscopicity measure- https://doi.org/10.5194/acp-15-5211-2015, 2015.
ments at high relative humidity in the North China Plain, At- Guo, S., Hu, M., Zamora, M. L., Peng, J. F., Shang, D. J., Zheng,
mos. Chem. Phys., 14, 6417–6426, https://doi.org/10.5194/acp- J., Du, Z. F., Wu, Z., Shao, M., Zeng, L. M., Molina, M.
14-6417-2014, 2014. J., and Zhang, R. Y.: Elucidating severe urban haze forma-
Chameides, W. and Stelson, A.: Aqueous-phase chemical processes tion in China, P. Natl. Acad. Sci. USA, 111, 17373–17378,
in deliquescent sea-salt aerosols: A mechanism that couples the https://doi.org/10.1073/pnas.1419604111, 2014.
atmospheric cycles of S and sea salt, J. Geophys. Res.-Atmos., Hanson, D. R., Ravishankara, A. R., and Solomon, S.: Hetero-
97, 20565–20580, 1992a. geneous reactions in sulfuric-acid aerosol: A framework for
Chameides, W. L. and Stelson, A. W.: Aqueous-phase chemical pro- model calculations, J. Geophys. Res.-Atmos., 99, 3615–3629,
cesses in deliquescent seasalt aerosols, Ber. Bunsen Phys. Chem., https://doi.org/10.1029/93jd02932, 1994.
96, 461–470, 1992b. He, P., Alexander, B., Geng, L., Chi, X., Fan, S., Zhan, H., Kang, H.,
Cheng, Y., Zheng, G., Wei, C., Mu, Q., Zheng, B., Wang, Z., Gao, Zheng, G., Cheng, Y., Su, H., Liu, C., and Xie, Z.: Isotopic con-
M., Zhang, Q., He, K., Carmichael, G., Pöschl, U., and Su, straints on heterogeneous sulfate production in Beijing haze, At-
H.: Reactive nitrogen chemistry in aerosol water as a source mos. Chem. Phys., 18, 5515–5528, https://doi.org/10.5194/acp-
of sulfate during haze events in China, Sci. Adv., 2, e1601530, 18-5515-2018, 2018.
https://doi.org/10.1126/sciadv.1601530, 2016. Heal, M. R., Hibbs, L. R., Agius, R. M., and Bever-
Duan, J. C., Tan, J. H., Wang, S. L., Hao, J. M., and Chail, F. H.: land, L. J.: Total and water-soluble trace metal content
Size distributions and sources of elements in particulate matter of urban background PM10 , PM2.5 and black smoke
at curbside, urban and rural sites in Beijing, J. Environ. Sci., 24, in Edinburgh, UK, Atmos. Environ., 39, 1417–1430,
87–94, https://doi.org/10.1016/s1001-0742(11)60731-6, 2012. https://doi.org/10.1016/j.atmosenv.2004.11.026, 2005.
Fang, T., Guo, H., Zeng, L., Verma, V., Nenes, A., and We- Hsu, S.-C., Wong, G. T. F., Gong, G.-C., Shiah, F.-K.,
ber, R. J.: Highly Acidic Ambient Particles, Soluble Met- Huang, Y.-T., Kao, S.-J., Tsai, F., Candice Lung, S.-C.,
als, and Oxidative Potential: A Link between Sulfate and Lin, F.-J., Lin, I. I., Hung, C.-C., and Tseng, C.-M.:
Aerosol Toxicity, Environ. Sci. Technol., 51, 2611–2620, Sources, solubility, and dry deposition of aerosol trace ele-
https://doi.org/10.1021/acs.est.6b06151, 2017. ments over the East China Sea, Mar. Chem., 120, 116–127,
Folkers, M., Mentel, T. F., and Wahner, A.: Influence of an organic https://doi.org/10.1016/j.marchem.2008.10.003, 2010.
coating on the reactivity of aqueous aerosols probed by the het- Hu, W., Hu, M., Hu, W., Jimenez, J. L., Yuan, B., Chen, W.,
erogeneous hydrolysis of N2 O5 , Geophys. Res. Lett., 30, 12, Wang, M., Wu, Y., Chen, C., Wang, Z., Peng, J., Zeng, L.,
https://doi.org/10.1029/2003GL017168, 2003. and Shao, M.: Chemical composition, sources, and aging pro-
Fountoukis, C. and Nenes, A.: ISORROPIA II: a computa- cess of submicron aerosols in Beijing: Contrast between sum-
tionally efficient thermodynamic equilibrium model for K+ – mer and winter, J. Geophys. Res.-Atmos., 121, 1955–1977,
2−
Ca2+ –Mg2+ –NH+ + − −
4 –Na –SO4 –NO3 –Cl –H2 O aerosols, At- https://doi.org/10.1002/2015JD024020, 2016.
mos. Chem. Phys., 7, 4639–4659, https://doi.org/10.5194/acp-7- Huang, K., Xia, S., Zhang, X.-M., Chen, Y.-L., Wu, Y.-T.,
4639-2007, 2007. and Hu, X.-B.: Comparative Study of the Solubilities of
Gao, J., Peng, X., Chen, G., Xu, J., Shi, G.-L., Zhang, Y.-C., SO2 in Five Low Volatile Organic Solvents (Sulfolane, Ethy-
and Feng, Y.-C.: Insights into the chemical characterization and lene Glycol, Propylene Carbonate, N-Methylimidazole, and
sources of PM2.5 in Beijing at a 1-h time resolution, Sci. Total N-Methylpyrrolidone), J. Chem. Eng. Data, 59, 1202–1212,
Environ., 542, 162–171, 2016. https://doi.org/10.1021/je4007713, 2014.
Gebel, M. E., Finlayson-Pitts, B. J., and Ganske, J. A.: Huang, R.-J., Zhang, Y., Bozzetti, C., Ho, K.-F., Cao, J.-J., Han, Y.,
The uptake of SO2 on synthetic sea salt and some Daellenbach, K. R., Slowik, J. G., Platt, S. M., Canonaco, F., Zot-
of its components, Geophys. Res. Lett., 27, 887–890, ter, P., Wolf, R., Pieber, S. M., Bruns, E. A., Crippa, M., Ciarelli,
https://doi.org/10.1029/1999GL011152, 2000. G., Piazzalunga, A., Schwikowski, M., Abbaszade, G., Schnelle-
Goliff, W. S. and Stockwell, W. R.: The Regional Atmospheric Kreis, J., Zimmermann, R., An, Z., Szidat, S., Baltensperger, U.,
Chemistry Mechanism, Version 2, an Update, in: Proceedings of Haddad, I. E., and Prévôt, A. S. H.: High secondary aerosol con-
the International Conference on Atmospheric Chemical Mecha- tribution to particulate pollution during haze events in China, Na-
ture, 514, 218–222, 10.1038/nature13774, 2014.
Atmos. Chem. Phys., 21, 13713–13727, 2021 https://doi.org/10.5194/acp-21-13713-2021You can also read


