Measurement report: quantifying source contribution of fossil fuels and biomass-burning black carbon aerosol in the southeastern margin of the ...
←
→
Page content transcription
If your browser does not render page correctly, please read the page content below
Atmos. Chem. Phys., 21, 973–987, 2021
https://doi.org/10.5194/acp-21-973-2021
© Author(s) 2021. This work is distributed under
the Creative Commons Attribution 4.0 License.

Measurement report: quantifying source contribution of fossil fuels
and biomass-burning black carbon aerosol in the
southeastern margin of the Tibetan Plateau
Huikun Liu1,2,3 , Qiyuan Wang1,2,3,4 , Li Xing5 , Yong Zhang2 , Ting Zhang2 , Weikang Ran2 , and Junji Cao1,2,3,4
1 StateKey Laboratory of Loess and Quaternary Geology, Institute of Earth Environment,
Chinese Academy of Sciences, Xi’an, 710061, China
2 Key Laboratory of Aerosol Chemistry and Physics, Institute of Earth Environment,

Chinese Academy of Sciences, Xi’an, 710061, China
3 University of Chinese Academy of Sciences, Beijing, 100049, China
4 CAS Center for Excellence in Quaternary Science and Global Change, Xi’an, 710061, China
5 School of Geography and Tourism, Shaanxi Normal University, Xi’an, 710119, China

Correspondence: Qiyuan Wang (wangqy@ieecas.cn) and Junji Cao (cao@loess.llqg.ac.cn)

Received: 25 April 2020 – Discussion started: 23 June 2020
Revised: 5 November 2020 – Accepted: 7 December 2020 – Published: 26 January 2021

Abstract. Anthropogenic emissions of black carbon (BC)         of BC was +4.6 ± 2.4 W m−2 , with +2.5 ± 1.8 W m−2 from
aerosol are transported from Southeast Asia to the south-      BCbiomass and +2.1 ± 0.9 W m−2 from BCfossil . The DRE of
western Tibetan Plateau (TP) during the pre-monsoon; how-      BCbiomass and BCfossil produced heating rates of 0.07 ± 0.05
ever, the quantities of BC from different anthropogenic        and 0.06 ± 0.02 K d−1 , respectively. This study provides in-
sources and the transport mechanisms are still not well con-   sights into sources of BC over a transport channel to the
strained because there have been no high-time-resolution       southeastern TP and the influence of the cross-border trans-
BC source apportionments. Intensive measurements were          portation of biomass-burning emissions from Southeast Asia
taken in a transport channel for pollutants from Southeast     during the pre-monsoon.
Asia to the southeastern margin of the TP during the pre-
monsoon to investigate the influences of fossil fuels and
biomass burning on BC. A receptor model that coupled
multi-wavelength absorption with aerosol species concen-       1   Introduction
trations was used to retrieve site-specific Ångström expo-
nents (AAEs) and mass absorption cross sections (MACs)         The Tibetan Plateau (TP) is an important regulator of climate
for BC. An “aethalometer model” that used those values         change in the Northern Hemisphere, and it plays a crucial
showed that biomass burning had a larger contribution to BC    role in the functions of the global ecosystem and climate sta-
mass than fossil fuels (BCbiomass = 57 % versus BCfossil =     bility (Liu et al., 2019, 2020a). The TP is covered by one of
43 %). The potential source contribution function indicated    the largest ice masses on Earth, and it has been called the
that BCbiomass was transported to the site from northeastern   water tower of Asia (Liu et al., 2020b). The glaciers on the
India and northern Burma. The Weather Research and Fore-       TP are facing rapid retreat, however, and if unchecked, this
casting model coupled with chemistry (WRF-Chem) indi-          could result in adverse effects on the Asian hydrological cy-
cated that 40 % of BCbiomass originated from Southeast Asia,   cle and Asian monsoon (Luo et al., 2020; Hua et al., 2019). In
while the high BCfossil was transported from the southwest     spring, the glaciers on the TP begin to melt as part of the nat-
of the sampling site. A radiative transfer model indicated     ural hydrological cycle, but the increasing quantities of black
that the average atmospheric direct radiative effect (DRE)     carbon (BC) aerosol transported to the TP have accelerated
                                                               this process (Bond et al., 2013) by causing a warming effect

Published by Copernicus Publications on behalf of the European Geosciences Union.
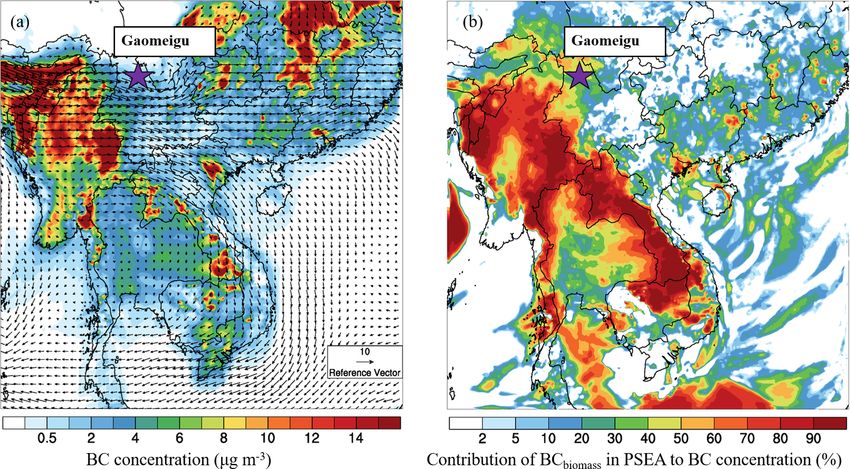
974                  H. Liu et al.: Source contribution of black carbon in the southeastern margin of the Tibetan Plateau

in atmosphere over the TP and enhancing the absorption of           biomass-burning sources (Sandradewi et al., 2008). The ac-
radiation on the surface of the glaciers (Ming et al., 2009).       curacy of the aethalometer model relies on the input parame-
   The southern part of the TP is bounded by South Asia,            ters, including absorption Ångström exponent (AAE) and BC
where air pollution often is severe (Chan et al., 2017).            mass absorption cross section (MACBC ) of different sources
Several studies have shown that pollutants (including BC)           (Zotter et al., 2017). Limited information on site-specific
from South Asia can be transported to the south of the TP           Ångström exponents (AAEs) and MACBC s lead most studies
along mountain valleys, especially during the pre-monsoon           to rely on values taken from measurements made in other lo-
(March–May), when southwesterly winds prevail (e.g., Cao            cations (e.g., Healy et al., 2017; Zhu et al., 2017). This results
et al., 2010; Xia et al., 2011; Zhu et al., 2017; Niu et al.,       in unquantified uncertainties because the AAE and MACBC s
2017). For example, Xia et al. (2011) analyzed satellite data       can vary with specific fuel subtypes and combustion condi-
and air mass trajectories and found that the TP, particularly       tions (Wang et al., 2018; Tian et al., 2019). Therefore site-
the southern TP, was affected by pollutants carried by south-       dependent AAEs and MACBC are essential for improving the
westerly winds from nearby regions in South Asia. In ad-            reliability of BC source apportionment by the aethalometer
dition, numerous studies have shown that the high bulk BC           model.
mass loadings and the associated regional influences on the            In this study, field measurements of BC were taken on the
TP are related to transport from South Asia (Liu et al., 2015;      southeastern margin of the TP during the pre-monsoon. This
Han et al., 2020; Cong et al., 2015; Wang et al., 2015).            region connects the high-altitude TP with the low-altitude
Nonetheless, assessments of regional transport of bulk BC           Yungui Plateau and forms a transport channel for pollutants
aerosol have not fully revealed the impacts of different BC         from Southeast Asia (Wang et al., 2019a), and it is an ideal
emission sources because the optical properties and radiative       region for investigating the impact of pollutant transport to
effects of BC can not only vary among sources in complex            the southeastern TP. A receptor model combined with multi-
ways but can also be affected by aging during transport (Tian       wavelength absorption with aerosol species concentrations
et al., 2019; Zhang et al., 2019). Therefore, quantitative infor-   was used to retrieve site-dependent AAEs and MACBC s. This
mation on the contributions of different sources of BC over         was done to improve the aethalometer model with the goal
the TP is lacking, but it is critically needed for a better un-     of obtaining a more accurate BC source apportionment. The
derstanding of the influence of anthropogenic emissions on          primary objectives of this study were to (1) quantify the
its environment and climate.                                        mass concentrations of BC from fossil fuel and biomass-
   Several studies have assessed the contributions of different     burning sources, (2) determine the impact of regional trans-
BC sources through model simulations or isotopic methods.           port on source-specific BC, and (3) assess the radiative ef-
For example, Zhang et al. (2015) investigated BC sources            fects caused by BC from different sources. This study pro-
for different parts of the TP by using a chemical transport         vides insights into the BC sources on the southeastern TP
model and a source-tagging approach, and they found that the        and an assessment of their radiative effects during the pre-
contributions of BC sources varied among regions and with           monsoon.
the seasons. Li et al. (2016) used filter sampling and carbon
isotopes (114 C and δ 13 C) to determine the BC from fossil
fuels and biomass burning in several areas of the TP. A ma-         2     Methodology
jor disadvantage of filter-based measurements is that they are
constrained by low time resolution, which makes it challeng-        2.1    Sampling site
ing to capture the detailed evolution of pollution events. On
the other hand, the accuracy of model simulations is depen-         Intensive field measurements were made at the rooftop of
dent on many factors, including uncertainties associated with       a building (∼ 10 m above the ground) at the Lijiang As-
initial particle parameters, aging processes, the accuracy of       tronomical Station, Chinese Academy of Sciences (3260 m
emission inventory, meteorological fields over the complex          above sea level; 26◦ 410 2400 N, 100◦ 10 4800 E), Gaomeigu
terrain, the modules for chemistry and planetary boundary           County, Yunnan Province, China (Fig. 1), from 14 March to
layer (PBL) dynamics, etc. (Koch et al., 2009; Madala et al.,       13 May 2018. During the campaign, westerly winds created
2014; Vignati et al., 2010). Nonetheless, these studies have        a potential pathway for cross-border transport from South-
been helpful for understanding the sources of BC over the           east Asia to southwestern China. During the study, the aver-
TP.                                                                 age relative humidity and temperature were 80 % ± 20 % and
   To make up for the deficiencies of filter-based analysis, BC     7.6 ± 3.2◦ , respectively; the mean wind speed near the sur-
source apportionments based on high-time-resolution online          face was 5.4 ± 2.1 m s−1 , and the winds were mainly from
data have been conducted in many locations (e.g., Herich            the west and southwest. The sampling site is 3–5 km from
et al., 2011; Zhu et al., 2017; Rajesh and Ramachandran,            Gaomeigu village, which has 27 households and 110 resi-
2018) but for the TP are limited. An “aethalometer model”           dents. Villagers there rely on farming for their livelihoods,
based on multi-wavelength absorption data is one efficient          and biomass is the primary residential fuel (Li et al., 2016).
approach for distinguishing between BC from fossil fuel and         There are no large industries near the village, and traffic is

Atmos. Chem. Phys., 21, 973–987, 2021                                                   https://doi.org/10.5194/acp-21-973-2021
H. Liu et al.: Source contribution of black carbon in the southeastern margin of the Tibetan Plateau                          975

light. However, two highways (Hangzhou–Ruili Expressway           2.3   BC source apportionment
and Dali–Nujiang Expressway) are located ∼ 5.5 km to the
west of the sampling site.                                        The aethalometer model proposed by Sandradewi et
                                                                  al. (2008) was optimized by excluding the babs (370)
                                                                  contributed by the secondary aerosols and soil dust
2.2   Online and offline measurements                             (babs (370)secondary and babs (370)dust , respectively).
                                                                     The formulae used for the aethalometer model were as fol-
Aerosol light absorption coefficients at multiple wavelengths     lows:
(babs (λ), λ = 370, 470, 520, 590, 660, 880 and 950 nm) were      babs (370)fossil

                                                                                        370 −AAEfossil

retrieved with the use of a model AE33 aethalometer (Magee                         =                                       (1)
                                                                  babs (880)fossil      880
Scientific, Berkeley, CA, USA). The sampled particles were
                                                                                          370 −AAEbiomass

selected by a PM2.5 cuff-off inlet (SCC 1.829, BGI Inc. USA)      babs (370)biomass
                                                                                     =                                     (2)
and dried with a Nafion® dryer (MD-700-24S-3, Perma Pure,         babs (880)biomass       880
Inc., Lakewood, NJ, USA), and the flow rate of the sam-           babs (880) = babs (880)fossil + babs (880)biomass        (3)
pler is 5 L min−1 . Detailed operating principles of the AE33
                                                                  babs (370) = babs (370)fossil + babs (370)biomass
aethalometer can be found in Drinovec et al. (2015). Briefly,
light at wavelengths (λ) of 370, 470, 520, 590, 660, 880 and         + babs (370)secondary + babs (370)dust ,                 (4)
950 nm emitted from diodes is used to irradiate aerosol de-       where AAEfossil and AAEbiomass are the AAEs for emis-
position spots on the filters. The light attenuation produced     sions of fossil fuel contribution and biomass burning. These
by the captured particles is measured with optical detec-         were retrieved through an optical source apportionment and
tors. Non-linear loading and filter matrix scattering effects     are discussed in Sect. 3.1; babs (370) and babs (880) are the
are common issues for filter-based absorption measurements        measured babs at λ = 370 and 880 nm, respectively; the ab-
(Collaud Coen et al., 2010). A dual-spot technique for the        sorption coefficients for fossil fuel are babs (370)fossil and
aethalometer measurements was used to compensate for non-         babs (880)fossil , while those for biomass-burning sources are
linearity, while a factor of 2.14 was used to correct the arti-   babs (370)biomass and babs (880)biomass . A source apportion-
facts caused by quartz filters (Drinovec et al., 2015).           ment of the optical data was used to calculate babs (370)dust
   A photoacoustic extinctiometer (PAX, Droplet Measure-          as discussed in Sect. 3.1, while babs (370)secondary was esti-
ment Technology, Boulder, CO, USA) was used to deter-             mated using a BC-tracer method combined with a minimum
mine the aerosol light scattering and absorption coefficient      R-squared approach as described by Wang et al. (2019a).
(bscat (532) and babs (532), respectively), which were used to       After obtaining babs (880)fossil and babs (880)biomass , the
calculate the single scattering albedo (SSA = bscat /(bscat +     mass concentrations of BC from fossil fuel combustion and
babs )) at λ = 532 nm. The bscat was measured using a wide-       biomass burning (BCfossil and BCbiomass , respectively) were
angle (5–175◦ ) integrating reciprocal nephelometer in the        estimated as follows:
scattering chamber. The babs (532) was measured simulta-
neously with an intracavity photoacoustic technique in the                       babs (880)fossil
                                                                  BCfossil =                                                  (5)
acoustic chamber. A detailed description of the PAX can be                    MACBC (880)fossil
found in Carrico et al. (2018). During the campaign, the se-                         babs (880)biomass
                                                                  BCbiomass =                          ,                      (6)
lected concentrations of ammonium sulfate and freshly gen-                       MACBC (880)biomass
erated propane soot were used to calibrate the bscat (532) and    where MACBC (880)fossil and MACBC (880)biomass are the
babs (532) measurements, respectively. Details regarding the      MACBC s at λ = 880 nm generated from fossil fuel combus-
calibration procedure are in Wang et al. (2018).                  tion and biomass burning, respectively. The MACBC (880)s
   Daily PM2.5 filters were collected for the analysis of se-     for the two sources were retrieved from a source apportion-
lected chemical species. Organic carbon (OC) and elemen-          ment of the optical data discussed in Sect. 3.1.
tal carbon (EC) were determined using a thermal and opti-
cal carbon analyzer (Atmoslytic Inc., Calabasas, CA, USA).        2.4   Optical source apportionment
Water-soluble potassium ions (i.e., K+ ) and levoglucosan
were analyzed with the use of an ion chromatograph (Dionex        Optical source apportionments were obtained using a posi-
Inc., Sunnyvale, CA, USA). The inorganic elements (i.e., S,       tive matrix factorization (PMF) model. The fundamental ob-
Ca, Ti, Mn, Fe, Cu, As, Br, Pb, Zn) were measured using           jective of the PMF for applications such as ours is to resolve
an energy-dispersive X-ray fluorescence spectrometry (Ep-         the chemical mass balance by separating the data matrix into
silon 5 ED-XRF, PANalytical B.V., Netherlands). Finally, an       factor contributions and factor profiles as follows:
organic marker of benzothiazolone was determined using a                 Xp
                                                                  Xij =          g f + eij ,
                                                                             k=1 ik kj
                                                                                                                             (7)
high-performance liquid chromatography (Series 1200, Agi-
lent Technology, Santa Clara, CA). Detailed descriptions of       where Xij represents the input matrix elements, p is the num-
the chemical analyses are given in Text S1 in the Supplement.     ber of sources, gik is the source contribution of the kth factor

https://doi.org/10.5194/acp-21-973-2021                                               Atmos. Chem. Phys., 21, 973–987, 2021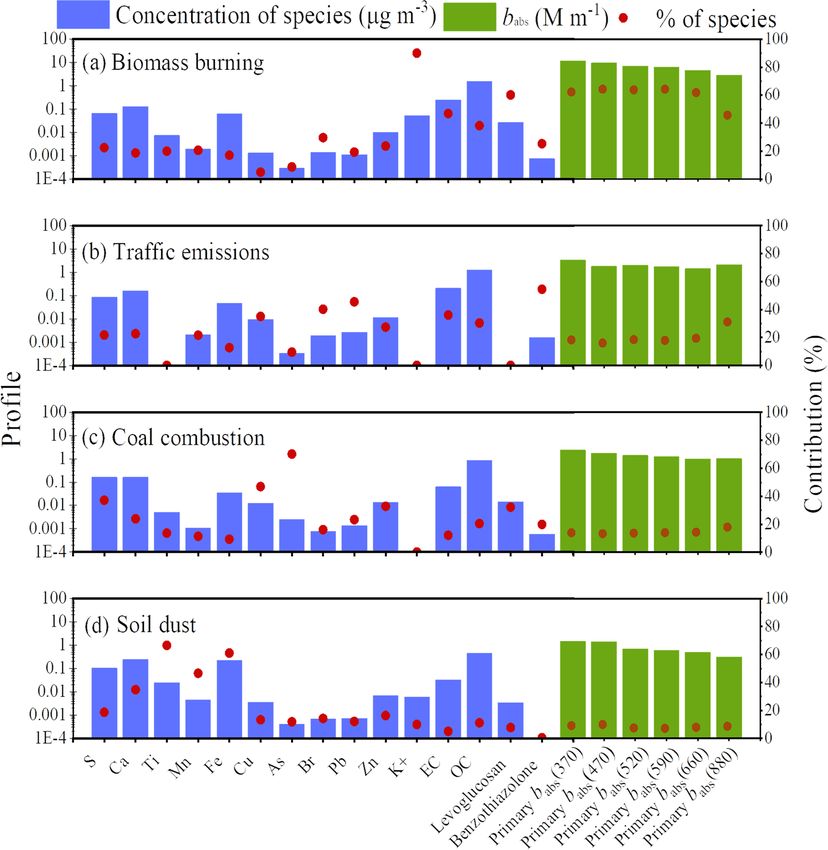
976 H. Liu et al.: Source contribution of black carbon in the southeastern margin of the Tibetan Plateau
Figure 1. Location of the Gaomeigu sampling site (red star) on the southeastern margin of the Tibetan Plateau and prevailing wind during
sampling period.
to the ith sample, fkj is the factor profile of j th species in ing the trajectory clustering methods can be found in Wang
the kth factor, and eij is representative of the residual. The et al. (2018). For the investigations of the effects of transport
values gik and fkj are non-negative. The two matrices are re- on the chemical and optical properties of the BC aerosol, tra-
solved by minimizing the sum of squares of the normalized jectories with BC mass concentration greater than the 75th
residuals as follows: percentile were considered to be polluted.
Xn Xn eij 2 The potential source contribution function (PSCF) was
Q= , (8) used to identify the likely pollution regions that influenced
i=1 j =0 uij
BC loadings at Gaomeigu based on the back trajectories. The
where Q represents the object function, and uij denotes the geographic region covered by the trajectories was overlaid
uncertainties in Xij . The PMF version 5.0 (PMF5.0, from by a 0.5◦ × 0.5◦ (i, j ) grid. The PSCF value of each grid was
the US EPA) was used for the analyses, and the optical pa- calculated as follows:
rameters (primary babs at different wavelengths) and chemi- mij
cal species concentrations (including carbonaceous aerosols, PSCFij = , (9)
nij
inorganic elements, K+ , levoglucosan and organic markers)
were used as model inputs for the optical source apportion-
where mij is the number of endpoints associated with BC
ment.
mass concentration higher than the set criterion, and nij is
2.5 Trajectory-related analysis the total endpoints of the ij th cell. To improve the resolu-
tion of PSCF source identifications, the 75th percentile of
To determine the influences of regional transport on BC at each source’s BC mass concentration was set as the crite-
Gaomeigu, trajectory clusters were produced from hourly 3 d rion for a polluted sample (i.e., 0.6 µg m−3 for BCbiomass
backward-in-time air mass trajectories at 500 m above the and 0.45 µg m−3 for BCfossil ) (Cheng and Lin, 2001). Fur-
ground level. The trajectories were calculated with the Hy- thermore, arbitrary weighting factors (wij ) were applied to
brid Single-Particle Lagrangian Integrated Trajectory model different nij ranges to reduce the uncertainty caused by the
(Draxler and Hess, 1998). The meteorological data were small nij (Polissar et al., 1999), and they were defined by the
from the Global Data Assimilation System (GDAS; https:// following the approach of Polissar et al. (2001):
www.ready.noaa.gov/gdas1.php, last access: 17 April 2020),
which takes into account the influences of terrain. As we fo- 1 80 < Nij
cused on differentiating and clustering the main spatial fea-
0.7 20 < Nij ≤ 80
tures of the incoming trajectories, an angle-oriented distance Wij = (10)
0.42 10 < Nij ≤ 20
definition was adopted in the cluster analysis. Details regard-
0.05 Nij ≤ 10.
Atmos. Chem. Phys., 21, 973–987, 2021 https://doi.org/10.5194/acp-21-973-2021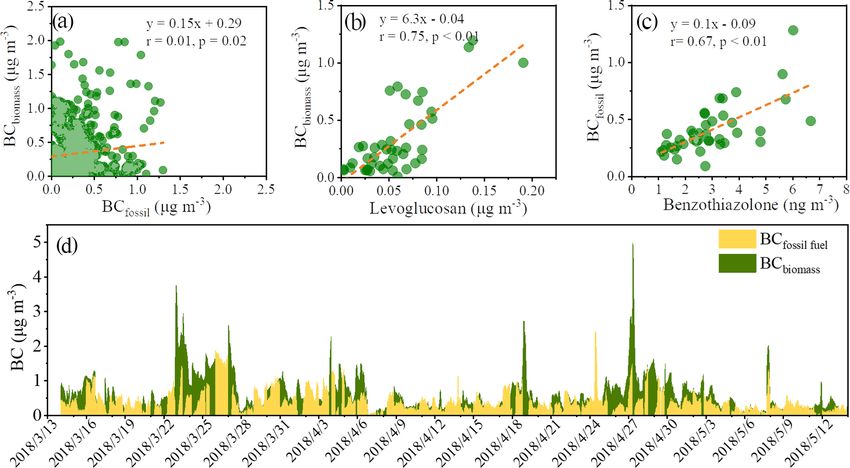
H. Liu et al.: Source contribution of black carbon in the southeastern margin of the Tibetan Plateau                          977

2.6   Regional chemical dynamical model                            follows (Ramachandran and Kedia, 2010):

The Weather Research and Forecasting model coupled with            DREATM = DRETOP − DRESUF                                  (11)
chemistry (WRF-Chem) was used to quantify the contribu-            ∂T   g    DREATM
tion of biomass burning from Southeast Asia to BC mass at             =    ×        ,                                        (12)
                                                                   ∂t   Cp    1P
Gaomeigu. Detailed descriptions of the model configurations
have been described in our previous publication (Xing et al.,      where DREATM (W m−2 ) is the atmospheric DRE, DRETOP
2020). Briefly, the model resolution was 3 km × 3 km, and          is the DRE at top atmosphere, DRESUF is the DRE at surface
there were 320 grid cells. The domain included the south-          atmosphere, ∂T                            −1
                                                                                  ∂t is the heating rate (K d ), g is the acceler-
west of China and southern and southeastern Asia, with a                                          −2
                                                                   ation due to gravity (9.8 m s ), Cp is the specific heat ca-
center at 26.70◦ N, 100.03◦ E. Thirty-five vertical layers have    pacity of air at constant pressure, and 1P is the difference in
been set in the model from the ground surface to 50 hPa. The       atmospheric pressure between the ground and 3 km above.
BC emission inventory used for the model was based on the
Asian anthropogenic emission inventory (that is MIX) for the
year 2010 (Li et al., 2017). The inventory has a spatial resolu-   3     Results and discussion
tion of 0.25◦ × 0.25◦ , and it included industry, power, trans-
portation and residential sources (e.g., fossil fuel and bio-      3.1    Source-dependent AAEs and MACs
fuel). The FINN fire inventory (Wiedinmyer et al., 2011) was
used for the biomass-burning emission during the simulation.       Four sources were identified as the main contributors to
                                                                   primary babs (λ) based on the optical source apportionment
2.7   Estimations of direct radiative effects and heating          (Fig. 2). The simulated primary babs (λ) values at different
      rate                                                         wavelengths all correlated well (r = 0.96–0.97, p < 0.01;
                                                                   Fig. S1) with the model inputs, indicating that the PMF5.0
The direct radiative effect (DRE) of source-specific BC were       performed well. As shown in Fig. 2, the first source factor ex-
estimated with the widely used Santa Barbara DISORT At-            hibited high contributions of K+ (90 %), levoglucosan (60 %)
mospheric Radiative Transfer (SBDART) model, a detailed            and primary babs (λ) (45 %–64 %) as well as moderate load-
description of which may be found in Ricchiazzi and Yang           ings of OC (38 %) and EC (47 %). The K+ and levoglucosan
(1998). The important input parameters include aerosol op-         are widely used markers for biomass burning (Urban et al.,
tical depth (AOD), light extinction coefficient (bscat + babs ),   2012), and these chemical markers are strong indications that
SSA, asymmetric parameter (ASP) and visibility. Here, the          this factor resulted from biomass-burning emissions. Further-
input optical parameters were estimated by the Optical Prop-       more, we note that the presence of BrC in this factor made
erty of Aerosol and Cloud (OPAC) model using Mie theory            higher absorption at shorter wavelengths, which is consis-
(Hess et al., 1998). The measured BC, water-soluble matter         tent with absorption features of biomass-burning emissions
(including measured water-soluble inorganic ions and water-        (Forello et al., 2019).
soluble organic matter that assumes accounting for 79 % of            Based on the contributions of biomass burning to babs (370)
OC loading; Xu et al., 2015) and water-insoluble matter (cal-      and babs (880), the AAEbiomass was estimated to be 1.7, which
culated as the PM2.5 mass concentration minus that of BC           is within a relative boarder range of AAEbiomass (1.2–3.5) de-
and water-soluble matter) were used in the OPAC model to           termined by other methods (e.g., 14 C and organic tracers) in
retrieve the number concentrations of these particles. These       previous studies (Sandradewi et al., 2008; Helin et al., 2018;
were tuned until the modeled bscat (λ), babs (λ) and SSA were      Harrison et al., 2012; Zotter et al., 2017). The estimated av-
within ±5 % (Srivastava et al., 2012) of the values measured       erage MACBC (880)biomass was 10.4 m2 g−1 ; this is more than
by the PAX (see Table S1 in the Supplement) and used to            twice the value for uncoated BC particles suggested by Bond
obtain the optical parameters at the nearest observed rela-        and Bergstrom (2006) (MACBC (880)uncoated = 4.7 m2 g−1 ,
tive humidity. The underlying assumption was that when the         extrapolated from 550 to 880 nm by assuming AAEBC
modeled bscat (λ) and babs (λ) were very close to their mea-       = 1.0). The large MACBC (880) indicates that BC particles
sured counterparts, the derived optical parameters were a          from biomass burning experienced substantial aging pro-
reasonable representation of the measured aerosols. This as-       cesses during their transport because numerous studies have
sumption has been widely used in previous studies (Dumka et        confirmed that aged BC could result in MAC increases by a
al., 2018; Panicker et al., 2010; Rajesh and Ramachandran,         factor of 1.5–3.5 relative to uncoated particles (Chen et al.,
2018). Finally, the DREs attributable to source-specific BC        2017; Ma et al., 2020) due to the “lensing effect” (Lack and
(or PM2.5 ) at the surface atmosphere (SUF) and the top of the     Cappa, 2010).
atmosphere (TOA) were estimated as the difference in the net          The second source factor was characterized by large load-
flux with and without BC (or PM2.5 ) under cloud-free condi-       ings of benzothiazolone (54 %), Pb (46 %), Br (40 %), Cu
tions. The solar-heating-rate change induced by atmospheric        (35 %), Zn (27 %), EC (36 %) and OC (30 %). Benzothia-
DRE (DRE at TOA subtracts DRE at SUF) was calculated as            zolone is released from the breakdown of the antioxidant

https://doi.org/10.5194/acp-21-973-2021                                               Atmos. Chem. Phys., 21, 973–987, 2021
978 H. Liu et al.: Source contribution of black carbon in the southeastern margin of the Tibetan Plateau Figure 2. Four aerosol light absorption sources identified by a positive matrix factorization (PMF) model. Concentrations (µg m−3 ) of the chemical species for each source are in purple. Primary babs (λ) at six wavelengths (λ = 370, 470, 520, 590, 660 or 880 nm) in each source (M m−1 ) is in green. in motor vehicle tires (Cheng et al., 2006), while Br is an- with MACBC (880)biomass , indicating that traffic-emission- other tracer of motor vehicle emission (Guo et al., 2009). related BC particles were also subjected to substantial aging. Similarly, Zn and Cu are associated with the combustion of The third factor was dominated by high loadings of As lubricating fluids and the wear of brakes and tires (Lough (70 %), S (37 %) and Cu (47 %), which are typically associ- et al., 2005; Song et al., 2006). Finally, EC and OC also ated with coal combustion (Hsu et al., 2016; Kim and Hopke, are components of motor vehicle emissions (Cao et al., 2008). Although coal is not used extensively near the site on 2013). Although unleaded gasoline has been used exten- the TP, emissions from coal combustion may have been trans- sively in China since 2005, a considerable portion of Pb in ported to the site from surrounding areas (e.g., East Asia; the environment is still associated with vehicle-related par- Li et al., 2016). This source contributed 12 %–17 % of pri- ticles, especially from the wear of metal alloys (Hao et al., mary babs (λ), which is less than that from biomass burning 2019). Therefore, this second source factor was identified or traffic emissions. The obtained AAE of coal combustion as traffic-related emissions. This source constitutes a mod- (AAEcoal = 1.1) was similar to the AAEtraffic , suggesting that erate percentage of primary babs (λ) (15 %–30 %). The es- BC was also the dominant light-absorbing carbon species in timated traffic-emission-related AAE (AAEtraffic ) was 0.8, coal combustion emissions. The AAEcoal was close to the consistent with the finding that BC is the dominant light- value of chunk coal combustion (1.3) but lower than that for absorbing carbonaceous aerosol species for traffic emis- briquettes of coal (2.6) (Sun et al., 2017); this presumably sions (Kirchstetter et al., 2004). The AAEtraffic found here reflects the types of coal transported to Gaomeigu, at least also was close to a value obtained using the 14 C approach to some degree. The estimated BC MAC(880) of coal com- (Zotter et al., 2017). The estimated MACBC (880) of traf- bustion (MACBC (880)coal = 15.5 m2 g−1 ) was larger than fic emissions (MACBC (880)traffic = 9.1 m2 g−1 ) was similar MACBC (880)biomass and MACBC (880)traffic . The enhance- Atmos. Chem. Phys., 21, 973–987, 2021 https://doi.org/10.5194/acp-21-973-2021
H. Liu et al.: Source contribution of black carbon in the southeastern margin of the Tibetan Plateau                              979

ment factor for MACBC (880)coal (3.3) falls near the up-           Table 1. Derived Ångström absorption exponents (AAEs), mass
per limit of this range noted above, and although this is          absorption coefficients (MACs) and percent source contribution of
likely related to the aging of BC particles during transport       black carbon (BC) from difference sources.
to Gaomeigu, more work is need to verify this contention in
future studies.                                                                 AAE        MAC      Mass concentration   Contribution
   The fourth source factor had high loadings of Ca (35 %),                             (m2 g−1 )            (µg m−3 )          ratio
Ti (66 %), Mn (47 %) and Fe (61 %), consistent with the char-       BCbiomass     1.7       10.4             0.4 ± 0.3          57 %
acteristics of crustal elements (Guo et al., 2009); thus, it was    BCtraffic     0.8        9.1                     –             –
assigned to soil dust. The light absorption of soil dust is         BCcoal        1.1       15.5                     –             –
                                                                    BCfossil      0.9       12.3             0.3 ± 0.2          43 %
mainly due to the presence of iron oxides and varies with the
types and relative concentrations of iron oxide species (Al-
faro, 2004; Valenzuela et al., 2015). The mineral dust here
contributed a relatively small amount to the primary babs (λ)      concentrations and contributions as listed in Table 1 show
(6 %–9 %), presumably due to the low levels of iron oxides,        higher mass concentrations of BCbiomass (0.4 ± 0.3 µg m−3 ,
and this is consistent with the other results obtained on the      57 % of total BC) compared with BCfossil (0.3 ± 0.2 µg m−3 ,
southeastern TP (Zhao et al., 2019). The estimated AAE of          43 % of total BC) on average. The mass fraction of BCbiomass
mineral dust (AAEdust ) was 1.5, which is within the range of      increased with the BC loadings, while BCfossil mass fraction
1.2–3.0 obtained from multiple non-oceanic sites (Dubovik          showed an inverse relationship to the loadings (Fig. S2). One
et al., 2002).                                                     can infer from this that biomass-burning emissions were re-
                                                                   sponsible for the high-BC-loading episode during the cam-
3.2   BC source apportionment                                      paign.
                                                                      Distinct diurnal variations in the mass concentrations of
As the results above show that fossil-fuel-related BC              BCbiomass and BCfossil were observed as shown in Fig. 4a.
aerosol mainly originated from traffic and coal combus-            The BCbiomass started to increase after midnight, reached
tion, the AAEfossil (0.9) and MACBC (880)fossil (12.3 m2 g−1 )     a small peak at ∼ 05:00 (all times given in local time:
were averaged by the values of AAEtraffic + AAEcoal                UTC+8) and then remained at a constant level before sun-
and MACBC (880)traffic + MACBC (880)coal , respectively, as        rise (∼ 08:00). This may be attributed to effects associ-
shown in Table 1. Based on the source-specific AAEs                ated with changes in the height of the planetary boundary
(i.e., AAEfossil and AAEbiomass ) and MACBC (880) (i.e.,           layer (PBL) (https://rda.ucar.edu/datasets/ds083.2, last ac-
MACBC (880)fossil and MACBC (880)biomass ), the mass con-          cess: 17 April 2020) (Fig. 4b). Thereafter, the BCbiomass in-
centrations of BCfossil and BCbiomass were then estimated us-      creased again and reached the maximum value at midday.
ing the improved aethalometer model (Eqs. 1–6). As shown           This enhancement was accompanied by an increase in PBL
in Fig. 3a, no correlation (r = 0.01, p = 0.02) was found          height and higher wind speed (https://rda.ucar.edu/datasets/
between BCbiomass and BCfossil , implying that BC from             ds083.2) (Fig. 4b). Generally, higher PBLs and stronger
these two sources was effectively separated by the improved        wind cause local pollutants to disperse and as a result lower
aethalometer model. The data for the biomass-burning and           their loadings (Wang et al., 2015). However, the buildup of
traffic-related tracers (levoglucosan and benzothiazolone, re-     BCbiomass in daytime at Gaomeigu was more likely influ-
spectively) further support the results of BC source appor-        enced by the transport of BCbiomass from regions upwind.
tionment. That is, BCbiomass was significantly correlated with     After sunrise, the PBL began to deepen, and that was ac-
levoglucosan (r = 0.75, p < 0.01; Fig. 3b), and the same           companied with west and southwest winds from 08:00 to
was true for BCfossil benzothiazolone (r = 0.67, p < 0.01;         12:00 (Fig. S3). These meteorological conditions are favor-
Fig. 3c), respectively. These results indicate that the source-    able for pollutant (including BC) transport from high-density
specific AAEs and MACs(880) obtained from optical source           biomass-burning emission areas to the sampling site (Chan
apportionment were appropriate                                     et al., 2017). After the midday peak, BCbiomass decreased
   Figure 3d shows a time series plot of hourly averaged           sharply until midnight. The initial portion of this decrease
mass concentrations of total BC, BCbiomass and BCfossil dur-       (13:00–18:00) occurred as the PBL height and wind speed in-
ing the campaign. The hourly total BC mass concentration           creased, which promoted the dispersion of BCbiomass . Subse-
varied ∼ 50-fold, from 0.1 to 4.9 µg m−3 , with an arithmetic      quent reduction occurred at night even though the PBL height
mean (± standard deviation) of 0.7 (±0.5) µg m−3 , which           and wind speed decreased, and that was likely due to the cur-
was lower than what has been reported for the western TP           tailment of local biomass-burning activities.
but higher than on the northern TP (Wang et al., 2018, and            As shown in Fig. 4a, the BCfossil showed a diurnal trend
references therein). The larger BC loading on the western          that was roughly opposite of that of the unimodal pattern
TP can be explained by relatively strong influences from           seen for BCbiomass , and that may be explained as follows.
Southeast Asia, where anthropogenic activities are intensive       Increases in the PBL height and wind speed from 09:00 to
(Kurokawa et al., 2013). With reference to BC sources, the         15:00 were associated with a decrease in BCfossil , unlike the

https://doi.org/10.5194/acp-21-973-2021                                                 Atmos. Chem. Phys., 21, 973–987, 2021
980 H. Liu et al.: Source contribution of black carbon in the southeastern margin of the Tibetan Plateau
Figure 3. Scatterplots of (a) biomass-burning black carbon (BCbiomass ) versus fossil fuel combustion BC (BCfossil ), (b) BCbiomass versus
levoglucosan and (c) BCfossil versus benzothiazolone. (d) Time series of hourly averaged mass concentrations of BCbiomass and BCfossil .
increasing trend seen for BCbiomass ; this presumably reflects were identified as polluted, suggesting minor influences from
minor effects from the regional transport on BCfossil . Fur- mainland China during the campaign.
ther, because of the small contribution of coal combustion The diurnal patterns of BCbiomass and BCfossil mass load-
to EC (12 %; Fig. 2c), the BCfossil was best explained by ings from the three clusters were used to investigate the im-
motor vehicle emissions from areas upwind of the site. The pacts of regional transport. As shown in Fig. 4c and e, sim-
subsequent increase in BCfossil from 17:00 to 20:00 was at- ilar diurnal variations in BCbiomass were found for Clusters
tributed to the reduction in PBL height and as a result the 1 and 2; they both had larger values during daytime (8:00–
buildup of pollutants in the near-surface air. As there were 12:00) compared with night. This pattern of higher daytime
minimal impacts from traffic at night, the BCfossil loadings BCbiomass was associated with regional transport from north-
remained steady from 21:00 to 08:00. The stable nocturnal eastern India (Cluster 1) and Burma (Cluster 2). For Clus-
BCfossil may reflect the impact of fossil fuel emissions on BC ter 3, BCbiomass decreased during the day and increased at
in the southeastern margin of the TP due to the accumulation night (Fig. 4g), and that pattern tracked the daily variations
resulting from the low PBL heights. in PBL height. Unlike Clusters 1 and 2, the diurnal varia-
tion in BCbiomass for Cluster 3 was more likely due to influ-
3.3 Regional influences of BCbiomass and BCfossil ences of biomass-burning activities from areas surrounding
the sampling site than regional transport. However, it should
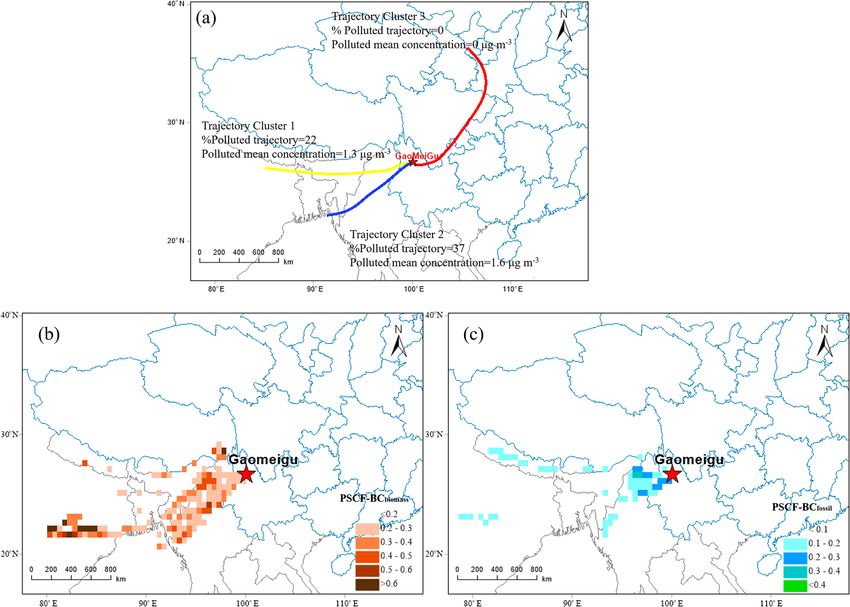
To investigate the regional impacts on BC, three groups of be noted that these cases were uncommon because only 2 %
air masses were identified based on their transport pathways of air masses were associated with Cluster 3.
(Fig. 5a). Cluster 1 originated from northeastern India and For BCfossil , similar diurnal patterns were found for Clus-
then passed over Bangladesh before arriving at Gaomeigu. ters 1 and 2 (Fig. 4c and e), most likely due to the influences
The average BC mass concentration of this cluster was the of traffic emissions from surrounding areas as well as daily
highest (0.8 ± 0.4 µg m−3 ) of the three clusters. About 74 % cycles of PBL height as discussed in Sect. 3.2. The BCfossil
of total trajectories were associated with Cluster 1, of which loadings of Cluster 3 (Fig. 4g) were relatively stable, show-
22 % were identified as polluted and had an average BC load- ing only sporadic fluctuations. Unlike the declining trend of
ing of 1.3 ± 0.5 µg m−3 . Cluster 2 originated over Burma and BCfossil during the daytime found for Clusters 1 and 2, the
had an average BC loading of 0.7 ± 0.7 µg m−3 . This clus- relatively stable BCfossil loadings in Cluster 3 indicate that
ter accounted for only 24 % of total trajectories, but among there were emissions from fossil fuel sources that offset the
them, about 37 % referred to pollution with BC reaching effect of the changes in PBL height. The transportation sec-
as high as 1.6 ± 0.9 µg m−3 . The air masses associated with tor has grown rapidly in mainland China (Liu, 2019), and the
Cluster 3 originated from the interior of China, and this group regional transport of motor vehicle emissions may have been
had the lowest BC mass concentrations of the three clus- the cause for the observed diurnal variations in BCfossil for
ters: 0.4 ± 0.1 µg m−3 . This third cluster was composed of Cluster 3.
a small fraction of total trajectories (2 %), and none of them
Atmos. Chem. Phys., 21, 973–987, 2021 https://doi.org/10.5194/acp-21-973-2021H. Liu et al.: Source contribution of black carbon in the southeastern margin of the Tibetan Plateau 981
Figure 4. Left panels: diurnal variations in hourly averaged black carbon (BC) aerosol from biomass burning (BCbiomass ) and fossil fuel
sources (BCfossil ). Right panels: wind speeds and planetary boundary layer (PBL) heights during the entire campaign and for different air
mass directions determined by air mass trajectory clusters 1–3.
The PSCF model was applied to further investigate the BCfossil were also found in northern Burma, indicating pos-
likely spatial distribution of pollution source regions for sible influences of fossil fuel emissions here.
BCbiomass and BCfossil . As shown in Fig. 5b, a low PSCF To further quantify the contributions of the BC transported
value of BCbiomass was found near Gaomeigu, while high from Southeast Asia to Gaomeigu, we studied a high-BC
values were concentrated in northeastern India and northern episode (23–27 March 2018) using a simulation with the
Burma, consistent with intensive fire activities in these ar- WRF-Chem model. Two scenarios of emissions were sim-
eas (Fig. S4). This indicates that large BCbiomass loadings ulated: one involved all BC emission sources, and the other
at Gaomeigu were more likely influenced by cross-border turned off biomass-burning emissions in Southeast Asia. The
transport of biomass burning rather than local emissions. For variation in modeled BC mass concentration shows an ac-
BCfossil (Fig. 5c), the most likely impact region was located ceptable degree of consistency with the measured values (r =
to the southwest of Gaomeigu, near where two highways 0.63, p < 0.01; Fig. S5), Furthermore, the index of agree-
are located (e.g., Hangzhou–Ruili Expressway and Dali– ment was estimated to be 0.77, indicating that the devel-
Nujiang Expressway). Owing to the low consumption of coal opment of this BC episode was effectively captured by the
on the southeastern TP (Li et al., 2016), the high PSCF val- WRF-Chem model. Nonetheless, the normalized mean bias
ues of BCfossil were more likely from traffic emissions than between the measured and modeled BC values was estimated
coal combustion. Moreover, sporadic high PSCF values of to be 24 %, suggesting that simulation was biased towards
high values. This discrepancy is best attributed to the uncer-
https://doi.org/10.5194/acp-21-973-2021 Atmos. Chem. Phys., 21, 973–987, 2021982 H. Liu et al.: Source contribution of black carbon in the southeastern margin of the Tibetan Plateau
Figure 5. Maps of (a) the mean trajectory clusters, (b) the potential source contribution function for black carbon (BC) aerosol from biomass
burning (BCbiomass ) and (c) from fossil fuel sources (BCfossil ).
tainties in the simulation associated with the emission inven- +1.6 ± 0.8 W m−2 at the TOA on average. At the SUF,
tory and meteorological conditions. Figure 6a shows the spa- BC DRE (−3.0 ± 1.5 W m−2 ) contributed nearly half of the
tial distributions of BC loadings in Gaomeigu and surround- PM2.5 DRE (−6.3 ± 4.5 W m−2 ). The difference in the DRE
ing areas. The mass concentrations of BC at times exceeded between the TOA and SUF was +4.6 ± 2.4 W m−2 for BC
15 µg m−3 over Burma and northern India, and that is more aerosol, and that accounted for 73 % of the DRE attributed to
than an order of magnitude higher compared with the south- PM2.5 (6.3 ± 4 W m−2 ); this suggests a substantial radiative
eastern margin of the TP (0.7 µg m−3 ). After turning off the effect caused by BC over the southeastern margin of the TP
biomass-burning emission source in Southeast Asia, the BC even though its mass fraction is small in PM2.5 (3.3 %).
loading at the southeastern TP dropped over 40 % (Fig. 6b), With respect to the BC sources (Fig. 7), the aver-
suggesting a substantial impact of biomass-burning activities age BCbiomass (BCfossil ) DRE was +0.8 ± 0.6 W m−2
in Southeast Asian countries, which is consistent with results (+0.7 ± 0.4 W m−2 ) at the TOA and −1.7 ± 1.2 W m−2
of the trajectory cluster analysis and PSCF. (−1.4 ± 0.6 W m−2 ) at the SUF. This is equivalent to
an average atmospheric DRE of +2.5 ± 1.8 W m−2
3.4 Radiative effects and heating rate (+2.1 ± 0.9 W m−2 ). Presumably, the influences of regional
transport caused the atmospheric DRE of BCbiomass to be
Figure 7 shows the average atmospheric direct radiative ef- more variable compared with that from BCfossil (Fig. S6).
fects of PM2.5 and BC (including BCbiomass and BCfossil ) For example, the atmospheric DRE of BCbiomass can be
at the TOA and SUF during the campaign. The average as high as +6.4 W m−2 when the air masses passed over
PM2.5 DRE at the TOA was +0.03 ± 1.1 W m−2 , imply- the biomass-burning regions in Southeast Asia, while it
ing that the positive effect of light-absorbing carbon on was only 1.1 ± 0.2 W m−2 on average when the air masses
the temperature of the atmosphere outweighed the neg- passed from the mainland of China.
ative effect of scattering aerosols. In fact, BC produced
Atmos. Chem. Phys., 21, 973–987, 2021 https://doi.org/10.5194/acp-21-973-2021H. Liu et al.: Source contribution of black carbon in the southeastern margin of the Tibetan Plateau 983
Figure 6. (a) Spatial distributions of simulated aerosol black carbon (BC) mass concentrations over Southeast Asia and (b) the percentage
of mass contributions of biomass-burning BC (BCbiomass ) in peninsular Southeast Asia (PSEA). The simulated surface winds are overlaid in
(a).
tration of BC in this region was (0.19 (K d−1 ) (µg m−3 )−1 ),
which is roughly comparable with that reported for Qing-
hai Lake, on the northeastern TP (0.13 (K d−1 ) (µg m−3 )−1 )
(Wang et al., 2015), but it is generally lower than the values
in the southwestern regions of the Himalaya (Fig. S7). More-
over, the heating rate caused by BCbiomass may have been
slightly higher (0.07 ± 0.05 K d−1 ) compared with BCfossil
(0.06 ± 0.02 K d−1 ). Finally, the heating rate of BCbiomass in-
creased to 0.16 K d−1 when the BC mass concentration was
heavily influenced by the polluted air from Southeast Asia.
4 Conclusions
This study quantified the source contributions of BC aerosol
from fossil fuel and biomass burning at a site on the south-
eastern margin of the TP that represents a regional trans-
port channel for air pollution during the pre-monsoon. The
Figure 7. The average atmospheric direct radiative effects (DREs) study was conducted in the pre-monsoon when the southeast-
of total black carbon (BC); BC from biomass burning (BCbiomass ) ern TP was heavily influenced by the air mass from South-
and fossil fuel (BCfossil ); and PM2.5 at the Earth’s surface (SUF), east Asia. To reduce the uncertainties caused by interfer-
the top of the atmosphere (TOA) and in the atmosphere (ATM = ences in absorption measurements (i.e. secondary absorption
TOA − SUF). and dust) and assumptions relative to AAEs and MACBC s,
the traditional aethalometer model was optimized in two as-
pects. First, a BC-tracer method coupled with a minimum
The calculations showing a positive atmospheric DRE im- R-squared approach was applied to separate secondary ab-
ply that energy was trapped in the atmosphere, which would sorption from the total absorption, and as a result, the inter-
lead to atmospheric heating over the study region. The heat- ferences of absorption from secondary aerosols have been
ing rate calculated for BC varied from 0.02 to 0.3 K d−1 and eliminated. Then, an optical-source-apportionment model
yielded an average of 0.13 ± 0.07 K d−1 . In terms of the DRE that used primary multi-wavelength absorption and chemi-
efficiency, the heating rate caused by a unit mass concen- cal species as inputs was used to derive site-dependent AAE
https://doi.org/10.5194/acp-21-973-2021 Atmos. Chem. Phys., 21, 973–987, 2021984 H. Liu et al.: Source contribution of black carbon in the southeastern margin of the Tibetan Plateau
and MACBC values; these minimize the uncertainties as- XDB40000000), and the Youth Innovation Promotion Association
sociated with prior assumptions on these parameters. The of the Chinese Academy of Sciences (grant no. 2019402).
AAE (MACBC ) calculated in this way was 0.9 (12.3 m2 g−1 )
for fossil fuel source and 1.7 (10.4 m2 g−1 ) for biomass
burning. The results of aethalometer model that used these Review statement. This paper was edited by Jianping Huang and
values showed that the average mass concentration of BC reviewed by Laura Gallardo and one anonymous referee.
was 0.7 ± 0.5 µg m−3 , of which 43 % was BC from fossil
fuel, and 57 % was from biomass burning. Trajectory anal-
ysis showed that the BCbiomass over the site was mainly References
driven by regional transport from northeastern India and
Burma, while BCfossil was primarily influenced by traffic Alfaro, S. C.: Iron oxides and light absorption by pure desert dust:
emissions from areas surrounding the sampling site. More- An experimental study, J. Geophys. Res.-Atmos., 109, D08208,
over, the WRF-Chem model indicates that biomass burn- https://doi.org/10.1029/2003jd004374, 2004.
ing in Southeast Asia contributes 40 % of the BC loading Bond, T. C. and Bergstrom, R. W.: Light absorption by carbona-
over the southeastern margin of the TP. The SBDART model ceous particles: An investigative review, Aerosol. Sci. Tech., 40,
27–67, https://doi.org/10.1080/02786820500421521, 2006.
showed a DRE of +4.6 ± 2.4 W m−2 for the total PM2.5
Bond, T. C., Doherty, S. J., Fahey, D. W., Forster, P. M., Berntsen,
BC, of which +2.5 ± 1.8 W m−2 was from BCbiomass and T., DeAngelo, B. J., Flanner, M. G., Ghan, S., Kärcher, B., Koch,
+2.1 ± 0.9 W m−2 from BCfossil . The results of this study D., Kinne, S., Kondo, Y., Quinn, P. K., Sarofim, M. C., Schultz,
provide useful information concerning the sources of BC M. G., Schulz, M., Venkataraman, C., Zhang, H., Zhang, S.,
over an atmospheric transport channel to the southeastern TP, Bellouin, N., Guttikunda, S. K., Hopke, P. K., Jacobson, M.
and they highlight the importance of the cross-border trans- Z., Kaiser, J. W., Klimont, Z., Lohmann, U., Schwarz, J. P.,
port of biomass-burning emissions from Southeast Asia to Shindell, D., Storelvmo, T., Warren, S. G., and Zender, C. S.:
the region during the pre-monsoon. Bounding the role of black carbon in the climate system: A sci-
entific assessment, J. Geophys. Res.-Atmos., 118, 5380–5552,
https://doi.org/10.1002/jgrd.50171, 2013.
Data availability. The data presented in this study are available Cao, J., Tie X., Xu B., Zhao, Z., Zhu, C., Li, G., and Liu,
at the Zenodo data archive https://doi.org/10.5281/zenodo.4452056 S.: Measuring and modelling black carbon (BC) contamina-
(Liu et al., 2021). tion in the SE Tibetan Plateau, J. Atmos. Chem., 67, 45–60,
https://doi.org/10.1007/s10874-011-9202-5, 2010.
Cao, J.-J., Zhu, C.-S., Tie, X.-X., Geng, F.-H., Xu, H.-M., Ho, S. S.
H., Wang, G.-H., Han, Y.-M., and Ho, K.-F.: Characteristics and
Supplement. The supplement related to this article is available on-
sources of carbonaceous aerosols from Shanghai, China, Atmos.
line at: https://doi.org/10.5194/acp-21-973-2021-supplement.
Chem. Phys., 13, 803–817, https://https://doi.org/10.5194/acp-
13-803-2013, 2013.
Carrico, C. M., Gomez, S. L., Dubey, M. K., and Aiken, A. C.:
Author contributions. QW and JC designed the study. WR con- Low hygroscopicity of ambient fresh carbonaceous aerosols
ducted the field measurements. LX provided the results of the WRF- from pyrotechnics smoke, Atmos. Environ., 178, 101–108,
Chem model. YZ and TZ performed the chemical analysis of filters. https://doi.org/10.1016/j.atmosenv.2018.01.024, 2018.
HL and QW wrote the article. All the authors reviewed and com- Chan, C. Y., Wong, K. H., Li, Y. S., Chan, Y., and Zhang, X.
mented on the paper. D.: The effects of Southeast Asia fire activities on tropospheric
ozone, trace gases and aerosols at a remote site over the Ti-
betan Plateau of Southwest China, Tellus B, 58B, 310–318,
Competing interests. The authors declare that they have no conflict https://doi.org/10.1111/j.1600-0889.2006.00187.x, 2017
of interest. Chen, B., Bai, Z., Cui, X., Chen, J., Andersson, A., and Gustafsson,
O.: Light absorption enhancement of black carbon from urban
haze in Northern China winter, Environ. Pollut., 221, 418–426,
Acknowledgements. The authors are grateful to the staff from Li- https://doi.org/10.1016/j.envpol.2016.12.004, 2017.
jiang Astronomical Station for their assistance with field sampling. Cheng, M.-D. and Lin, C.-J.: Receptor modelling for smoke of 1998
The authors are also grateful for the helpful comments from the ed- biomass burning in Central America, J. Geophys. Res.-Atmos.,
itor and two referees. 106, 22871–22886, https://doi.org/10.1029/2001jd900024,
2001.
Cheng, Y., Li, S., and Leithead, A.: Chemical characteristics and
Financial support. This work was supported by the National Nat- origins of nitrogen-containing organic compounds in PM2.5
ural Science Foundation of China (grant no. 41877391), the aerosols in the lower fraser valley, Environ. Sci. Technol., 40,
Second Tibetan Plateau Scientific Expedition and Research Pro- 5846–5852, https://doi.org/10.1021/es0603857, 2006.
gram (STEP) (grant no. 2019QZKK0602), the Strategic Priority Collaud Coen, M., Weingartner, E., Apituley, A., Ceburnis, D.,
Research Program of Chinese Academy of Sciences (grant no. Fierz-Schmidhauser, R., Flentje, H., Henzing, J. S., Jennings, S.
G., Moerman, M., Petzold, A., Schmid, O., and Baltensperger,
Atmos. Chem. Phys., 21, 973–987, 2021 https://doi.org/10.5194/acp-21-973-2021H. Liu et al.: Source contribution of black carbon in the southeastern margin of the Tibetan Plateau 985 U.: Minimizing light absorption measurement artifacts of the and source apportionment of fossil fuel and biomass burn- Aethalometer: evaluation of five correction algorithms, Atmos. ing black carbon in Ontario, Atmos. Environ., 161, 34–47, Meas. Tech., 3, 457–474, https://https://doi.org/10.5194/amt-3- https://doi.org/10.1016/j.atmosenv.2017.04.034, 2017. 457-2010, 2010. Helin, A., Niemi, J. V., Virkkula, A., Pirjola, L., Teinilä, Cong, Z., Kang, S., Kawamura, K., Liu, B., Wan, X., Wang, K., Backman, J., Aurela, M., Saarikoski, S., Rönkkö, Z., Gao, S., and Fu, P.: Carbonaceous aerosols on the T., Asmi, E., and Timonen, H.: Characteristics and south edge of the Tibetan Plateau: concentrations, season- source apportionment of black carbon in the Helsinki ality and sources, Atmos. Chem. Phys., 15, 1573–1584, metropolitan area, Finland, Atmos. Environ., 190, 87–98, https://https://doi.org/10.5194/acp-15-1573-2015, 2015. https://doi.org/10.1016/j.atmosenv.2018.07.022, 2018. Draxler, R. and Hess, G.: An overview of the HYSPLIT_4 mod- Herich, H., Hueglin, C., and Burchmann, B.: A 2.5 year’s source ap- elling system for trajectories, Aust. Meteorol. Mag., 47, 295– portionment study of black carbon from wood burning and fossil 308, 1998. fuel combustion at urban and rural sites in Switzerland, Atmos. Drinovec, L., Močnik, G., Zotter, P., Prévôt, A. S. H., Ruck- Meas. Tech., 4, 1409–1420, https://doi.org/10.5194/amt-4-1409- stuhl, C., Coz, E., Rupakheti, M., Sciare, J., Müller, T., Wieden- 2011, 2011. sohler, A., and Hansen, A. D. A.: The “dual-spot” Aethalome- Hess, M., Koepke, P., and Schult, I.: Optical properties of ter: an improved measurement of aerosol black carbon with real- aerosols and clouds: The software package OPAC, B. Am. time loading compensation, Atmos. Meas. Tech., 8, 1965–1979, Meteorol. Soc., 79, 831–844, https://doi.org/10.1175/1520- https://https://doi.org/10.5194/amt-8-1965-2015, 2015. 0477(1998)0792.0.Co;2, 1998. Dubovik, O., Holben, B., Eck, T. F., Smirnov, A., Kauf- Hsu, C.-Y., Chiang, H.-C., Lin, S.-L., Chen, M.-J., Lin, T.- man, Y. J., King, M. D., Tanré, D., and Slutsker, I.: Y., and Chen, Y.-C.: Elemental characterization and source Variability of absorption and optical properties of key apportionment of PM10 and PM2.5 in the western coastal aerosol types observed in worldwide locations, J. At- area of central Taiwan, Sci. Total Environ., 541, 1139–1150, mos. Sci., 59, 590–608, https://doi.org/10.1175/1520- https://doi.org/10.1016/j.scitotenv.2015.09.122, 2016. 0469(2002)0592.0.CO;2, 2002. Hua, S., Liu, Y., Luo, R., Shao, T., and Zhu, Q.: Inconsis- Dumka, U. C., Kaskaoutis, D. G., Tiwari, S., Safai, P. D., Attri, S. tent aerosol indirect effects on water clouds and ice clouds D., Soni, V. K., Singh, N., and Mihalopoulos, N.: Assessment over the Tibetan Plateau, Int. J. Climatol., 40, 3832–3848, of biomass burning and fossil fuel contribution to black carbon https://doi.org/10.1002/joc.6430, 2019. concentrations in Delhi during winter, Atmos. Environ., 194, 93– Kim, E. and Hopke, P. K.: Source characterization of ambient fine 109, https://doi.org/10.1016/j.atmosenv.2018.09.033, 2018. particles at multiple sites in the Seattle area, Atmos. Environ., Forello, A. C., Bernardoni, V., Calzolai, G., Lucarelli, F., Massabò, 42, 6047–6056, https://doi.org/10.1016/j.atmosenv.2008.03.032, D., Nava, S., Pileci, R. E., Prati, P., Valentini, S., Valli, G., and 2008. Vecchi, R.: Exploiting multi-wavelength aerosol absorption coef- Kirchstetter, T. W., Novakov, T., and Hobbs, P. V.: Evidence that the ficients in a multi-time resolution source apportionment study to spectral dependence of light absorption by aerosols is affected retrieve source-dependent absorption parameters, Atmos. Chem. by organic carbon, J. Geophys. Res.-Atmos., 109, D21208, Phys., 19, 11235–11252, https://https://doi.org/10.5194/acp-19- https://doi.org/10.1029/2004jd004999, 2004. 11235-2019, 2019. Koch, D., Schulz, M., Kinne, S., McNaughton, C., Spackman, J. Guo, H., Ding, A. J., So, K. L., Ayoko, G., Li, Y. S., R., Balkanski, Y., Bauer, S., Berntsen, T., Bond, T. C., Boucher, and Hung, W. T.: Receptor modelling of source apportion- O., Chin, M., Clarke, A., De Luca, N., Dentener, F., Diehl, T., ment of Hong Kong aerosols and the implication of urban Dubovik, O., Easter, R., Fahey, D. W., Feichter, J., Fillmore, and regional contribution, Atmos. Environ., 43, 1159–1169, D., Freitag, S., Ghan, S., Ginoux, P., Gong, S., Horowitz, L., https://doi.org/10.1016/j.atmosenv.2008.04.046, 2009. Iversen, T., Kirkevåg, A., Klimont, Z., Kondo, Y., Krol, M., Liu, Han, H., Wu, Y., Liu, J., Zhao, T., Zhuang, B., Wang, H., Li, Y., X., Miller, R., Montanaro, V., Moteki, N., Myhre, G., Penner, Chen, H., Zhu, Y., Liu, H., Wang, Q., Li, S., Wang, T., Xie, J. E., Perlwitz, J., Pitari, G., Reddy, S., Sahu, L., Sakamoto, H., M., and Li, M.: Impacts of atmospheric transport and biomass Schuster, G., Schwarz, J. P., Seland, Ø., Stier, P., Takegawa, N., burning on the inter-annual variation in black carbon aerosols Takemura, T., Textor, C., van Aardenne, J. A., and Zhao, Y.: Eval- over the Tibetan Plateau, Atmos. Chem. Phys., 20, 13591–13610, uation of black carbon estimations in global aerosol models, At- https://doi.org/10.5194/acp-20-13591-2020, 2020. mos. Chem. Phys., 9, 9001–9026, https://doi.org/10.5194/acp-9- Hao, Y., Gao, C., Deng, S., Yuan, M., Song, W., Lu, Z., 9001-2009, 2009. and Qiu, Z.: Chemical characterisation of PM2.5 emitted Kurokawa, J., Ohara, T., Morikawa, T., Hanayama, S., Janssens- from motor vehicles powered by diesel, gasoline, natural Maenhout, G., Fukui, T., Kawashima, K., and Akimoto, H.: gas and methanol fuel, Sci. Total Environ., 674, 128–139, Emissions of air pollutants and greenhouse gases over Asian re- https://doi.org/10.1016/j.scitotenv.2019.03.410, 2019. gions during 2000–2008: Regional Emission inventory in ASia Harrison, R. M., Beddows, D. C. S., Hu, L., and Yin, J.: Compar- (REAS) version 2, Atmos. Chem. Phys., 13, 11019–11058, ison of methods for evaluation of wood smoke and estimation https://doi.org/10.5194/acp-13-11019-2013, 2013. of UK ambient concentrations, Atmos. Chem. Phys., 12, 8271– Lack, D. A. and Cappa, C. D.: Impact of brown and clear car- 8283, https://doi.org/10.5194/acp-12-8271-2012, 2012. bon on light absorption enhancement, single scatter albedo Healy, R. M., Sofowote, U., Su, Y., Debosz, J., Noble, M., and absorption wavelength dependence of black carbon, At- Jeong, C. H., Wang, J. M., Hilker, N., Evans, G. J., Doerk- mos. Chem. Phys., 10, 4207–4220, https://doi.org/10.5194/acp- sen, G., Jones, K., and Munoz, A.: Ambient measurements 10-4207-2010, 2010. https://doi.org/10.5194/acp-21-973-2021 Atmos. Chem. Phys., 21, 973–987, 2021
You can also read