Exploring Environmental Kuznets Curves of Kitakyushu: 50-year Time-series Data of the OECD SDGs Pilot City 1 - PhilArchive
←
→
Page content transcription
If your browser does not render page correctly, please read the page content below
Exploring Environmental Kuznets Curves of Kitakyushu: 50-year Time-series
 Data of the OECD SDGs Pilot City 1

 Quan-Hoang Vuong
 Centre for Interdisciplinary Social Research, Phenikaa University
 Yen Nghia Ward, Ha Dong District, Hanoi, 100803, Vietnam

 Manh-Tung Ho
 Centre for Interdisciplinary Social Research, Phenikaa University
 Yen Nghia Ward, Ha Dong District, Hanoi, 100803, Vietnam

 Hong-Kong To Nguyen
 Graduate School of Asia Pacific Studies, Ritsumeikan Asia Pacific University, 874-8577, Japan
 Vuong & Associates, 3/161 Thinh Quang, Dong Da District, Hanoi, 100000, Vietnam

 Minh-Hoang Nguyen
 Centre for Interdisciplinary Social Research, Phenikaa University
 Yen Nghia Ward, Ha Dong District, Hanoi, 100803, Vietnam

 (*) Correspondence: hoang.vuongquan@phenikaa-uni.edu.vn

Abstract
Can green growth policies help protect the environment while keeping the industry growing and
infrastructure expanding? The City of Kitakyushu, Japan, has actively implemented eco-friendly
policies since 1967 and recently inspired the pursuit of sustainable development around the
world, especially in the Global South region. However, empirical studies on the effects of green
growth policies are still lacking. This study explores the relationship between road infrastructure
development and average industrial firm size with air pollution in the city through the
Environmental Kuznets Curve (EKC) hypothesis. Auto-Regressive Distributed Lag (ARDL) and
Non-linear Auto-Regressive Distributed Lag (NARDL) methods were applied on nearly 50-years’
time series data, from 1967 to 2015. The results show that the shape of the EKC of industrial
growth, measured by average firm size, depends on the type of air pollution: inverted N-shaped
relationships with NO2 and CO, and the U-shaped relationships with falling dust particle and Ox.
Regarding infrastructure development, on the one hand, our analysis shows a positive effect of
road construction on alleviating the amount of falling dust and CO concentration. On the other
hand, the emissions of NO2 and Ox are shown to rise when plotted against road construction. The

1
 This is the working draft of an accepted manuscript with Palgrave Communications (Nature Research). For proper
referencing, please use the following suggested citation:

 Vuong QH, Ho MT, Nguyen HKT, Nguyen MH. (2019). The trilemma of sustainable industrial growth:
 Evidence from a piloting OECD’s Green city. Palgrave Communications 5; DOI: 10.1057/s41599-019-
 0369-8; https://www.nature.com/articles/s41599-019-0369-8.

decline of CO emission, when plotted against both industrial growth and road development,
indicates that the ruthlessness of the local government in pursuing green growth policies is
effective in this case. However, the story is not straightforward when it comes to other air
pollutants, which hint at limits in the current policies. The case of Kitakyushu illustrates the
complex dynamics of the interaction among policy, industry, infrastructure, and air pollution. It
can serve as an important reference point for other cities in the Global South when policies are
formed, and progress is measured in the pursuit of a green economy. Finally, as an OECD SDGs
pilot city and the leading Asian green-growth city, policymakers in Kitakyushu city are
recommended to revise the data policy to enhance the findability and interoperability of data as
well as to invest in the application of big data.
Keywords: air pollution reduction; industrial growth; infrastructure development;
Environmental Kuznets Curve; green growth; green economy; urban studies; sustainability; non-
linear ARDL; Global South.
Version: #5; November 29, 2019

 A contribution paper for

 The ASEAN Conference of Young Scientists 2019

 Hanoi, December 2, 2019.
Introduction
Until now, Earth is the only known planet that shelters life, and this life is under threat (Wallace-
Wells, 2019). Nonetheless, many who are in power are not willing to act to protect it. In a recent
discovery, the Trump Administration tried to block a State Department senior intelligence
analyst to give testimony on climate change (Friedman, 2019). However, on the other side of the
globe, the City of Kitakyushu, Japan, with governmental support, has been pursuing
environment-friendly industrial policies since 1967 (Low, 2013), and in 2011, it was selected by
OECD to be among four Green Growth Cities in the world besides Paris, Stockholm, and
Chicago (City of Kitakyushu, 2018). Kitakyushu city is also the inspiration of other cities in the
Global South, such as Hai Phong – Vietnam and Surabaya – Indonesia, in pursuing sustainable
development (Japan for Sustainability, 2013). This article presents striking results that could help
evaluate the long-term impacts of the green growth policies in Kitakyushu on the relationship
between industrial growth and infrastructure development with ambient air emissions.
 The Environmental Kuznets Curve (EKC) hypothesis, grounded on the commonly
assumed idea of “growth first, clean later” (Kijima et al., 2010; Özokcu and Özdemir, 2017), is
relatively well-known among the theories that seek to explain the interaction between economic
development and environmental degradation. This study explores the EKC of industrial growth
(measured by average industrial firm size) and air pollution, as well as road infrastructure
development (measured by the total area of paved road) and air pollution. The five ambient air
pollutants being studied are falling dust, SOx, NO2, Ox, and CO. The primary anthropogenic
sources of these air pollutants include fossil fuel and biofuel combustion resulting from energy
generation, transport, and industry (Anenberg et al., 2018; Lamsal et al., 2013; Lelieveld et al.,
2015; Zhong et al., 2017). Air pollution is not only responsible for the death of more than four
million people globally (WHO, 2019) but is also linked to climate change, which has disrupted
almost every aspect of human existence (Barnes et al., 2019; Mora et al., 2018). Besides the
direct effects of the greenhouse gases, CO can indirectly intensify climate change through
prolonging the lifetime of GHGs, oxidizing into CO2, and reacting with NOx and volatile
organic compounds to form tropospheric ozone (Daniel and Solomon, 1998; Strode et al., 2015).
 Since the first empirical results of the EKC (Grossman and Krueger, 1991; Panaĭotou,
1993; Shafik and Bandyopadhyay, 1992), the debate around the hypothesis has become more
controversial with evidence on both sides (Crespo Cuaresma et al., 2017; Ota, 2017; Özokcu and
Özdemir, 2017). In the literature of EKC, real GDP and GDP per capita are the most frequently
used economic indicators to explore the EKC in all types of data, from panel data (Ge et al.,
2018; Narayan and Narayan, 2010; Ozcan, 2013; Sharma, 2011; Sinha and Bhattacharya, 2016),
to time-series (Ahmad et al., 2017; Ali et al., 2017; Bölük and Mert, 2015; Rafindadi, 2016) and
cross-sectional data (Hill and Magnani, 2002). However, there appears a scarcity of studies done
on the EKC of industrial growth, despite the fact that industrial growth contributes substantially
to economic growth and exert major effects on environmental degradation. Some recent studies
include those of Abokyi et al. (2019) examining the EKC of industrial growth in Ghana by using
Industry value-added, and Wang & Wang (2019) validating the EKC of industrial agglomeration
in China. Thus, the current study presents a new light on the EKC hypothesis – the average size
of industrial firms, which is a completely new area of exploration to the best of our knowledge.
The finding from this study is also expected to fill in the gap lacking insights from
microeconomic behavior in the literature of EKC (Kijima et al., 2010).
 Another factor that might significantly affect the level of air pollution is the development
of infrastructure. Infrastructure is the backbone of any country; with a well-planned design, the
infrastructure expansion can contribute to sustainable development; otherwise, it will result in
negative consequences on society and the environment (Thacker et al., 2019). On the one hand,
the expansion of high-quality roads may result in an increase in traveling demand (Cervero,
2003). On the other hand, building more high-quality roads will help enhance manufacturing
productivity through increasing accessibility (Duran-Fernandez and Santos, 2014; Gibbons et al.,
2019). Moreover, expanding road infrastructure was believed to reduce air pollution by cutting
down the time of vehicles on the road as well as frequent acceleration and deceleration due to
traffic congestion (Zhang and Batterman, 2013). Therefore, we believe the expansion of high-
quality road might have significant effects on air pollution emissions, especially in the case of a
recycling-industrial city like the present one – Kitakyushu city, Japan.
 Unlike previous studies testing the EKC without noticing when the first environmental
regulation took place, our study only concentrates on the time period from 1967, when
Kitakyushu city first signed a pollution prevention agreement with the private sectors (Holroyd,
2018), to 2015 (City of Kitakyushu, n.d.). In this way, we can evaluate the effectiveness of green
growth policies and environmental legislation in Kitakyushu city. Moreover, the current study
also tests the EKC by a new approach: examining the relationship of air pollution emissions
(measured by the emissions per capita of falling dust particle, SOx, NO2, CO, and Ox) with the
average industrial firm size total area of the paved road by employing ARDL and NARDL
analyses.

Methods and Materials
Study site
This study selected Kitakyushu city as a study site for several reasons. First, Kitakyushu city is a
green-growth oriented city through recycling activities, and its experiences can be generalized in
other areas. Besides being featured as one of four green growth cities in the world besides Paris,
Chicago, and Stockholm, Kitakyushu city was also selected as a pilot city for OECD’s Territorial
Approach to the Sustainable Development Goals project (City of Kitakyushu, 2018). Moreover,
the city has received major national designations such as Eco-Town in 1997, Eco-Model-City in
2008, Smart Community Project in 2010, Future City Initiative in 2011, “Green Asia”
Comprehensive Special Zone in 2011 (OECD, 2013), as well as other international recognitions
(City of Kitakyushu, 2018). Thus, the results from this study could be viewed as a reference for
other cities and regions within and outside of Japan, especially in the Global South, where many
countries have close connections and collaboration with Japan, to achieve the Sustainable
Development Goals.
 Second, Kitakyushu city is an outstanding example of the impact of stringent
environmental regulations and control on improving environmental quality. “The seven-colored
smoke”, which was created by dust and sulfur dioxide, was previously considered as a symbol of
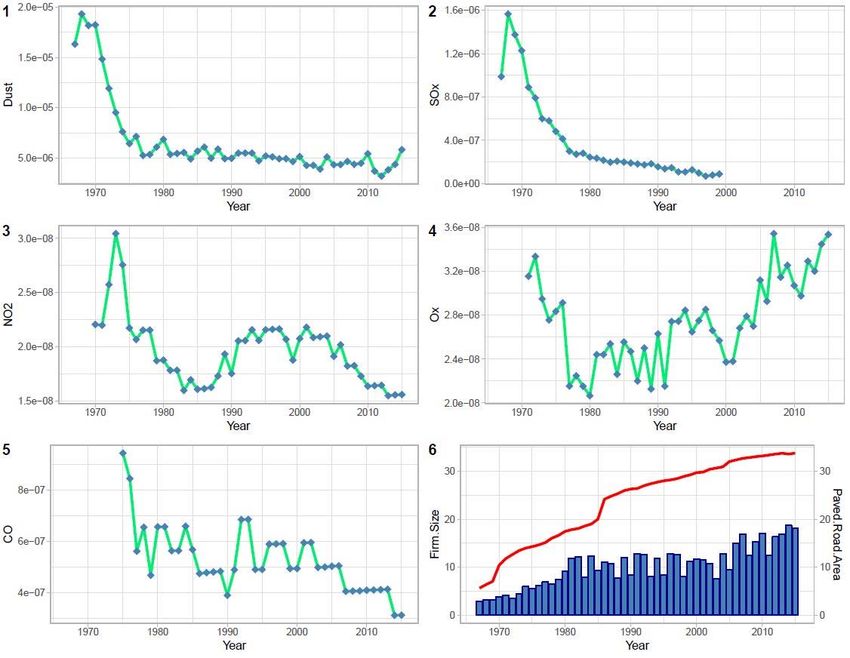
prosperity, especially after Kitakyushu was selected as one of four key-driven areas including
Tokyo, Nagoya, Osaka, and Kitakyushu, to form a “Pacific Belt Zone” in order to reconstruct the
Japan economy after the wartime (Yoshioka and Kawasaki, 2016). However, because of the
public pressure and political competition from the Communist party with its environmental-
friendly agenda, local authority and private sector had to reach a general compromise by the first
pollution control agreement in 1967 (Fujikura, 2007). The more “comprehensive, systematic, and
steady” environmental control system in Kitakyushu after the agreement made it become
introduced in the 1985 OECD’s White paper on the environment as an outstanding
transformation from a “city of gray” to a “city of green” (The World Bank, 1996).
Data and variables
Our analysis examines the non-linear relationship between the average industrial firm size and
air pollution, and linear relationship between the total area of paved road and air pollution in
Kitakyushu city employing the dataset between 1967 and 2015. However, the data of some air
pollutants had a shorter time span; for example, the concentration of NO2 per capita only ranged
from 1970 to 2015. The dataset consists of seven types of data, namely: the amount of falling
dust particle, the concentration of SOx, NO2, Ox, and CO per capita, the average size of an
industrial firm, and the total area of paved road.
Dependent variables
The data of air pollution were retrieved from Section 16: Hygiene, Environment, and Pollution in
the Longitudinal Statistics database of the City of Kitakyushu (City of Kitakyushu, n.d.). The
dataset included the amount of falling dust particles, the concentration of SOx, NO2, Ox, and CO.
We later divided the air pollutants’ emission by the population in Kitakyushu to achieve the air
pollutants’ emission per capita (see Figure 1.1 – 1.5). The population statistics were drawn from
Section 2: Population (City of Kitakyushu, n.d.). The time period, measuring unit, and other
details of each air pollutants’ emission per capita is displayed in Table 1. All dependent variables
were later logarithm transformed to ensure the normality of the dependent variable, represented
by adding “ln” in front of the variable. For example, “lnDustper” illustrates the logarithm of the
amount of falling dust per capita.
Table 1: Dependent variables
 Year Air pollutants Variable Measuring unit Description
 Falling Dust The amount of falling
 1967 – 2015 Dustper ton/km2/month/person
 Particles dust particle per capita
 The concentration of
 1970 – 2015 Nitrogen dioxide NO2per ppm/person
 NO2 per capita
 Photochemical The concentration of Ox
 1971 – 2015 Oxper ppm/person
 Oxidant per capita
 The concentration of CO
 1975 – 2015 Carbon Monoxide COper ppm/person
 per capita
 The concentration of
 1967 – 1999 Sulfur Oxides SOxper mg/100 cm2/day/person
 SOx per capita
Independent variables
There are four independent variables in the current study. The first three independent variables
are the logarithm of the average industrial firm size, its quadratic, and cubic forms. Those three
independent variables are illustrated by “lnFirmsize”, “lnFirmsize2” and “lnFirmsize3”
respectively. The average industrial firm size is calculated by dividing the total shipment value
of manufactured goods of industrial firms by the number of industrial firms in Kitakyushu city.
The data were taken from Section 5: Industry in the Longitudinal Statistics database (City of
Kitakyushu, n.d.). The initial measuring unit of total shipment value was million JPY but was
exchanged to million US dollars using the constant rate in May 2019 (1 US dollar = approximate
110 JPY).

Figure 1: Air pollution, average industrial firm size, and total paved road area
 1.1. The amount of falling dust per capita plotting from 1967 to 2015

 1.2. The concentration of SOx per capita plotting from 1967 to 1999

 1.3. The concentration of NO2 per capita plotting from 1970 to 2015

 1.4. The concentration of Ox per capita plotting from 1971 to 2015

 1.5. The concentration of CO per capita plotting from 1975 to 2015
1.6. The average industrial firm size (blue column) and the total area of paved road (red line) plotting from 1967 to
 2015

 Another independent variable is “Road”, which represents the total area of the paved
road being built within the city area. The variable was later logarithm transformed and presented
as “lnRoad”. The data were available from 1967 to 2015 in section 14: Construction and
Housing (City of Kitakyushu, n.d.). The measuring unit of the total area of the paved road is km2.
The data of the average industrial firm size and total paved road area are presented by the blue
column and red line, respectively, in Figure 1.6.
Models
In this study, the reduced-form function was chosen to test the shape of the relationship between
air pollution and the average firm’s size, along with the impact of road density because of several
reasons. First, the reduced-form function is more comfortable to apply than other non-linear
functional forms or non-parametric and semi-parametric models. Second, some drawbacks of the
parametric method cannot be solved by applying another type of methods, such as the use of
spline or semiparametric methods (Özokcu and Özdemir, 2017). Third, the reduced-form has
been widely used to test the EKC in various relationships between income and environmental
degradation (Kijima et al., 2010).
We formulated our reduced-form function as linear, quadratic, and cubic equations according to
previous works (Shafik and Bandyopadhyay, 1992; Grossman and Krueger, 1995; Panayotou,
1997; De Bruyn, 1997; Dinda, 2004; Galeotti and Lanza, 2005; Akbostancı et al., 2009; Özokcu
and Özdemir, 2017) as follows respectively:
 ln = + ln + ln + (1.1)

 ln = + ln + ln 2 + ln + (1.2)

 ln = + ln + ln 2 + ln 3 +

 ln + (1.3)

 It is notable that ln represents all air pollutants emission per capita, which
were log-transformed.
 The statistical model utilized in our analysis was Auto-regressive Distributed Lag
(ARDLs) created by Pesaran, Shin, & Smith (Pesaran et al., 2001) to examine the cointegration
between a dependent variable and a set of independent variables for several reasons. First, the
ARDL model has been widely used across disciplines for almost two decades to model
relationships based on time-series analysis (Kripfganz and Schneider, 2016). Second, the ARDL
encompasses other cointegration models (Engle and Granger, 1987; Johansen, 1988; Phillips and
Hansen, 1990) in terms of feasibility: (1) ARDL is employable if the variables are stationary at
the level form, the first difference, or the mixture of both. Second, the ARDL model can provide
unbiased results for a small sample size that has been verified by Monte Carlo simulations
(Ahmad et al., 2017; Pesaran and Shin, 1999). Third, the ARDL model can fit well with
endogenous variables, because it can solve the problem of endogeneity by selecting correct lag
length for the variable and increasing the model dynamic (Pesaran and Shin, 1999). Lastly, the
ARDL model provides not only an explanation for the long-run relationship but also look at the
short-run dynamics through a simple linear function based on the Error Correction Mechanism
(ECM).
 Before conducting the ARDL analysis, Vector Auto-Regression (VAR) and Augmented
Dickey-Fuller (ADF) tests are utilized. Through the VAR test, the optimal lag length was
selected based on the three most widely employed criteria, namely Akaike Information Criterion
(AIC), Schwarz Bayesian Information Criterion (BIC), and the Hannan-Quinn Information
Criterion (HQIC) (Vrieze, 2012). The lowest lag number will be prioritized regardless of the
criteria. The ADF test was used in this study to determine whether all variables are stationary at
below I(2). Specifically, the level form and first difference of each dependent and independent
variables were tested under two conditions, respectively: unrestricted intercept – no trend and
unrestricted intercept – trend.
 Equations (2.1) to (2.3) show the ARDL models of long-run and short-run relationships
between air pollutants and independent variables, where is the constant, is the length of lag
and is the error term. In the first half of each model, the dynamics of the short-run is explained
by variables with the summation signs. The second half of the model represents the long-run
relationship.
 ∆ ln = + ∑ ∆ln −1 + ∑ ∆ln +
∑ ∆ln + ln + ln + ln + (2.1)

 ∆ ln = + ∑ ∆ln −1 + ∑ ∆ln +
∑ ∆ln 2 + ∑ ∆ln + ln ln + ln +
 ln 2 + ln + (2.2)
 ∆ ln = + ∑ ∆ln −1 + ∑ ∆ln +
∑ ∆ln 2 + ∑ ∆ln 3 + ∑ ∆ln +
 ln + ln + ln 2 + ln 3 +
 ln + (2.3)
 We tested the cointegration of dependent and independent variables by bound test. For
example, in Equation (3.3), when the null hypothesis of the bound test is accepted, = = =
 = = 0, and there is no cointegration. On the other hand, if the null hypothesis is rejected,
 ≠ ≠ ≠ ≠ ≠ 0, the cointegration exists. To determine whether to accept or reject the
null hypothesis, the joint F-stat needs to be compared with the lower bound and upper bound of
the model. The lower bound considers all variables as I(0), while the upper bound considers all
variables as I(1). The null hypothesis is accepted if the F stat is lower than the lower bound
critical value of I(0), whereas if the F stat is higher than the upper bound critical value of I(1),
the null hypothesis can be rejected. In case that the F stat is between the lower bound critical
value of I(0) and the upper critical value of I(1), the result becomes inconclusive. In this situation,
to decide whether the model is cointegrated or not, the significance of ECT in the short-term
linear function needs to be taken into account. Banerjee et al. (1998) implied that if the
coefficient of lagged dependent variable, or so-called ECT, is negative and statistically
significant, the cointegration of the model is confirmed. Moreover, it is also notable that if the
coefficient of ECT is not negative or statistically significant, there will be no cointegration,
despite a significant bound test. Equations (3.1) to (3.3) represent the long-run ARDL equations
of the relationship:

 ln = + ∑ ln +∑ ln +
∑ ln + (3.1)

 ln = + ∑ ln +∑ ln +
∑ ln 2 + ∑ ln + (3.2)

 ln = + ∑ ln + ∑ ln +
∑ ln 2 + ∑ ln 3 + ∑ ln + (3.3)

 Where , , , , and are lag values of each independent variable, respectively. The
next following Equations (4.1) to (4.3) show the short-run dynamics of the relationship between
air pollutants and independent variables:
 ∆ ln = + ∑ ∆ln − + ∑ ∆ln +
∑ ∆ln + + (4.1)
 ∆ ln = + ∑ ∆ln − + ∑ ∆ln +
∑ ∆ln 2 + ∑ ∆ln + + (4.2)

 ∆ ln = + ∑ ∆ln − + ∑ ∆ln +
∑ ∆ln 2 + ∑ ∆ln 3 + ∑ ∆ln + + (4.3)

 Where is the constant; , , , , are coefficients; is the error correction
term of the EC models; is the coefficient of ECT; and is the error term. The error correction
term (ECT) in these equations is the speed of the adjustment parameter reflecting the speed
adjusting to the long-run equilibrium of the model.
 Taking the asymmetric impact of paved road construction into consideration and gaining
the inspiration from Mahmood et al. (Mahmood et al., 2019), the Nonlinear Autoregressive
Distributed Lag (NARDL) is applied and compared with ARDL results. NARDL was developed
from linear ARDL by Shin et al. (2014) to check the effect of positive and negative changes of
an independent variable on the dependent variable separately. In this study, we test the
asymmetrical effect of lnRoad on air pollution, by replacing “lnRoad” with “lnRoad_p” and
“lnRoad_n” in the ARDL models. “lnRoad_p” and “lnRoad_n” are computed by partial sums of
positive and negative changes in “lnRoad”, respectively, as follows:
 ln _ = ∑ ∆ln = ∑ max (∆ln , 0) (5.1)

 ln _ = ∑ ∆ln = ∑ min (∆ln , 0) (5.2)

 The following Equations (6.1), (6.2), and (6.3) are NARDL models, or ARDL models
after being converted by replacing lnRoad with Equations (5.1) and (5.2):
 ∆ ln = + ∑ ∆ln − + ∑ ∆ln +
∑ ∆ln _ + ∑ ∆ln _ + ln −1 + ln +
 ln _ + ln _ + (6.1)

 ∆ ln = + ∑ ∆ln − + ∑ ∆ln +
∑ ∆ln 2 + ∑ ∆ln _ + ∑ ∆ln _ +
 ln −1 + ln + ln 2 + ln _ +
 ln _ + (6.2)
 ∆ ln = + ∑ ∆ln − + ∑ ∆ln +
∑ ∆ln 2 +
∑ ∆ln 3 + ∑ ∆ln _ + ∑ ∆ln _ +
 ln −1 + ln + ln 2 + ln 3 +
 ln _ + ln _ + (6.3)
 The long-run and short-run of the NARDL models are examined by similar means to the
ARDL model. In addition to that, we also employ the Wald test to examine the null hypotheses
of the symmetrical effects of “lnRoad_p” and “lnRoad_n” in the long-run and short-run
estimations.
Procedure
The current analysis was completed through three stages. In the first stage, pre-estimation tests,
namely: lag-selection test, Augmented Dickey and Fuller unit-root test, and bound test for the
cointegration of the model were conducted. In the second stage, the ARDL model was employed
to examine the short-run and long-run relationships between air pollutants and the set of
independent variables. Durbin-Watson test, Breusch Godfrey Serial Correlation Lagrange
Multiplier (LM) test, Breusch-Pagan / Cook-Weisberg test for Heteroskedasticity, ARCH test,
Ramsey Reset test, CUSUM and CUSUMSQR tests were employed at the end to confirm the
autocorrelation, serial correlation, heteroscedasticity, appropriateness of model specification, and
variables’ stability. If any model cannot pass the post-analysis tests, they would be rejected.
Eventually, the finest models were selected for NARDL analysis to confirm the significance of
the models. The NARDL analysis process was replicated from the ARDL analysis above.
The raw data from separate sources were initially downloaded, combined, and curated in
one Excel file. The Excel file was later stored as CSV format before importing to EViews
software (version 10) for in-depth analysis. In terms of the level of significance, 10% was chosen
as the significance level for short-run and long-run analysis, while 5% was chosen as the
significance level of the pre-estimation and post-estimation tests.

Results
Pre-estimation tests
The VAR test based on Akaike Information Criterion (AIC), Schwarz Bayesian Information
Criterion (SBIC), and the Hannan-Quinn Information Criterion (HQIC) suggested 1 is the
optimal lag length for most of the equations (see Table S1, Supplementary Information). The
Augmented Dickey-Fuller unit root test was also employed to examine if all variables were
stationary at level series or first-order difference series (see Table S2, Supplementary
Information). The results concluded that all variables in the current study were stationary at I(0)
and I(1).
EKC between industrial firm size and air pollution emissions
Based on the analysis statistics and post-estimation tests of both the ARDL and NARDL models,
the two most appropriate shapes of the relationship between air pollution and average industrial
firm size are the U-curve (“lnDustper” and “lnOxper” as dependent variables) and inverted N-
curve (“lnNO2” and “lnCOper” as dependent variables). In cases of “lnNO2” and “lnCOper”, the
EKC hypothesis is validated as air pollution emissions eventually decline according to industrial
growth, despite an increasing period. However, as “lnDustper” and “lnOxper” rise after a certain
level of industrial growth, the EKC hypothesis is rejected.
ARDL analysis results
Among the three equations of “lnDustper” and “lnOxper”, equation (3.2) is the most appropriate
representation for the relationship of “lnDustper” and “lnOxper” with the average industrial firm
size and the total area of paved road, because the equation satisfies all the post-estimation tests.
The models of “lnDustper” and “lnOxper” explain 92% and 68% of the variance, respectively.
In the long-run, the coefficients of “lnFirmsize” ( = -0.246, p-value < 0.01) and
“lnFirmsize2” ( = 0.530, p-value < 0.01) are negative and positive respectively,
which presents a U-shaped relationship between industrial firm size and the amount of falling
dust per capita. The turning point is calculated to be at $10.21 million per firm after exponential
transformation (see Figure 2.1). Meanwhile, the relationship between the concentration of Ox per
capita and the average firm size also exhibits a similar shape, with the turning point at $10.05
million per firm ( = -2.686, p-value < 0.01 and = 0.582, p-value < 0.01,
see Figure 2.2).
 The U-shaped relationships between industrial firm size and the amount of falling dust
per capita, as well as the concentration of Ox per capita, imply that air pollutions are initially
alleviated, but they start to increase again when industrial firms grow up to a certain size. In
other words, the EKC of industrial growth is not valid in cases of falling dust and Ox. This result
contradicts the study of Diao et al. (2009), which validates the EKC between economic growth
and industrial dust discharged during the 1995-2005 period.
 The results in the short-run estimation also demonstrate a similar effect of industrial firm
size on the amount of falling dust and concentration of Ox per capita like the long-run estimation
(see Table 3). The coefficients of the error correction terms are negative and statistically
significant, which again confirmed the cointegration of both models. The amount of falling dust
and concentration of Ox per capita adjusts by 65.2% and 70.4% each year, respectively, when
they are far away from the equilibrium.
 The current study also displays long-run inverted N-shaped relationships of the average
industrial firm size with the concentration of NO2 ( = -14.742, p-value < 0.05,
 = 6.629, p-value < 0.05, and = -1.005, p-value < 0.01) and CO per
capita ( = -67.831, p-value < 0.01, = 29.688, p-value < 0.01, and
 = -4.287, p-value < 0.01). We choose the results estimated for Equation (3.3), because
it does not only satisfy all the post-estimation tests but also explain the most variance (R2 = 0.86
and 0.70 with “lnNO2per” and “lnCOper” as dependent variables, respectively). Even though the
finding shows an inverted N-shaped curve between NO2 emission per capita and firm size, there
is only one turning point at $9 million per firm, which is the third fundamental cubic equation’s
reflection point (see Figure 2.3). Meanwhile, the relationship between CO emission per capita
and firm size obtains two turning points, which are at $7.96 million and $12.71 million,
respectively (see Figure 2.4). The two curves indicate a similar pattern that air emission first
declines as firms grow, then starts to slow down or even rises when firms grow to a certain level,
but finally declines again.
 The inverted N-shaped curves plotted between firm size and the concentrations of NO2
and CO per capita in our study provide insights from the perspective of the microeconomic
industrial growth on the validity of EKC in Japan (Rafindadi, 2016). They also contribute
evidence for the EKC of industrial growth, in terms of average industrial firm size and NO2 and
CO emissions, besides the U-shaped relationship between environmental efficiency and
industrial agglomeration in China (Wang and Wang, 2019) and the inverted U-shaped
relationship between industrial added value and CO2 emission in Ghana (Abokyi et al., 2019).
 The short-run estimations also confirm the N-shaped relationship of the average
industrial firm size with the concentration of NO2 and CO per capita in the long-run estimations
(see Table 3). The adjustment speed to the equilibrium of NO2 per capita ( ( ) = -0.416, p-
value < 0.01) is slower than that of CO per capita ( ( ) = -0.703, p-value < 0.01).
DVs lnDustper lnNO2per lnOxper lnCOper lnSOxper
 Equation (3.1) (3.2) (3.3) (3.1) (3.2) (3.3) (3.1) (3.2) (3.3) (3.1) (3.2) (3.3) (3.1) (3.2) (3.3)
 Lags 1,0,1 1,0,0,1 1,0,0,0,1 1,1,0 1,1,0,0 1,1,1,1,1 2,1,0 1,0,0,0 1,0,0,0,0 1,0,0 1,0,0,0 1,0,1,1,0 3,0,1 3,0,0,3 3,2,3,3,2
 lnFirmsize 0.813 -2.462*** -3.810 -0.692*** -1.343* -14.742** 0.477 -2.686*** 1.457 -0.167 4.564* -67.831*** 0.963 8.191 451.713
lnFirmsize2 0.530*** 1.204 0.147 6.629** 0.582*** -1.408 -0.986** 29.688*** -1.534 -244.515
 ***
lnFirmsize3 -0.108 -1.005 0.309 -4.287*** 42.473
 lnRoad -0.010** -0.361** -0.354 0.496*** 0.511*** 0.341** 0.166 0.347*** 0.348*** -0.345 -0.404* -0.357* -0.976 -1.232 -1.214
 * *** *** *** *** *** ***
 Constant -4.484 -5.389 -4.947 -6.850 -6.426 -3.230 -4.127 -10.927*** -13.770 -7.172*** -10.813*** 26.604** -2.237** -3.461** 31.938***
 a) A A A A A A A A A A A A A A R
 b) A A A A A A A A A A A A A A A
 c) A A R A A A A A A A A A A A A
 d) A A A A A A A A A A R A R A R
 e) A A A A A A R A A R A A A A A
 f) A A A A A A A A A A A A A A A
Note:
 * **
• , and *** represent statistical significance at 10%, 5% and 1% respectively
• “A” represents the null hypothesis is accepted, while “R” represents the null hypothesis is rejected
 a) Breusch Godfrey serial Correlation LM test
 b) Breusch-Pagan / Cook-Weisberg test for Heteroskedasticity
 c) ARCH test
 d) Ramsey Reset test
 e) CUSUM
 f) CUSUMSQR

Table 2: Long-run estimates of the ARDL models
DVs ∆lnDustper ∆lnNO2per ∆lnOxper ∆lnCOper ∆lnSOxper
 Equation (4.1) (4.2) (4.3) (4.1) (4.2) (4.3) (4.1) (4.2) (4.3) (4.1) (4.2) (4.3) (4.1) (4.2) (4.3)
 Lags 1,0,1 1,0,0,1 1,0,0,0,1 1,1,0 1,1,0,0 1,1,1,1,1 2,1,0 1,0,0,0 1,0,0,0,0 1,0,0 1,0,0,0 1,0,1,1,0 3,0,1 3,0,0,3 3,2,3,3,2
 ∆lnFirmsize 0.053 -1.606*** -2.540 -0.085* -0.332 -2.960* -0.021 -1.891*** 1.096 -0.092 2.685** -47.715*** 0.135 1.190 -20.709***
∆lnFirmsize2 0.346*** 0.803 0.055 1.443* 0.409*** -1.060 -0.580** 20.883*** -0.223 11.828***
 * ***
∆lnFirmsize3 -0.072 -0.230 0.232 -2.867 -2.127***
 ** ** ** *** *** ** *** *** * * * **
 ∆lnRoad -0.265 -0.236 0.236 0.191 0.192 0.142 0.036 0.244 0.262 -0.190 -0.237 -0.251 1.148 1.445 0.590
 ECT (t-1) -0.187* -0.652*** -0.666*** -0.385*** -0.375*** -0.416*** -0.216* -0.704*** -0.752*** -0.552*** -0.588*** -0.703*** -0.140 -0.145 0.116
 DW stat. 1.88 1.90 1.94 1.97 2.00 2.19 1.96 2.28 2.15 1.88 2.16 1.87 2.14 2.21 2.77
 R2 0.89 0.92 0.92 0.82 0.82 0.86 0.69 0.68 0.70 0.54 0.60 0.70 0.97 0.98 0.99
 Adj R2 0.89 0.91 0.91 0.80 0.80 0.83 0.65 0.65 0.66 0.50 0.56 0.64 0.97 0.97 0.99
 Bound test NC (6.36) C (10.07) C (7.94) I (3.88) C (5.17) C (6.94) I (3.83) C (7.79) C (6.96) I (4.19) C (4.92) C (7.11) C (4.98) I (2.93) C (11.95)
Note:
 * **
• , and *** represent statistical significance at 10%, 5% and 1% respectively
• Bound test: “C” = Cointegration, “I” = Inconclusive, “NC” = No Cointegration, the F-stats is shown in parentheses (see Table C for upper and lower bound critical values)

Table 3: Short-run estimates of the ARDL models
NARDL analysis results
The most appropriate ARDL models of each type of air pollution are selected for the NARDL
analysis, while the model with “lnSOxper” is rejected due to statistical insignificance. CUSUM
and CUSMSQ tests are not reported due to collinearity while computing. Among the four
selected models, two are in the quadratic form (“lnDustper” and “lnOxper” as dependent
variables), and the other two are in the cubic form (“lnNO2per” and “lnCOper” as dependent
variables).
Table 4: Long-run and short-run estimates of Non-linear ARDL models

 Long-term lnDustper lnNO2per lnOxper lnCOper
 Equation (6.2) (6.3) (6.2) (6.3)
 Lags 1,0,0,1,1 1,1,1,1,1,0 1,0,0,0,0 1,0,1,1,0,0
 lnFirmsize -2.051*** -20.064** -2.592*** -74.358**
 lnFirmsize2 0.429*** 9.301** 0.558*** 32.566**
 lnFirmsize3 -1.441** -4.707**
 lnRoad_p -0.337** 0.353** 0.347*** -0.352*
 lnRoad_n -82.645* -55.786 -10.131 -19.616
 Constant -5.811*** -1.446 -10.581*** 29.462*
 2.848 2.503 0.211 0.164
 Wald test
 (0.099) (0.122) (0.648) (0.687)
 Short-term ∆lnDustper ∆lnNO2per ∆lnOxper ∆lnCOper
 ∆lnFirmsize -1.276** -7.761*** -1.828*** -52.058**
 ∆lnFirmsize2 0.267** 3.598*** 0.393*** 22.800**
 ∆lnFirmsize3 -0.557*** -3.295***
 ∆lnRoad_p -0.210** 0.136** 0.245*** -0.247*
 ∆lnRoad_n -51.451* -21.580 -7.144 -13.733
 ECT (t-1) -0.622*** -0.386*** -0.705*** -0.700***
 3.755 2.419 0.222 0.167
 Wald test
 (0.059) (0.129) (0.639) (0.685)
 DW stat. 2.09 2.36 2.25 1.91
 R2 0.91 0.87 0.69 0.71
 Adj R2 0.90 0.83 0.64 0.63
 Bound test C (8.35) C (6.40) C (6.15) C (5.80)
 a) A A A A
 b) A A A A
 c) R A A A
 d) A A A A
 Note:
 * **
 • , and *** represent statistical significance at 10%, 5% and 1% respectively
 • “A” represents the null hypothesis is accepted, while “R” represents the null hypothesis is rejected
 a) Breusch Godfrey serial Correlation LM test
 b) Breusch-Pagan / Cook-Weisberg test for Heteroskedasticity
 c) ARCH test
 d) Ramsey Reset test

 At first glance, the inverted N-shaped relationships of “lnNO2” and “lnCOper” with the
average size of industrial firm in Kitakyushu city are confirmed by the NARDL models, but the
turning points are slightly different from those provided by ARDL models (see Figure 2). The
turning point of NARDL model of “lnNO2per” is at $8.6 ( = -20.064, p-value < 0.05,
 = 9.301, p-value < 0.05, and = -1.441, p-value < 0.05), while that of
“lnCOper” are at $7.97 million and $12.62 million ( = -74.358, p-value < 0.05,
 = 32.566, p-value < 0.05, and = -4.707, p-value < 0.05).

Figure 2: Illustrations of the relationship between the average industrial firm size and air
pollutions
 2.1. The U-shaped relationship between average industrial firm size and the amount of falling dust

 2.2. The U-shaped relationship between average industrial firm size and the concentration of Ox

 2.3. The inverted N-shaped relationship between average industrial firm size and the concentration of NO2

 2.4. The inverted N-shaped relationship between average industrial firm size and the concentration of CO
In the case of “lnDustper” and “lnOxper”, the NARDL models presented U-shaped
relationships between air pollution emissions and industrial firm size, but the model of
“lnDustper” had an autoregressive conditional heteroskedasticity. The turning points calculated
from the NARDL models of “lnDustper” and “lnOxper” are $10.91 million and $9.32 million.
The U-shaped relationship might be the result of insufficient pollution monitoring policies due to
the changing industrial structure in Kitakyushu city might be an explanation for the increasing
dust emission as firms grow larger. To elaborate, it is reported that there is a rising number of
large firms in iron steel, chemical, and automobile sectors, etc. have outsourced their activities to
smaller firms receiving many incentives and less stringent regulatory restrictions and inspection
from the government (OECD, 2013).
 In terms of Ox emission, even though it is closely related to the concentration of NO2 in
the atmosphere, it is still very difficult to control as Ox emission is created through a complex
photochemical reaction of NO2 with other substances in the air (Guderian, 1985).
Relationships between road infrastructure development and air pollution emissions
Our ARDL analysis finds that building more high-quality roads, in particular – paved road
corresponds to the decline of dust emission ( = -0.361, p-value < 0.05), CO emission
( = -0.357, p-value < 0.1), and the increase of the NO2 ( = 0.341, p-value < 0.05),
Ox emissions ( = 0.347, p-value < 0.01). The results of NARDL analysis also confirm the
relationships between road infrastructure development and air pollution emissions. However, in
all NARDL models, while the effect of increasing the total area of paved road is significant, that
of decreasing one is not. The null hypothesis of the symmetrical effect of road infrastructure
development is tested and not rejected, which implies the symmetrical effect of road
infrastructure development. The contradictory result between the Wald test and the coefficients
of “lnRoad_p” and “lnRoad_n” can be because the total area of the paved road only declined in
one year, which was in 2014, which in turns, created distortion in the results. Even though the
distortion does not lead to any major difference between the results of ARDL and NARDL
analyses, we would like to use the results of ARDL, instead of NARDL analysis, for discussion.
 Given that Equation (3.2) is the most suitable equation among the ARDL models, a 10%
increase in the total area of the paved road corresponds with 3.38% and 3.35% decreases in the
amount of falling dust per capita and the concentration of CO per capita respectively. The short-
run estimations also confirmed the negative associations in the long-run. The negative
correlation of paved road infrastructure development with dust and CO emissions suggest a
substantial role of high-quality road expansion in elevating the productivity through accessibility
improvement (Duran-Fernandez and Santos, 2014; Gibbons et al., 2019). Especially in
Kitakyushu city, recycling industries are extensively and intensively invested and promoted (City
of Kitakyushu, 2018). As a result, local recycling industries might take advantage of the road
infrastructure system to raise recycling productivity and indirectly alleviate the CO and dust
emissions.
However, building more high-quality road infrastructure also leads to some side-effects.
Contrary to the negative correlations of the total area of paved road with dust and CO emissions
per capita, NO2 ( = 0.341, p-value < 0.05) and Ox ( = 0.348, p-value < 0.01)
emissions per capita are positively associated with the expansion of paved road. The short-run
estimations also presented similar patterns in the long-run. The concentration of NO2 and Ox per
capita might increase by 3.3% and 3.37%, respectively, if there was 10% of the additional road
being built. Although the road infrastructure development in Kitakyushu city might help reduce
dust and CO emissions through rising industrial productivity, the construction of new road might
lead to urban sprawl and the increasing car dependency due to the rising traveling demand
(Cervero, 2003; OECD, 2013). Therefore, policy-makers should concern both the favorable and
adverse effects of new road construction for implementing better green growth policies and
planning.

Figure 3: Illustrations of the relationship between the total area of paved road and air pollutions
 3.1. The relationship between the total area of paved road and the amount of falling dust

 3.2. The relationship between the total area of paved road and the concentration of CO

 3.3. The relationship between the total area of paved road and the concentration of Ox
3.4. The relationship between the total area of paved road and the concentration of NO2

Discussion and Conclusion
The trilemma of sustainable development
Through an analysis of almost 50 years of historical data, using both the ADRL and non-linear
ADRL methods, this study has presented a trilemma among industrial growth, infrastructure
development, and the emission reduction of air pollution and greenhouse gas.
The EKC of industrial growth
The current study is among the first to explain the EKC between industrial development and air
pollution using the aggregate microeconomic data – the average industrial firm size calculated by
the division of the total shipment value by the total number of firms in the city. From the
aggregate microeconomic approach, this study validates the EKC hypothesis in terms of NO2 and
CO emissions per capita but rejects the EKC hypothesis in terms of falling dust particle and Ox
emissions per capita.
 The initial decrease of air pollution in relation to the industrial growth after 1967
provides evidence for the effectiveness of the pollution prevention agreement between
Kitakyushu government and the private sector in alleviating air pollution. This viewpoint is also
supported by the fact that, from 1963, the municipal government had faced tremendous pressure
from the local community due to poor environmental quality because of industrial development
(Fujikura, 2007).
 In this study, the existing inverted N-shaped relationships of NO2 and CO emissions with
the industrial firm size hint at the vital contribution of large industrial enterprises to pollution
reduction, as NO2 and CO are primarily the waste products of combustion of fuel for power
generation and manufacturing. This result can be explained by previous studies, which have
found large industrial firms to be more capable of replacing old, polluted, and energy-inefficient
machines with better ones than small and mid-size firms (Andreoni and Levinson, 2001;
Merlevede et al., 2006; Nielsen, 2018). Gaining the advantage of economies of scale over
smaller firms, large firms are also able to consume fewer units of energy to produce a unit of
output (Machado et al., 2016; Oh and Lee, 2016; Park et al., 2016). Also, the energy sources in
Kitakyushu city has been gradually shifted from coal and oil to natural gas and renewable energy
since 1967, which leads to lower emissions of greenhouse gases and NO2 (De Gouw et al., 2014;
Higazy et al., 2019; OECD, 2013). With 66% of energy in Kitakyushu city is consumed by
industrial activities and energy conversion is more affordable to larger industrial firms, the
emissions of NO2 and CO might be reduced as industrial firms grow. It has been reported that
despite accounting for the largest proportion of energy consumption in Kitakyushu city, the
industrial sector keeps growing while air emissions from energy generation are still under control
(OECD, 2013). As such, the evidence points toward the EKC of NO2 and CO emissions are the
result of (1) stringent pollution monitoring, controls and financial support of local government,
(2) replacement of energy-efficient technologies, (3) economies of scale effects, and (4) the
energy source conversion from coal and oil to natural gas and renewable sources.
 However, our analysis also shows that the amount of falling dust particle and Ox, after the
initial decline, starts to rise when the industrial sector expands to a level of $9.32 million to
$10.91 million of shipment value per firm depends on the model of analysis. In 2013, the OECD
report warned that where a rising number of large firms in iron steel, chemical, and automobile
sectors, etc. are reported to outsource their activities to smaller firms to whom enforcement and
inspection are more difficult to apply. This could essentially explain the analysis result. Hence,
policy-makers in Kitakyushu city are suggested to revise inspection regulations with regards to
small and medium firms to stay abreast of the changing dynamics of the industry.

The problems with infrastructure development
Besides the significant relationship between firm-level industrial growth and air pollution, we
also found both negative and positive correlations of road infrastructure development with air
pollution. On the one hand, our analysis shows a positive effect of road construction on
alleviating the amount of falling dust and CO concentration. These findings can be explained by
the fact that as the higher quality road is built, the manufacturing and recycling productivity and
efficiency are elevated (Duran-Fernandez and Santos, 2014; Gibbons et al., 2019), which, in
turns, leads to air emission reduction.
 On the other hand, the emissions of NO2 and Ox are found to increase according to road
infrastructure development. This finding points out the adverse effect of the policies facilitating
industrial recycling growth in Kitakyushu city. Initially, the eco-industrial park in Kitakyushu
city was planned to achieve industrial symbiosis, a closed system where the waste of an industry
or a firm is fully consumed by others within the system. However, due to the demand for the
revitalization of the local economy, the eco-industrial park in Kitakyushu city has been turned
into a hot spot of the recycling industry, which was hoped to generate more economic profit as
well as reduce environmental degradation (Ogihara, 2007). To attract investment to the recycling
industry, the Kitakyushu government offers cheap and vast land located away from the
residential area (Hammer et al., 2011), while more road has been built to ensure the connectivity
of industrial recycling firms with other industries and residential areas. In addition, to keep the
growth rate of recycling industries, the road infrastructure needs expanding to make recycling
materials and outputs flow among regions within and outside of Kitakyushu city. During the
period from 2005 to 2010, the total amount of waste inputs from outside Kitakyushu city tripled,
while the total amount of recycling outputs transported to locations within the eco-town,
Kitakyushu city, and Fukuoka prefecture increased substantially (Tsuruta et al., 2016). Air
pollution from transportation might rise dramatically due to recycling industrial activities, not to
mention the increase in the number of personal vehicles because of increasing traveling demand
(Cervero, 2003) and urban sprawl (OECD, 2013) when more roads are built.
Even in a stringent green growth regulation context, like Kitakyushu city, some air
pollution emissions still eventually increase according to industrial growth and infrastructure
expansion. This, as a result, creates a trilemma among industrial growth, infrastructure
development, and air and greenhouse gas emission reduction. Indeed, dealing with climate
change and air pollution while fostering industrial growth and road infrastructure development is
a complicated business, which requires the involvement of multi-stakeholders, not only the
government, the private sector, and academia, but also the local community. We recommend
policy-makers in Kitakyushu city, promoting the usage of public transport instead of personal
vehicles within the local community by raising awareness of air pollution and climate change.

Kitakyushu as a reference point of Green Growth for the Global South?
Japan has put significant efforts into finding a balance between the “industrial” and “green” parts
of growth. Since the end of the 1990s, the Japanese government has considered the improvement
of energy efficiency and energy innovations as the heart of a mission to achieve growth which
was later upgraded into green growth (Government of Japan, 2007, 2010, 2014; Ministry of
Economy, Trade and Industry, 1999). Many policies and strategies have been planned and
implemented until currently, such as the Top Runner Program, Japan’s Strategy for a Sustainable
Society, New Growth Strategy, Strategic Energy Plan, all of which consistently concentrate on
fostering economic growth sustainably by creative innovations and the development of energy-
related technologies (Government of Japan, 2007, 2010, 2014; Ministry of Economy, Trade and
Industry, 1999). In the case of Kitakyushu city, the combination of political orientation,
technological development, and economic incentives have resulted in two diverging patterns: the
success with the general decline of NO2 and CO emissions when plotted against industrial
growth, the worrying increase of dust particles and Ox after an early decline. There are
limitations to the pioneering efforts of the local and national governments in pursuing green
growth.
 Thus, the Kitakyushu city case can act as an important reference point for the pursuit of
green growth in Japan as well as the Global South. Green growth orientation development has
become more visible recently in many Global South countries, such as India and China (Death,
2015). One can argue if developing countries in the Global South manage to successfully
implement green growth policies, the world can enjoy a much more sustainable future. To date,
however, the effectiveness of the existing green growth practices in these developing countries
has not been properly assessed (Li and Qiu, 2015). Hence, the lessons offered by Kitakyushu can
be taken into account when policies are formed, and progress is measured in the course of
pursuing a green economy. The next parts will offer some of the suggestions from our results and
the review of the literature.
 In terms of CO emission, which is closely correlated with CO2 emission, this study found
notable results that CO emission eventually declines when plotting against industrial
development and road infrastructure expansion. This success partly thanks to the implementation
of eco-town project – recycling industries, which have been shown in previous studies,
significantly reduce the CO and CO2 emissions from the manufacturing process (Gielen and
Moriguchi, 2002; Johnson et al., 2008; Zheng and Suh, 2019). As a result, three aspects of
Kitakyushu’s eco-town project can be recommended. First, to achieve green growth development,
collaboration across and within levels of government is required (Hammer et al., 2011). It is
important for national and local governments to play a complementary role to each other. For
Kitakyushu city’s eco-town project, while the national government provides legislative and
financial support to the local government, the local government is responsible for collaborating
with the private sector, providing the necessary support, and enforcing environmental regulations.
 Second, technology innovations and green technology applications are the leverages of
green growth in Kitakyushu. To enhance technology innovations and effectively apply green
technology in the industrial sector, not only investment into green R&D and financial subsidy,
but the cooperation among three stakeholders – government, private sector, and academia, need
to be promoted (City of Kitakyushu, 2018). Through mutual corporation, the research outcome
can be applied in a practical context, and economic subsidies are given to multiply the effect of
new technologies.
 Third, the transparency green growth agenda in regional policies can also be one of the
main contributors to the success in the alleviation of CO and CO2 emissions in Kitakyushu city.
Usually, the national green growth agenda is driven by sectoral ministries rather than people in
charge of regional and spatial planning (Hammer et al., 2011). Nonetheless, Kitakyushu city has
not only integrated the green growth agenda of Japan focusing on GHG emission reduction while
maintaining the economic development (Government of Japan, 2010; Ministry of the
Environment, 2016), but even set its own agenda reducing at least 50% of greenhouse gas
emissions by 2050, while increase economic growth up to 40% by 2050 (OECD, 2013).
 Moreover, other cities in the Global South can indeed learn from the trilemma of
Kitakyushu in pursuing industrial growth, infrastructure development, and emission reduction of
air pollution and greenhouse gas. It appears that this problem can be traced back to the strategic
turn toward a focus on recycling activities rather than industrial symbiosis, as well as, the trend
of outsourcing to small and medium firm whom regulation is more difficult to enforce. Future
studies that focus on the causes of this complex relationship and how to solve it will bring further
insights. Nevertheless, the current lessons from the pioneering efforts of Kitakyushu will be
helpful in the policy-planning for green growth in other cities.

Data policy and Society 5.0 for the green growth future
This section will discuss the current data policy in Kitakyushu city, which is currently an OECD
SDGs pilot city and the leading Asian green-growth city that might be the role model for other
cities in the Global South. Apart from the openness of data, there are still several deficiencies in
data management and stewardship in Kitakyushu city. First, judging by FAIR principles of data
stewardship proposed by Wilkinson et al. (2016), the language barrier is one of the main
problems hindering the findability and the interoperability of data. Currently, the data deposit on
the Kitakyushu website is only available in Japanese. To advance more and better science as well
as to play a role model for other cities in green growth development, Kitakyushu city is
recommended to have its data related to green growth development available in other common
languages in the Global South. Open and well-structured databases not only enable scientific
exploration but also enable the involvement of the general public in this process, thus, increasing
public trust (Vuong et al., 2018).
 The data collection needs to be more detailed and specific to deal with the complex
connections among emissions, concentrations, climate change, and impacts (National Research
Council, 2011). For instance, with a more detailed and specific data on types of industrial firms,
the results from this study could have explained more clearly the main sources of air pollution
and greenhouse gas emissions. To acquire such detailed information from multiple sectors and
sources, we suggest the local government to invest in the application of big data in Kitakyushu
city, which will offer new insights and addresses specific problems for innovating scientific
research as well as facilitating evidence-based policymaking (McNeely and Hahm, 2014;
Michael and Miller, 2013; Vuong, 2018; Vuong, 2019).
 Society 5.0, proposed in the 5th Science and Technology Basic Plan, aims to incorporate
new technologies, such as IoT, big data, artificial intelligence (AI), for achieving economic
development and solutions to social-environmental problems concurrently (Cabinet Office,
2019). As the Japanese government is nurturing the ambition of Society 5.0, Kitakyushu city can
take this opportunity to revise its data policy employing big data for better green growth
development. The complex interaction among industrial growth, road construction, and air
pollution highlighted in this study might be a befitting case for the application of big data and
artificial intelligence to solve urban problems (Duarte and Alvarez, 2019).

Methodology for future research
When employing the linear and non-linear ARDL analyses in this study, we found one shortfall
of the non-linear ARDL model. The non-linear ARDL model seems to not work well with data,
which tends to be cumulative, for instance, the total area of paved road. In fact, the total area of
paved road in Kitakyushu accumulates over time and only decline in 2014, which creates outlier
in the variable “lnRoad_n”, and eventually leads to inaccurate estimation of the asymmetric
effect and the relationship between “lnRoad_n” and “lnAirPollution”. Thus, later studies should
be aware of the properties of a variable before using non-linear ARDL analysis.
Future studies examining the EKC should employ not only the augmented model by squared and
cubic variables but also the new approach of Narayan & Narayan (2010), comparing the long-run
and short-run coefficients of economic indicators, for comparison. Comparing the results from
the two methods will help verify the robustness of the current findings as well as cover some
shortcomings of both methods; for example, the econometric weakness of the augmented
approach and incapability to find a turning point of Narayan & Narayan’s approach.
You can also read