Pre-existing bilayer stresses modulate triglyceride accumulation in the ER versus lipid droplets - eLife
←
→
Page content transcription
If your browser does not render page correctly, please read the page content below
RESEARCH ARTICLE

                                    Pre-existing bilayer stresses modulate
                                    triglyceride accumulation in the ER versus
                                    lipid droplets
                                    Valeria Zoni1†, Rasha Khaddaj1†, Pablo Campomanes1, Abdou Rachid Thiam2,
                                    Roger Schneiter1, Stefano Vanni1*
                                    1
                                     University of Fribourg, Department of Biology, Fribourg, Switzerland; 2Laboratoire
                                    de Physique de l’École Normale Supérieure, ENS, Université PSL, CNRS, Sorbonne
                                    Université, Université de Paris, Paris, France

                                    Abstract Cells store energy in the form of neutral lipids (NLs) packaged into micrometer-sized
                                    organelles named lipid droplets (LDs). These structures emerge from the endoplasmic reticulum
                                    (ER) at sites marked by the protein seipin, but the mechanisms regulating their biogenesis remain
                                    poorly understood. Using a combination of molecular simulations, yeast genetics, and fluorescence
                                    microscopy, we show that interactions between lipids’ acyl-chains modulate the propensity of NLs
                                    to be stored in LDs, in turn preventing or promoting their accumulation in the ER membrane. Our
                                    data suggest that diacylglycerol, which is enriched at sites of LD formation, promotes the
                                    packaging of NLs into LDs, together with ER-abundant lipids, such as phosphatidylethanolamine.
                                    On the opposite end, short and saturated acyl-chains antagonize fat storage in LDs and promote
                                    accumulation of NLs in the ER. Our results provide a new conceptual understanding of LD
                                    biogenesis in the context of ER homeostasis and function.

*For correspondence:                Introduction
stefano.vanni@unifr.ch              Lipid droplets (LDs) are ubiquitous intracellular organelles that consist of a core of neutral lipids
†
 These authors contributed          (NLs), mostly triglycerides (TG) and sterol esters, surrounded by a phospholipid (PL)
equally to this work                monolayer (Walther and Farese, 2012). Because of this unique composition, they are the cellular
                                    sites responsible for energy and lipid storage and they play a central role in lipid and cellular
Competing interests: The
                                    metabolism (Walther and Farese, 2012; Gao and Goodman, 2015; Pol et al., 2014; Olzmann and
authors declare that no
                                    Carvalho, 2019).
competing interests exist.
                                        LDs emerge from the endoplasmic reticulum (ER), where the NLs constituting them are synthe-
Funding: See page 20                tized by acyltransferases that are essential for LD formation (Sandager et al., 2002). These early LDs
Received: 07 September 2020         have been observed with electron microscopy (EM), showing an oblate lens-like structure with diam-
Accepted: 31 January 2021           eters of 40–60 nm (Choudhary et al., 2015). Recent experiments suggest that LDs form at specific
Published: 01 February 2021         ER sites marked by the proteins seipin (Salo et al., 2019) and Nem1 (Choudhary et al., 2020), upon
Reviewing editor: Patricia
                                    arrival of seipin-interaction partner protein promethin/LDAF1 (LDO in yeast, Chung et al., 2019;
Bassereau, Institut Curie, France   Teixeira et al., 2018; Bohnert, 2020; Eisenberg-Bord et al., 2018; Castro et al., 2019), before a
                                    subsequent maturation that involves LD growth and budding (Pol et al., 2014; Olzmann and Car-
   Copyright Zoni et al. This
                                    valho, 2019; Walther et al., 2017; Joshi et al., 2017; Sturley and Hussain, 2012; Thiam and Bel-
article is distributed under the
                                    ler, 2017; Chen and Goodman, 2017; Thiam and Forêt, 2016).
terms of the Creative Commons
Attribution License, which              Knockout of seipin, however, does not abolish LD formation, and, for what concerns the early
permits unrestricted use and        stages of LD biogenesis, rather results in delayed LD formation and accumulation of NLs in the
redistribution provided that the    ER (Wang et al., 2016). At the same time, deletion of other proteins with very different functions,
original author and source are      such as the lipid phosphatase Pah1 (Adeyo et al., 2011) or the membrane-shaping protein Pex30
credited.                           together with seipin (Wang et al., 2018), results in a more pronounced phenotype, with the majority

Zoni, Khaddaj, et al. eLife 2021;10:e62886. DOI: https://doi.org/10.7554/eLife.62886                                               1 of 24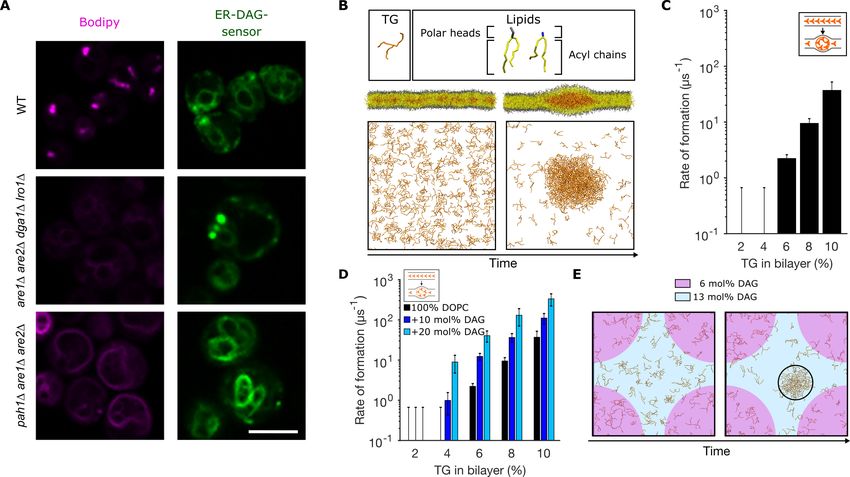
Research article                                                              Cell Biology Structural Biology and Molecular Biophysics

                                    of cells completely lacking LDs and with NLs strongly accumulating in the ER (Adeyo et al., 2011;
                                    Wang et al., 2018). These observations reveal that LD formation is highly sensitive to the membrane
                                    environment, and they indicate that while seipin functions as the main ER nucleation seed for LD bio-
                                    genesis, other mechanisms are likely to significantly contribute to the energetics of TG accumulation
                                    in vivo.
                                        However, because of important challenges in reconstituting in vitro the machinery of LD forma-
                                    tion, the early molecular steps of LD biogenesis remain largely unexplored. The mechanistic under-
                                    standing of these steps (Pol et al., 2014; Olzmann and Carvalho, 2019; Walther et al., 2017;
                                    Joshi et al., 2017; Sturley and Hussain, 2012; Thiam and Beller, 2017; Chen and Goodman,
                                    2017; Thiam and Forêt, 2016; Santinho et al., 2020) is currently based on the extrapolation of
                                    experimental observations in reconstituted systems, where micrometric oil blisters have been
                                    observed, during the formation of black lipid membranes (White, 1977; White, 1986) or in droplet-
                                    embedded vesicle systems (Ben M’barek et al., 2017), suggesting that LDs can spontaneously
                                    assemble following the accumulation of NLs in between the bilayer leaflets, and that this process
                                    can be mediated by membrane properties such as curvature (Santinho et al., 2020) or
                                    tension (Ben M’barek et al., 2017). However, all these experiments often lack the ability to continu-
                                    ously modulate and monitor the NL-to-PL ratio during the process of LD formation, i.e. for increasing
                                    values of the NL-to-PL ratio as in cellular conditions, and it is thus difficult to establish the key factors
                                    controlling LD assembly based exclusively on information from reconstituted systems. To this end,
                                    molecular dynamics (MD) simulations have shown promise as a good alternative strategy to investi-
                                    gate the early stages of LD formation, as this approach has been used to investigate the formation
                                    of oil blisters at two different NL-to-PL ratios, showing that NL blister formation takes place when
                                    the NL-to-PL ratio exceeds a certain threshold (Khandelia et al., 2010), and to investigate how
                                    membrane properties alter the propensity of LD egress from the ER bilayer (budding, Ben M’barek
                                    et al., 2017; Chorlay et al., 2019).
                                        Here, we used in silico MD simulations to investigate how membrane lipids modulate the mecha-
                                    nism of fat accumulation. We identified that while certain lipids promote the packaging of NL into
                                    oil blisters, others oppose this process. In particular, lipids’ acyl chains play a major role in this mech-
                                    anism. Our results recapitulate several previous experimental observations on LD formation within a
                                    unified conceptual framework. Further, in order to validate in vivo our molecular simulations, we
                                    took advantage of yeast genetics and we studied fat accumulation in different conditions, where we
                                    could rationally modulate this process in agreement with our computational predictions. Our results
                                    pave the way for a new conceptual understanding of LD biogenesis in the context of ER homeostasis
                                    and function.

                                    Results
                                    Diacylglycerol promotes nucleation of TG blisters
                                    In yeast, diacylglycerol (DAG) has been shown to accumulate at sites of LD
                                    formation (Choudhary et al., 2018). In addition, deletion of Pah1, the lipid phosphatase converting
                                    phosphatidic acid (PA) into DAG upstream of TG synthesis, results in a phenotype where the ER
                                    shows extensive proliferation and where NLs are present in the cell at significant concentrations but
                                    fail to cluster into LD and rather accumulate in the ER (Adeyo et al., 2011).
                                        To further characterize the role of DAG on LD biogenesis, we expressed a
                                    previously characterized DAG sensor in the ER of yeast cells (Choudhary et al., 2018). This sensor is
                                    comprised of tandem C1 domains from human protein kinase D (C1a/b-PKD) fused to GFP, which in
                                    turn is fused to the transmembrane region of Ubc6, a tail anchored domain
                                    protein (Choudhary et al., 2018). With this probe, we could compare the localization of DAG in the
                                    ER of wild-type cells with that of cells in which NLs fail to be packaged into LDs and are rather
                                    spread over the entire ER, such as those where TG is the only NL and Pah1 is deleted. To strictly
                                    focus on the PA!DAG!TG pathway, we opted to investigate this behavior in a yeast strain that is
                                    devoid of sterol ester. This can be achieved by deleting both acyltransferases responsible for sterol
                                    ester formation (Are1, Are2) in conjunction with Pah1 (pah1Dare1Dare2D, Figure 1A).
                                        In wild-type cells, the ER-DAG sensor localizes in the ER and is enriched in few puncta per cell
                                    (Figure 1A). In cells lacking NL synthesis (dga1Dlro1Dare1Dare2D) the distribution of the ER-DAG

Zoni, Khaddaj, et al. eLife 2021;10:e62886. DOI: https://doi.org/10.7554/eLife.62886                                                      2 of 24
Research article Cell Biology Structural Biology and Molecular Biophysics
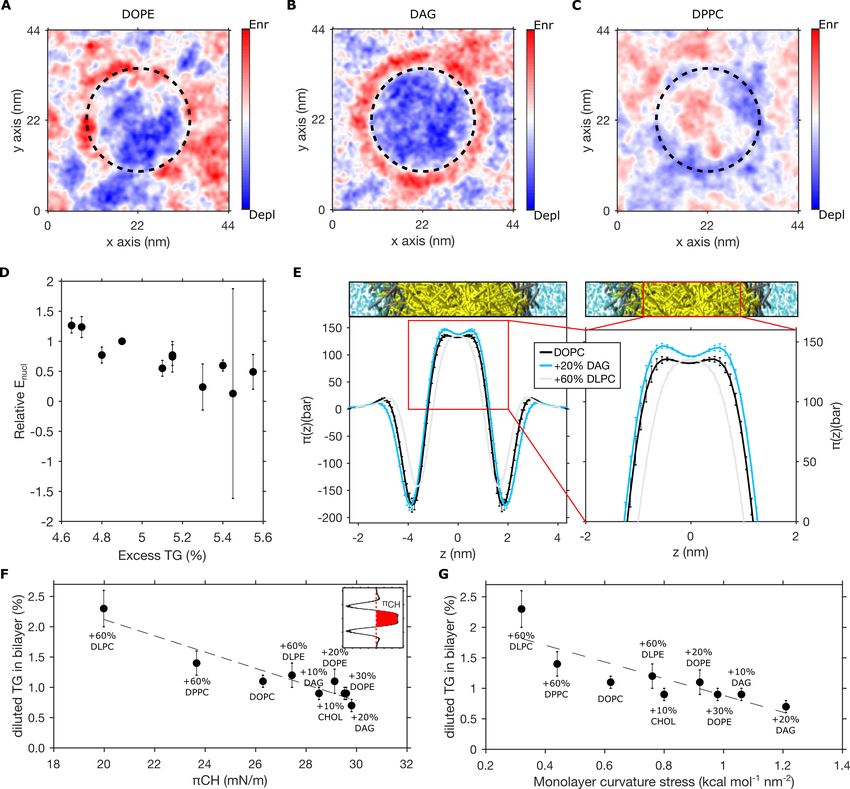
Figure 1. Diacylglycerol (DAG) promotes nucleation of triglyceride (TG) blisters. (A) Fluorescence microscopy images of WT, dga1Dlro1Dare1Dare2D
(4D) and pah1Dare1Dare2D yeast cells. Left panels: neutral lipids (NLs) are stained by BODIPY, right panels: ER-DAG sensor staining. Microscope
intensity settings in the three panels are identical to allow for quantitative comparison. (B) Setup used to investigate TG nucleation in molecular
dynamics (MD) simulations. TG at different concentrations are randomly distributed in a bilayer and simulations are run until formation of blisters or for
a total length of 1.5 ms. TG concentrations are reported as ratio between TG and phospholipids (PLs). (C) Rate of formation of TG blisters at different
TG concentrations, obtained from MD simulations. (D) Rate of formation of TG blisters at different TG concentrations in the presence of DAG (10 mol%,
20 mol%), from MD simulations. TG concentrations are reported as ratio between TG and PLs. (E) Top view of TG nucleation from simulations of lipid
bilayers with two coexisting DAG concentrations (6 mol% and 13 mol%). The two bilayer regions with different DAG concentrations have identical
surface areas.
The online version of this article includes the following figure supplement(s) for figure 1:
Figure supplement 1. Diacylglycerol (DAG) promotes nucleation of triglyceride (TG) blisters.
sensor is consistent with that of the wild type with few puncta per cells (Figure 1A). However, in cells
where TG fails to be packaged in LDs and is rather spread in a proliferated ER (as in
pah1D [(Adeyo et al., 2011)]), the ER-DAG sensor fails to mark discrete ER sites and rather shows a
uniform ER localization (Figure 1A).
While the observed defect in LD formation in the pah1D strain (Adeyo et al., 2011) could simply
originate from the increase in ER membrane, and hence in larger area for NL diffusion, our data sug-
gest that increased DAG local concentration at specific ER sites might also play a role in LD forma-
tion, in agreement with similar results reported while this work was under review, showing that DAG
accumulates at LD formation sites marked by seipin and Nem1 (Choudhary et al., 2020).
To investigate whether DAG plays a role in promoting LD formation independent of its role in
protein recruiting, we opted to reconstitute in silico the process of spontaneous TG blister nucle-
ation previously observed by Khandelia et al., 2010. To do so, we built lipid bilayers with TG mole-
cules initially distributed randomly between the two leaflets of the membrane (Figure 1B), and we
then let the simulations run toward equilibrium until lens formation took place. We observed that, in
pure 1,2-dioleoyl-sn-glycero-3-phosphocholine (DOPC) bilayers, lens formation took place starting at
TG/PL concentrations above 4% (Figure 1C), in agreement with what was previously
Zoni, Khaddaj, et al. eLife 2021;10:e62886. DOI: https://doi.org/10.7554/eLife.62886 3 of 24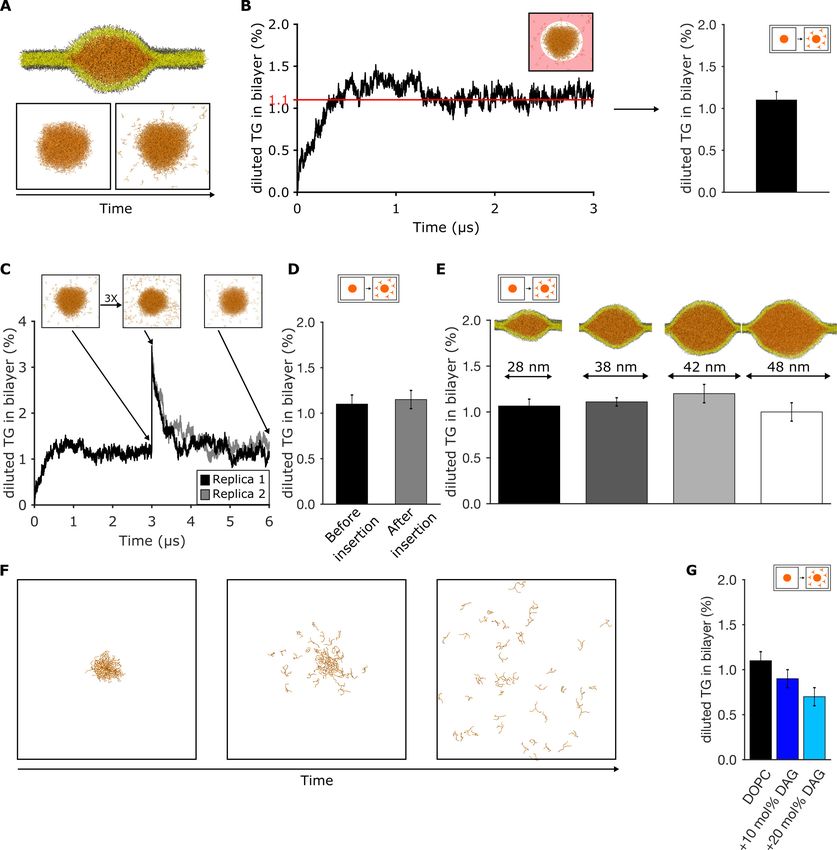
Research article                                                            Cell Biology Structural Biology and Molecular Biophysics

                                    reported (Khandelia et al., 2010). In addition, we observed that the rate of lens formation is concen-
                                    tration-dependent, as in classical nucleation processes (Thiam and Forêt, 2016; Figure 1C). Next,
                                    we prepared DOPC bilayers with increasing amounts of DAG, and we investigated TG blister forma-
                                    tion (Figure 1D) in these conditions. Remarkably, we observed a pronounced effect of DAG toward
                                    blister formation, with DAG promoting phase separation at low (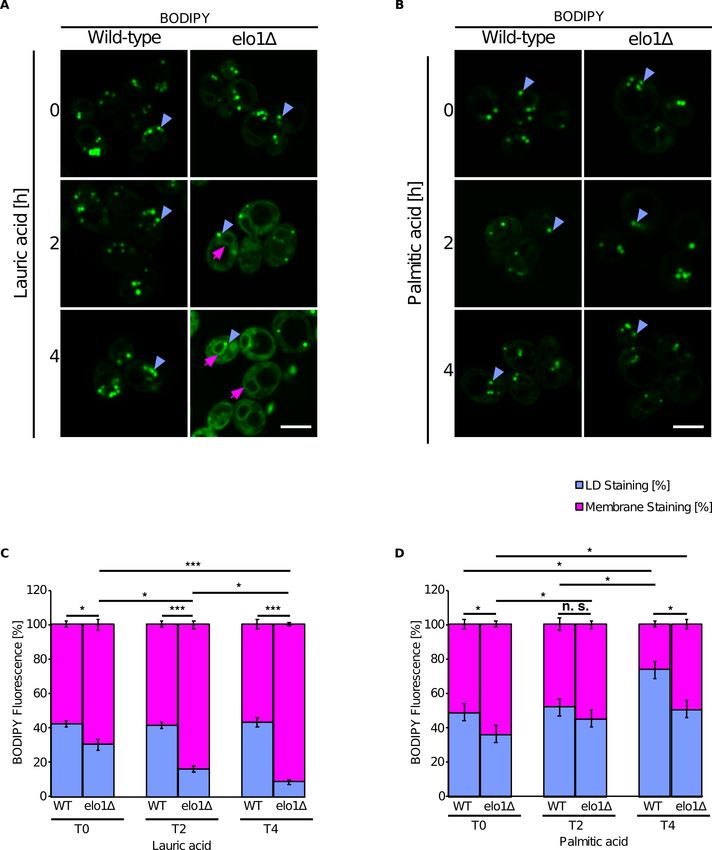
Research article                                                                    Cell Biology Structural Biology and Molecular Biophysics

Figure 2. Triglyceride (TG) blister formation in lipid bilayers is consistent with a phase separation process. (A) Setup used to measure the amount of
diluted TG via spontaneous diffusion from a pre-formed blister and (B) quantification over time. The area in which TG is assumed as diluted is
highlighted in light red. (C) Time evolution of the percentage of diluted TG inside the bilayer. The injection of additional TG molecules was performed
after 3 ms of dynamics. (D) Comparison between the values of diluted TG before and after the insertion of TG in the bilayer. (E) Quantification of diluted
TG in oil blisters of different sizes. (F) Time evolution of blister dissolution when the total TG concentration in the system is below the threshold
observed in (B and C). (G) Percentage of diluted TG in lipid bilayers enriched in diacylglycerol (DAG) lipids. In all the panels, TG concentrations are
reported as ratio between TG and phospholipid (PL).
The online version of this article includes the following figure supplement(s) for figure 2:
Figure supplement 1. Choice of the radius for the calculation of diluted triglycerides (TG).

Zoni, Khaddaj, et al. eLife 2021;10:e62886. DOI: https://doi.org/10.7554/eLife.62886                                                               5 of 24
Research article Cell Biology Structural Biology and Molecular Biophysics
(Figure 2G). This result parallels our previous
observation that DAG promotes blister formation
(Figure 1D), and it provides a mechanistic expla-
nation of why deletion of Pah1, the lipid phos-
phatase responsible for the synthesis of DAG,
results in NL accumulation in a proliferated ER
(Figure 1 and ref [(Adeyo et al., 2011)]).
The ER PL content is optimal in
decreasing free TG levels and
Video 1. Triglyceride (TG) lens dissolution in a DOPC promoting TG blister formation
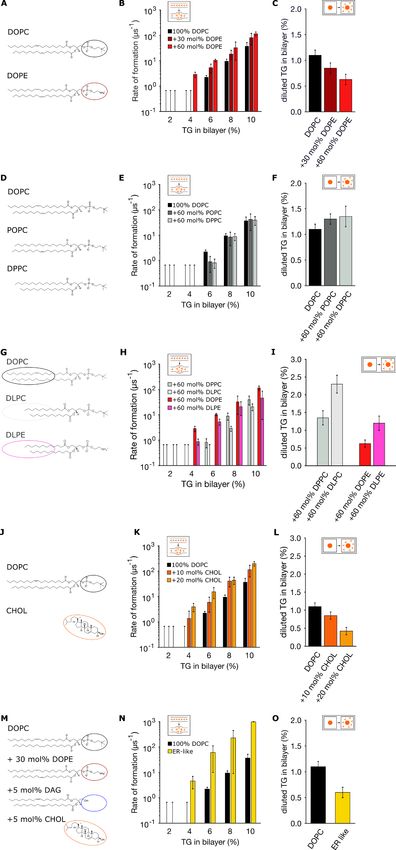
bilayer. The concentration of TG is below (Research article Cell Biology Structural Biology and Molecular Biophysics Figure 3. Endoplasmic reticulum (ER) membrane lipids promote triglyceride (TG) blister formation. (A, D, G, J, M) Lipid compositions tested and chemical structures of the various lipids involved in the mixtures. (B, E, H, K, N) Corresponding rates of blister formation, and (C, F, I, L, O) percentage of diluted TG. In all the panels, TG concentrations are reported as ratio between TG and phospholipid (PL). Zoni, Khaddaj, et al. eLife 2021;10:e62886. DOI: https://doi.org/10.7554/eLife.62886 7 of 24
Research article                                                                   Cell Biology Structural Biology and Molecular Biophysics

                                     DAG accumulating in the region of negative curvature surrounding the TG blister (Figure 4A and B).
                                     At the same time, however, also PL mixtures consisting of saturated (1,2-dipalmitoyl-sn-glycero-3-
                                     phosphocholine, DPPC) and unsaturated (DOPC) lipids show PL de-mixing (Figure 4C) even if in
                                     those conditions blister formation is opposed with respect to pure DOPC lipid bilayers. Thus, our

Figure 4. Pre-existing bilayer stresses modulate in-bilayer diluted triglyceride (TG) concentration. (A–C) Depletion-enrichment maps for (A) DOPC + 20
mol% DOPE, (B) DOPC + 20 mol% diacylglycerol (DAG), and (C) DOPC + 60 mol% DPPC bilayers in the presence of a TG blister (dashed line). (D)
Correlation between the relative nucleation energy (Enucl) for different bilayer compositions (with respect to Enucl of DOPC bilayers) and excess TG. (E)
Lateral pressure profile of bilayers containing different lipid compositions. (F and G) Correlation between chain pressure pCH (F) or monolayer curvature
stress (G) and TG equilibrium concentration for bilayer mixtures containing DOPC, DOPE, DAG, DPPC, DLPC, DLPE, and cholesterol. All the
percentage in the graph referring to bilayer compositions are to be intended as mol%, while TG concentrations are reported as ratio between TG and
phospholipid (PL).

Zoni, Khaddaj, et al. eLife 2021;10:e62886. DOI: https://doi.org/10.7554/eLife.62886                                                              8 of 24
Research article Cell Biology Structural Biology and Molecular Biophysics
simulations suggest that PL de-mixing per se (Zanghellini et al., 2010) is not sufficient to promote
TG blister formation.
On the other hand, the nucleation energy for nascent TG blisters can be described as a sum of
two linked contributions, Enucl = ED+Es, with ED arising from TG de-mixing and Es arising from
interfacial and mechanical contributions (Thiam and Forêt, 2016). Hence, the effect of PLs on phase
separation can be both on TG chemical potential and membrane mechanics: PLs may induce curva-
ture stress in the bilayer that could potentially alter TG chemical potential and generate interactions
with TG that could alter both monolayer and bilayer bending rigidity.
We estimated the nucleation energy Enucl from our MD simulations of spontaneous blister forma-
tion and we plotted it, for the various lipid compositions tested in this study, as a function of the
excess of TG, i.e. the difference between the TG% used in the nucleation setup (6%) and the corre-
sponding TG chemical potential (Figure 4D). The nucleation energy decreased with excess TG in the
bilayer, which agrees with the description of nucleation phenomena. Therefore, this observation sup-
ports that the simple increase in TG bilayer chemical potential, here, through increasing TG bilayer
concentration, is sufficient to stimulate LD nucleation. Hence, the observed changes in nucleation
rate as a function of lipid composition pertain, at least partly, to a variation in TG bilayer chemical
potential (Figure 4D). This model agrees with recent experimental results (Santinho et al., 2020)
showing that the effect of membrane curvature in LD formation originates from its ability to alter the
critical TG concentration required for the spontaneous condensation of TG.
TG chemical potential is modulated by pre-existing bilayer stresses
Our above model suggests that both thermodynamic and kinetic properties of TG-in-bilayer systems
can be interpreted by a change in TG chemical potential in the diluted phase. Such changes may be
induced by specific TG–PL interactions or pre-existing bilayer stresses. Therefore, we investigated
how these two factors modulate the equilibrium concentration of TG in bilayers.
To do so, we next computed the lateral pressure profile (LPP) of the same lipid bilayers previously
described, but in the absence of TG molecules, with the aim of identifying molecular properties that
would correlate with their equilibrium TG concentration. In short, the LPP describes the distribution
of lateral stresses across a PL bilayer that arise from the interactions between the lipid molecules,
and it provides a direct connection between molecular (e.g. lipid intrinsic curvature and lipid–lipid
interactions) and large-scale (e.g. surface tension and bending rigidity) properties of
PL (Marsh, 2007).
We observed that lipids showing a marked depletion of TG from the membrane, such as DAG,
induce a substantial increase in the positive pressure between the hydrophobic chains with respect
to pure DOPC bilayers (Figure 4E). Of note, while LPPs from CG simulations do not have the same
level of detail of atomistic ones, this increase in lipid chain pressure by DAG (and PE) is consistent
with previously reported LPPs using atomistic simulations (Vamparys et al., 2013; Ding et al.,
2015). On the other hand, the bilayer conditions we found to oppose TG blister formation, such as
the presence of short-chain lipids, display the opposite behavior, i.e. a decrease in lipid chain pres-
sure (Figure 4E).
To better quantify the relationship between TG concentration and lipids’ acyl chains properties,
we plotted the equilibrium TG concentration computed in our simulations against two distinct prop-
erties: (i) the hydrophobic pressure pCH, i.e. the integral of the LPP corresponding to the area of the
positive region (p(z) > 0) between both glycerol minima in the LPP (Figure 4F; Marsh, 1996) and (ii)
the total monolayer curvature stress kb c20, where k b is the monolayer bending rigidity and c0 its
spontaneous curvature (Figure 4G).
In both cases, we found a very good correlation, suggesting that pre-existing stresses in the
bilayer can predict the propensity of the bilayer to accept increasing concentration of TG molecules,
and hence oppose or promote their spontaneous de-mixing to form oil blisters. In addition, the
observation that TG chemical potential and monolayer curvature stress are correlated (Figure 4G)
confirms that mechanical and de-mixing energetic contributions are not independent (Thiam and
Forêt, 2016), as TG de-mixing is modulated by bilayer mechanical properties.
Overall, the correlations we observed between TG chemical potential and bilayer stresses provide
some semi-quantitative interpretations, with curvature stress allowing to predict the effect on TG
accumulation based on PL intrinsic curvature in the absence of explicit LPP calculations, and with the
correlation with hydrophobic pressure suggesting that changes in bilayer pressure originating from
Zoni, Khaddaj, et al. eLife 2021;10:e62886. DOI: https://doi.org/10.7554/eLife.62886 9 of 24Research article Cell Biology Structural Biology and Molecular Biophysics
the repulsion among PL hydrophobic chains are proportional to changes in chemical potential, via a
Gibbs–Duhem relationship.
Acyl-chain saturation promotes TG accumulation in the ER
Recent experimental and computational results suggest that nucleation is largely driven by protein
activity in vivo (Zoni et al., 2020 Prasanna et al., 2021). On the other hand, it remains unclear
whether variations in PL content could alter TG concentration in the ER. Thus, to test semi-quantita-
tively our hypothesis that PL modulate TG-in bilayer chemical potential in vivo, we resorted to fluo-
rescence microscopy experiments in yeast, a model system that has been widely used to investigate
LD biogenesis. We reasoned that if we could modulate the balance of NLs between LDs and the ER
membrane (i.e. between the condensed and diluted phases) with independent approaches consis-
tently with our in silico predictions, this would provide additional evidence in support of the quality
of our modeling approach.
To do so, we first investigated the equilibrium between NLs in the ER vs LDs in yeast cells with an
altered ratio between saturated and unsaturated fatty acids, as our simulations suggest (Figure 3D–
F) that saturated PLs slightly decrease LD formation and promote accumulation of TG in the lipid
bilayer. Of note, unlike DAG lipids that accumulate at sites of LD biogenesis due to local enrichment
of DAG-generating enzymes (Choudhary et al., 2020), lipids carrying unsaturated chains are unlikely
to accumulate locally at sites of LD formation, but should rather spread somewhat homogeneously
in the ER membrane.
Since fatty acids are incorporated in both PLs and TG during lipid remodeling, we first investi-
gated in silico the effect of increasing acyl chain saturation in TG (Figure 5). Our results suggest
that, like for PLs, increasing TG saturation results in TG accumulation in the bilayer (Figure 5B).
Notably, increasing acyl chain saturation in TG molecules has a larger effect on the amount of
diluted TG in comparison with increasing acyl chain saturation in PLs.
Next, we used a temperature-sensitive allele of Ole1, a gene that is essential for production of
monounsaturated fatty acids as it expresses the lone delta-9 desaturase enzyme in
yeast (Stukey et al., 1989). This temperature-sensitive allele results in intact proteins with impaired
desaturase activity already at permissive temperature (24˚C), with increased C16:0 and decreased
C18:1 levels (Tatzer et al., 2002) and inactive proteins at non-permissive temperature (37˚C) with a
major decrease in the ratio between unsaturated and saturated fatty acids in the cell (Stewart and
Yaffe, 1991).
Using fluorescence microscopy, we observed BODIPY-positive ER structures at the non-permis-
sive temperature, indicating that the amount of NLs present in the ER increases as a result of the
increase in saturated cellular fatty acids in comparison to wild type (Figure 5C and D). This enrich-
ment was promoted by supplementing the cells with the saturated palmitic acid (Figure 5C and D),
while it was entirely rescued by supplementing the cells with the unsaturated palmitoleic acid
(Figure 5C and D). To further quantify this behavior, we opted to measure the fluorescent intensities
of LDs and membrane (normalized to the total cell intensity) in the different conditions, and we could
confirm that an increase in the ratio between saturated and unsaturated fatty acids leads to an
increased accumulation of NLs in the membrane, in agreement with our in silico data
(Figure 5E and F).
Short-chain lipids promote TG accumulation in the ER
Next, we investigated whether short-chain lipids could alter the equilibrium between LD formation
and NL accumulation in the ER in yeast, as we found that, in silico, those lipids result in significant
accumulation of TG in the bilayer (Figure 3).
To test whether the accumulation of short-chain containing lipids affects NL distribution in vivo,
we used a yeast mutant defective in acyl chain elongation (Elo1D). Elo1D mutant cells were cultivated
in media supplemented either with lauric acid (C12:0) or palmitic acid (C16:0) and NL distribution
between the ER and LDs was analyzed by staining with BODIPY. Elo1D mutant cells displayed
increased membrane-associated BODIPY fluorescence when cultivated in the presence of lauric acid
compared to palmitic acid, suggesting that NL accumulate in the ER in cells containing short-chain
PLs (Figure 6).
Zoni, Khaddaj, et al. eLife 2021;10:e62886. DOI: https://doi.org/10.7554/eLife.62886 10 of 24Research article Cell Biology Structural Biology and Molecular Biophysics Figure 5. Lipid saturation promotes triglyceride (TG) accumulation in the endoplasmic reticulum (ER). (A) Chemical structure of unsaturated TG used in molecular dynamics (MD) simulations. Black ovals indicate the presence of double bonds in the acyl chain. (B) Equilibrium ’diluted’ concentration of different TG in DOPC bilayers. TG concentrations are reported as ratio between TG and phospholipids (PLs). (C and D) Fluorescence microscopy images of wild-type and temperature-sensitive ole1ts at 24˚C (C) and 37˚C (D). Strains were cultivated in SC medium containing palmitic acid (C16:0) or Figure 5 continued on next page Zoni, Khaddaj, et al. eLife 2021;10:e62886. DOI: https://doi.org/10.7554/eLife.62886 11 of 24
Research article                                                                  Cell Biology Structural Biology and Molecular Biophysics

Figure 5 continued
palmitoleic acid (C16:1) and cells were stained with the neutral lipid (NL) marker BODIPY. The blue arrowheads highlight lipid droplets (LDs), and the
pink arrows point to the cortical and perinuclear ER membrane. (E and F) Quantification of fluorescent intensities of LDs and membranes (n = 50) in the
different conditions shown in (C and D): Values represent fluorescent intensity relative to total cellular fluorescence. Asterisks denote statistical
significance (Student’s t-test, *p < 0.05, ***p < 0.001), n.s., non-significant.

                                        In summary, the agreement between the experimental results and our computational predictions
                                     indicates that our modeling approach, despite its inherent simplicity, is able to faithfully reproduce
                                     some of the underlying molecular properties of LD formation in vivo, and it points to an important
                                     role of ER lipid composition, and especially of its internal stresses, in this biological process.

                                     Discussion
                                     The current model of LD formation posits that after synthesis in the ER membrane, TG molecules
                                     accumulates at ER sites marked by seipin (Salo et al., 2019; Choudhary et al., 2020; Chung et al.,
                                     2019), that then acts as a nucleation seed for the formation of a nascent TG lens that will subse-
                                     quently grow into a mature LD. Alterations in lipid homeostasis result in defects in LD
                                     formation (Adeyo et al., 2011; Santinho et al., 2020; Cohen et al., 2015; Vevea et al., 2015;
                                     Wolinski et al., 2015) in some cases promoting non-negligible accumulation of TG in the
                                     ER (Adeyo et al., 2011; Cartwright et al., 2015) and alterations in ER morphology (Adeyo et al.,
                                     2011; Vevea et al., 2015; Wolinski et al., 2015). On one hand, these experiments suggest that a
                                     detectable accumulation of TG in the ER is a hallmark of non-physiological conditions, under which
                                     proper LD formation does not take place; on the other hand, they indicate that seipin-independent
                                     ER properties, such as its lipid composition, can significantly alter the propensity of LD formation.
                                         Our data provide a molecular explanation for these experimental observations, and they are con-
                                     sistent with previously proposed theoretical considerations suggesting that the spontaneous de-mix-
                                     ing of TG in the ER can lead to LD formation consistently with a phase separation
                                     process (Thiam and Forêt, 2016). Thus, while increasing attention is being directed at the role of
                                     the protein machinery that localizes at the site of LD formation (Salo et al., 2019; Choudhary et al.,
                                     2020; Chung et al., 2019; Wang et al., 2018), our results provide further evidence in support of a
                                     mechanism of LD formation where proteins act as the main nucleation factor while PLs modulate the
                                     propensity for NL de-mixing from the ER membrane.
                                         Importantly, our data suggest that numerous experimental observations can be interpreted in
                                     molecular terms by considering the equilibrium concentration of TG in the ER membrane as a major
                                     factor in determining the propensity of LD formation. As a consequence, while later stages of LD
                                     biogenesis, such as LD budding, can be satisfactorily described using continuum theory
                                     approaches (Ben M’barek et al., 2017; Choudhary et al., 2018), the early stages of LD formation
                                     appear to be dominated by the specific molecular interactions between PLs and TG, and thus
                                     appear better suited to be investigated with chemical specific particle-based approaches such as
                                     MD simulations.
                                         Our observations have important implications for both ER homeostasis and LD biogenesis and
                                     growth. First, our data suggest that the amount of TG in the ER at equilibrium is not zero. This has
                                     potential implications in the catabolism and homeostasis of TG as it opens the possibility that lipases
                                     or lipid transport proteins might interact with TG directly from the ER, rather than upon binding to
                                     LD. Second, our model suggests that when a nascent LD is formed, all TG in excess of its equilibrium
                                     chemical potential in the ER will flow to existing LD without the need for additional external energy,
                                     as long as the protein machinery around the LD-ER contact site does not prevent free diffusion of
                                     TG. This is particularly important as pre-existing LDs that are resistant to starvation have been
                                     observed, for example, in COS-1 cells (Kassan et al., 2013).
                                         Our data suggest that pre-existing lateral stresses in the hydrophobic core of the membrane
                                     accurately predict the propensity of TG to condensate in LDs. Remarkably, the specific composition
                                     of the ER membrane, and namely high levels of both unsaturated lipids and
                                     phosphatidylethanolamine (van Meer et al., 2008; Upadhyaya and Sheetz, 2004), contribute to
                                     keep TG in the ER at very low concentrations, thus not only promoting their packaging into LD, but
                                     also potentially preventing ER stress and lipotoxicity (Listenberger et al., 2003; Ertunc and

Zoni, Khaddaj, et al. eLife 2021;10:e62886. DOI: https://doi.org/10.7554/eLife.62886                                                           12 of 24
Research article Cell Biology Structural Biology and Molecular Biophysics Figure 6. Short-chain lipids promote triglyceride (TG) accumulation in the endoplasmic reticulum (ER). (A and B) Fluorescence microscopy images of wild-type and elo1D mutant cells cultivated in SC medium containing lauric acid (C12:0, 2 mM) or palmitic acid (C16:0, 2 mM) for the indicated period of time. Cells were stained with BODIPY and visualized by fluorescence microscopy. Lipid droplets (LDs) are indicated by blue arrowheads and ER stained with BODIPY is marked by purple arrows. Scale bar, 5 mM. (C and D) Quantification of BODIPY fluorescence of LD and cellular membranes (n = 50). Figure 6 continued on next page Zoni, Khaddaj, et al. eLife 2021;10:e62886. DOI: https://doi.org/10.7554/eLife.62886 13 of 24
Research article                                                                       Cell Biology Structural Biology and Molecular Biophysics

Figure 6 continued
Values represent fluorescent intensity relative to total cellular fluorescence. Asterisks denote statistical significance (Student’s t-test, *p < 0.05,
***p < 0.001), n.s., non-significant.

                                       Hotamisligil, 2016). Interestingly, we observed that an increase in the amount of saturated fatty
                                       acids in yeast cells promotes TG accumulation in the ER. This could potentially provide a new molec-
                                       ular explanation of the elevated toxicity of saturated fatty acids that is independent to the efficiency
                                       of their incorporation into TG (Listenberger et al., 2003; Choi et al., 2011; Leamy et al., 2016). In
                                       addition, our model could help explain how fat accumulation could be modulated in response to
                                       environmental variations, with cells potentially adjusting the local composition of the ER, for exam-
                                       ple, to promote or delay LD formation in response to the intake of different nutrients.
                                           Our model suggests that an elevated local concentration of DAG, the natural TG precursor, can
                                       promote LD formation by virtue of unfavorable interactions arising between DAG and TG when both
                                       are present in a lipid membrane. Thus, upon PA to DAG conversion, not only TG synthesis increases,
                                       as more substrate becomes available, but also the physical prowess of the ER membrane for TG
                                       packaging increases, leading to a positive feedback loop. Quite notably, in order to proceed to later
                                       stages of LD formation, and namely LD budding from the ER, the concentration of DAG has to
                                       decrease (Choudhary et al., 2018). Thus, our data suggest that DAG can be considered as a master
                                       regulator of the various stages of LD biogenesis.
                                           A potential limitation of our approach is the description of molecular systems using a CG force
                                       field that inherently introduces quantitative inaccuracies in the reproduction of molecular interac-
                                       tions. In this work, this is particularly relevant for what concerns the ability of our model to correctly
                                       reproduce the LPP, and the corresponding bilayer stresses, for the various lipids investigated in this
                                       study. However, the good agreement between our CG LPP and atomistic LPP available in the
                                       literature (Vamparys et al., 2013; Ding et al., 2015) is very encouraging for the overall quality of
                                       our modeling approach. In addition, our experimental strategy does not allow us to investigate
                                       directly in situ the mechanism of LD formation, but rather focuses on the quantification of TG accu-
                                       mulation in the ER membrane when cells are starved for essential fatty acids, i.e. ole1ts at 37˚C for
                                       unsaturated lipids and elo1D for long acyl chains when grown in C12 medium. As such, we cannot
                                       quantify to what extent the observed reduction in LD number is caused by a defect in LD formation
                                       or by enhanced induction of lipolysis as a response to starvation for essential fatty acids. However,
                                       our observation that TG blister formation in silico, like in vitro (Thiam and Forêt, 2016), takes place
                                       following a phase separation mechanism, strongly indicates that TG accumulation in the ER is very
                                       likely coupled with a defect in LD formation, and vice versa.
                                           In summary, our results provide a new conceptual view on the mechanism of LD biogenesis and
                                       fat accumulation, whereby not only local events taking place at the specific sites of LD formation,
                                       but also more global properties of the surrounding ER membrane play a major role in the overall
                                       regulation of this process. On one hand, these properties are easier to measure, for example by
                                       means of genetic manipulation of lipid composition coupled with lipid imaging techniques, than
                                       local properties such as LD surface or line tension. On the other hand, our framework suggests that
                                       physiological variations in ER lipid composition at sites spatially distinct from LDs, for example by
                                       means of lipid transport or establishment of contact sites with other organelles, might ultimately
                                       provide an alternative cellular route to modulate intracellular fat accumulation.

                                       Materials and methods
Key resources table
                                                                                                                                                Additional
Reagent type (species) or resource            Designation                 Source or reference                          Identifiers              information
Strain, strain background (S. cerevisiae)     BY4741                      Euroscarf                                    RRID: SCR_003093         Mata, his3D1,
                                                                                                                                                leu2D0,
                                                                                                                                                met15D0,
                                                                                                                                                ura3D0.
Continued on next page

Zoni, Khaddaj, et al. eLife 2021;10:e62886. DOI: https://doi.org/10.7554/eLife.62886                                                                      14 of 24
Research article Cell Biology Structural Biology and Molecular Biophysics
Continued
Additional
Reagent type (species) or resource Designation Source or reference Identifiers information
Chemical compound, drug Palmitic acid Sigma-Aldrich P0500 2 mM
RRID:SCR_008988
Chemical compound, drug Palmitoleic acid Sigma-Aldrich P9417 2 mM
RRID:SCR_008988
Chemical compound, drug Lauric acid Sigma-Aldrich 8053330100 2 mM
RRID:SCR_008988
Chemical compound, drug Brij58 Sigma-Aldrich P5884 1%
RRID:SCR_008988
Software, algorithm VisiView Visitron systems GMBH 4.2.0
Software, algorithm ImageJ https://imagej.nih.gov/ij/ RRID:SCR_003070 Schneider et al.,
2012
Software, algorithm Photoshop Adobe, Mountain View RRID:SCR_014199
Software, algorithm LAMMPS https://lammps.sandia.gov RRID:SCR_015240 MD simulations
software
Software, algorithm GROMACS http://www.gromacs.org RRID:SCR_014565 MD simulations
software
Software, algorithm VMD http://www.ks.uiuc.edu/Research/vmd/ RRID:SCR_001820
Other BODIPY493/503 stain Invitrogen D3922 1 mg/mL
RRID:SCR_008988
Molecular dynamics (MD) simulations
All MD simulations were performed using the software LAMMPS (Plimpton, 1995) and employing
the Shinoda–Devane–Klein (SDK) force field (Shinoda et al., 2007; Bacle et al., 2017;
MacDermaid et al., 2015; Campomanes et al., 2019). Parameters for TG were taken from
(Bacle et al., 2017) and triolein was chosen as the model TG, unless explicitly otherwise stated
(Figure 5A and B), while 1-2-dioleoyl-sn-glycerol has been used as model for DAG. Non-bonded
interactions of DAG with 1,2-dioleoyl-sn-glycero-3-phosphoethanolamine (DOPE) and cholesterol
were obtained by combination rules, as described in MacDermaid et al., 2015 and are listed in
Supplementary file 1. Initial configurations and input files were obtained through conversion of
atomistic snapshots using the CG-it software (https://github.com/CG-it/).
In the simulations, temperature and pressure were controlled via a Nosé–Hoover
thermostat (Nosé, 1984) and barostat (Parrinello and Rahman, 1981; Martyna et al., 1994;
Shinoda et al., 2004): target temperature was 310 K and average pressure was 1 atm. The lateral xy
dimensions were coupled, while the z dimension was allowed to fluctuate independently. Tempera-
ture was dumped every 0.4 ps, while pressure every 1 ps. Linear and angular momenta were
removed every 100 timesteps. Van der Waals and electrostatic interactions were truncated at 1.5
nm. Long-range electrostatics beyond this cutoff were computed using the particle-particle-particle-
mesh (PPPM) solver, with an RMS force error of 10 5 kcal mol 1 Å 1 and order 3. In all CG-SDK sys-
tems, a time step of 20 fs was used, except for bilayers containing cholesterol, where a time step of
10 fs was used.
MD systems setup
In order to study the formation of TG lenses (Figure 1B), bilayers containing different concentrations
of TG were employed. To build these systems, boxes consisting of 50 PL molecules and a variable
number of TG molecules, to see the effect of different TG concentrations on lens formation, were ini-
tially prepared. The two PL monolayers were displaced along the z-axis in order to allow the inser-
tion of the TG molecules and avoid steric clashes due to bad contacts or overlapping molecules. The
TG molecules were subsequently randomly placed between the two monolayers. Boxes were then
replicated eight times along the x- and y-axes. Every system ultimately included a total of 3200 PL
molecules. Different bilayer compositions were tested, as reported in Table 1. Simulations were run
until spontaneous lens formation (see section MD simulations analysis for details) or for a total of 1.5
Zoni, Khaddaj, et al. eLife 2021;10:e62886. DOI: https://doi.org/10.7554/eLife.62886 15 of 24Research article Cell Biology Structural Biology and Molecular Biophysics
Table 1. List of all the molecular dynamics (MD) setups, with bilayer composition, number of triglyceride (TG) molecules, number of
replicas, and length of simulations.
TG lenses formation
Bilayer composition
System (no. of molecules) No. of TG No. of replicas Length (ms)
100% DOPC 3200 DOPC 64 3 1.5
3200 DOPC 128 3 1.5
3200 DOPC 192 3Research article Cell Biology Structural Biology and Molecular Biophysics
Table 1 continued
TG lenses formation
Bilayer composition
System (no. of molecules) No. of TG No. of replicas Length (ms)
2560 DOPC + 640 DAG 192 3Research article Cell Biology Structural Biology and Molecular Biophysics
Table 1 continued
TG lenses formation
Bilayer composition
System (no. of molecules) No. of TG No. of replicas Length (ms)
+10 mol% CHOL 2880 DOPC + 320 CHOL 0 3 0.2
+20 mol% DAG 2560 DOPC + 640 DAG 0 3 0.2
+10 mol% DAG 2880 DOPC + 320 DAG 0 3 0.2
+30 mol% DOPE 2240 DOPC + 960 DOPE 0 3 0.2
+20 mol% DOPE 2560 DOPC + 640 DOPE 0 3 0.2
+60 mol% DLPC 1280 DOPC + 1920 DLPC 0 3 0.2
+60 mol% DLPE 1280 DOPC + 1920 DLPE 0 3 0.2
+60 mol% DPPC 1280 DOPC + 1920 DPPC 0 3 0.2
ms per run if no spontaneous lens formation was observed (Table 1). TG concentration is always
reported as the ratio between TG and PL molecules.
The system with two regions with different DAG concentrations (Figure 1E) was obtained from a
bilayer with a uniform mixture of 2880 DOPC and 320 DAG plus 64 TG molecules. After minimiza-
tion, the DAG pool was divided into two different groups: one pool was free to move in all the
regions of the bilayer, the other was subjected to a repulsive wall with a cylindric shape that pre-
vented molecules to go back inside the cylinder once they crossed the wall in the opposite direction.
The final systems contain two regions with different DAG concentrations coexisting in the same
bilayer. The final concentration of DAG in the two regions is obtained as average concentration dur-
ing production, after 100 ns of production (Figure 1—figure supplement 1).
To calculate the concentration of diluted TG in the bilayer (Figure 2A,B, and G and Figure 3C,F,
I,L,O), systems were formed by positioning a lens of 1836 TG molecules between two monolayers
with 3025 DOPC lipids each, as in Ben M’barek et al., 2017. We also created bigger systems, with
12,250 lipids and 1836, 5508, and 9180 TG molecules or with 16,200 DOPC and 13,665 TG, in order
to study the size independence on the concentration of diluted TG in the bilayer at equilibrium
(Figure 2E). All bilayer compositions described in Table 1 were tested.
To study the effect of inserting new TG molecules in the bilayer (Figure 2C), we slightly separated
both PL monolayers along the z direction to accommodate more TG, and then those TG molecules
outside the previously formed lens (see section MD simulations analysis) were replicated three times
using the TopoTools VMD plugin (Kohlmeyer and Vermaas, 2017).
To study the effect of unsaturation in TG chains on the equilibrium concentration of
TG (Figure 5A and B), systems containing 6050 DOPC and 1836 TOOP (a TG molecule with two
oleic acids and one palmitic acid) or 1836 TOPP (a TG molecule with one oleic acid and two palmitic
acids) were built.
MD simulations analysis
TG lens formation was defined when an aggregate of at least 25 TG molecules within a 3.5 nm dis-
tance cutoff of a TG molecule was stable for at least 5 ns. The simulations were run until the forma-
tion of a TG lens was observed or for 1.5 ms if no aggregation occurred. For each TG concentration,
bilayer composition, and setup, three independent simulations were performed. The rate of forma-
tion was calculated, from the average over the three replicas, as the inverse of the time of formation.
Error bars were computed using error propagation as the standard deviation of the time of forma-
tion from the three independent simulations. For simulations where no formation was observed, the
error bars were given as the inverse of the total simulation time (1.5 ms).
The analysis of the concentration of diluted TG was performed using the protocol outlined below.
We defined a lens as a set composed by all the TG molecules found within a 5 nm distance of
another TG molecule and not within 2.8 nm of a PL. The ‘lens-free bilayer’ was accordingly defined
as all lipid molecules that were at least 2.5 nm away from the lens. We tested different selections
and we chose the selection at which the diluted TG concentration was converged (Figure 2—figure
Zoni, Khaddaj, et al. eLife 2021;10:e62886. DOI: https://doi.org/10.7554/eLife.62886 18 of 24Research article Cell Biology Structural Biology and Molecular Biophysics
supplement 1) and that allowed us to consider the widest area of lens-free bilayer, excluding the
side of the lens where TG molecules moved continuously inside and outside the lens (Figure 2—fig-
ure supplement 1). The simulations were run for 3 ms (see Table 1). The percentage of TG molecules
inside the bilayer was obtained averaging the values of the last 1.5 ms of simulation, and the corre-
sponding error bars were obtained from the standard deviation over two independent simulations.
TG concentration is always reported as the ratio between TG and PL molecules. The dimensions of
TG lenses were calculated using the minimum and the maximum x, y, and z coordinates of the TG
molecules at each side of the lens, averaged over time.
Density maps (Figure 4A–C) were calculated using GROMACS tools (Van Der Spoel et al.,
2005). To obtain an enrichment/depletion map for DOPE, the density map of DOPE was divided by
the sum of the maps of DOPE and DOPC and then divided by the concentration of DOPE in bulk.
The same approach was used to obtain enrichment/depletion map for DAG and DPPC.
The relative energy of nucleation (Enucl) was obtained from the rate of formation of blisters in
bilayers containing 6% TG (Figure 4D) with
Enucl =KT
nucleation rate / e
The values are reported as relative Enucl, considering DOPC bilayers as reference (Enucl [(composi-
tion)]/Enucl [(DOPC)]). The error bars are relative errors.
For the calculation of LPPs (Figure 4E), bilayers not containing TG molecules were equilibrated
for a variable length (from 200 to 1500 ns) and then run for additional 200 ns for the calculation of
LPP. Stress components along z were obtained using the LAMMPS commands ‘compute stress/
atom’ and ‘fix ave/chunch’ during production and then converted to corresponding pressures using
the script stress2press.py, available in the ELBA-LAMMPS toolkit (https://github.com/orsim/elba-
lammps/tree/master/tools). The LPP curves are reported as average and the error bars as standard
deviation over three independent replicas. pCH values were obtained integrating LPP curves for p(z)
values > 0, employing the Simpson’s rule and using a bin size of 0.01 Angstroms. The values of pCH
and the relative percentage change with DOPC bilayers as reference are reported in
Supplementary file 1.
Spontaneous curvatures, c0, for the bilayers were computed from the first moment of the LPPs
using the following Safran, 2003:
Z Lz =2
z½PT ðzÞ PN dz ¼ kb c0
0
where PN and PT are the normal and tangential components of the pressure tensor with respect
to the bilayer surface, the limits of the integral correspond to one of the membrane leaflets (assum-
ing that the bilayer midplane is located at z = 0 and its thickness is equal to Lz), and kb is the mono-
layer bending moduli.
The required monolayer bending moduli were estimated using two different approaches: (i) from
the real-space analysis of the instantaneous surface deformations and (ii) from the Fourier-space
analysis of the membrane fluctuations (Allolio et al., 2018). Notably, both methodologies led to sim-
ilar (and reasonable, kb being of the order of 10 kBT) values (see Supplementary file 1), which some-
how serves as further validation of the reliability of the obtained results. The values of kb used for
the calculations of the monolayer curvature stress (Figure 4G) are from the Fourier-space analysis of
the membrane fluctuations.
Yeast strains and growth conditions
Triple-mutant strain pah1D are1D are2D was generated by gene disruption, using PCR deletion cas-
settes and a marker rescue strategy (Longtine et al., 1998). Quadruple-mutant strain, are1D are2D
dga1D lro1D, was generated by mating and sporulation. Genotype of yeast strains is shown in
Supplementary file 1. Strains were cultivated in YP-rich medium (1% bacto yeast extract, 2% bacto
peptone [USBiological Swampscott, MA]) or selective (SC) medium (0.67% yeast nitrogen base with-
out amino acids (USBiological), 0.73 g/L amino acids) containing 2% glucose. Fatty acid-supple-
mented media contained either lauric, palmitic, or palmitoleic acid (Sigma-Aldrich, St Louis, MO)
and 1% Brij 58.
Zoni, Khaddaj, et al. eLife 2021;10:e62886. DOI: https://doi.org/10.7554/eLife.62886 19 of 24Research article Cell Biology Structural Biology and Molecular Biophysics
Fluorescence microscopy
BODIPY fluorescence was recorded using a Visitron Visiscope CSU-W1 (Visitron Systems, Puchheim
Germany), consisting of a CSU-W1 spinning disk head with a 50-mm pinhole disk (Yokogawa, Tokyo,
Japan) and Evolve 512 (Photometrics) EM-CCD camera mounted to a Nikon Ti-E inverted micro-
scope equipped with a PLAN APO 100 NA 1.3 oil objective (Nikon) and controlled by Visitron Visi-
View software 4.2.0. Cells were grown in SC media and stained with BODIPY 493/503 (1 mg/mL) for
5 min at room temperature. Images were recorded using identical microscope settings. BODIPY
fluorescence was measured using ImageJ and membrane-associated fluorescence was calculated by
subtracting LD-associated fluorescence from whole cell fluorescence. All experiments were repeated
three times.
Image rendering
All MD images were rendered using VMD software (Humphrey et al., 1996) and graphs were gener-
ated using the software MATLAB.
Experimental images were treated using Image-J software and then resized in Adobe Photoshop
CC 2015. Microscopic experiments were performed three times with similar results.
All source data, input files for MD simulations, and statistical analyses for Figure 5 can be found
at: http://doi.org/10.5281/zenodo.4457468.
Acknowledgements
We thank Vikram Reddy Ardham and Vineet Choudhary for useful discussions. This work was sup-
ported by the Swiss National Science Foundation (grant #163966). This work was supported by
grants from the Swiss National Supercomputing Centre (CSCS) under project ID s726, s842 and
s980. We acknowledge PRACE for awarding us access to Piz Daint, ETH Zurich/CSCS, Switzerland.
RS was supported by the Swiss National Science Foundation (31003A_173003) and the Novartis
Foundation for medical-biological Research (19B140).
Additional information
Funding
Funder Grant reference number Author
Schweizerischer Nationalfonds 163966 Valeria Zoni
zur Förderung der Wis- Pablo Campomanes
senschaftlichen Forschung Stefano Vanni
Novartis Stiftung für Medizi- 19B140 Roger Schneiter
nisch-Biologische Forschung
Schweizerischer Nationalfonds 31003A_173003 Roger Schneiter
zur Förderung der Wis-
senschaftlichen Forschung
The funders had no role in study design, data collection and interpretation, or the
decision to submit the work for publication.
Author contributions
Valeria Zoni, Software, Investigation, Writing - review and editing; Rasha Khaddaj, Investigation;
Pablo Campomanes, Software, Investigation, Methodology; Abdou Rachid Thiam, Conceptualiza-
tion, Writing - review and editing; Roger Schneiter, Conceptualization, Supervision, Funding acquisi-
tion, Project administration, Writing - review and editing; Stefano Vanni, Conceptualization,
Resources, Supervision, Funding acquisition, Investigation, Methodology, Writing - original draft,
Project administration, Writing - review and editing
Author ORCIDs
Valeria Zoni https://orcid.org/0000-0002-5370-0356
Rasha Khaddaj https://orcid.org/0000-0003-2951-3195
Zoni, Khaddaj, et al. eLife 2021;10:e62886. DOI: https://doi.org/10.7554/eLife.62886 20 of 24Research article Cell Biology Structural Biology and Molecular Biophysics
Pablo Campomanes https://orcid.org/0000-0001-9229-8323
Abdou Rachid Thiam https://orcid.org/0000-0001-7488-4724
Roger Schneiter https://orcid.org/0000-0002-9102-8396
Stefano Vanni https://orcid.org/0000-0003-2146-1140
Decision letter and Author response
Decision letter https://doi.org/10.7554/eLife.62886.sa1
Author response https://doi.org/10.7554/eLife.62886.sa2
Additional files
Supplementary files
. Supplementary file 1. Additional information. Supplementary table 1. Non-bonded parameters
derived for this study. Supplementary table 2. Calculated values of pCH for each bilayer composition
and the relative percentage change with respect to the composition ‘100% DOPC’. Supplementary
table 3. Calculated values of kb for each bilayer composition with two different methods: from the
real-space analysis of the instantaneous surface deformations (kb ReSIS) and from the Fourier-space
analysis of the membrane fluctuations (kb Fluct). Supplementary table 4: S. cerevisiae strains used in
this study.
. Transparent reporting form
Data availability
Data Availability: All source data, input files for MD simulations and statistical analyses can be found
at the following DOI: http://doi.org/10.5281/zenodo.4457468.
The following dataset was generated:
Database and
Author(s) Year Dataset title Dataset URL Identifier
Zoni V, Khaddaj R, 2021 Pre-existing bilayer stresses http://doi.org/10.5281/ Zenodo, 10.5281/
Campomanes P, modulate triglyceride accumulation zenodo.4457468 zenodo.4457468
Thiam AR, in the ER versus lipid droplets
Schneiter R, Vanni S
References
Adeyo O, Horn PJ, Lee S, Binns DD, Chandrahas A, Chapman KD, Goodman JM. 2011. The yeast lipin
orthologue Pah1p is important for biogenesis of lipid droplets. Journal of Cell Biology 192:1043–1055.
DOI: https://doi.org/10.1083/jcb.201010111
Allolio C, Haluts A, Harries D. 2018. A local instantaneous surface method for extracting membrane elastic
moduli from simulation: comparison with other strategies. Chemical Physics 514:31–43. DOI: https://doi.org/
10.1016/j.chemphys.2018.03.004
Bacle A, Gautier R, Jackson CL, Fuchs PFJ, Vanni S. 2017. Interdigitation between triglycerides and lipids
modulates surface properties of lipid droplets. Biophysical Journal 112:1417–1430. DOI: https://doi.org/10.
1016/j.bpj.2017.02.032, PMID: 28402884
Bartz R, Li WH, Venables B, Zehmer JK, Roth MR, Welti R, Anderson RG, Liu P, Chapman KD. 2007. Lipidomics
reveals that adiposomes store ether lipids and mediate phospholipid traffic. Journal of Lipid Research 48:837–
847. DOI: https://doi.org/10.1194/jlr.M600413-JLR200, PMID: 17210984
Ben M’barek K, Ajjaji D, Chorlay A, Vanni S, Forêt L, Thiam AR. 2017. ER membrane phospholipids and surface
tension control cellular lipid droplet formation. Developmental Cell 41:591–604. DOI: https://doi.org/10.1016/j.
devcel.2017.05.012, PMID: 28579322
Bohnert M. 2020. New friends for seipin - Implications of seipin partner proteins in the life cycle of lipid droplets.
Seminars in Cell & Developmental Biology 108:24–32. DOI: https://doi.org/10.1016/j.semcdb.2020.04.012,
PMID: 32402516
Campomanes P, Zoni V, Vanni S. 2019. Local accumulation of diacylglycerol alters membrane properties
nonlinearly due to its transbilayer activity. Communications Chemistry 2:72. DOI: https://doi.org/10.1038/
s42004-019-0175-7
Cartwright BR, Binns DD, Hilton CL, Han S, Gao Q, Goodman JM. 2015. Seipin performs dissectible functions in
promoting lipid droplet biogenesis and regulating droplet morphology. Molecular Biology of the Cell 26:726–
739. DOI: https://doi.org/10.1091/mbc.E14-08-1303, PMID: 25540432
Zoni, Khaddaj, et al. eLife 2021;10:e62886. DOI: https://doi.org/10.7554/eLife.62886 21 of 24Research article Cell Biology Structural Biology and Molecular Biophysics
Castro I, Eisenberg-Bord M, Persiani E, Rochford J, Schuldiner M, Bohnert M. 2019. Promethin is a conserved
seipin partner protein. Cells 8:268. DOI: https://doi.org/10.3390/cells8030268
Chen X, Goodman JM. 2017. The collaborative work of droplet assembly. Biochimica Et Biophysica Acta (BBA) -
Molecular and Cell Biology of Lipids 1862:1205–1211. DOI: https://doi.org/10.1016/j.bbalip.2017.07.003
Choi SE, Jung IR, Lee YJ, Lee SJ, Lee JH, Kim Y, Jun HS, Lee KW, Park CB, Kang Y. 2011. Stimulation of
lipogenesis as well as fatty acid oxidation protects against palmitate-induced INS-1 beta-cell death.
Endocrinology 152:816–827. DOI: https://doi.org/10.1210/en.2010-0924, PMID: 21209018
Chorlay A, Monticelli L, Verı́ssimo Ferreira J, Ben M’barek K, Ajjaji D, Wang S, Johnson E, Beck R, Omrane M,
Beller M, Carvalho P, Rachid Thiam A. 2019. Membrane asymmetry imposes directionality on lipid droplet
emergence from the ER. Developmental Cell 50:25–42. DOI: https://doi.org/10.1016/j.devcel.2019.05.003
Choudhary V, Ojha N, Golden A, Prinz WA. 2015. A conserved family of proteins facilitates nascent lipid droplet
budding from the ER. Journal of Cell Biology 211:261–271. DOI: https://doi.org/10.1083/jcb.201505067
Choudhary V, Golani G, Joshi AS, Cottier S, Schneiter R, Prinz WA, Kozlov MM. 2018. Architecture of lipid
droplets in endoplasmic reticulum is determined by phospholipid intrinsic curvature. Current Biology 28:915–
926. DOI: https://doi.org/10.1016/j.cub.2018.02.020, PMID: 29526591
Choudhary V, El Atab O, Mizzon G, Prinz WA, Schneiter R. 2020. Seipin and Nem1 establish discrete ER
subdomains to initiate yeast lipid droplet biogenesis. Journal of Cell Biology 219:e201910177. DOI: https://doi.
org/10.1083/jcb.201910177
Chung J, Wu X, Lambert TJ, Lai ZW, Walther TC, Farese RV. 2019. LDAF1 and seipin form a lipid droplet
assembly complex. Developmental Cell 51:551–563. DOI: https://doi.org/10.1016/j.devcel.2019.10.006,
PMID: 31708432
Cohen BC, Shamay A, Argov-Argaman N. 2015. Regulation of lipid droplet size in mammary epithelial cells by
remodeling of membrane lipid composition-a potential mechanism. PLOS ONE 10:e0121645. DOI: https://doi.
org/10.1371/journal.pone.0121645, PMID: 25756421
Ding W, Palaiokostas M, Wang W, Orsi M. 2015. Effects of lipid composition on bilayer membranes quantified by
All-Atom molecular dynamics. The Journal of Physical Chemistry B 119:15263–15274. DOI: https://doi.org/10.
1021/acs.jpcb.5b06604, PMID: 26560961
Eisenberg-Bord M, Mari M, Weill U, Rosenfeld-Gur E, Moldavski O, Castro IG, Soni KG, Harpaz N, Levine TP,
Futerman AH, Reggiori F, Bankaitis VA, Schuldiner M, Bohnert M. 2018. Identification of seipin-linked factors
that act as determinants of a lipid droplet subpopulation. Journal of Cell Biology 217:269–282. DOI: https://
doi.org/10.1083/jcb.201704122
Ertunc ME, Hotamisligil GS. 2016. Lipid signaling and lipotoxicity in metaflammation: indications for metabolic
disease pathogenesis and treatment. Journal of Lipid Research 57:2099–2114. DOI: https://doi.org/10.1194/jlr.
R066514, PMID: 27330055
Gao Q, Goodman JM. 2015. The lipid droplet-a well-connected organelle. Frontiers in Cell and Developmental
Biology 3:49. DOI: https://doi.org/10.3389/fcell.2015.00049, PMID: 26322308
Hamilton JA, Miller KW, Small DM. 1983. Solubilization of triolein and cholesteryl oleate in egg
phosphatidylcholine vesicles. Journal of Biological Chemistry 258:12821–12826. DOI: https://doi.org/10.1016/
S0021-9258(17)44044-0, PMID: 6685124
Harayama T, Riezman H. 2018. Understanding the diversity of membrane lipid composition. Nature Reviews
Molecular Cell Biology 19:281–296. DOI: https://doi.org/10.1038/nrm.2017.138, PMID: 29410529
Humphrey W, Dalke A, Schulten K. 1996. VMD: visual molecular dynamics. Journal of Molecular Graphics 14:33–
38. DOI: https://doi.org/10.1016/0263-7855(96)00018-5, PMID: 8744570
Joshi AS, Zhang H, Prinz WA. 2017. Organelle biogenesis in the endoplasmic reticulum. Nature Cell Biology 19:
876–882. DOI: https://doi.org/10.1038/ncb3579, PMID: 28714972
Kassan A, Herms A, Fernández-Vidal A, Bosch M, Schieber NL, Reddy BJN, Fajardo A, Gelabert-Baldrich M,
Tebar F, Enrich C, Gross SP, Parton RG, Pol A. 2013. Acyl-CoA synthetase 3 promotes lipid droplet biogenesis
in ER microdomains. Journal of Cell Biology 203:985–1001. DOI: https://doi.org/10.1083/jcb.201305142
Khandelia H, Duelund L, Pakkanen KI, Ipsen JH. 2010. Triglyceride blisters in lipid bilayers: implications for lipid
droplet biogenesis and the mobile lipid signal in Cancer cell membranes. PLOS ONE 5:e12811. DOI: https://
doi.org/10.1371/journal.pone.0012811, PMID: 20877640
Kohlmeyer A, Vermaas J. 2017. Akohlmey/Topotools: Release 1.7. v1.7.
Leamy AK, Hasenour CM, Egnatchik RA, Trenary IA, Yao C-H, Patti GJ, Shiota M, Young JD. 2016. Knockdown
of triglyceride synthesis does not enhance palmitate lipotoxicity or prevent oleate-mediated rescue in rat
hepatocytes. Biochimica Et Biophysica Acta (BBA) - Molecular and Cell Biology of Lipids 1861:1005–1014.
DOI: https://doi.org/10.1016/j.bbalip.2016.05.013
Listenberger LL, Han X, Lewis SE, Cases S, Farese RV, Ory DS, Schaffer JE. 2003. Triglyceride accumulation
protects against fatty acid-induced lipotoxicity. PNAS 100:3077–3082. DOI: https://doi.org/10.1073/pnas.
0630588100
Longtine MS, McKenzie A, Demarini DJ, Shah NG, Wach A, Brachat A, Philippsen P, Pringle JR. 1998. Additional
modules for versatile and economical PCR-based gene deletion and modification in Saccharomyces cerevisiae.
Yeast 14:953–961. DOI: https://doi.org/10.1002/(SICI)1097-0061(199807)14:103.0.CO;2-U,
PMID: 9717241
MacDermaid CM, Kashyap HK, DeVane RH, Shinoda W, Klauda JB, Klein ML, Fiorin G. 2015. Molecular dynamics
simulations of cholesterol-rich membranes using a coarse-grained force field for cyclic alkanes. The Journal of
Chemical Physics 143:243144. DOI: https://doi.org/10.1063/1.4937153, PMID: 26723629
Zoni, Khaddaj, et al. eLife 2021;10:e62886. DOI: https://doi.org/10.7554/eLife.62886 22 of 24You can also read