Reviewing subduction initiation and the origin of plate tectonics: What do we learn from present-day Earth?
←
→
Page content transcription
If your browser does not render page correctly, please read the page content below
Earth and Planetary Physics
REVIEW                                                                                                             5: 123–140, 2021
SOLID EARTH: GEODYNAMICS                                                                                 doi: 10.26464/epp2021014

Reviewing subduction initiation and the origin of plate tectonics:
What do we learn from present-day Earth?
Gang Lu*, Liang Zhao, Ling Chen, Bo Wan, and FuYuan Wu
State Key Laboratory of Lithospheric Evolution, Institute of Geology and Geophysics, Chinese Academy of Sciences, Beijing 100029, China

Key Points:
 ● We raise a “paradox of the first SI”, a situation that appears to require existing subduction before the start of the first subduction, and

   review state-of-the-art SI models with a focus on evaluating their suitability in explaining the onset of plate tectonics.
 ● We re-investigate plate driving mechanisms and conclude that mantle drag may be more important than previously thought, which

   may be the missing driving force that can resolve the “paradox of the first SI”.
 ● We propose a composite driving mechanism, one that is compatible with present-day Earth and may also be applicable to broader

   geodynamic settings.
Citation: Lu, G., Zhao, L., Chen, L., Wan, B. and Wu, F. Y. (2021). Reviewing subduction initiation and the origin of plate tectonics: What do
we learn from present-day Earth?. Earth Planet. Phys., 5(2), 123–140. http://doi.org/10.26464/epp2021014

Abstract: The theory of plate tectonics came together in the 1960s, achieving wide acceptance after 1968. Since then it has been the
most successful framework for investigations of Earth’s evolution. Subduction of the oceanic lithosphere, as the engine that drives plate
tectonics, has played a key role in the theory. However, one of the biggest unanswered questions in Earth science is how the first
subduction was initiated, and hence how plate tectonics began. The main challenge is how the strong lithosphere could break and bend
if plate tectonics-related weakness and slab-pull force were both absent. In this work we review state-of-the-art subduction initiation (SI)
models with a focus on their prerequisites and related driving mechanisms. We note that the plume-lithosphere-interaction and mantle-
convection models do not rely on the operation of existing plate tectonics and thus may be capable of explaining the first SI. Re-
investigation of plate-driving mechanisms reveals that mantle drag may be the missing driving force for surface plates, capable of
triggering initiation of the first subduction. We propose a composite driving mechanism, suggesting that plate tectonics may be driven
by both subducting slabs and convection currents in the mantle. We also discuss and try to answer the following question: Why has plate
tectonics been observed only on Earth?
Keywords: subduction initiation; plate tectonics; mantle convection; driving force; mantle drag

1. Introduction                                                                 standing of how subduction could be initiated at various geolo-
Earth, whose oceanic plates are formed at mid-ocean ridges and                  gical settings, knowledge that has been summarized intensively in
recycled into deep mantle at subduction zones, is the only planet               a number of earlier reviews (Stern, 2004; Gerya, 2011; Korenaga,
in our solar system known to have active plate tectonics. The fact              2013; Zheng and Chen, 2016; Coltice et al., 2017; Stern and Gerya,
that subducted oceanic plates provide major forces to drive Earth’s             2018; Crameri et al., 2019). Yet, the start of the first subduction re-
plate tectonics makes subduction a defining characteristic of plate             mains enigmatic, largely due to incomplete understanding of
tectonics. However, explaining initiation of the first subduction               driving forces. While there is no doubt that subducting slabs are
(subduction initiation, SI), a plausible starting point of today’s              the primary drivers of modern plate tectonics, the assumption
plate tectonics, remains one of the key challenges in Earth sci-                that subduction has always been dominating leads immediately
ences (Bercovici, 2003; Gerya, 2011; van Hunen and Moyen, 2012;                 to difficulty in explaining the first SI: a subducting slab is required
Bercovici et al., 2015). The main difficulty is to reconcile the great          before the start of the first subduction.
plate strength without plate tectonics-related fracture zones and               In this paper we review state-of-the-art SI models and evaluate
the weak driving force owing to the lack of slab pull prior to the              whether they require prior operation of plate tectonics. We
start of plate tectonics.                                                       choose to focus on the relationship between plate strength and
Studies over recent decades have greatly advanced our under-                    driving mechanism during SI. The structure of this review is as fol-
                                                                                lows: We begin in Section 2 by summarizing key characteristics of
Correspondence to: G. Lu, lvgang@mail.iggcas.ac.cn                              Earth’s present-day plate tectonics and its driving mechanism. In
Received 18 OCT 2020; Accepted 11 DEC 2020.                                     Section 3 we outline key stages of SI, review representive resist-
Accepted article online 27 JAN 2021.                                            ance forces, and raise the paradox of the first SI. We present in
©2021 by Earth and Planetary Physics.                                           Section 4 a classification of SI models based on their driving-force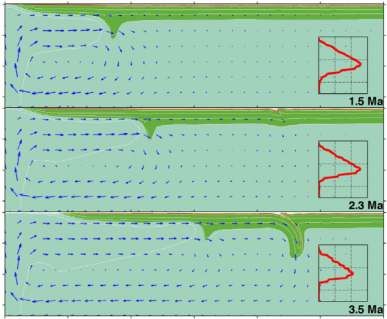
124 Earth and Planetary Physics doi: 10.26464/epp2021014
and plate-rupture mechanisms, which helps us to evaluate wheth- evolved through a stagnant-lid phase before its current plate-tec-
er they could help explain the first SI. Then in Section 5 we dis- tonics phase (Sleep, 2000; Stern, 2007), although some authors
cuss the nature of mantle drag force and propose a composite suggest that a variant squishy-lid regime was present before the
driving mechanism for plate tectonics that includes mantle drag, start of plate tectonics (Johnson et al., 2014; Rozel et al., 2017;
which may provide the missing driving force that is needed to ex- Lourenço et al., 2020). Therefore, an understanding of the trans-
plain the first subduction initiation. We further discuss why plate ition from stagnant-lid convection to plate-tectonics convection,
tectonics is rare on terrestrial planets. Our last section is a sum- i.e. the initiation of the first subduction, is crucial.
mary with some consideration for future research directions. Today, there is little doubt that plates are powered mainly by sub-
ducted slabs and opposed by viscous resistance of the mantle
2. Plate Tectonics on Earth (Forsyth and Uyeda, 1975; Lithgow-Bertelloni and Silver, 1998;
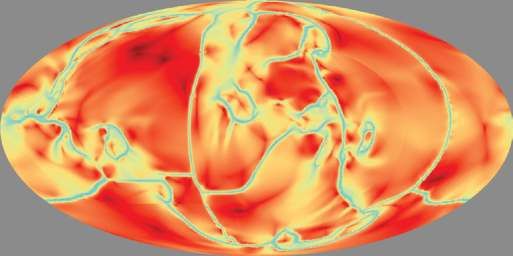
The plate tectonics theory states that Earth’s surface is divided in- Stern, 2004; Faccenna et al., 2012). The correlation between plate
to several rigid blocks (plates) with most of the deformation con- speed and length of attached trench relative to plate circumference
centrated at their boundaries (Kreemer et al., 2014) (Figure 1). The (Figure 2a) is one of the strongest indications of the importance of
relative motion of these plates leads to various types of plate subduction for driving plates (Forsyth and Uyeda, 1975). The slab-
boundaries, i.e., divergent, convergent, or transform boundaries. related driving forces, a combination of “slab pull” and “slab suc-
Subduction at convergent boundaries, which brings surface ma- tion”, provide ~90% of total driving force (Conrad and Lithgow-
terials back to the deep mantle, is a key element of plate tectonics Bertelloni, 2004), although there are alternative views on the relat-
that differs from mantle convection regimes observed on other ive importance between slab pull and slab suction (Stadler et al.,
planets. Mantle convection on most other terrestrial planets and 2010; Becker and Faccenna, 2011; Ghosh and Holt, 2012; Faccenna
moons is probably in stagnant lid regime: the strong stagnant lid et al., 2013) (Figure 2b). “Slab pull” is a negative buoyancy force in-
has remained on the surface for billions of years while the under- duced from the dense subducting slab that is directly attached to
lying mantle has been vigorously convective (Korenaga, 2013; the surface plate, given by ~3.2×10¹³ N/m (Turcotte and Schubert,
Stern et al., 2018). Venus’s dynamic evolution is believed to be 2002), while “slab suction” arises from mantle flow caused by de-
characterized by the episodic style of mantle convection: long- tached sinking slabs (Conrad and Lithgow-Bertelloni, 2004).
lasting stagnant-lid periods are interrupted by short, dramatic “Ridge push”, which arises from the topographic gradient of
oceanic plates that results from thermal thickening, provides
periods of global overturns (Moresi and Solomatov, 1998; Reese et
about 10% of the driving force (~3.9×10¹² N/m) (Turcotte and
al., 1999; Armann and Tackley, 2012; Uppalapati et al., 2020).
Schubert, 2002). Additional driving forces for mature subduction
It has been well established from geodynamic modeling that stag- zones come from net effects of phase changes during subduction,
nant-lid convection is likely the dominant mode for silicate plan- such as eclogitization from oceanic crust and the shallower phase
ets, due to the strongly temperature-dependent viscosity of rocks transition from olivine to wadsleyite in the cold slab at a depth of
(Moresi and Solomatov, 1995, 1998). This prediction, together ~410 km (Billen, 2008; van Hunen and Moyen, 2012). However,
with observations confirming the prevalence of stagnant-lid con- these forces may not be important during subduction initiation,
vection on silicate planets, suggests that Earth might have when the slab is shallow. Lithospheric basal shear, which results
0° 60° 120° 180° −120° −60° 0°
80° 80°
60° 60°
40° 40°
20° 20°
0° 0°
−20° −20°
−40° −40°
10-9 yr-1
−60° 0.1 1 10 100 1000 −60°
10 cm/yr
−80° 0° −80°
60° 120° 180° −120° −60° 0°
Figure 1. Present-day tectonic plates and corresponding plate motions. Colors show distribution of second invariant of strain rate that is
concentrated at plate boundaries. The interior of plates (white) has little deformation, indicating the rigidity of plates. Arrows indicate plate
velocities (Kreemer, 2009). Note that subducting slabs typically move faster than overriding plates. Modified from (Kreemer et al., 2014).
Lu G et al.: Initiation of the first subduction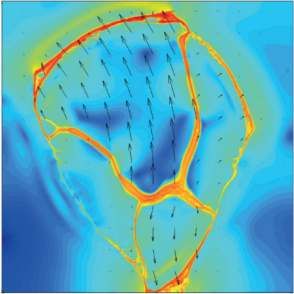
Earth and Planetary Physics       doi: 10.26464/epp2021014           125

from relative motion between plates and the underlying mantle,                                 3. Subduction Initiation
is considered either as a resisting force (Billen, 2008; van Hunen
                                                                                               3.1 Stages of SI
and Moyen, 2012) or to be negligible due to the presence of sub-
                                                                                               Subduction initiation refers to the infancy stage before the estab-
lithospheric low-viscosity asthenosphere (Forsyth and Uyeda,
                                                                                               lishment of mature subduction zones driven by the sinking of
1975; Chapple and Tullis, 1977; Mueller and Phillips, 1991). It is
                                                                                               slabs. It has been suggested that two forces must initially be over-
hence generally accepted that Earth’s plate tectonics today is a
                                                                                               come to make a subduction zone self-sustaining (Gurnis et al.,
slab-driven system. In recognition of the importance of slab driv-
                                                                                               2004): fault friction and plate bending. Following Gurnis et al.
ing, some authors have suggested that Earth’s geodynamic re-
                                                                                               (2004), in considering the first SI, we propose that the whole time
gime may be described as “subduction tectonics” instead of “plate                              span of an SI can be generalized into four stages (Figure 3): 1) a
tectonics” (Anderson, 2001; Stern, 2004, 2007; Stern and Gerya,                                single plate as the initial state, 2) plate rupture and formation of a
2018; Chen L et al., 2020).                                                                    lithospheric-scale shear zone, 3) under-thrusting of one plate be-
                                                                                               neath the other, and 4) the lower plate becoming deep enough
                                                                                               that slab pull makes the process self-sustaining. The inclusion of
           (a)
                                                                                               Stage 1 does not mean that all subduction zones have to experi-
                        30                                                                     ence the transition from Stage 1 to Stage 2. For example, an SI due
                                                                                               to inversion of a detachment/transform fault (Baes et al., 2011;
    Trench length (%)

                                                                                               Maffione et al., 2015) begins with the presence of two separate
                        20                                                                     plates and thus experiences only Stages 2−4. However, initiation
                                                                                               of the first subduction has to break, in Stage 1, the initial stagnant
                                                                                               lid. Once a first subduction has been initiated, the slab-driven
                        10                                                                     mechanism can take over and dominate the operation of plate
                                                                                               tectonics. In this view, the question of how plate tectonics started
                                                                                               on Earth is equivalent to asking how the first subduction zone was
                         0                                                                     initiated.
                             0                               5                           10
                                    AF
                                    SA
                                    NA

                                                                   IND

                                                                             PAC
                                   EUR

                                   CAR
                                   ANT

                                                                             NAZ

                                                                                   COC
                                                                  PHIL
                                                      ARAB

                                                   Velocity (cm/yr)
                                                                                               3.2 Plate Strength
                                                                                               Any newly initiated subduction zone must overcome an initial
   (b)                           Subducting plate motion                                       mechanical resistance before it becomes self-sustaining. Major
                                                                 Overriding plate motion

                                                                                                  (a) Stage 1: Single plate
                                                                   Direct slab pull

                                                                                                  (b) Stage 2: Plate rupture
                                                                 Weak
                                                                 lower
                             Slab suction from
                                                                  mantle
                             lower mantle slabs
                                                                  slab                            (c) Stage 3: Under-thrust

                                                                   Gravity

                                                                                                  (d) Stage 4: Self-sustaining
                                   Slab pull+Slab suction = ~90% driving force
                                   Ridge push = ~10% driving force
                                  Mantle viscous resistance & interplate friction
                                  = ~60%—85% resistive force
                                  Bending resistance = ~15%—40% resistive force

Figure 2. Driving mechanism of present-day plate tectonics. (a)
Velocity–trench length relationship. Plates with larger trench length
move at higher velocities. Modified from (Forsyth and Uyeda, 1975).                            Figure 3. Generalized stages of subduction initiation. The whole
(b) Schematic diagram showing major driving and resistance forces.                             time span of subduction initiation includes (a) initially a single plate
The major (~90%) driving force comes from direct pull of attached                              (Stage 1), (b) nucleation of shear zone and plate rupture (Stage 2),
slab and indirect suction from detached slab. Ridge push contributes                           (c) under-thrusting of one plate beneath another (Stage 3), and (d)
a small fraction (~10%) of driving force. Resisting forces include slab                        establishment of self-sustaining subduction (Stage 4). In some cases,
bending resistance, interplate friction, and mantle viscous shear.                             subduction initiation occurs at existing weak zones, thus involving
Modified from (Conrad and Lithgow-Bertelloni, 2004; Stern, 2007).                              only Stages 2−4. Modified from (Gurnis et al., 2004).

                                                                      Lu G et al.: Initiation of the first subduction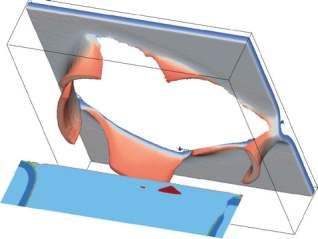
126 Earth and Planetary Physics doi: 10.26464/epp2021014
resistance forces related to SI include (McKenzie, 1977; Mueller compression conditions, the yield stress is directly linked to litho-
and Phillips, 1991; Gurnis et al., 2004) shear resistance at the (virtu- static stress (ρgz) (Figure 4a). The yield stress under extension can
al) fault plane (Figure 3, Stage 2) and the bending stress when the be expresses as
slab evolves to larger dipping angle during under-thrusting ρgz sinϕ + C cosϕ
(Figure 3, Stage 3). The shear strength of the lithosphere is best σy = ,
1 + sinϕ
represented by the yield strength envelope (YSE) (Goetze and
Evans, 1979), which is constrained by brittle failure in the shallow while under compression the yield stress is
part and by viscous strength at greater depths where temperat- ρgz sinϕ + C cosϕ
ures are higher. The transition from plastic to viscous deformation σy = .
1 − sinϕ
is often called the brittle-ductile transition (BDT). In the brittle do-
main, the strength of the lithosphere is limited by brittle (plastic) Note that the plate is significantly stronger under compression
failure (Byerlee, 1978), which occurs following Mohr-Coulomb fail- than extension. Taking cohesionless dry rocks for example (ϕ =
ure criterion (Figure 4a): 30°, C = 0), the yield stress under extension is one-third of the
τ = C + σn tanϕ, yield stress under compression.
where τ is the shear stress, σn the normal stress, ϕ the angle of in- When fluid pore pressure (Pf) is present, the yield stress may be re-
ternal friction, C the cohesion. For dry rocks, ϕ is typically 30°. In duced due to the reduction of confining pressure, such that (e.g.,
numerical models, the Mohr-Coulomb failure criterion is often ex- Ranalli, 1995; Sibson and Rowland, 2003)
pressed in its smooth version, the Drucker-Prager criterion, as σy = C cosϕ + (P − Pf ) sinϕ,
(Buiter et al., 2016) (Figure 4a):
σ2nd = σy = C cosϕ + P sinϕ, which may be further simplified as (e.g., Gerya et al., 2008):
σy = C cosϕeff + P sinϕeff ,
where P is the total pressure (mean stress), and σy the effective
shear stress determined by the second invariant of the deviatoric
√ where ϕeff is the effective frictional angle, sinϕeff = sinϕ (1 − Pf ).
1 ′ ′ P
stress tensor (σ2nd = σ σ ). For typical horizontal extension or Hydrostatic pore pressure condition with Pf/P ~0.4 (Sibson and
2 ij ij
σ1
(a) τ σy=C cos(ϕ)+P sin(ϕ) an( ϕ) ρgz sin(ϕ)+C cos(ϕ)
+σ nt Extension σy=
τ=C σ3 σ3 1+sin(ϕ)
σ1
σy σ3
C ρgz sin(ϕ)+C cos(ϕ)
σy Compression σ1 σy=
ρgz σ1
ϕ σ3 1-sin(ϕ)
σ3 P σ1 σ3 P σ1 σn
Sea level
εxx ρw
(b) (c) x
yn ρc E, ν
0
Compression Extension εxx ρm
y
10
0
20 σxx
BDT 10
Depth (km)
BDT
30
20 yn
Depth (km)
40 BDT
BDT
30 -6 m
-1
10 -1
50 κ=1× -7 m
m -1
40 10
5×
10 -7
80 Ma κ=
60 60 Ma
×
50
κ=1
40 Ma
Compression Tension
-1000 -500 0 500 60
Stress (MPa) -1000 -500 0 500
Stress difference (MPa)
Figure 4. Strength of oceanic lithosphere. (a) Left: Mohr circle diagram of principal stresses along the Byelee’s yield surface. σ1 and σ3 are
maximum and minimum (compressional) principal stresses, respectively. P is dynamic pressure. σy is yield stress. Right: configuration of principal
stresses under compression or extension and corresponding yield stresses. Note σ1 = ρgz (lithostatic pressure) for extension whereas σ3 = ρgz for
compression. (b) Yield stress envelope (YSE), or shear strength, of an oceanic plate with various thermal ages. Assumed background strain rate is
10−15 s−1. Note that the yield stress under compression is 2−3 times larger than under extension. BDT: brittle-ductile transition. (c) Bending
strength of a subducting slab, which is linked to the shear strength. Modified from (Watts and Burov, 2003).
Lu G et al.: Initiation of the first subduction
Earth and Planetary Physics      doi: 10.26464/epp2021014         127

Rowland, 2003) leads to an effective friction angle of 17°.                     fact that most Atlantic passive margins have been stable until
                                                                                now, although some investigators have argued that the Brazilian
Figure 4b illustrates a typical YSE for an oceanic lithosphere with
                                                                                margin is at risk of future subduction initiation (Nikolaeva et al.,
different thermal ages assuming a dry olivine rheology and a
                                                                                2010; Nikolaeva et al., 2011). In a recent compilation of SI data-
background strain rate of 10−15 s−1. The integral of the YSE indic-
                                                                                bases, Crameri et al. (2020) argue that all Cenozoic SI events are
ates the force required to rupture a plate. For a thermal age of
                                                                                known to be induced, suggesting that additional forcing is re-
40 Ma, the force required to induce compressional failure is on the
                                                                                quired besides the negative buoyancy of the surface plate itself. SI
order of 1013 N/m, which is on the same order as slab pull
                                                                                at intraoceanic setting is thought to be possible only if sufficiently
(Turcotte and Schubert, 2002). The strength of a plate increases
                                                                                long lithospheric weak zones exist, e.g., transform faults or ocean-
rapidly with increasing thermal age. Solely according to this as-
                                                                                ic fracture zones (Hall et al., 2003; Gurnis et al., 2004; Stern, 2004;
pect, older lithosphere is therefore less likely to initiate new sub-
                                                                                Zhou X et al., 2020). Even with an initial weak zone, tectonic force
duction (Cloetingh et al., 1982, 1989; Mueller and Phillips, 1991).
                                                                                is still required to bend the lithosphere until the subduction be-
After plate rupture occurs, plate bending becomes the principal                 comes self-sustaining (Hall et al., 2003; Gurnis et al., 2004). There-
source of resistance during SI until it becomes self-sustaining                 fore, for an initial single plate, additional driving force is required
(McKenzie, 1977; Gurnis et al., 2004). The bending strength may                 to break the lithosphere and overcome the bending resistance be-
be parameterized as a bending moment that is linked to the YSE                  fore a self-sustaining subduction can be established. On present-
(Figure 4c) (Watts and Burov, 2003; Burov, 2011; Hunter and Watts,              day Earth, the sinking subducted dense oceanic lithosphere
2016). For a bending plate, there will be a neutral plane (y = yn)              provides most of the force required to drive tectonic plates (For-
where there is no deformation. Apart from the neutral plane, the                syth and Uyeda, 1975). Some authors suggest that sinking slabs
elastic bending stress is (Hunter and Watts, 2016):                             could generate some far-field tectonic stresses to trigger subduc-
                            el     E (y − yn ) κ                                tion at other places (Hall et al., 2003; Niu et al., 2003; Baes and So-
                         Δσxx =                    ,
                                      1 − ν2                                    bolev, 2017; Baes et al., 2018), which may explain SI during the
where κ is curvature, E is Young’s module, and ν is Poisson’s ratio.            Cenozoic. However, this mechanism, if other driving forces are ex-
This elastic bending stress is then truncated by the YSE, resulting             cluded, leads to a paradox of the first SI: a subducting slab is re-
in a bending moment calculated as:                                              quired to initiate another subduction zone, but obviously there is
                             Tm
                                                                                no subduction zone before the first one is initiated. In the next
                       M=∫        Δσxx (y − yn ) dy,                            section we review proposed SI models by examining their driving
                             0
                                                                                mechanisms and conditions prerequisite for, and during, an SI,
where Tm is the mechanical thickness, defined as the depth at                   with the aim of seeking a scenario that is capable of accounting
which the yield strength falls below 1 per cent of the overburden               plausibly for the initiation of the first subduction.
pressure (Hunter and Watts, 2016). The equation shows that the
bending moment depends on the shear strength and the
                                                                                4. Models of SI
curvature of the plate. By applying a force equilibrium analysis,
                                                                                The initiation of subduction is a result of competition between
Buffett (2006) further estimated that an equivalent bending force
                                                                                driving force and plate strength. The key in SI models is to resolve
can be approximated as:
                                                                                the discrepancy between the strong plate strength and the small
                                           3
                               2 H                                              driving force. Many mechanisms have been proposed to explain
                         Fb = − (     ) ηu0 ,
                               3 Rmin                                           how a surface plate might break. They all involve one or both of
where H is plate thickness, η is the effective viscosity of the bend-           these two aspects: (1) an additional forcing to the plate and (2) a
ing lithosphere, u0 is subduction convergence velocity, and Rmin is             mechanism capable of rupturing (or weakening) the plate. It is
the minimum radius of curvature of the bending slab. The scaling                well known that mature subduction is self-sustainingly driven by
law of bending force is further verified to be proportional to                  slab pull force. Therefore, in terms of their driving mechanisms,
    H
      3                                                                         ongoing subduction zones have been classified into forced sub-
(      ) ηu0 by systematic 2-D (Ribe, 2010) and 3-D (Li and Ribe,               duction and self-sustaining subduction (Gurnis et al., 2004). This
    Lb
2012) analysis and modeling, where Lb is the bending length of                  has led to a similar classification of SI models (Stern, 2004): spon-
the portion of the slab where deformation occurs primarily by                   taneous SI, in which the initiation process is driven purely by the
bending rather than by stretching. The bending force acts like a                negative buoyancy of the surface plate itself, and induced SI, in
resistance in that it opposes the motion of the downgoing plate.                which forcing external to the considered plate is required.
In modern subduction zones, the magnitude of bending forces is                  However, in a recent SI database analysis, Crameri et al. (2020)
estimated to vary from ~1012 N/m (Davies, 2009; van Hunen and                   demonstrate that all known SI events in the most recent 100 Ma
Moyen, 2012) to as high as ~37% of the total slab pull (Buffett,                are forced; there is no known example of spontaneous SI. There-
2006).                                                                          fore, we apply an alternative classification by considering wheth-
                                                                                er the required forcing is internal or external to the considered
3.3 The First SI Paradox                                                        model domain. Models that require forcing from outside the mod-
It is commonly agreed that aging of plates does not by itself initi-            el, such as kinematic boundary pushing, are classified as externally
ate subduction, because plates actually stiffen as they cool, due to            driven. In contrast, those with all driving forces originated from
the strong dependency of viscosity on temperature (Cloetingh et                 within the model domain are considered as internally driven. In
al., 1989; Mueller and Phillips, 1991). This is also evident from the           terms of the second aspect, i.e. the formation of plate weakness,

                                                       Lu G et al.: Initiation of the first subduction
128       Earth and Planetary Physics                           doi: 10.26464/epp2021014

many models either impose a prescribed weak zone (i.e. inherited                                     ally driven forcing with self-nucleated shear zone, (iii) internally
weak zone) or use a low yield strength that is much smaller than                                     driven forcing with inherited plate weakness, and (iv) internally
at hydrostatic pore pressure condition (inherited weak plate). In                                    driven forcing with self-nucleated shear zone. Models with extern-
contrast, in some other models, the lithosphere is initially strong                                  al-driven forcing or inherited plate weakness typically invoke
and a lithospheric-scale shear zone is generated in a self-consist-                                  some processes that occur only during modern plate tectonics,
ent manner (i.e. self-nucleated). This leads to a classification of                                  e.g. transform faults or far-field tectonic stress from other subduc-
plate weakness into two categories: inherited and self-nucleated.                                    tion zones, which are thus not capable of explaining the first sub-
Combining the two aspects above allows us to subdivide pro-                                          duction initiation. After the start of plate tectonics, subduction ini-
posed SI models into the following four groups (Figure 5): (i) ex-                                   tiation becomes less enigmatic because slab-related driving force
ternally driven forcing with inherited plate weakness, (ii) extern-                                  may take over to drive and initiate subsequent subduction zones.

                                               Inherited plate weakness                                                Self-nucleated shear zone

                                     Ridge inverse                 Detachment fault inverse                      Transference                 Polarity reversal
          Externally-driven

                                 (Duretz et al., 2016)

                                 Episodic subduction                   (Maffione et al., 2015)

                                  Fault activation                                                                                        Miocene Solomon Arc
                                                                                                                                        (Cooper and Taylor, 1985)

                                  Slab formation
                                                                                                                Tethys
                                                                                                           (Wan B et al., 2019)
                                (Crameri et al., 2020)                                           i    ii

                                                                                               iii    iv
                                     Transform collapse            Arc relic collapse                      Passive margin collapse                 Continent driven
          Internally-driven

                                                                                                                                                    (Rey et al., 2014)
                                                                                                            Gibraltar Arc?
                                                                                                            (Stern, 2004)
                                                                                                              Plume penetration                     Plume driven

                                  Eocene Western Pacific         (Leng and Gurnis, 2015)
                              (e.g., Govers and Wortel, 2005)

                                                                                                             (Gerya et al., 2015)           (Lu G et al., 2015)

Figure 5. Classification of proposed SI models. The classification is based on whether an external driving force is required (internally-driven vs.
externally-driven) and whether an initial weakness is imposed (inherited plate weakness vs. self-nucleated shear zone). Arrows illustrate driving
forces. Bottom notes in each model indicate natural examples or references. Modified from (Cooper and Taylor, 1985; Stern 2004; Govers and
Wortel, 2005; Rey et al., 2014; Leng and Gurnis, 2015; Lu G et al., 2015; Maffione et al., 2015; Duretz et al., 2016; Stern and Gerya, 2018; Wan B et al.,
2019; Crameri et al., 2020 ).

                                                                   Lu G et al.: Initiation of the first subduction
Earth and Planetary Physics doi: 10.26464/epp2021014 129
While this review focuses on subduction initiation from a stag- boundaries (Davies, 1989; Puster et al., 1995; Zhong and Gurnis,
nant lid, it is useful for completeness and clarification to include 1995; Zhong SJ et al., 2000).
all models even if they require ongoing plate tectonics.
iv) Internally driven forcing with self-nucleated shear zone
i) Externally driven forcing with inherited plate weakness ● Passive margin collapse: triggered by hydrous upwelling (van
● Conversion of oceanic transform faults/fracture zones: (Uyeda der Lee et al., 2008), or by sedimentary loading (Fyfe and Leonar-
and Ben-Avraham, 1972; Casey and Dewey, 1984; Toth and Gurnis, dos, 1977; Cloetingh et al., 1989; Regenauer-Lieb et al., 2001);
1998; Doin and Henry, 2001; Hall et al., 2003; Gurnis et al., 2004; ● Plume injection (Ueda et al., 2008; Burov and Cloetingh, 2010;
Baes et al., 2011; Maffione et al., 2017; Guilmette et al., 2018; Gerya et al., 2015; Davaille et al., 2017);
Zhong and Li, 2020); ● Plume induced mantle traction (Lu et al., 2015);
● Inverse at (extinct) spreading ridges (Gurnis et al., 2004; Duretz ● Suction from sinking slab (Baes et al., 2018);
et al., 2016; Keenan et al., 2016) or detachment faults (van Hins- ● Continent push (Marques et al., 2013; Rey et al., 2014);
bergen et al., 2015; Maffione et al., 2015); ● Small-scale convection (Solomatov, 2004);
● Inverse at COB (Zhong and Li, 2019); ● Transient mantle flow with damage and inheritance (Bercovici
● Episodic subduction (Crameri et al., 2020). and Ricard, 2014);
ii) Externally driven forcing with self-nucleated shear zone ● Initiation of global network of rifts due to thermal expansion-
● Plate rupture within an oceanic plate under compression for- driven fracturing (Tang et al., 2020);
cing (McKenzie, 1977; Cloetingh et al., 1989; Shemenda, 1992; ● Mantle convection models with self-organized plate behavior
Thielmann amd Kaus, 2012; Zhong and Li, 2019; Crameri et al., (e.g., Tackley, 2000a, b, c; Zhong SJ et al., 2007; Rolf and Tackley,
2020); 2011; Coltice et al., 2012; Rolf et al., 2012, 2018; Crameri and
● Plate reorganization with sedimentary loading (Erickson and Tackley, 2014, 2016; Lourenço et al., 2016; Ballmer et al., 2017; Na-
Arkani-Hamed, 1993); kagawa and Iwamori, 2017), some of which have shown self-con-
● Compression forcing with various localization mechanisms, in- sistent subduction polarity reversal (Crameri and Tackley, 2014)
cluding shear heating (Crameri and Kaus, 2010; Thielmann and and plate reorganization (Mallard et al., 2016; Coltice et al., 2019).
Kaus, 2012) and grain-size reduction (Bercovici and Ricard, 2005, Caution must be advised for those models that do not prescribe
2013, 2014; Rozel et al., 2011); initial weak seed but apply a friction coefficient (μ < ~0.1) that is
● Plate rupture induced by plate acceleration (Agard et al., 2007); much smaller than observed in laboratory measurements. Such a
● Subduction zone transference/trench jump (Mitchell, 1984; low yield stress is comparable to those with imposed initial weak
Stern, 2004; Tetreault and Buiter, 2012; Vogt and Gerya, 2014; Wan zones. In this sense, we have classified models that require low
B et al., 2019; Wu et al., 2020); plate strength into groups with inherited weakness. Models with
● Subduction polarity reversal (Mitchell, 1984; Cooper and Taylor, continent–ocean transition (COT) are more ambiguous with re-
1985; Pysklywec, 2001; Stern, 2004; Faccenda et al., 2008; von gard to whether they assume inherited weakness. On one hand,
Hagke et al., 2016; Crameri et al., 2020); the contact between continental and oceanic material is poten-
● Conversion of passive margin to subduction zone with suction tially a “weak point”. On the other hand, however, such “weak
force imposed at bottom boundary (Baes and Sobolev, 2017); points” seem to be relatively strong, as indicated by the lack of SI
● Large asteroid impacts (Hansen, 2007; Yin A, 2012; O’Neill et al., at passive margins even when the plate is under continent–con-
2020). tinent collision (e.g. the Indian plate) (Crameri et al., 2020). There-
iii) Internally driven forcing with inherited plate weakness fore, we consider the lithosphere with COT as a single plate un-
● Gravitational collapse at transform faults/fracture zones (Karig, less the frictional coefficient of any of the two contacting plates is
1982; Matsumoto and Tomoda, 1983; Govers and Wortel, 2005; significantly lower (μ < ~0.1) than empirically observed values.
Mart et al., 2005; Gerya et al., 2008; Nikolaeva et al., 2008; Global mantle convection models naturally have self-consistent
Dymkova and Gerya, 2013; Zhou X et al., 2018; Zhou X et al., 2020), driving forces, if no prescribed surface boundary condition is ap-
at continent-ocean interfaces (Goren et al., 2008; Nikolaeva et al., plied. A pseudo-plastic rheology is commonly used to limit the
2010, 2011; Marques et al., 2014), at oceanic plateaus (Nair and stress and produce plate-like convection regimes in these models
Chacko, 2008), or at relic arcs (Niu et al., 2003; Leng and Gurnis, (e.g., Tackley, 2000b). Although the values of yield stress required
2015); for plate-like behavior are significantly smaller than the experi-
● Sedimentary loading and reactivation of margin faults (Erickson, mental estimates (Evans and Goetze, 1979; Tackley, 2000c; Hirth
1993); and Kohlstedt, 2004; Stein et al., 2004), it has been argued that the
● Pre-existing slab pull force with imposed weak faults (Zhong dimensional value of the pseudo-plastic yield stress in a geody-
and Gurnis, 1992, 1996; Zhong SJ et al., 1998) or weak crust layers namic model is not directly comparable to that of an experiment
(Crameri et al., 2012); because a realistic model for the Earth’s mantle in terms of para-
● Tensile decoupling of continent-ocean interface induced by meters is still out of reach in computational models (Coltice et al.,
basal traction (Kemp and Stevenson, 1996); 2017). It would be too crude to define, arbitrarily, a critical yield
● Conversion of fracture zone triggered by suction from sinking stress of the pseudo-plastic rheology and thus classify some of
slab (Baes et al., 2018); these models in the group that assume inherited plate weakness.
● Lateral propagation of subduction (Zhou X et al., 2020); Therefore, we have for simplicity assigned most global mantle
● Mantle convection models with prescribed weak zones as plate convection models with self-organized plate behavior into Group
Lu G et al.: Initiation of the first subduction130 Earth and Planetary Physics doi: 10.26464/epp2021014
(iv), although attention should be drawn to the factor that the nell, 1981; Anderson, 2002; Stern, 2004; Billen, 2008; van Hunen
yield stress in these models may still be too low, as indicated by and Moyen, 2012; Turcotte and Schubert, 2014; Stern and Gerya,
the lack of asymmetric and one-sided subduction zones in these 2018). The negative buoyancy of subducted slabs leads to a grav-
mantle convection models. itational pulling force that can be transmitted to the surface plate.
This force, known as “slab pull” or “trench pull”, is now widely
Although models in Group (iv) have internally driven forcing and
credited in textbooks and research publications as the dominat-
self-nucleated weak zone, not all of them are capable of explain-
ing driving force (Billen, 2008; van Hunen and Moyen, 2012;
ing initiation of the first subduction. For example, there was no
Turcotte and Schubert, 2014; Niu, 2020). In contrast, basal drag
pre-existing slab suction force before the first subduction began.
force from the convective mantle has generally been thought to
Models with continent–ocean transition need some further con-
be negligible or resistive (Stern, 2007; Billen, 2008; van Hunen and
sideration. On one hand, passive margin by definition is one of the
Moyen, 2012; Niu, 2020). The presence of a low viscosity astheno-
elements of plate tectonics theory. It therefore cannot explain the
spheric layer is thought to be evidence that the shear traction
first subduction initiation because, for passive margins to form,
from underlying mantle is likely to be weak.
plate tectonics is implicitly assumed already to be operating. On
the other hand, however, oceanic plateaus with sharp lateral However, present-day observations of plate motion and the de-
density contrast, which has similar effect as continent–ocean formation patterns of several major continental blocks are diffi-
transition, might exist prior to modern plate tectonics (Nair and cult to explain by slab pull alone. One of the best examples is
Chacko, 2008). While the gravitational potential energy (GPE) probably the contrasting deformation between the eastern and
stored within the density contrast may potentially induce large western parts of the Indo–Australian Plate (Figure 7). The central
tectonic forces, which could be as large as ~8×10¹² N/m (Molnar Indian Ocean Basin in the western part is known for its intraplate
et al., 1993; Ghosh et al., 2006), additional forces in the opposite seismicity and long wavelength buckling of the sea floor (Molnar
direction are required to balance the GPE so as to avoid the van- et al., 1993; Gerbault, 2000). In contrast, the eastern part that is
ishing of plateau (Faccenna et al., 2013). The question then be- connected to subducting slabs under the Java–Sumatra trench is
comes where this additional force is from and why the adjacent free of buckling (Gerbault, 2000). While slab pull force would gen-
blocks were formed and maintained in an imbalanced state. In erate only tensile stress within the plate, the buckling of the litho-
general, for a model to be considered successful in explaining the sphere indicates that there must be compressional forces from
first SI, it is crucial that the model starts from a single plate and re- both the front and the end of the plate (Figure 7b). The India–Asia
quired driving forces arise from processes that are independent of collision zone is a site that may provide such an extra force on the
the operation of plate tectonics. Figure 6 illustrates several SI front side, which not only cancels the slab pull force from the
models that appear able to explain the first SI and thus the start of deeper part of the trench but also exerts an extra compression on
plate tectonics. In the model of Gerya et al. (2015) with melt-weak- the horizontal domain of the subducting plate (Figure 7b). The
ening rheology, a plume penetrates the overlying stagnant litho- compressional force to activate buckling of the Indian Basin is es-
sphere, which is broken into several pieces that sink into the timated to be F = 2.56×10¹³ N/m (Gerbault, 2000), in agreement
mantle, potentially providing suction forces to initiate subduction with the force required to prevent the collapse of high plateaus
zones elsewhere and thus starting plate tectonics. In the model of such as the Tibetan plateau. However, the source of additional
Lu G et al. (2015), which includes a thermal-induced shear weak- force in the back is more problematic. Ridge push is unlikely to be
ening mechanism, the plume does not penetrate the stagnant the missing force because it is one order of magnitude smaller
lithosphere but instead deflects and drives the overlying plate, than slab pull (Conrad and Lithgow-Bertelloni, 2004; van Hunen
which initiates a new subduction zone far away. In the model of and Moyen, 2012; Turcotte and Schubert, 2014). Furthermore, if
Mallard et al. (2016), plates are produced self-consistently during ridge push were dominating, buckling of oceanic lithosphere
mantle convection if the yield stress applied is between 100 MPa and should have been a common observation at Atlantic-type passive
350 MPa, which is comparable to the yield stress of oceanic litho- margins, in particular those surrounding the African plate.
sphere with hydrostatic pore pressure. The velocity patterns in
models of Mallard et al. (2016) and Lu G et al. (2015) exhibit asym- A breakthrough in the understanding of driving forces is the re-
metry comparable to that observed on present-day Earth cognization of “slab suction” (Conrad and Lithgow-Bertelloni,
(Figure 1), where the horizontal velocity of a subducting plate is 2002, 2004). “Slab suction” differs from “slab pull” in that it is in-
significantly larger than that of an overriding plate. duced by detached slabs without direct transmission of tensile
stress to surface plates (Figure 2b). When a detached slab is sink-
ing, it induces mantle flow that exerts shear traction on the base
5. Discussion
of the surface plates (Conrad and Lithgow-Bertelloni, 2004). We
5.1 Mantle Drag as the Missing Driving Force emphasize that it is the mantle flow and consequent basal drag
The driving mechanism of plate tectonics has been debated since that bridges the gravitational energy of the detached slab to the
the theory’s birth more than 50 years ago. Previously, continental surface plates. In other words, basal drag, when powered by de-
drift was thought to be driven by basal drag from mantle convec- tached slabs, is simply an expression of slab suction. In this sense,
tion (Holmes, 1931; Hales, 1936). Since the advent of plate tecton- mantle convection could provide an “induced” driving force to
ics, however, the relationship has been reversed; it has become the surface plate, which may explain the missing pushing force
widely accepted that tectonic plates drive mantle convection (For- that accounts for the buckling of oceanic lithosphere. It has been
syth and Uyeda, 1975; Chapple and Tullis, 1977; Hager and O’Con- proposed that the present-day Tibet plateau is a “slab suction”
Lu G et al.: Initiation of the first subductionEarth and Planetary Physics doi: 10.26464/epp2021014 131
(a) Plume penetration (b) Plume driven
Topography (km)
Asymmetric subduction Thermal age = 50 Ma
Temperature (K) 200 0
1000 600 (MPa)
–5 5 500 750 1000 1250 1500 1300 0 500 -200
z (km)
0
1212 km 1800
1212 km -20 -400
km
-40
296
Composition (km) -600
0
121
200
1000 600 (MPa)
12
2
0 500
12
1300 -200
z (km)
0
km
km
1800 -20 -400
0.07 Ma -40
(km) -600
200 600 0
1000 (MPa)
1300 0 500 -200
z (km)
0
1800 -20 -400
-40
(km) -600
-2000 -1500 -1000 -500 0 500 1000 (km)
3.79 Ma 0
z (km)
-100
-200
Viscosity Strain rate
-200 0 200 400 -200 0 200 400 600 (km)
(c) Global mantle convection
25.65 Ma
−4 −3 −2 −1 0 1 2 3 4
Basalt (upper log10[Dimensionless viscosity]
Asthenosphere Mantle plume oceanic crust)
Molten mantle Newly formed crust Gabbro (lower 60° 60°
oceanic crust)
Lithosphere Molten crust Hydrated mantle 30° 30°
e –13 0° 0°
1200 zo
n
n
tio
Su
uc −30° −30°
bd
bd
1000 Su –14
ucti
−60° −60°
on
zo
800 –15
Distance (km)
ne
30°
log10[εII(s–1)]
R id
e
–16
Ridg
600 ge
.
Triple 0°
400 geRi –17
Triple Rid dge junction
junction
Transform
ne n
200 –18
zo uctio
−30°
bd
25.65 Ma –30° 0° 30° 60° 90°
Su
0 –19
0 200 400 600 800 1000 1200 Transform/MOR Plate area < 5.8×10⁵ km2
Distance (km) Subduction zones 5.8×10⁵ km2 < Plate area < 45×106 km2
Diffuse boundaries Plate area > 45×106 km2
Figure 6. Candidate SI models that are capable of explaining the start of plate tectonics. (a) Subduction initiated due to plume penetration.
Arrows show horizontal velocities of young, non-subducting plates moving towards retreating subducting slabs. Source: (Gerya et al., 2015).
(b) Subduction initiation due to plume push. Arrows show velocities of mantle flow. Source: (Lu G et al., 2015). (c) Plate tectonics in mantle
convection model. The yield stress values that produce plate-like behavior are between 100 MPa and 350 MPa. Red line: mid-ocean ridges (MOR)
or transform faults; blue line: subduction zones; green line: diffuse boundaries. Source: (Mallard et al., 2016).
type of mountain belt (Faccenna et al., 2013), which emphasizes 2020; Zhang N et al., 2018; Chen L et al., 2020). One argument
that the force required to prevent the collapse of the high plateau against such a driving mechanism is that basal drag is proportion-
originates in slab suction from lower mantle. al to mantle viscosity and thus unlikely to be very large, due to the
presence of the low-viscosity asthenospheric layer (Mueller and
The ability of mantle flow to drive surface lithosphere has been Phillips, 1991). However, Lu G et al. (2015) illustrate that the basal
demonstrated in recent numerical models (Lu G et al., 2015). They drag force is in fact insensitive to the viscosity in the astheno-
have estimated that the total drag force may exceed 1013 N/m, sphere during plume push (Figure 8). They show in their models
which is on the same order as slab pull force and thus confirms its that the total mantle drag force remains unchanged when as-
ability to rupture a plate. Subsequent studies have further demon- thenospheric viscosity decreases from 1020 Pa s to 1019 Pa s, which
strated that mantle drag force may eventually lead to supercon- instead results in a velocity that is 10 times larger (Figure 8) (Lu G
tinent breakup or post-collisional orogeny (Dal Zilio et al., 2018, et al., 2015). More recently, global mantle convection models
Lu G et al.: Initiation of the first subduction132 Earth and Planetary Physics doi: 10.26464/epp2021014
Net force within plate
(a) (b) is tensional
Free subduction
Upper plate Fres
Ffar Lower plate
Free subduction Fsp
Fn Fn
Far-field stress Transform
Net force within plate
is compressional Blocked subduction
Blocked subduction
Blocked Fres
subduction
Ffar
Fn Fn
Buckling of the Fsp
oceanic lithosphere
Figure 7. Comparison of free subduction and blocked subduction. (a) Schematic plot showing that buckling of oceanic lithosphere occurs under
compressional stress when subduction is blocked and far-field stress remains. (b) Comparison of stress components in the cases with a free
subducting slab (top) and blocked subduction (bottom). Ffar, far-field force; Fsp, slab pull force; Fres, resistance force; Fn, net force acting on the slab
at the trench or collision zone. Far-field stress is necessary to compress the surface plate from both the front and the back in order to activate
buckling. Modified from (Agard et al., 2007).
(Coltice et al., 2019) have further illustrated quantitatively in a self- Faccenna et al., 2013).
consistent manner that, although slab pull may be the dominat-
The above generalization leads us to propose a composite driving
ing first order force, 20%–50% of the surface is instead dragged by
mechanism that may have operated during different stages of
the interior.
Earth history (Figure 9). As a reference, the convection-driven
(Figure 9a) and slab-driven (Figure 9b) mechanisms are also illus-
5.2 Switch of Driving Mechanism in Earth’s History trated. In the convection-driven mechanism (Figure 9a), first pro-
In the previous discussion we have highlighted that mantle drag posed almost a century ago (Holmes, 1931), plates are moving
is the acknowledged bridge between subducted slabs and sur- passively due to flow of sub-plate mantle. In contrast, in the slab-
face plates. Here we further separate mantle drag from the slab driven mechanism (Figure 9b), it is the subducted slabs (slab pull
suction mechanism and consider mantle drag as an end-member + slab suction) that power mantle flow. Stern (2007) argues that
driving force. This clarification has several advantages in describ- the convection-driven mechanism is an obsolete concept and that
ing the driving mechanisms of plate tectonics. First, mantle drag is the slab-driven mechanism best explains present-day plate mo-
a force that is directly applied to the lithosphere, the same as oth- tions, while acknowledging that the relative importance between
er forces such as slab pull and ridge push, whereas slab suction re- slab pull and slab suction remains a subject of debate (Conrad and
quires convective mantle for bridging. Splitting mantle drag expli- Lithgow-Bertelloni, 2002, 2004; Stadler et al., 2010; Becker and
citly from slab suction mechanisms may lead to an improved un- Faccenna, 2011; Faccenna et al., 2012; Ghosh and Holt, 2012). The
derstanding of tectonics by avoiding potential mixture of direct composite driving mechanism proposed here (Figure 9c) sug-
and indirect plate-driving forces. Second, mantle drag may better gests that both convection-driven and slab-driven are important,
describe the mechanism of driving in broader situations, includ- although their relative contributions may vary from place to place
ing continentward traction (Dal Zilio et al., 2018), in which the and from time to time. In Mode A (slab-pull), a subducting slab
mantle flows away from the trench. Using “slab suction” in this pulls the surface plate and induces mantle flow. In Mode B (high-
case would be confusing, as “suction” implies movement towards density anomaly, slab suction), ongoing oceanic subduction does
the trench. The separation of the concepts of “mantle drag” from not exist, but there might be earlier-detached slabs that drive
“slab suction” allows us to further generalize the role of mantle plate motions towards the trench. Modes A and B together are es-
drag. We propose that it can arise from any density anomaly in the sentially identical to the modern view of a slab-driven mechanism
whole system. For example, in the slab suction mechanism, mantle (Figure 9b), incorporating the dominant driving forces for present-
drag is induced by high-density anomaly (detached slabs). Simil- day Earth. Mode C (low-density anomaly, plume push) is identical
arly, it can arise also from positive buoyancy (e.g. upwelling to Mode B except that the high-density anomaly is replaced by a
plume), which is then interpreted as “plume push”. It should be low-density anomaly such that all flow directions are opposite to
noted that mantle drag driving is not limited to slab suction or Mode B. Mode D (plume-driven) is an extreme case of Mode C in
plume push. Any cold or hot thermal anomalies in the mantle may which no initial weakness exists in the stagnant lid. If the up-
provide similar mantle drag forces. Predictions of mantle flow welling is large enough, it may provide sufficient driving force to
from global tomographic models commonly show that large-scale trigger a new subduction. Once subduction is initiated, the driv-
mantle convection is a present-day driver of some plates (Becker ing mechanism then switches to Modes A and B, which again is
and Faccenna, 2011; Ghosh and Holt, 2012). Particularly, mantle driven primarily by slabs. During various stages of Earth’s history,
drag associated with large-scale convective mantle has been sug- one or more of the above four modes may have operated togeth-
gested as the main cause for the ongoing indentation of the Indi- er. However, not all of the mechanisms are equally important
an and Arabian plates into Eurasia (Becker and Faccenna, 2011; through time. It is likely that Modes A and B together have domin-
Lu G et al.: Initiation of the first subductionEarth and Planetary Physics doi: 10.26464/epp2021014 133
ηα=1020 Pa s
(a) 0
100
200
Depth (km)
300
400
500
600 2.06 Ma
-2000 -1500 -1000 -500 0 500 1000
19
ηα=10 Pa s
(b) 0
100
200
Depth (km)
300
400
500
600 0.22 Ma
-2000 -1500 -1000 -500 0 500 1000
(c) 20
10
Txz (MPa)
0
-10
ηα=1020 Pa s
-20 ηα=1019 Pa s
-30
-2000 -1500 -1000 -500 0 500 1000
Distance (km)
ηα=1020 Pa s cm/yr ηα=1019 Pa s cm/yr
(d) 7 30 (e) 0.9 250
25 0.8
6 200
20 0.7 Subduction initiation
5 150
0.6
15
Time (Ma)
Time (Ma)
4 0.5
10 100
3 0.4
Subduction initiation 5
50
0.3
2 0
Fig. 8a
0.2 Fig. 8b 0
1 -5
0.1
-10 -50
0 0.0
-2000 -1500 -1000 -500 0 500 1000 -2000 -1500 -1000 -500 0 500 1000
Distance (km) Distance (km)
Figure 8. Comparison of basal drag force with different asthenospheric viscosities. (a, b) Plots of composition fields for models with lower-cutoff
of asthenospheric viscosity: 1020 Pa s and 1019 Pa s, respectively. Arrows indicate flow field. Note that the flow patterns are nearly identical while
the times are different. (c) Shear stress (basal drag) at depth of 50 km for these two models. The shear stresses are largely identical, although the
asthenospheric viscosity in (b) is one order of magnitude lower than in (a). (d, e) Evolution of surface velocity for models with asthenospheric
viscosity of 1020 Pa s and 1019 Pa s, respectively. Note that the velocity is one order of magnitude larger in the model with lower viscosity.
Modified from Lu G et al. (2015).
ated whenever there have been subducting slabs. Plume-driven cludes also large-scale mantle convection as indicated by large-
mechanisms (Mode C) may become important only when sub- scale dynamic topography lows and highs (Yang and Gurnis,
ducting slabs are absent, for example before the start of plate tec- 2016). Given that mantle drag force is not negligible — in some
tonics. Modes B and C, both of which involve mantle drag force, cases it could be as large as slab pull (Conrad and Lithgow-Ber-
may be understood as convection-driven mechanisms. While we telloni, 2002, 2004), we argue that mantle drag is a first-order driv-
illustrate here only end-member modes of B and C, convection- ing force and that convection-driving might be equally important
driving is not limited to slab suction and plume push, but in- as slab pull. We suggest that perturbations of interior mantle con-
Lu G et al.: Initiation of the first subduction134 Earth and Planetary Physics doi: 10.26464/epp2021014
Early view (1930s-): Mantle convection driving Modern view (1970s-): Slab driving (slab pull + slab suction)
(a) (b)
Induced plate motion
Mantle convection Slab induced mantle flow
This study: Composite driving (slab pull + mantle drag)
(c)
Downwelling induced
Subduction induced mantle flow
mantle flow
Mode A Mode B
Subduction Initiation?
Plume induced mantle flow Upwelling induced
mantle flow
Mode D Mode C
Figure 9. Various driving mechanisms of plate tectonics. (a) Early view: sub-plate mantle convection drives plate movements. (b) Modern view:
tectonic plates (slab pull and slab suction) drive mantle convection. Note the movement of upper plate towards the trench driven by slab suction.
(c) Composite driving (this study) with varying dominating driving forces at different stages. Mode A: slab pull drives surface plates and induces
mantle convection. Mode B: High-density anomaly induces mantle flow that further drives surface plates (e.g. slab suction). Mode C: Low-density
anomaly induces mantle flow that further drives surface plates (e.g. plume push). Note that Mode C is identical to Mode B except that the
directions of driving forces and corresponding mantle flow are all opposite. Mode D, an extreme case of Mode C, in which a new subduction is
initiated from stagnant lid, such that the dominant driving mechanism switches to Mode A. See texts for discussion. Solid arrows indicate driving
forces, while dashed lines indicate induced movements. However, thicker dashed lines of mantle flow show secondary driving force to surface
plates.
vection may have produced a transient pulse of mantle drag force some situations be as important as slab pull (Conrad and Lithgow-
that might have kickstarted the first subduction (Mode D), thus Bertelloni, 2004) implies that mantle drag may be sufficiently
resolving the paradox of the first SI. large. Including slab suction into a generalized convection-driven
mechanism allows to account naturally and consistently for re-ini-
It is worth noting that both plume push and slab suction as driv-
tiation of subduction when a slab breaks off (Crameri and Tackley,
ing forces are induced by faster mantle flows, which can be under- 2015), as well as for self-organization of plates in global mantle
stood as a convection-driven mechanism. However, a convection- convection models (Mallard et al., 2016; Coltice et al., 2017). On
driven mechanism is not to be confused with a “bottom-up” tec- the other hand, emphasizing the importance of convection-driv-
tonics (Chen L et al., 2020), which assumes that upwelling-domin- en mechanism does not necessarily contradict the dominance of
ated mantle convection, a system that does not include slab suc- slab-driven forces on present-day Earth. Convection-driven mech-
tion. The key point is that slab suction can be understood as either anisms may be important only locally for some plates. Whether
a “slab-driven” mechanism or a “convection-driven” mechanism. the primary role of convective mantle is driving or resisting is
Therefore, it is clear that slab-driven and convection-driven mech- most relevant to particular plates, i.e. whether underlying mantle
anisms are overlapping concepts. While present-day Earth is a flows faster or slower (e.g. Coltice et al., 2019). For the overall
slab-driven system, convection-driven mechanism is not necessar- present-day lithosphere–mantle system, the view most consist-
ily negligible. Instead, the fact that slab suction force could in ent with present-day observations is that mantle convection is
Lu G et al.: Initiation of the first subductionYou can also read