Drivers of uncertainty in future projections of Madden-Julian Oscillation teleconnections
←
→
Page content transcription
If your browser does not render page correctly, please read the page content below
Weather Clim. Dynam., 2, 653–673, 2021
https://doi.org/10.5194/wcd-2-653-2021
© Author(s) 2021. This work is distributed under
the Creative Commons Attribution 4.0 License.

Drivers of uncertainty in future projections of Madden–Julian
Oscillation teleconnections
Andrea M. Jenney1,2 , David A. Randall2 , and Elizabeth A. Barnes2
1 Department   of Earth System Science, University of California, Irvine, Irvine, CA, USA
2 Department   of Atmospheric Science, Colorado State University, Fort Collins, CO, USA

Correspondence: Andrea M. Jenney (ajenney@uci.edu)

Received: 4 February 2021 – Discussion started: 10 February 2021
Revised: 8 June 2021 – Accepted: 22 June 2021 – Published: 23 July 2021

Abstract. Teleconnections from the Madden–Julian Oscil-           of the boreal winter MJO teleconnection over the North Pa-
lation (MJO) are a key source of predictability of weather        cific and an uncertain change over North America, with large
on the extended timescale of about 10–40 d. The MJO tele-         spread over both regions that lends to weak confidence in the
connection is sensitive to a number of factors, including the     overall outlook. While quantitatively determining the relative
mean dry static stability, the mean flow, and the propagation     importance of MJO versus mean state uncertainties in deter-
and intensity characteristics of the MJO, which are tradition-    mining future teleconnections remains a challenge, the LBM
ally difficult to separate across models. Each of these factors   simulations suggest that uncertainty in the mean state winds
may evolve in response to increasing greenhouse gas emis-         is a larger contributor to the uncertainty in future projections
sions, which will impact MJO teleconnections and poten-           of the MJO teleconnection than the MJO.
tially impact predictability on extended timescales. Current
state-of-the-art climate models do not agree on how MJO
teleconnections over central and eastern North America will
change in a future climate. Here, we use results from the         1   Introduction
Coupled Model Intercomparison Project Phase 6 (CMIP6)
historical and SSP585 experiments in concert with a linear        As the most energetic mode of tropical intraseasonal vari-
baroclinic model (LBM) to separate and investigate alternate      ability, the Madden–Julian Oscillation (MJO) is one of the
mechanisms explaining why and how boreal winter (January)         most important sources of global weather predictability on
MJO teleconnections over the North Pacific and North Amer-        the extended time range of about 10–40 d (Robertson et al.,
ica may change in a future climate and to identify key sources    2015). While previous work suggests that models agree on
of inter-model uncertainty. LBM simulations suggest that a        how MJO teleconnections will change in a future climate
weakening teleconnection due to increases in tropical dry         over specific regions (e.g., many models predict a strengthen-
static stability alone is robust across CMIP6 models and that     ing of the MJO teleconnection over the North American west
uncertainty in mean state winds is a key driver of uncertainty    coast), over much of the North Pacific and over North Amer-
in future MJO teleconnections. Uncertainty in future changes      ica, it is unclear how the influence of the MJO will evolve
to the MJO’s intensity, eastward propagation speed, zonal         with increasing atmospheric greenhouse gases (Zhou et al.,
wavenumber, and eastward propagation extent are other im-         2020).
portant sources of uncertainty in future MJO teleconnections.        Whereas some consensus has been emerging about at least
We find no systematic relationship between future changes in      one of these controls that affects global MJO teleconnection
the Rossby wave source and the MJO teleconnection or be-          strength – the increase in the tropical dry static stability with
tween changes to the zonal wind or stationary Rossby wave         surface warming – recent studies suggest this control may
number and the MJO teleconnection over the North Pacific          be secondary (Bui and Maloney, 2018; Maloney et al., 2019;
and North America. LBM simulations suggest a reduction            Bui and Maloney, 2019a, b; Zhou et al., 2020). To first or-
                                                                  der, the rate that air rises and sinks in the MJO’s circulation

Published by Copernicus Publications on behalf of the European Geosciences Union.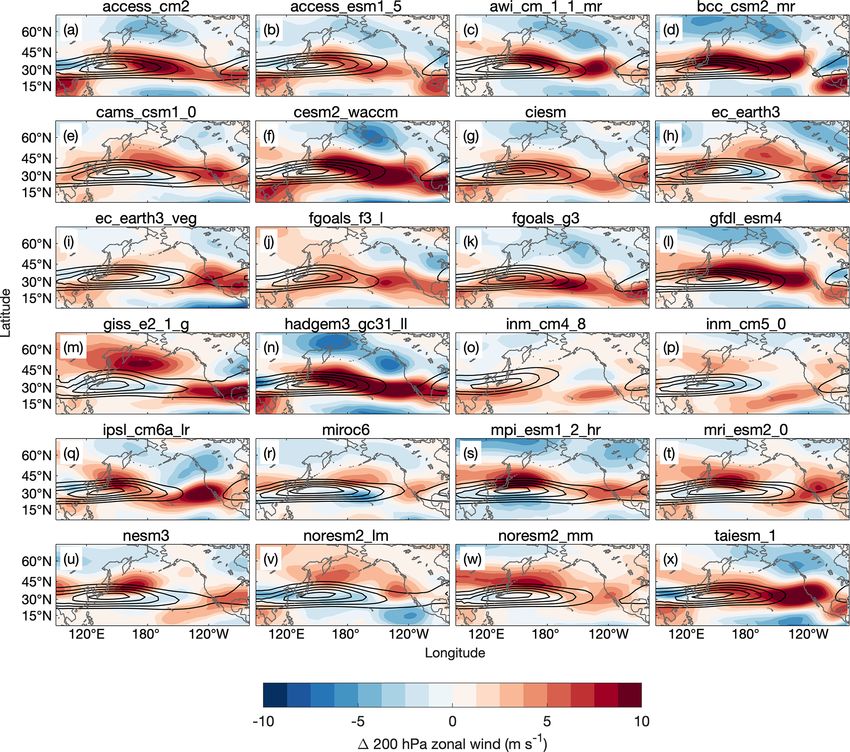
654                                A. M. Jenney et al.: Drivers of uncertainty in future projections of MJO teleconnections

is tightly constrained by, and inversely proportional to, the        west coast with warming are due to an extension of the Pa-
tropical dry static stability (Wolding et al., 2016). Latent heat    cific jet, which causes a shift in the MJO teleconnection pat-
release associated with MJO precipitation is balanced by the         tern. However, little work has been done to explore the direct
upward advection of dry static energy. Similarly, radiative          role that changes to the mean state winds have on changing
cooling in the MJO’s dry region is balanced by slow, adia-           MJO teleconnections to the broader North Pacific and North
batic subsidence. That is, the MJO’s circulation strength is         America region.
directly proportional to its diabatic heating rate and inversely        In addition to features of the mean state (its static stabil-
proportional to the dry static stability. It is expected that the    ity and winds), the MJO teleconnection may also respond
tropical static stability will increase in the future as the trop-   to changes in the MJO. The MJO teleconnection is known
ical temperature profile adjusts towards the moist adiabatic         to be sensitive to its eastward propagation speed. While one
lapse rate of a warmer surface (e.g., Santer et al., 2005). Ig-      study found little sensitivity of extratropical teleconnections
noring changes to the MJO’s precipitation intensity or its           to the eastward propagation speed of tropical heating (Goss
cloud optical properties (i.e., its diabatic heating rate), this     and Feldstein, 2017), many studies have found the opposite.
will weaken the MJO’s vertical circulation and its associated        Comparisons between composites of observed geopotential
upper-level divergence. In simulation studies of a future cli-       height anomalies during fast and slow MJO events show dif-
mate forced with increasing greenhouse gases, many models            ferences in both the teleconnection pattern and magnitude
predict a weakening of the MJO’s circulation strength (Bui           of the anomalies (Yadav and Straus, 2017). Models with
and Maloney, 2018; Maloney et al., 2019). However, there is          faster-propagating MJOs have weaker MJO teleconnections
a considerable amount of inter-model spread, much of which           (Wang et al., 2020; Zheng and Chang, 2019). In a simulation
is tied to disagreement in future projections of the MJO’s           study, Bladé and Hartmann (1995) showed that an eastward-
diabatic heating and precipitation (Bui and Maloney, 2018;           propagating heat source is associated with a weaker and
Maloney et al., 2019; Bui and Maloney, 2019a, b). While              smaller wave train than a stationary or westward-propagating
previous work has attributed a simulated weakening of MJO            heat source. To first order, this is a linear effect: eastward
teleconnections in one model to the increase in dry static sta-      (westward) propagation effectively embeds the heating in
bility (Wolding et al., 2017), a recent model intercompari-          easterlies (westerlies) (see Sect. 2b of Bladé and Hartmann,
son study has shown that in climate change simulations the           1995). Many climate models predict an increase in the MJO’s
MJO’s circulation change is not correlated with its telecon-         propagation speed with warming (e.g., Rushley et al., 2019),
nection changes (Zhou et al., 2020).                                 which, considering previous work, may contribute to a weak-
   Samarasinghe et al. (2021) suggest that the lack of an            ening or at least a change in the pattern of the MJO telecon-
apparent relationship between modeled MJO circulation                nection with warming.
change and teleconnection change may be related to changes              In the present climate, MJO convection is generally con-
in the mean state winds. Mean state winds refer to the winds         fined to the Indian and western Pacific oceans, while the MJO
that vary slowly in time (i.e., on seasonal rather than daily        circulation signal circumnavigates the tropics. In simulations
timescales). Henderson et al. (2017) emphasize the impor-            of a future warmer climate, many models predict an increase
tance of the mean state winds in the MJO teleconnection              in the eastward extent of MJO convection (Adames et al.,
pattern, showing that biases in modeled MJO teleconnec-              2017; Bui and Maloney, 2018; Chang et al., 2015; Subrama-
tions can be attributed, in part, to biases in the mean state        nian et al., 2014). This may be driven by the expansion of
winds. Mean state winds affect both Rossby wave excitation           the eastward edge of the Indo-Pacific warm pool, a region of
and their propagation. The magnitude of the vorticity and its        very warm tropical sea surface temperatures (Maloney and
horizontal gradient on the equatorward flank of the jet play         Xie, 2013; Zhou et al., 2020). A more-eastward-propagating
an important role in the excitation of Rossby waves by the           MJO may extend the region of Rossby wave excitation by the
MJO (Sardeshmukh and Hoskins, 1988; Mori and Watanabe,               MJO further eastward as well.
2008; Seo and Son, 2012; Seo and Lee, 2017; Zheng and                   Beyond MJO’s precipitation intensity, propagation speed,
Chang, 2020). The jets also act as a waveguide, and their            and propagation extent, the MJO’s zonal wavenumber is pro-
structure and intensity determine the path that Rossby waves         jected to decrease (Rushley et al., 2019). Previous work has
take as they propagate and the sizes of Rossby waves that            also found an increase in the frequency of MJO events (e.g.,
can propagate through them (e.g., Hoskins and Ambrizzi,              Arnold et al., 2013; Chang et al., 2015; Cui and Li, 2019).
1993; Karoly, 1983). Tseng et al. (2020b) and Zheng and              Lastly, the meridional extent of the MJO may also change,
Chang (2020) show how variability in the mean state winds            although it is unclear if this is expected with surface warm-
over the eastern North Pacific drives variability in the MJO         ing.
teleconnection, with variations in the jet’s zonal extension            Studies exploring the MJO teleconnection change with
or meridional position playing an important role in modulat-         warming in global climate models are sparse. Samarasinghe
ing wave propagation, and hence MJO teleconnectivity, over           et al. (2021) find strengthened future MJO teleconnections
North America. Finally, Zhou et al. (2020) show that mod-            over the Gulf of Alaska and North Atlantic in a climate model
eled increases in the MJO’s impact over the North American           forced with high emissions. While Zhou et al. (2020) show

Weather Clim. Dynam., 2, 653–673, 2021                                                   https://doi.org/10.5194/wcd-2-653-2021
A. M. Jenney et al.: Drivers of uncertainty in future projections of MJO teleconnections                                      655

that a multi-model mean change in the MJO’s impact on both         2   Methods
the circulation and precipitation over most of North Amer-
ica is near zero, they do not quantify the uncertainty in this     We explore the sensitivity of the MJO teleconnection to
projection over this larger region. Their results for the North    changes in the MJO’s propagation speed, eastward propaga-
American west coast, which rely on a subset of the publicly        tion extent, zonal wavenumber, heating magnitude, and of the
available climate model data (they analyze only those mod-         mean state dry static stability and winds using simulations
els that produce the most realistic MJOs), hint that while         with the LBM of Watanabe and Kimoto (2000). The time-
the multi-model mean change over broader North America             integration version of the LBM that we use here is a spectral
is small, there may be quite a bit of disagreement between         model that solves linearized equations for vorticity, diver-
models.                                                            gence, temperature, and surface pressure. The model takes
   A detailed study of potential MJO teleconnection changes        two inputs: a mean state and a forcing (which is added to the
is attractive. We are motivated to unpack how and why MJO          simulated perturbation field at each time step).
teleconnections might change under global warming and                 The model equations are described in appendix B of
here seek to clearly and quantitatively rank the various con-      Watanabe and Kimoto (2000). We use a horizontal trunca-
trols on MJO teleconnection strength changes in a warmer           tion of T42 (roughly 2.8◦ horizontal resolution) and 20 ver-
climate to better understand how the MJO teleconnection            tical levels. The model is numerically damped with bihar-
might change in the future. Additionally, we desire to maxi-       monic horizontal diffusion, for which we use an e-folding
mize the resources offered by the latest phase of the Coupled      time of 10 min for the smallest resolvable waves, and with
Model Intercomparison Project (CMIP6; Eyring et al., 2016),        linear drag, with a damping timescale of 0.5 d applied to the
by avoiding having to subset only those models producing           lowest three model levels, 1 d for the top two model levels,
more realistic MJOs.                                               and 20 d for all levels in between. We use this strong damp-
   In this study, we will use a linear baroclinic model (LBM,      ing to inhibit the growth of baroclinic waves, particularly be-
Watanabe and Kimoto, 2000) in concert with output from             cause in some simulations we intentionally prescribe mean
CMIP6 to separately quantify the contributions to uncer-           state winds that are not in balance with the mean state tem-
tainty in future projections of the MJO teleconnection by          perature. As a consequence of the strong damping and lin-
various mechanisms: mean state changes and changes to the          ear framework, eddy convergences of heat and momentum
MJO’s eastward propagation extent, propagation speed, heat-        in the extratropical storm tracks, including those associated
ing intensity, and zonal wavenumber. The use of the LBM            with MJO variability (e.g., Deng and Jiang, 2011; Guo et al.,
for studying the MJO teleconnection has precedent. Previ-          2017; Takahashi and Shirooka, 2014), are not explicitly ac-
ous work shows the MJO teleconnection is, to first order, lin-     counted for. However, because the mean state wind used in
ear (Mori and Watanabe, 2008; Lin and Brunet, 2018). Many          the LBM simulations is taken from CMIP6, eddy–mean-flow
previous studies have used the LBM to untangle MJO tele-           interactions are, in a way, included implicitly.
connection mechanisms (e.g., Henderson et al., 2017; Tseng            We will make the convention for composite analysis that
et al., 2019, 2020a, b; Wang et al., 2020; Wolding et al.,         “historical” and “future” mean states refer to January con-
2017). The linear model additionally has a few features that       ditions during 1984–2014 and 2071–2100, respectively, of
make it particularly attractive for the current study. First, it   the historical and SSP585 simulations from models partic-
is very inexpensive to run, allowing us to cheaply and effi-       ipating in CMIP6. SSP585 is a relatively high atmospheric
ciently run hundreds of perturbation simulations, a task that      greenhouse gas emissions scenario following Shared Socioe-
is difficult and expensive using complex global climate mod-       conomic Pathway 5 (SSP5; O’Neill et al., 2017) and Repre-
els. Second, the linear framework is quite simple in that al-      sentative Concentration Pathway 8.5 (RCP8.5; Moss et al.,
most all simulated variability is from an external forcing,        2010).
which makes the interpretation of the results very straight-          We restrict our analysis to those 29 CMIP6 models for
forward. Third, because the mean state is maintained by pre-       which there was monthly mean data for the variables required
scribing it at each time step, it is possible to run simula-       as input by the LBM on the data node at https://esgf-node.
tions with the temperature field out of balance with the wind      llnl.gov/search/cmip6/ (last access: 10 November 2020) at
field. This point allows us to separately and cleanly quan-        the time of access. We use the r1i1p1f1 member for all mod-
tify the uncertainty in the MJO teleconnection change from         els except for GISS-E2-1-G (r1i1p1f2), HADGEM3-GC31-
uncertainty in the thermal structure of the atmosphere ver-        LL (r1i1p1f3), UKESM1-0-LL (r1i1p1f2), and MIROC-
sus its mean winds. Finally, because we can separately pre-        ES2L (r1i1p1f2). We acknowledge that sampling ensemble
scribe an MJO forcing, it is not necessary to have a realistic     spread is desirable in order to isolate the forced response
internally generated MJO when investigating the sensitivity        from internal variability. Thus, for each CMIP6 model mean
of the MJO teleconnection to inter-model variations in the         state combination, we construct an ensemble of 30 separate
mean state, thus permitting us to avoid only analyzing those       LBM simulations, each using a different January. We use in-
CMIP6 models which produce more reliable MJOs.                     terannual ensembles in this way, rather than using the other
                                                                   ensemble members from each CMIP6 model, to minimize

https://doi.org/10.5194/wcd-2-653-2021                                              Weather Clim. Dynam., 2, 653–673, 2021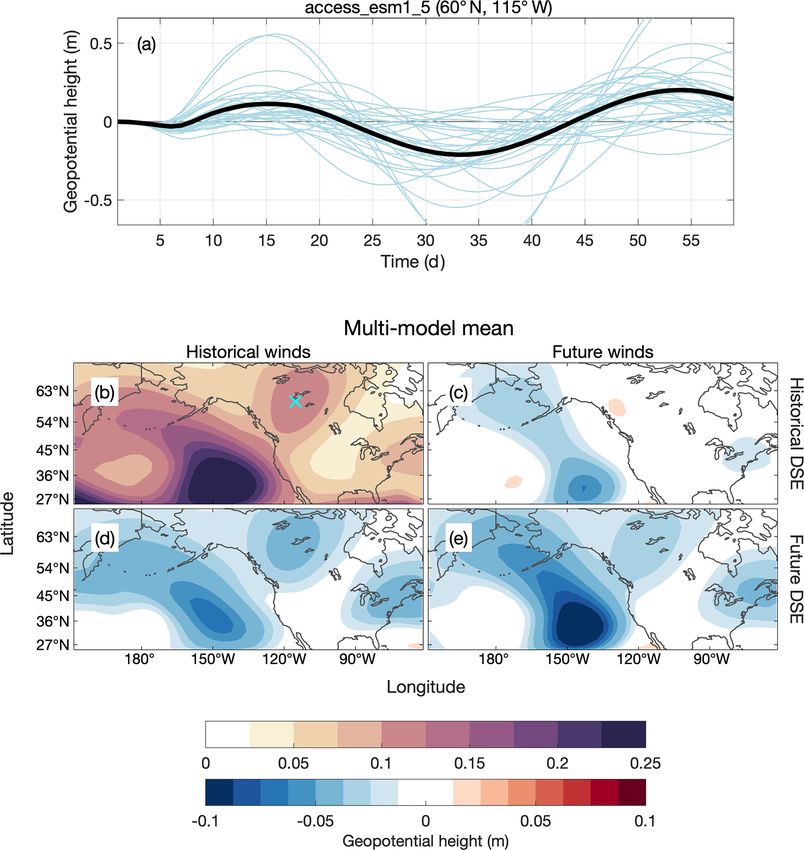
656                              A. M. Jenney et al.: Drivers of uncertainty in future projections of MJO teleconnections

the data downloading burden and to keep the number of en-
semble members used for each CMIP6 model mean state
consistent. Lastly, the SSP585 simulation of CAMS-CSM1-
0 was only carried out until 2099, and so for this model we
use only 29 years.
   We force the LBM with a propagating idealized horizon-
tal dipole heating, which is preferable to a realistic heat
source (for example, one obtained from composites of ob-
served MJO events), since it allows easy manipulation of the
MJO’s intensity and propagation characteristics. The ideal-
ized heating (as in Ting and Held, 1990; Seo and Son, 2012)
is designed to be MJO-like, with the perturbation tempera-
ture given by
                   −sin2 φ                 −(λ−b)2
T 0 (λ, φ, z, t) = Ae 2σ 2 sin(kλ − ωt)e     2c2

                       π(z − ztop )                               Figure 1. Propagating thermal forcing used in the LBM simulations
                sin2                  ,                    (1)
                       zbot − ztop                                at t = (a) 10 d, (b) 20 d, (c) 30 d, and (d) 40 d.

where T 0 is the perturbation temperature of the forcing, φ
and λ are the latitude and longitude, respectively, z is the
model vertical coordinate with subscripts bot and top refer-      use of the many CMIP6 mean states permits the quantifi-
ring to the lowest and highest model level, respectively, A is    cation of uncertainty in the future MJO teleconnection due
the heating amplitude, k is the zonal wavenumber, ω is the        to model uncertainty (e.g., Lehner et al., 2020) of the mean
temporal frequency of the heating, and t is the time. Unless      state.
otherwise noted, we set A = 0.1 K d−1 , σ = 0.1, k = 1.9, ω          We are guided by the results of previous studies for the
corresponding to a temporal period of 40 d, b = 130◦ , and        experiments where the full mean state is held constant and
c = 45◦ . Figure 1 shows the perturbation heating (T 0 ) in the   MJO intensity or propagation characteristics are being per-
mid-troposphere where it is a maximum for t = 10, 20, 30,         turbed. For these simulations, we aim to quantify uncertainty
and 40 d. To impose a realistic MJO horizontal scale, and fa-     by obtaining the range of possible changes to the MJO tele-
cilitate varying it, we constrain the propagating heat source     connection that result from changes to the MJO. We do this
to the longitudes over the Indian and western Pacific oceans      by conducting experiments with perturbations representing
by multiplying the sinusoidal heat source by a Gaussian cen-      the lower and upper bound of changes to the MJO that are
tered over the Maritime Continent (see Eq. 1). We initialize      simulated by models participating in the Coupled Model In-
the model with the forcing given by setting t = 1 d and inte-     tercomparison Project Phase 5 (CMIP5) at the end of the
grate for 60 d.                                                   century given high emissions. For climate models that simu-
   The experiments are described in Table 1. When testing         late realistic MJOs in CMIP5, Rushley et al. (2019) find an
the sensitivity of the MJO teleconnection to perturbations of     increase in MJO propagation speed between 1.8 % K−1 and
the mean state or of an MJO intensity or propagation char-        4.5 % K−1 and a maximum decrease in the zonal wavenum-
acteristic, we perturb only the feature being tested and hold     ber of about 0.2 (we use no change in the zonal wavenum-
everything else constant. For each perturbed feature, we run      ber as a lower bound). Using the increase in the multi-model
two sets of experiments: one with the mean climate given by       mean, global mean surface temperature between the histori-
historical values, and the other with the mean climate given      cal and future climates of the models used in this study, we
by future values (see the “sub-experiment” column in Ta-          thus conduct experiments where the propagation speed of our
ble 1). For example, in testing the sensitivity of the telecon-   idealized forcing is perturbed to correspond to an MJO pe-
nection to the mean state winds, we run two sets of experi-       riod of about 37.5 (34) d for the lower bound (upper bound)
ments: one set in which the dry static energy is held constant    experiment where sensitivity to MJO propagation speed is
at historical values while the winds are perturbed, and the       being tested. In modification of the MJO’s eastward extent,
other set with the dry static energy held constant at future      we use no change as a lower bound and for the upper bound
values while the winds are again perturbed. The LBM takes         extend by 20◦ the eastern edge of the Gaussian used to con-
as input three-dimensional winds, temperature, geopotential       fine the propagating forcing to the Indian and western Pacific
height, and surface pressure. The set of variables held con-      oceans. Specifically, the Gaussian multiplier of the perturba-
stant when the winds are held constant are the zonal, merid-      tion forcing is the control Gaussian with the maximum value
ional, and vertical wind. Similarly, the set of variables held    sustained for an additional 20◦ to the east before decreas-
constant when the dry static energy is held constant are the      ing. This value is roughly informed from results in Maloney
temperature, geopotential height, and surface pressure. The       et al. (2019) (CMIP5) and in Zhou et al. (2020) (CMIP5

Weather Clim. Dynam., 2, 653–673, 2021                                                https://doi.org/10.5194/wcd-2-653-2021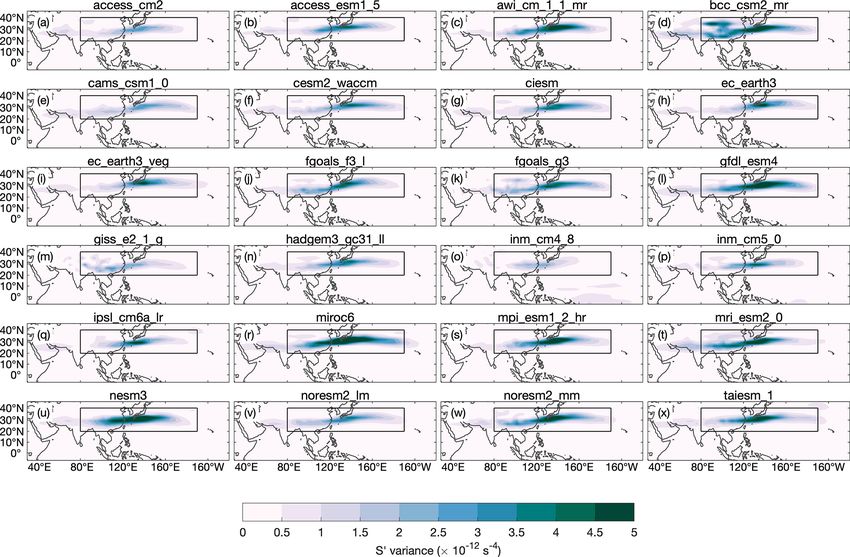
A. M. Jenney et al.: Drivers of uncertainty in future projections of MJO teleconnections                                      657

and CMIP6). Lastly, we are informed by Bui and Maloney             3     Results
(2018), who find that the subset of CMIP5 models that pro-
duce MJOs validating best against present-day observations
                                                                   3.1    Mean state
tend to simulate changes in the MJO’s precipitation ampli-
tude from −10 % to +20 % between the historical and fu-
ture climates under RCP8.5 forcing. In the experiment testing      We conduct experiments with the experimental setup de-
sensitivity to MJO amplitude, we use perturbed MJO heating         scribed by Table 1.
amplitudes of 0.9 and 0.12 K d−1 , corresponding to a 10 %            Reassuringly, the propagating MJO-like forcing in the
reduction and 20 % amplification of the control forcing. We        model excites a plausible time-varying response in the ex-
use estimates of changes to the MJO from CMIP5, rather             tratropics. As an example, Fig. 2a shows the time-varying
than CMIP6, due to the availability of published, detailed         response of 500 hPa geopotential height at 60◦ N, 115◦ W for
analyses of MJO changes for CMIP5. However, we note that           each ensemble member (thin light blue lines) and their mean
despite recent improvement in the simulation of the MJO in         (thick black line) for the set of 30 simulations performed with
CMIP6 (Ahn et al., 2020) much work is needed to deepen             the full mean state given by historical values from a sin-
understanding of future changes to the MJO, and thus these         gle representative CMIP6 model (ACCESS-ESM1-5). The
estimates are crude, first guesses. We include a figure show-      smallness of the geopotential height anomalies relative to
ing the perturbed MJO cases in Appendix A.                         a typical observed midlatitude value is an expected conse-
   With the described setup, some of the simulations became        quence of the smallness of the amplitude used to force the
unstable. We readily admit this is an inescapable trade-off        model, which we kept small to try to minimize the number
of having implemented a forced linear model framework;             of unstable simulations.
despite its advantages for rapidly sampling and intercom-             We next introduce a scalar metric of MJO teleconnection
paring first-order effects, the neglect of secondary nonlinear     strength that is appropriate to visualize in map form, recog-
buffering mechanisms can corrupt some integrations. Prag-          nizing that the magnitude of peaks and troughs of the en-
matically, we thus omit all LBM simulations in which, at           semble mean response to the propagating forcing (for exam-
any location, the maximum value of geopotential height at          ple, the thick black line in Fig. 2a) is one way to quantify
500 hPa during the second half of the integration is more than     the magnitude of the consistent (ensemble mean signal that
10 times the maximum value during the first half. Addition-        stands apart from the noise due to internal variability) tele-
ally, we omit all LBM simulations using a specific CMIP6           connection strength. Given that the amplitude of an infinite
model’s mean state if 10 or more of the 30 constituent en-         sine or cosine wave is the square root of twice its variance,
semble simulations for any of the mean state combinations          we define the teleconnection strength at each point as the
meets the instability criterion described above, leaving 24 of     square root of twice the temporal variance of the ensemble
the 29 CMIP6 models for analysis. Figure A2 in Appendix A          mean geopotential height at 500 hPa, ignoring the first 10 d
shows, for each mean state combination, the fraction of en-        of each simulation to avoid sampling conditions prior to the
semble members that became unstable. The last two rows of          establishment of representative spread between interannually
Table 1 list the number of total simulations run for this study    varying ensemble members. That is, we take the ensemble
(minus those from the five CMIP6 models we omit) and the           mean first and then calculate the variance. We will refer to
number of simulations we omit from our analysis for each           this value as the “amplitude” of the modeled MJO telecon-
experiment (which is reassuringly less than 5 % of the total       nection. This metric is qualitatively similar to the STRIPES
simulations for each experiment). Note that the “number of         index of Jenney et al. (2019), which is useful for quantifying
unique simulations” field is blank for the mean state winds        the sensitivity of the extratropics to MJO variability across
feature (second row) because the simulations are shared with       all MJO phases.
that of mean state dry static stability (first row).                  The baseline multi-model MJO teleconnection simulated
   Lastly, we emphasize that the linear framework we are us-       by the LBM looks reassuringly plausible. Figure 2b shows
ing neglects nonlinear interactions in simulating MJO tele-        the multi-model mean MJO teleconnection amplitude for the
connections. For example, in reality, the mean state exerts        set of LBM simulations performed with both the mean state
a strong control on MJO propagation characteristics (Jiang         dry static energy (the vertical gradient of which gives the dry
et al., 2020). Rossby waves excited by the MJO are able to         static stability) and winds given by historical values. Darker
extract energy from the mean flow (Adames and Wallace,             colors indicate that MJO teleconnectivity is larger. The MJO-
2014; Zheng and Chang, 2020), and nonlinear interactions           like forcing excites Rossby waves that propagate in high den-
have been shown to lead to spatial shifts in extratropical tele-   sity through the Pacific waveguide, leading to large values of
connection patterns (Lin and Brunet, 2018). Thus, we caution       teleconnectivity there. The pattern of MJO teleconnectivity
that the results of this study are limited by the exclusion of     over North America, which exhibits maxima over the south-
these effects.                                                     eastern and northwestern region, with a minimum over the
                                                                   central region, is consistent with the pattern of the observed
                                                                   boreal winter MJO influence on North American geopoten-

https://doi.org/10.5194/wcd-2-653-2021                                              Weather Clim. Dynam., 2, 653–673, 2021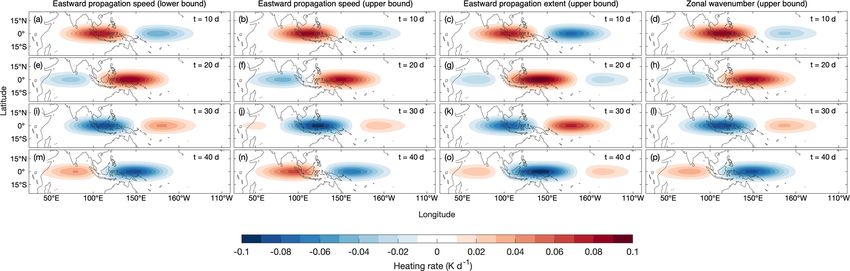
658                                A. M. Jenney et al.: Drivers of uncertainty in future projections of MJO teleconnections

Table 1. Experimental setup for the linear baroclinic model simulations. “Lower bound” and “upper bound” refer only to perturbations of
the thermal forcing (last three rows). DSE indicates dry static energy.

  Feature                     Sub-experiment          Control           Perturbation          Perturbation      Number of     Number of
                                                                        (lower bound)         (upper bound)        unique       unstable
                                                                                                               simulations   simulations
  Mean state DSE              Historical wind         Historical DSE    Future DSE                                   1440            49
                              Future wind                                                                            1440            63
  Mean state winds            Historical DSE          Historical wind   Future wind
                              Future DSE
  Forcing heating magnitude   Historical mean state   A = 0.10 K d−1    A = 0.09 K d−1        A = 0.12 K d−1           60             0
                              Future mean state                                                                        60             0
  Forcing propagation speed   Historical mean state   ω = 1/40 d−1      ω = 1/37.5 d−1        ω = 1/34 d−1            600             0
                              Future mean state                                                                       600             0
  Forcing eastward extent     Historical mean state                     0◦ extension          20◦ extension           600             0
                              Future mean state                                                                       600             1
  Forcing wavenumber          Historical mean state   k = 1.9           k = 1.9 (no change)   k = 1.7                 600             2
                              Future mean state                                                                       600             3

tial height, temperature, and sea level pressure (e.g., Jenney          dry static stability (Fig. 2d), but over the eastern Pacific it is
et al., 2019; Zhou et al., 2012; Samarasinghe et al., 2021).            also due to changes to the winds (Fig. 2c). Figure 3, which
   The remainder of Fig. 2 reveals, in general, a reduction             shows the change in the tropical vertical temperature gradi-
of MJO teleconnectivity due to future mean state effects,               ent for individual CMIP6 models between the historical and
decomposed into separate contributions from stability vs.               future periods, confirms that models show a robust increase
winds. Figure 2c–e show the multi-model difference in the               in the tropical dry static stability.
amplitude of the modeled MJO teleconnection between the                    We now explore the inter-model spread of changes to the
set of simulations with the historical mean state and the set of        MJO teleconnection due to changes in the mean state. Fig-
simulations with future perturbations to the mean state. The            ure 4 summarizes, for the separate mean states from each
forcing used in all simulations is the same. Figure 2c shows            CMIP6 model, the change in the LBM-simulated telecon-
the change to the multi-model mean teleconnection that re-              nection amplitude over the North Pacific (top panels; 25–
sults from future changes to the winds alone. Over most of              70◦ N, 150–235◦ E) and North America (bottom panels; 25–
North America, the change in the teleconnection is near zero.           70◦ N, 235–290◦ E), as a percent change per kelvin multi-
Over the eastern Pacific and Bering Sea, changes to the winds           model mean warming. Here and throughout the remainder
lead to a weaker teleconnection. Other studies have noted an            of this work, we choose to separate the larger Pacific–North
increase in the MJO’s boreal winter influence near Califor-             America region into two smaller regions because we do not
nia (Zhou et al., 2020), attributing this to an eastward ex-            want to assume that the amplitude changes in the two regions
tension of the Pacific jet. This strengthening is not apparent          are the same. For each region we plot the domain mean per-
here. Figure 2d shows the change to the multi-model mean                cent change in the teleconnection amplitude, as well as the
teleconnection that results from future increases in tropical           fractional area that is strengthening for perturbations to ei-
dry static stability alone. That is, changes to the winds are           ther the mean state dry static energy or the mean state wind.
not taken into account and are held constant between these              By fractional area, we mean the fraction of the region that
two sets of simulations. The teleconnection is weaker in the            shows a teleconnection amplitude change greater than zero.
simulations with future dry static energy because the higher            We include the fractional area as a crude way to communi-
static stability weakens the MJO circulation and subsequent             cate the spatial distribution of teleconnection changes over
Rossby wave source (Sardeshmukh and Hoskins, 1988) that                 the region, where a value of 0.5 indicates that 50 % of the
results from the prescribed thermal forcing.                            domain shows stronger teleconnections in the future period
   Figure 2e shows the sensitivity of the MJO teleconnection            compared to the historical period. Likewise, a value of 1 in-
to a change in the full mean state, neglecting any changes              dicates that the entire domain shows a larger teleconnection
to the MJO. In isolation (apart from changes to the MJO),               amplitude in the future period. In isolation, the mean telecon-
changes to the mean state weaken the multi-model mean tele-             nection amplitude change over the region may be misleading
connection amplitude in places where the teleconnection is              if one small region experiences a very strong change in one
the strongest. This is mostly due to an increase in the tropical        direction (enough to make the domain mean change be of the

Weather Clim. Dynam., 2, 653–673, 2021                                                        https://doi.org/10.5194/wcd-2-653-2021
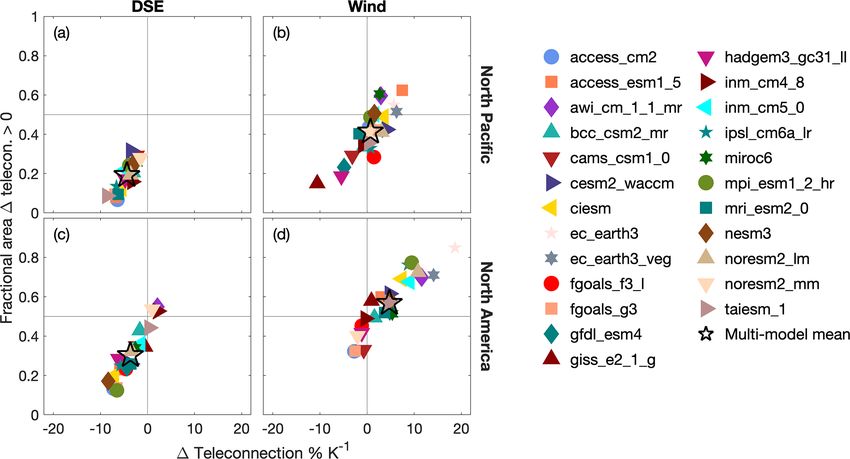
A. M. Jenney et al.: Drivers of uncertainty in future projections of MJO teleconnections                                                  659

Figure 2. (a) The time series of geopotential height at 500 hPa at 60◦ N, 115◦ W for each January and their mean (thick black line) for the set
of LBM simulations with the historical mean state winds and dry static energy (DSE) from ACCESS-ESM1-5. (b) The multi-model mean
teleconnection amplitude (see text for definition) for the set of simulations with mean states given by historical winds and DSE. (c) The
difference between the multi-model mean teleconnection amplitudes for the set of simulations with the full historical mean state and the set
of simulations with future winds and historical dry static energy, (d) historical winds and future fry static energy, and (e) future winds and
future dry static energy. DSE indicates dry static energy.

same sign), despite the majority of the domain experiencing               teleconnection amplitude change due to the change in the
a change in the opposite direction. For example, we find that             atmosphere’s thermal structure alone (i.e., neglecting mean
there are some cases in which the mean teleconnection am-                 state wind or MJO changes) between model mean states, par-
plitude change over the region is positive, while the majority            ticularly for teleconnections to the North Pacific. Compari-
area of the region shows a negative change.                               son between Fig. 4a and c shows that there is greater spread
   The increase in the tropical dry static stability is a con-            downstream of the tropical heat source over North America,
sequence of amplified upper-tropospheric warming that oc-                 although the reasons for this are unclear.
curs as tropical temperatures adjust to warmer surface tem-                  Despite agreeing on effects of stability, models disagree
peratures (e.g., Santer et al., 2005). Our first main finding             wildly on the effects of future wind changes. Figure 4b and
is strong corroboration of the hypothesis that the increase in            d show the change in the teleconnection amplitude due to
the tropical dry static stability is a robust thermodynamic re-           the change in the wind between the historical and future pe-
sponse of the climate to warming that tends to reduce the                 riod. The multi-model mean response of the MJO telecon-
MJO’s teleconnections in almost all models (Fig. 4a and c).               nection amplitude over the North Pacific is about zero, with
This is the first multi-model confirmation of this hypothe-               a majority of the region experiencing a weakening. However,
sis, which first appears in the single-model study of Wold-               the inter-model spread is relatively large, with models show-
ing et al. (2017). There is relatively good agreement in the              ing changes between −11 % K−1 and 7 % K−1 multi-model

https://doi.org/10.5194/wcd-2-653-2021                                                       Weather Clim. Dynam., 2, 653–673, 2021
660                                 A. M. Jenney et al.: Drivers of uncertainty in future projections of MJO teleconnections

                                                                             h                              i
                                                                      S 0 = − ∇ · (v χ ζ 0 ) + ∇ · (v 0χ ζ ) ,                    (2)

                                                                      where ζ is the absolute vorticity, v χ is the horizontal di-
                                                                      vergent wind, the overbar represents mean state quantities,
                                                                      and the prime represents anomalies. Here, anomalies are the
                                                                      LBM-simulated deviations from the user-input mean state.
                                                                      In the subsequent analysis, we use quantities at 200 hPa to
                                                                      calculate S 0 .
                                                                          We do not find a systematic relationship between the dif-
                                                                      ference in S 0 and the difference in the mean teleconnection
                                                                      amplitude over the North Pacific or North America between
                                                                      simulations with historical and future winds. Figure 5 shows,
                                                                      for simulations with historical and future winds, the relation-
                                                                      ship between the ensemble mean and time mean difference in
                                                                      the absolute value of the Rossby wave source averaged over
Figure 3. The change in the tropical mean (20◦ S–20◦ N) vertical      the subtropical jet (20–40◦ N, 80–190◦ E) and the difference
temperature gradient (∂T /∂p) between the historical and future pe-   in the mean teleconnection amplitude over the North Pacific
riods for each CMIP6 model used in this study.                        and North America. Figure A3 in Appendix A verifies that
                                                                      this region indeed encloses the region of highest S 0 variabil-
                                                                      ity in the LBM simulations. Models with larger increases in
mean warming. Over North America, the multi-model mean                |S 0 | over the jet do not systematically have stronger telecon-
change in the teleconnection due to the wind is a strengthen-         nections. If changes to Rossby wave excitation were to play
ing of 4.7 % K−1 . But again, the inter-model spread is large         a key role in the difference in the teleconnection amplitude
(−3 % K−1 to 19 % K−1 ).                                              between simulations with historical and future mean state
   In summary, three key results emerge concerning how                winds, then it would be reasonable to expect either weaker
mean state changes in a future warmer climate may con-                or similar-sized links over North America and the North Pa-
tribute to changing MJO teleconnections to the North Pa-              cific, since most Rossby waves excited by the MJO propagate
cific and North America. First, we find robust support for            first over the Pacific before reaching North America. Instead,
the expectation that increases in tropical dry static stabil-         the relationship between the difference in |S 0 | and the tele-
ity will contribute to weaker MJO teleconnections. Second,            connection amplitude difference appears stronger over North
we find that changes to the mean state winds can contribute           America (r = 0.43) than over the North Pacific (r = 0.27).
to very large changes in the MJO teleconnection – that is,            We therefore conclude that the change in |S 0 | is not a pri-
large enough to as much as double or negate the weakening             mary mechanism that explains how mean state winds affect
that is expected due to increasing tropical dry static stabil-        the teleconnection amplitude difference in our LBM simula-
ity. Third, there is a large amount of inter-model spread in          tions. This is consistent with Wang et al. (2020) and Zheng
LBM-simulated changes to the MJO teleconnection that re-              and Chang (2020), who show that a stronger S 0 does not nec-
sults from changes to mean state winds, which suggests that           essarily lead to stronger MJO teleconnections.
uncertainty in the response of the mean state winds to warm-              In addition to playing a key role in Rossby wave excita-
ing is a large contributor to uncertainty in modeled changes          tion, mean state winds also determine the path that Rossby
to the MJO teleconnection.                                            waves take as they propagate (e.g., Karoly, 1983; Hoskins
   It is thus important to better understand the cause of tele-       and Ambrizzi, 1993). Meridional shifts and variations in the
connection changes associated with mean state wind changes            zonal extent of the subtropical jet have been linked with
in the CMIP6 models. Mean state winds can increase or de-             variations in teleconnection amplitude across North Amer-
crease the strength of MJO teleconnections via an intensifi-          ica (Henderson et al., 2017; Tseng et al., 2020b; Zheng and
cation of Rossby wave excitation and/or through mean state            Chang, 2020). An eastward extension of the subtropical jet
changes that permit more Rossby wave energy propagation               was shown to be important for increases in the MJO’s impact
into these regions.                                                   over the North American west coast in climate models (Zhou
   We begin by quantifying the strength of Rossby wave ex-            et al., 2020). Similarly, Samarasinghe et al. (2021) propose
citation using the linearized equation for the Rossby wave            that the changes to the North Pacific jet may explain mod-
source (Sardeshmukh and Hoskins, 1988), S 0 , a term that rep-        eled increases in simulated MJO teleconnections in CESM2-
resents the generation of large-scale vorticity,                      WACCM. Here, we search for a systematic (common across
                                                                      CMIP6 model mean states) and localized (specific to one re-
                                                                      gion) change in the upper-tropospheric extratropical mean

Weather Clim. Dynam., 2, 653–673, 2021                                                      https://doi.org/10.5194/wcd-2-653-2021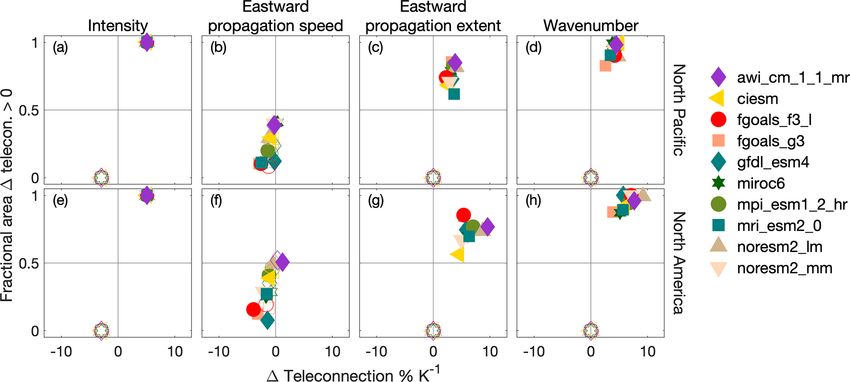
A. M. Jenney et al.: Drivers of uncertainty in future projections of MJO teleconnections 661
Figure 4. For individual CMIP6 model mean states and the multi-model mean, the change in the teleconnection amplitude (as a percent
change per multi-model mean kelvin warming) to the North Pacific (25–70◦ N, 150–235◦ E) and North America (25–70◦ N, 235–290◦ E)
between LBM simulations with mean states given by future and historical quantities. The isolated change due to (a) stability, over the North
Pacific; (b) wind, over the North Pacific; (c) stability, over North America; and (d) wind, over North America. The horizontal axis is the
domain mean change over the region, while the vertical axis shows the fractional area of teleconnection amplitude strengthening. DSE
indicates dry static energy.
between the historical and future periods) and the regional
mean (i.e., across the entire North Pacific or North America
region) difference in the MJO teleconnection amplitude be-
tween simulations with historical and future mean winds (in-
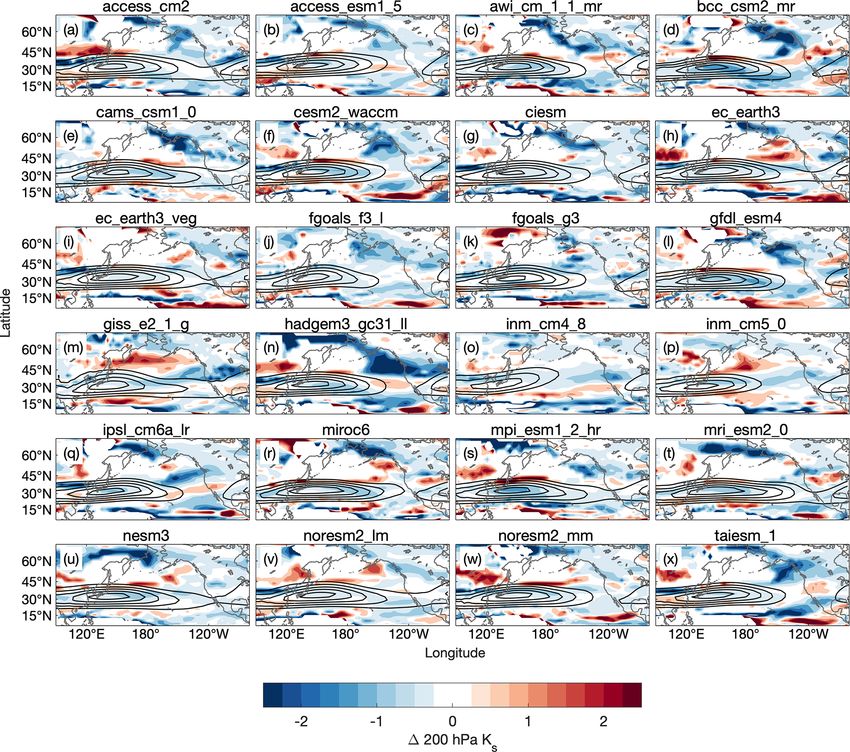
dividual modeled changes in 200 hPa zonal wind are shown
in Fig. A4 in Appendix A). Correlations are generally weak
everywhere (for reference, r = 0.5 corresponds to a p value
of roughly 0.30 using a Fisher Z transformation), which sug-
gests that there may not be a change to the winds over a spe-
cific region that explains a majority of the spread in Fig. 4b
and d. However, given the importance of horizontal gradients
of mean state vorticity for Rossby wave propagation, such a
link may require more work to unveil.
Analyses of the stationary Rossby wave number have been
useful for assessing how the mean state winds affect Rossby
Figure 5. For individual CMIP6 model mean states, the difference wave propagation (e.g., Henderson et al., 2017; Karoly,
in the Rossby wave source (S 0 ) versus the difference in the telecon- 1983; Tseng et al., 2020b; Wang et al., 2020; Zheng and
nection amplitude between simulations with historical and future Chang, 2020). The stationary Rossby wave number on a Mer-
mean state winds for (a) the North Pacific and (b) North America. cator projection (to account for spherical geometry) for a
The horizontal axis is the ensemble mean and time mean difference zonal flow is defined as
of the absolute value of S 0 averaged over the subtropical jet (20–
40◦ N, 80–190◦ E). βM 1/2
Ks = a , (3)
uM
where βM is the meridional gradient of absolute vorticity on
flow that explains variations in the teleconnection amplitude a Mercator projection,
(inter-model spread in Fig. 4b and d). We begin by look-
ing for a link between the change in the extratropical zonal 2cos2 θ
∂ 1 ∂ 2
wind at 200 hPa and the teleconnection amplitude response βM = − (u M cos θ ) , (4)
a ∂y cos2 θ ∂y
to changes to the winds. Figure 6a and c show the corre-
lation coefficient between the local change in the 200 hPa and uM = u/ cos θ is the temporal mean, full (including sym-
zonal wind (the difference in the January mean zonal wind metric and asymmetric components) zonal wind divided by
https://doi.org/10.5194/wcd-2-653-2021 Weather Clim. Dynam., 2, 653–673, 2021662 A. M. Jenney et al.: Drivers of uncertainty in future projections of MJO teleconnections Figure 6. Correlation coefficient between the local change in the 200 hPa zonal wind and the regional mean change in the teleconnection amplitude over (a) the North Pacific and (c) North America. Correlation coefficient between the local change in the stationary Rossby wave number, Ks , and the regional mean change in the teleconnection amplitude over (b) the North Pacific and (d) North America. Grey boxes outline the North Pacific and North America regions. the cosine of latitude (θ). In Eqs. (3) and (4), a is the earth’s mean teleconnection amplitude change for the North Pacific radius and is the earth’s rotation rate. Hoskins and Am- and North America, respectively (for reference, we include brizzi (1993) showed that Ks can be used to understand the difference in Ks between the historical and future period Rossby wave propagation: waves turn towards regions of for each model in Appendix A). We include boxes outlining higher Ks , are generally reflected away from regions where the North Pacific and North America regions for reference. In the zonal Rossby wavelength is equal to Ks or where βM ≤ 0, the calculation of the correlation, we use averages of the local and are either dissipated beyond or reflected from regions Ks change over 10◦ × 10◦ boxes to focus on the larger fea- where u ≤ 0. Regions of Ks maxima, which tend to occur tures; although using boxes of different sizes (we tried boxes in strong westerly jets, act as Rossby waveguides. Multiple ranging in size from 3–20◦ ) does not qualitatively change previous studies have used the stationary Rossby wave num- the results. Regions of stronger positive correlation would ber in this form (i.e., neglecting meridional wind) when ex- be suggestive of a systematic (common across models) pos- ploring the impact of the mean state winds on MJO telecon- itive relationship between the local change in Ks and the re- nections (Henderson et al., 2017; Tseng et al., 2020b; Wang gional (i.e., across North Pacific or North America) telecon- et al., 2020; Zheng and Chang, 2020). nection amplitude response to the changes in the winds pro- We now inspect if localized changes to Ks at 200 hPa in jected by CMIP6. Similarly, regions of strong negative cor- the CMIP6 model January mean states can systematically relation would suggest a systematic inverse relationship be- explain the spread in Fig. 4b and d. An increase in the lo- tween the local change in Ks and the regional teleconnection cal Ks indicates that Rossby waves with shorter wavelengths change. Figure 6b and d show that correlations are mostly are able to propagate further before turning. Similarly, a de- weak (p values > 0.2 everywhere). We thus do not identify a crease in the local Ks means that propagating Rossby waves clear systematic and localized mechanism that may explain will turn sooner. A change to the meridional width of the how mean state wind changes lead to changes to teleconnec- waveguide, which presents as an increase or decrease in Ks tivity over the North Pacific or North America across CMIP6 along the north and/or south flanks of the waveguide, affects models. More work is needed to understand how changes the trajectory of Rossby waves traveling within the waveg- to the mean flow will impact future MJO teleconnections, uide, with Rossby waves able to travel further meridionally which our results indicate are likely a large source of inter- and turn less often in a broader waveguide (Hoskins and Am- model spread in future projections of MJO teleconnections. brizzi, 1993). Thus, the path that Rossby waves take as they For example, consideration of the meridional wind as in Li exit the jet is sensitive to both the width of the waveguide and et al. (2015), which is omitted in the form of the stationary the value of Ks . Figure 6b and d show the correlation coef- Rossby wave number that we use here, may reveal mecha- ficient between the changes in the local Ks and the regional Weather Clim. Dynam., 2, 653–673, 2021 https://doi.org/10.5194/wcd-2-653-2021
A. M. Jenney et al.: Drivers of uncertainty in future projections of MJO teleconnections                                      663

nisms due to changes to the meridional rather than the zonal      For increases in the eastward propagation extent, this is likely
wind. We leave this for future work.                              related to an eastward broadening of the region over which
                                                                  the MJO excites Rossby waves. Adames and Wallace (2014)
3.2   MJO intensity and propagation characteristics               found that for the mean state winds of the period from 1979–
                                                                  2011, the MJO excites the strongest extratropical response
We now investigate how changes to MJO intensity and prop-         when heating maxima are located over the central Pacific.
agation characteristics affect the MJO teleconnection by con-     While we separately tested the sensitivity of the extratrop-
ducting simulations in which the mean state is held constant,     ical response to increases in the MJO’s propagation speed
and either the propagation speed, eastward propagation ex-        and decreases in the zonal wavenumber, these two changes
tent, zonal wavenumber, or intensity of the idealized thermal     to the MJO are linked and will likely occur together (Rush-
forcing are perturbed to upper and lower bounds of expected       ley et al., 2019). These two changes to the MJO have oppo-
end-of-century changes to the MJO. Instead of using mean          site impacts on MJO teleconnection amplitude, with the net
states from all CMIP6 models, we use a subset of mean states      impact appearing to be a slight strengthening from the larger
from 10 models to minimize utilization of computational re-       strengthening effect from the decreased zonal wavenumber.
sources. For these experiments, we chose CMIP6 models that           For perturbations to the MJO’s propagation characteris-
produced a minimum number of unstable ensemble members            tics, Fig. 7 highlights the sensitivity of the MJO telecon-
in experiments used in Sect. 3.1 (see Fig. A2).                   nection change to the mean climate of each CMIP6 model.
   Figure 7 summarizes the results of these simulations. As in    That is, for a given perturbation to the MJO’s propagation
Fig. 4, the horizontal axis shows the regional mean difference    speed, zonal wavenumber, or eastward extent, inter-model
in the teleconnection amplitude while the vertical axis shows     differences in the mean climate lead to variations in the tele-
the fractional area of the region that has stronger teleconnec-   connection change. Thus, not only are changes in the mean
tions (perturbed MJO compared to control MJO). Figure 7a          climate important for understanding how the extratropical
and e show the change to the teleconnection amplitude over        MJO teleconnection will evolve for an unchanging MJO,
the North Pacific and North America, respectively, which re-      but also for understanding how MJO teleconnections will
sults from perturbations to the magnitude of the propagating      evolve in response to changes to the MJO. Additionally, for
thermal forcing. The linearity of the LBM ensures that, in        each individual MJO propagation or intensity characteristic,
the absence of instability, the magnitude of the simulated re-    the spread in the MJO teleconnection change resulting from
sponse varies linearly with the magnitude of the forcing. We      a perturbed MJO is on the order of the inter-model uncer-
verified this with simulations using a 20 % increase in the       tainty that results from perturbations to the mean state alone
magnitude of the forcing for two different model mean states.     (Fig. 4). These results challenge the notion that it may be
For the remainder of the eight models used in these experi-       possible to currently have confidence in future projections of
ments, we thus did not run simulations (see Table 1), because     MJO teleconnections.
the magnitude of the extratropical response to the perturbed
forcing amplitude is independent of the mean state. If non-       3.3   Sum of mean state and MJO
linear interactions had been considered, variations across the
different model climates could have also been important in        Putting it together, we finish by quantifying the overall
the response of the teleconnection to changes in heating in-      change in the MJO teleconnection that results when consid-
tensity.                                                          ering the linear sum of individual changes to the mean state
   Unlike perturbations to the heating intensity, the responses   and MJO features. For each CMIP6 model, Fig. 8 shows how
of the MJO teleconnection to perturbations to the eastward        the change to the full mean state influences the change in the
propagation speed (Fig. 7b and f), extent (Fig. 7c and g),        MJO teleconnection to the North Pacific and North Amer-
and zonal wavenumber (Fig. 7d and h) are sensitive to the         ica, as well as the range of teleconnection changes that re-
mean climate of each CMIP6 model. Consistent with pre-            sults from the sum of changes to the mean state and MJO
vious work finding decreased MJO teleconnection strength          propagation and intensity characteristics for the 10 CMIP6
with increased MJO propagation speed (Zheng and Chang,            mean states for which we also ran perturbed thermal forcing
2019; Wang et al., 2020; Bladé and Hartmann, 1995), we            simulations. Over the North Pacific, for all CMIP6 models,
find that increases to the propagation speed of our idealized     changes to the mean state alone lead to a weaker teleconnec-
heating produce modest decreases in the teleconnection am-        tion for almost all models, with only two models (AWI-CM-
plitude over the North Pacific and North America. Increas-        1-1-MR and EC-EARTH3-VEG) showing a small strength-
ing the eastward extent and decreasing the zonal wavenum-         ening. Factoring in changes to the MJO leads to a range
ber (i.e., increasing the zonal scale) of the propagating MJO     of potential changes for many models that straddles zero.
thermal forcing in the LBM simulations increases the tele-        These results suggest that over the North Pacific, mean state
connection amplitude for all model climates used and has the      changes may lead to weaker MJO teleconnections. However,
potential to produce the largest increases in the MJO telecon-    a strengthening of the MJO teleconnection over the North
nection amplitude – more so over the North America region.        Pacific, due to changes to the MJO (from potential increases

https://doi.org/10.5194/wcd-2-653-2021                                              Weather Clim. Dynam., 2, 653–673, 2021
664 A. M. Jenney et al.: Drivers of uncertainty in future projections of MJO teleconnections
Figure 7. For individual CMIP6 model mean states, the change in the teleconnection amplitude (as a percent change per multi-model mean
kelvin warming) to the North Pacific (25–70◦ N, 150–235◦ E) and North America (25–70◦ N, 235–290◦ E) between LBM simulations with
the control and perturbed thermal forcing. (a, e) Response to perturbed heating intensity, (b, f) eastward propagation speed, (c, g) eastward
propagation extent, and (d, h) zonal wavenumber. Unfilled (filled) markers represent the lower (upper) bounds of perturbations to each MJO
feature expected at the end of the century given a high-emissions scenario (see Table 1).
in eastward propagation extent or heating intensity and de-
creases in zonal wavenumber), can not be ruled out.
Over North America, there is no agreement on how
changes in the mean state alone will impact MJO telecon-
nections: while the median change is near zero, the range
of MJO teleconnection changes due to mean state changes
spans from −11 % K−1 to 15 % K−1 . When changes to the
teleconnection due to changes to the MJO are also consid-
ered, the final picture shows increased potential for strength-
ening, again due to the potential for an increase in the MJO’s
heating intensity and eastward propagation extent, as well as
decrease in its zonal wavenumber (Fig. 7).
4 Conclusions
The Madden–Julian Oscillation (MJO) is a key source of
predictability of extratropical weather on subseasonal-to-
seasonal timescales. While it is expected that the MJO tele-
connection to the extratropics will change in a future warmer
climate, models do not agree over much of North America
(Zhou et al., 2020). Speculatively, this may be due in part to
mean state biases or due to inter-model spread or biases in
the simulation of the MJO, both of which have been shown
to lead to biases in the simulated MJO teleconnection of the
current climate (Henderson et al., 2017; Wang et al., 2020).
The MJO teleconnection is sensitive to a number of fac-
tors, including the large-scale wind and thermal structure
Figure 8. The total change to the MJO teleconnection over (a) the
of the atmosphere and MJO propagation and intensity char- North Pacific and (b) North America due to the change in the full
acteristics. While a number of climate models simulate the mean state (markers), and the potential range that results from con-
MJO and its teleconnections, each model represents a unique sidering changes to MJO propagation and intensity characteristics
combination of multiple changes to the various features of (horizontal lines extending from each marker) for the 10 models for
the climate that impact MJO teleconnections. This makes which we ran perturbed MJO experiments.
the determination of causal mechanisms important for the
change to the MJO teleconnection a challenge. Additionally,
Weather Clim. Dynam., 2, 653–673, 2021 https://doi.org/10.5194/wcd-2-653-2021You can also read