Environmental DNA reveals the fine grained and hierarchical spatial structure of kelp forest fish communities

Page created by Kenneth Morris
 
CONTINUE READING
Environmental DNA reveals the fine grained and hierarchical spatial structure of kelp forest fish communities
www.nature.com/scientificreports

                OPEN              Environmental DNA reveals
                                  the fine‑grained and hierarchical
                                  spatial structure of kelp forest fish
                                  communities
                                  Thomas Lamy 1,2*, Kathleen J. Pitz               3
                                                                                       , Francisco P. Chavez3, Christie E. Yorke1 &
                                  Robert J. Miller1
                                  Biodiversity is changing at an accelerating rate at both local and regional scales. Beta diversity,
                                  which quantifies species turnover between these two scales, is emerging as a key driver of ecosystem
                                  function that can inform spatial conservation. Yet measuring biodiversity remains a major challenge,
                                  especially in aquatic ecosystems. Decoding environmental DNA (eDNA) left behind by organisms
                                  offers the possibility of detecting species sans direct observation, a Rosetta Stone for biodiversity.
                                  While eDNA has proven useful to illuminate diversity in aquatic ecosystems, its utility for measuring
                                  beta diversity over spatial scales small enough to be relevant to conservation purposes is poorly
                                  known. Here we tested how eDNA performs relative to underwater visual census (UVC) to evaluate
                                  beta diversity of marine communities. We paired UVC with 12S eDNA metabarcoding and used a
                                  spatially structured hierarchical sampling design to assess key spatial metrics of fish communities
                                  on temperate rocky reefs in southern California. eDNA provided a more-detailed picture of the main
                                  sources of spatial variation in both taxonomic richness and community turnover, which primarily
                                  arose due to strong species filtering within and among rocky reefs. As expected, eDNA detected more
                                  taxa at the regional scale (69 vs. 38) which accumulated quickly with space and plateaued at only ~ 11
                                  samples. Conversely, the discovery rate of new taxa was slower with no sign of saturation for UVC.
                                  Based on historical records in the region (2000–2018) we found that 6.9 times more UVC samples
                                  would be required to detect 50 taxa compared to eDNA. Our results show that eDNA metabarcoding
                                  can outperform diver counts to capture the spatial patterns in biodiversity at fine scales with less
                                  field effort and more power than traditional methods, supporting the notion that eDNA is a critical
                                  scientific tool for detecting biodiversity changes in aquatic ecosystems.

                                  Two centuries ago the influential naturalist Comte de Buffon noted that “the entire face of the earth bears the
                                  imprint of human power”. Today these changes have only accelerated, as humans are driving worldwide deteriora-
                                  tion of nature and declines in b  ­ iodiversity1, risking the collapse of ecosystems and loss of the natural goods and
                                                                2,3
                                  services society depends ­on . Underlying these declines are complex patterns of changing species composition
                                  as habitat loss and climate change interact to drive species range shifts and e­ xtinctions4,5. To assess how changes
                                  in biodiversity scale from local (α) to regional (γ) scales, and thus inform conservation efforts, ecologists have
                                  used measures of beta (β) d ­ iversity6–8, a spatial component of biodiversity which refl cts the interplay between
                                  fundamental processes controlling the relative abundances of species across landscapes, such as dispersal, habitat
                                  preferences and ecological d ­ rift9.
                                      Evidence is growing that the multiscale nature of biodiversity, particularly β diversity, has a crucial role in
                                  maintaining ecosystem functions, although most research to date has focused mostly on α ­diversity8,10. Biotic
                                  homogenization, in particular, arises through species introductions, extinctions, and human transformation of
                                  landscapes, a mixture of processes termed the “anthropogenic blender” by O         ­ lden11. Measured as declines in β
                                  diversity, biotic homogenization can negatively affect ecosystem function as strongly or more so than α ­diversity12.
                                  Furthermore, β diversity d­ eclines13 can be accompanied by increasing α diversity due to species i­ ntroductions14,
                                  obscuring overall negative impact on ecosystem ­multifunctionality8,11. Because different species assemblages

                                  1
                                   Marine Science Institute, University of California, Santa Barbara, CA 93106, USA. 2MARBEC, University of
                                  Montpellier, CNRS, Ifremer, IRD, Sète, France. 3Monterey Bay Aquarium Research Institute, Moss Landing,
                                  CA 95039, USA. *email: thomas.lamy27@gmail.com

Scientific Reports |   (2021) 11:14439                | https://doi.org/10.1038/s41598-021-93859-5                                                    1

                                                                                                                                                 Vol.:(0123456789)
www.nature.com/scientificreports/

                                              are required to perform the diverse set of ecosystem functions that defi e natural heterogeneous landscapes,
                                              sustaining them requires high β d   ­ iversity15.
                                                   Despite its importance, accurately assessing biodiversity remains one of the greatest challenges ecologists
                                             ­face16. Th s is especially true in aquatic ecosystems that host a vast reservoir of species but are challenging to
                                               observe. Fishes are the most prevalent vertebrates in aquatic ecosystems, but are difficult to survey using tradi-
                                               tional methods due to their often sparse density, cryptic nature, mobility and elusive ­behavior17,18. Fish support
                                            key ecosystem services, especially in coastal areas where millions of people depend on them for food and income,
                                            but their populations are increasingly vulnerable to overfishing, introduced species, pollution, and habitat ­loss19,20.
                                            Here we explore a novel way of measuring β diversity in marine fish communities using environmental DNA
                                            and compare it to traditional visual long-term surveys.
                                                   Environmental DNA (eDNA) is shed by aquatic organisms via many sources including fecal matter, mucus,
                                            or skin, forming a suspended biodiversity database. Sampling eDNA and sequencing it using high-throughput
                                            methods can reveal the presence of a wide spectrum of species without direct observations or sampling of whole
                                            ­organisms21–24. In aquatic ecosystems, eDNA metabarcoding of water samples may detect more species and avoid
                                               some sources of bias inherent to traditional s­ urveys25–29.
                                                   While eDNA has been successfully used to capture regional diversity in a variety of ­systems25–29, recent studies
                                            have revealed that eDNA can also be used to describe spatial patterns of biodiversity and species composition
                                            at relatively fi e scales (< 1 km) across natural marine l­ andscapes27,29–33. These results suggest that eDNA could
                                               be of great utility for measuring β diversity over spatial scales small enough to be relevant to ecosystem function
                                               and conservation.
                                                   Here we used information from eDNA metabarcoding of the hypervariable region of the 12S mitochondrial
                                               rRNA to capture β diversity of fish communities on temperate rocky reefs hosting underwater forests of the giant
                                               kelp Macrocystis pyrifera, a foundation species that creates complex structure, is highly productive, and harbors
                                               a diverse community of reef o ­ rganisms34,35. Kelp forest fish communities are highly dynamic and influenced by a
                                               range of environmental factors at multiple spatial ­scales36, as well as by fishing and ocean ­warming37,38. Traditional
                                               surveys of these communities rely on divers counting fish in defi ed areas, and are inherently biased towards
                                            conspicuous and bold species and limited by underwater logistics and visibility. We coupled a detailed survey of
                                            bony (Actinopteri) and cartilaginous (Chondrichthyes) fishes based on both standard diver-executed Underwater
                                            Visual Censuses (UVC) and eDNA metabarcoding in a spatially structured hierarchical sampling design of 27
                                            transects distributed across 11 rocky reef sites to investigate β diversity of fish communities in the Santa Barbara
                                            Channel in Southern California (Fig. 1). We assessed the main sources of β diversity by (i) directly partitioning
                                            regional γ diversity and (ii) investigating spatial variation in multivariate community structure across spatial
                                              ­scales6. Our results demonstrate that eDNA can be used to measure and capture the main source of β diversity of
                                            marine fish communities with broader taxonomic resolution and much less fi ld effort than traditional methods,
                                            portending an important role for eDNA in biodiversity monitoring in the twenty-first century.

                                            Results
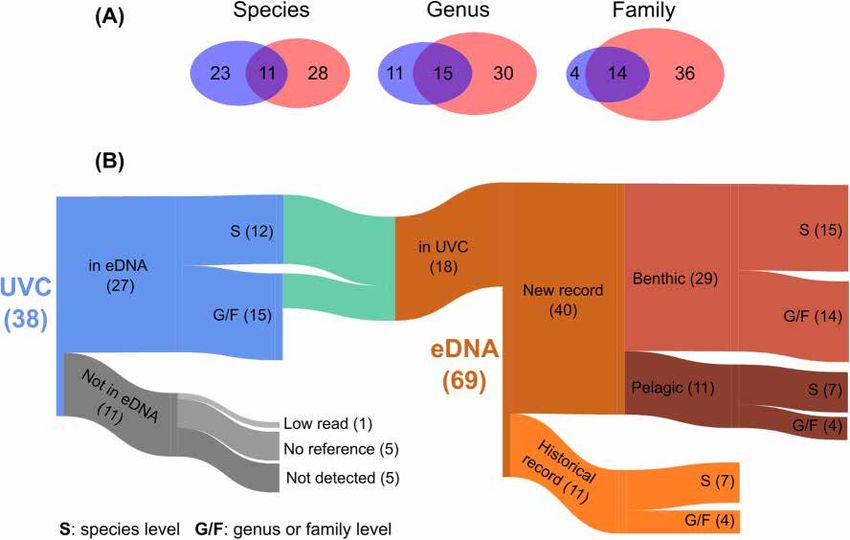
                                            Overall, eDNA metabarcoding identifi d nearly double the taxa recorded from diver visual surveys (γeDNA = 69
                                            and γUVC = 38). We visually detected 38 unique fish taxa at the regional scale, including 34 species, two genera
                                            and two families (Supplementary Table SM1). Using eDNA metabarcoding, we characterized 69 unique taxa at
                                            the regional scale corresponding to 41 species, 8 genera and 20 families (Supplementary Tables SM1 and SM2).
                                            At the species level we detected a similar number of taxa with both methods, with 11 species detected by both
                                            methods (Fig. 2). Yet when compared at the genus and family levels, eDNA metabarcoding identifi d many more
                                            unique taxa: 50 unique fish families were detected by eDNA while only 18 were evident in the visual surveys, of
                                            which 14 families were jointly detected by both methods (Fig. 2). Six eDNA-detected families not present in the
                                            visual survey have been previously recorded in the region from 2000 to 2018 (N = 748 transects).
                                                To further compare visual surveys (UVC) and eDNA metabarcoding, we collapsed UVC taxa into genera
                                            and families to match the taxonomic resolution of eDNA metabarcoding (Supplementary Table SM1; Fig. 2).
                                            For example, we visually detected nine species of the diverse genus Sebastes (rockfishes), which could not be
                                            distinguished at the species level by our 12S rRNA sequence. However, when lumped at the genus level both
                                            methods detected rockfishes in similarly high numbers across samples. Th s resulted in a fi al 18 taxa jointly
                                            detected by both methods, for which the number of eDNA sequence reads was positively related to the observed
                                            biomass (R2 = 0.225, P = 0.047; Supplementary Fig. SM1). Both methods detected some of the most characteristic
                                            giant kelp forest species in great numbers (i.e., reads or biomass), including señorita (Oxyjulis californica), black
                                            surfperch (Embiotoca jacksoni), sheephead (Semicossyphus pulcher), blacksmith (Chromis punctipinnis), pile perch
                                            (Rhacochilus vacca), halfmoon (Medialuna californiensis) and garibaldi (Hypsypops rubicundus) (Fig. 2 and Sup-
                                            plementary Fig. SM1, Supplementary Table SM1). Eleven taxa that were not detected using eDNA included one
                                            that was discarded due to a small number of reads (Porichthys notatus), five taxa that had no sequence available
                                            in the reference database (Phanerodon furcatus, Anisotremus davidsonii, Alloclinus holder, Rhacochilus toxotes and
                                            Bothidae), and five taxa that eDNA failed to detect despite being visually detected and represented in the library
                                            (Supplementary Table SM1). These taxa contributed little to the biomass observed on each reef (Supplementary
                                            Figs. SM2 and 3, Supplementary Table SM1), with the exception of the kelp bass (Paralabrax clathratus), a large
                                            and common fish across samples.
                                                51 taxa were detected only by eDNA (Fig. 2 and Supplementary Fig. SM4, Supplementary Table SM2), com-
                                            prising 29 species, 5 genera and 17 families. 11 were previously detected in the region from 2000 to 2018,
                                            including giant kelpfish (Heterostichus spp.), lingcod (Ophiodon elongatus), and four elasmobranchs (leopard
                                            shark Triakis semifasciata, horn shark Heterodontus francisci, bat ray Myliobatis californica and Scyliorhinidae).
                                            eDNA also identifi d many pelagic species typically not recorded by visual surveys in the region, such as Japanese

          Scientific Reports |   (2021) 11:14439 |                https://doi.org/10.1038/s41598-021-93859-5                                                         2

Vol:.(1234567890)
www.nature.com/scientificreports/

                                  Figure 1.  Hierarchical distribution of sampling within the Santa Barbara Channel (SBC), California. (A)
                                  Location of the study area along the California coastline. (B) Distribution of the 11 rocky reef sites within the
                                  SBC. Fish communities were visually surveyed at two to three transects within each site (N = 27 transects).
                                  Triplicate water samples were collected within one transect and single water samples were collected in the
                                  remaining transects for eDNA metabarcoding (N = 49 bottles). (C) Close up of site 3 where fish communities
                                  were visually surveyed and eDNA sampled at three transects. Triplicate water samples were collected at transect
                                  2 and single water samples were collected at transects 1 and 3.

                                  pilchard (Sardinops melanostictus), anchovies (Engraulis spp.), mackerels (Trachurus spp. and Scomber spp.),
                                  topsmelts (Atherinopsidae) and great white shark (Carcharodon carcharias). Finally, eDNA detected 29 benthic
                                  taxa that were never visually recorded before, including numerous reads of the cryptic benthic family Gobieso-
                                  cidae, and species from adjacent sandy habitat including Sciaenidae, barred surfperch (Amphistichus argenteus)
                                  and the California lizardfish (Synodus lucioceps).
                                      Regional taxonomic richness estimated from eDNA (γeDNA = 69) exceeded its UVC counterpart (γUVC =
                                  38; Fig. 3). However, in both cases, regional taxonomic richness was primarily driven by (i) higher taxonomic
                                  richness in the smallest sampling unit, either individual water samples for eDNA ( αBOT = 21.59, P < 0.001) or
                                  individual transects for UVC ( αTR = 6, P < 0.001; Fig. 3) and (ii) high spatial variation among sites ( βSITE =
                                  33.82, P < 0.001 for eDNA and βSITE = 28, P = 0.135 for UVC; Fig. 3B). Importantly, variation among triplicate
                                  bottles within transects was smaller than expected (βBottle = 4.11, P < 0.001; Fig. 3B) and contributed little to
                                  eDNA regional taxonomic richness. The spatial variation among transects within each site was also smaller than
                                  expected both for eDNA (βTR = 9.48, P = 0.001) and UVC (βTR = 4, P = 0.001). Signifi antly lower values of βBottle
                                  and βTR indicate the similarity of the taxa detected at these two scales, revealing the ability of eDNA to capture
                                  the diversity of each transect. Conversely, signifi antly higher values of eDNA-based αBOT and βSITE indicate
                                  the non-random organization of taxa across sites and demonstrate the ability of eDNA to detect species sorting
                                  across sites, which were not evident based on UVC. Examination of the Taxa-Area Relationships (TAR) (Fig. 3)
                                  also indicates very distinct patterns of taxa accumulation with space. The eDNA TAR initially accumulated
                                  quickly with space (2.76 × S) before plateauing at 11.37 samples (95% CI [10.59–12.14], 0.36 × S after this point).
                                  In contrast, discovery rate of new taxa was exponential for UVC (6.47 × ­S0.53), with no sign of saturation, sug-
                                  gesting that 27 samples were not nearly enough to estimate regional taxonomic richness. To investigate what the
                                  UVC curve might look like beyond 27 samples we randomly selected additional UVC samples from the historical
                                  collection of samples from 2000 to 2018 (Supplementary Fig. SM5). Our result suggests that 6.9 times more UVC
                                  samples would be required to detect 50 taxa compared to eDNA (69 vs. 10 samples).
                                      Investigation of the spatial variation in community structure (compositional beta diversity) based on the
                                  Bray–Curtis dissimilarities among samples revealed very similar patterns. First, hierarchical partitioning of the

Scientific Reports |   (2021) 11:14439 |               https://doi.org/10.1038/s41598-021-93859-5                                                  3

                                                                                                                                              Vol.:(0123456789)
www.nature.com/scientificreports/

                                            Figure 2.  (A) Venn diagrams showing the overlap of unique fish species, genera and families detected by
                                            Underwater Visual Census (UVC: blue) and eDNA metabarcoding (red). (B) Sankey diagram illustrating
                                            the relationships between the 38 fish taxa detected using UVC and the 69 fish taxa detected using eDNA
                                            metabarcoding. Bar width is proportional to the number of taxa. Note that due to discrepancy in taxonomic
                                            resolution, 27 fish taxa that were visually detected were lumped into 18 taxa to match taxa from eDNA
                                            metabarcoding.

                                            variation also showed that the main source of variation occurred among rocky reef sites for both methods (UVC
                                            33.4% and eDNA 60.0%), while variation among both transects (UVC 1.1% and eDNA 0.2%) and triplicate water
                                            bottles (eDNA − 0.2%) were very small. Second, the ecological similarity between pairs of samples is expected
                                            to decrease with increasing geographical d  ­ istance39. This distance-decay relationship fit much more strongly to
                                            eDNA data (Mantel test: r = 0.426, P < 0.001) compared to UVC data (r = 0.149, P = 0.045; Fig. 4). eDNA exhibited
                                            higher power to detect signifi ant spatial structure based on the Mantel test (Fig. 4). For example, eDNA had 94%
                                            more power than UVC to detect a spatial correlation of 0.2 at a significance level of 0.05 (0.86 vs. 0.44; Fig. 4).
                                            Taken from the estimated intercept of a linear fit of the distance-decay relationships, the ecological similarity
                                            between replicate bottles taken from the same transect for eDNA was 0.58 versus 0.25 for UVC data, indicat-
                                            ing higher reproducibility in eDNA sampling versus diver censuses. Slopes of these relationships, furthermore,
                                            are direct measures of rate of change in community structure with space. The slope for eDNA (− 0.0026 ­km−1)
                                            was twice as steep as that for UVC (− 0.0012 ­km−1) showing a higher rate of change in eDNA data with respect
                                            to geographic distance. These results were further illustrated in the NMDS ordination displaying variation in
                                            community structure among samples in two dimensions. The ordination shows the overall similarity between
                                            triplicate bottles that form clusters of samples with each site in contrast to the large compositional variation
                                            among the 11 sites, which mostly form distinct clusters (Fig. 5). For instance, the two Channel Island sites (10
                                            and 11) emerge as compositionally very distinct from the mainland sites (1–9). Th s result agrees with previous
                                            studies showing important differences in the environmental conditions and fish community structure between
                                            mainland and island s­ ites36,40. The NMDS ordination based on UVC data provided a less clear picture of the
                                            spatial structure of the fish communities, with less pronounced differences and greater overlap between sites.
                                            Indicator species analysis based on eDNA revealed that nine taxa were specifi to a given rocky reef site while
                                            the same analysis based on UVC data resolved only two indicator taxa (Table 1).

                                            Discussion
                                            Decoding the information contained in suspended environmental DNA was a more powerful approach to meas-
                                            uring β diversity and capturing the main sources of spatial structure in marine kelp forest fish communities than
                                            standard underwater visual surveys (UVC). Although only 59% of the taxa detected using eDNA metabarcoding
                                            were identifi d at the species level, the overall information recovered provided a comprehensive understanding
                                            of the complex multiscale spatial variation of fish communities across a marine landscape of temperate rocky
                                            reefs. Surprisingly, eDNA data detected spatial variation at finer resolution than UVC, capturing strong spatial
                                            turnover in both taxonomic richness and community structure among rocky reefs in the Santa Barbara Channel.

          Scientific Reports |   (2021) 11:14439 |               https://doi.org/10.1038/s41598-021-93859-5                                                  4

Vol:.(1234567890)
www.nature.com/scientificreports/

                                                                                                                                                                                                                                                                                                           γeD N A
                                                                                                                                                                                                                                                                                                             ●

                                                                                                      60

                                                                                                                                                                                                                                                                                                            βS I T E   (+)

                                                                                      Taxa richness
                                                                                                                                                                                                                                               γU V C
                                                                                                      40
                                                                                                                                                                                                                                                ●
                                                                                                                                                                                                                                                                                                             βT R      (−)

                                                                                                                                                                                                                                               βS I T E (NS)                                                 βB O T    (−)

                                                                                                      20

                                                                                                                                                                                                                                                                                                            αB O T     (+)
                                                                                                                                                                                                                                                βT R        (−)

                                                                                                                                                                                                                                                αT R        (+)
                                                                                                       0
                                                                                                                                                    10                                                        20                                                30                            40                 50
                                                                                                                                                                                                       Number of samples
                                                                                        Figure 3.  Spatial variation in fish taxonomic richness. Taxa Area Relationships for eDNA (red line) and UVC
                                                                                        (blue line) along their 95% confide ce intervals. The dashed black extension of the UVC line estimates how
                                                                                        many more taxa could have been detected using UVC if more transects were sampled based on random draws
                                                                                        from a pool of 748 transect surveys from 2000 to 2018. Bar plots represent the additive partitioning of regional
                                                                                        taxonomic richness among sources of variation for eDNA (γeDNA) and UVC (γUVC ). Signifi ance levels: higher
                                                                                        than expected (+), lower than expected (−) and non-signifi ant (NS) component of variation.

                                                                                     (A) eDNA                                                                                                                      (B) UVC                                                                           (C) Power analysis
                                1.00                                                                                                                                                                                                                                                  1.00
                                       ●
        Ecological similarity

                                       ●
                                       ●                                                                                                                 ●
                                       ●
                                       ●
                                       ●
                                0.75   ●
                                       ●
                                       ●
                                       ●
                                       ●
                                       ●
                                       ●
                                       ●
                                       ●
                                         ●
                                       ● ●
                                       ●
                                       ●
                                               ●
                                                ●

                                                       ●    ●
                                                                    ●          ●●
                                                                                    ● ●●
                                                                                                                                                         ●
                                                                                                                                                                                                                                                  ●
                                                                                                                                                                                                                                                                                      0.75
                                       ●
                                       ●
                                       ●       ●       ●            ●          ●●
                                                                                ● ●                                ●
                                       ●
                                       ●
                                       ●●●      ●                   ● ●       ●●●   ●                              ●                                                                                                                              ●
                                       ●
                                       ●                                      ● ●   ●
                                       ●
                                       ●
                                       ●  ●     ●    ●●             ●
                                                                    ●
                                                                    ●
                                                                    ●        ●      ● ●                            ●
                                                                                                                   ●
                                       ●
                                       ●●      ●●    ●●● ● ●        ●
                                                                    ●            ● ●                               ●
                                                                                                                   ●   ●
                                                                                                                       ●●●                                                                                 ●                           ●
                                        ●●     ●●    ● ●   ●●●   ●●
                                                                 ● ●● ● ●     ●●●
                                                                               ● ● ●●
                                                                                    ●
                                                                                    ●●        ● ●                  ●
                                                                                                                   ●
                                                                                                                   ●    ●●●
                                                                                                                                                                                                       ●
                                       ●
                                       ●       ●●●   ●●    ●     ● ●● ●              ● ●          ●            ●
                                                                                                               ●   ●
                                                                                                                   ●      ●
                                                                                                                          ●●                                 ●
                                       ●●●     ●●
                                                ●●     ●   ●●●
                                                           ●     ● ●●● ●
                                                                        ●    ● ● ● ●●         ●
                                                                                              ●●
                                                                                              ●  ●●            ●
                                                                                                                   ●   ●●
                                                                                                                       ●●●
                                                                                                                        ●
                                                                                                                          ●                                                                           ●
                                                     ●●          ●● ●                ●●            ●               ●      ●
                                                                                                                                                                                                                                                                              Power

                                                       ●   ●        ●                         ●●               ●
                                                                 ●●●● ●●●
                                                                       ●●    ● ●●●    ●● ●    ● ●             ●    ●
                                                                                                                   ●               ●            ●
                                                          ●●     ●
                                                                 ●●●● ● ●        ●
                                                                             ● ● ●● ●         ●
                                                                                              ●●●●●
                                                                                                 ● ●
                                                                                                   ●
                                                                                                                   ●
                                                                                                                   ●
                                                                                                                   ●
                                                                                                                   ●   ●
                                                                                                                       ●●
                                                                                                                        ●
                                                                                                                         ●●
                                                                                                                          ●         ●            ●                                          ●                                          ●
                                                                       ●●●                    ●    ●       ● ●●
                                                                                                           ● ●
                                                                                                                   ●
                                                                                                                   ●
                                                                                                                   ●
                                                                                                                   ●   ●●● ●        ●           ●
                                       ● ● ●●                                   ●      ●●
                                                                                        ●     ● ●●●●           ●   ●
                                                                                                                   ●    ●●   ●     ●                                                             ●
                                       ●● ● ●        ●
                                                     ● ● ●●  ●
                                                             ●                     ●●●        ●
                                                                                              ● ●●●●       ●
                                                                                                           ●●
                                                                                                           ● ●●●   ●
                                                                                                                   ●   ●●
                                                                                                                        ●●●● ●     ●
                                                                                                                                                ●        ●               ●    ●                       ●
                                           ●●
                                0.50   ● ●
                                       ●
                                       ● ●● ●
                                         ●
                                         ●●
                                         ●●
                                           ●
                                           ●
                                           ●
                                           ● ●
                                           ●
                                                       ●
                                                       ●●
                                                        ● ●●
                                                        ●
                                                     ● ●●
                                                        ●●●
                                                            ●●
                                                             ●
                                                             ●
                                                             ●
                                                        ● ●● ●
                                                                 ●
                                                                  ●
                                                                  ●●
                                                                  ●
                                                                  ●
                                                                 ●●
                                                                  ●●
                                                                 ● ●
                                                                    ●● ●
                                                                    ●
                                                                    ●● ●
                                                                    ●
                                                                    ●●
                                                                    ●
                                                                    ●● ●
                                                                    ●
                                                                    ●
                                                                    ●●
                                                                        ●
                                                                                 ●
                                                                                 ●
                                                                                 ●
                                                                                ●●●
                                                                                   ●
                                                                                      ●●●
                                                                                      ●●
                                                                                      ●
                                                                                      ●●
                                                                                   ● ●●
                                                                                   ●
                                                                                        ●
                                                                                        ●
                                                                                              ●
                                                                                              ●
                                                                                              ● ●

                                                                                              ● ●
                                                                                              ●   ●
                                                                                                  ●●
                                                                                                   ●
                                                                                                     ●●

                                                                                                     ●
                                                                                                     ●●
                                                                                                       ●   ●
                                                                                                           ●
                                                                                                           ●
                                                                                                           ● ●
                                                                                                              ●
                                                                                                              ●
                                                                                                              ●
                                                                                                           ●● ●
                                                                                                              ●
                                                                                                               ●
                                                                                                               ●   ●
                                                                                                                   ●
                                                                                                                   ●   ● ●
                                                                                                                       ● ●●
                                                                                                                            ●
                                                                                                                            ●
                                                                                                                             ●
                                                                                                                             ●
                                                                                                                             ●
                                                                                                                             ●
                                                                                                                             ●
                                                                                                                             ●
                                                                                                                                   ●
                                                                                                                                   ●
                                                                                                                                   ●
                                                                                                                                    ●
                                                                                                                                    ●
                                                                                                                                    ●
                                                                                                                                   ●●
                                                                                                                                        ●       ●
                                                                                                                                                ●
                                                                                                                                                ●
                                                                                                                                                 ●
                                                                                                                                                ●●
                                                                                                                                                ●
                                                                                                                                                ●●
                                                                                                                                                ●
                                                                                                                                                         ●
                                                                                                                                                         ●
                                                                                                                                                         ●
                                                                                                                                                                 ●
                                                                                                                                                                 ●
                                                                                                                                                                              ●
                                                                                                                                                                                  ●
                                                                                                                                                                                        ●
                                                                                                                                                                                            ●
                                                                                                                                                                                                          ●
                                                                                                                                                                                                                               ●

                                                                                                                                                                                                                                ●
                                                                                                                                                                                                                                  ●
                                                                                                                                                                                                                                           ●
                                                                                                                                                                                                                                                  ●
                                                                                                                                                                                                                                                      ●
                                                                                                                                                                                                                                                                         ●            0.50
                                           ● ●          ● ●         ●
                                                                    ●●●            ●
                                                                                   ●          ●
                                                                                              ●  ● ●●●●●   ●●
                                                                                                            ●
                                                                                                            ●  ●             ●
                                                                                                                             ●     ●●
                                                                                                                                    ●       ●   ●
                                                                                                                                                ●                                                                          ●●● ● ●●               ●
                                         ●●                         ●●● ●                     ●   ●●●       ●
                                                                                                            ● ●●                   ●●                        ●                                                         ●
                                          ●●                        ●●
                                                                    ● ●          ●●
                                                                                   ●    ●
                                                                                        ●
                                                                                        ●
                                                                                              ●
                                                                                              ●●
                                                                                              ● ●●●
                                                                                                     ●●    ●●
                                                                                                            ●  ●   ●        ●●
                                                                                                                            ●●
                                                                                                                                    ●
                                                                                                                                    ●
                                                                                                                                    ●           ●
                                                                                                                                                ●
                                                                                                                                                ●        ●   ●                               ●                         ●    ●●             ●      ●
                                                     ●    ● ●       ●
                                                                    ●   ●        ● ●
                                                                                  ●●    ●
                                                                                              ●
                                                                                              ●    ●  ●
                                                                                                     ●●●   ●
                                                                                                           ●●● ●
                                                                                                            ●
                                                                                                            ●
                                                                                                               ●             ●
                                                                                                                            ●●
                                                                                                                            ●
                                                                                                                                    ●
                                                                                                                                    ●           ●
                                                                                                                                                ●
                                                                                                                                                         ● ●                                                                ●              ●
                                                                                                                                                                                                                                           ●
                                                                                                                                                                                                                                                      ●
                                                     ●                                        ● ●
                                                     ●     ●
                                                           ●●     ●● ●                  ●
                                                                                              ● ●●●● ●●
                                                                                                     ● ●
                                                                                                       ●
                                                                                                           ●
                                                                                                           ●●
                                                                                                            ● ●
                                                                                                            ●
                                                                                                               ●
                                                                                                               ●   ●        ●●
                                                                                                                             ●
                                                                                                                             ●●●    ●       ●
                                                                                                                                            ●   ●
                                                                                                                                                           ●
                                                                                                                                                         ● ●                                           ●           ●       ●           ●                                 ●
                                           ●         ●           ● ● ●                        ● ●● ● ●●
                                                                                                      ●
                                                                                                      ●
                                                                                                      ●
                                                                                                      ●●
                                                                                                       ●    ● ●
                                                                                                            ●
                                                                                                               ●            ●●
                                                                                                                            ●● ●   ●●           ●        ●           ●
                                                                                                                                                                                         ●● ●
                                                                                                                                                                                             ●
                                                                                                                                                                                                                       ●
                                                                                                                                                                                                                           ●
                                                          ●                       ●●          ● ●● ●● ●
                                                                                                      ●●
                                                                                                       ●
                                                                                                            ●
                                                                                                            ●●
                                                                                                            ●
                                                                                                            ●                ●
                                                                                                                               ●
                                                                                                                               ●    ●
                                                                                                                                    ●       ●
                                                                                                                                            ●                ●                                         ●           ●              ●
                                                                                                                                                                                                                                  ●● ●     ●
                                                                                 ●                 ●●●●                     ●●
                                                                                                                             ● ●                ●        ●                                ● ●● ●                            ●●
                                                            ●    ●
                                                                 ●
                                                                                                   ●
                                                                                                   ●●● ●
                                                                                                       ●   ●●                ● ●
                                                                                                                                            ●
                                                                                                                                            ●                            ●                                             ● ●● ●     ●
                                                                 ●                ●           ● ●●
                                                                                                  ● ●●
                                                                                                       ●
                                                                                                       ●   ●●                  ●
                                                                                                                             ● ●        ●   ●   ●
                                                                                                                                                                         ●        ●          ●●                           ● ●              ●                             ●●
                                                                        ●                             ●
                                                                                                      ●●    ●
                                                                                                            ●                ●                           ●
                                                                                                                                                         ●                                   ●●                                   ● ●      ●
                                                           ●                                         ●●●
                                                                                                       ●    ●●               ●●●
                                                                                                                               ●            ●                        ●
                                                                                                                                                                              ●
                                                                                                                                                                                          ●   ●                           ●●
                                                                      ●                            ●●                                                                                                                     ● ●              ●
                                0.25                   ●
                                                      ●●
                                                       ●   ●
                                                                 ●
                                                                      ●●                          ●●
                                                                                                  ●●●●●
                                                                                                  ●● ●●
                                                                                                       ●
                                                                                                       ●
                                                                                                            ●
                                                                                                            ●                ●
                                                                                                                               ●            ●
                                                                                                                                            ●
                                                                                                                                                         ●
                                                                                                                                                         ●●
                                                                                                                                                                         ●●
                                                                                                                                                                          ●       ●
                                                                                                                                                                                          ●●●●●
                                                                                                                                                                                       ● ●●  ●
                                                                                                                                                                                                     ●●
                                                                                                                                                                                                                       ●
                                                                                                                                                                                                                       ● ●
                                                                                                                                                                                                                          ●
                                                                                                                                                                                                                           ●
                                                                                                                                                                                                                                  ●
                                                                                                                                                                                                                                  ●
                                                                                                                                                                                                                                      ●
                                                                                                                                                                                                                                      ●
                                                                                                                                                                                                                                                      ●
                                                                                                                                                                                                                                                      ●                  ●
                                                                                                                                                                                                                                                                                      0.25
                                                     ●     ●
                                                                        ●
                                                                                                      ●
                                                                                                      ●
                                                                                                      ●
                                                                                                        ●
                                                                                                                                                         ●
                                                                                                                                                         ●
                                                                                                                                                         ●
                                                                                                                                                                 ●   ●
                                                                                                                                                                              ● ●
                                                                                                                                                                                ●
                                                                                                                                                                                           ●
                                                                                                                                                                                       ●●●● ●
                                                                                                                                                                                             ●
                                                                                                                                                                                        ● ● ●●
                                                                                                                                                                                        ●    ●●
                                                                                                                                                                                                     ●
                                                                                                                                                                                                     ●●

                                                                                                                                                                                                      ●
                                                                                                                                                                                                       ●
                                                                                                                                                                                                                       ●
                                                                                                                                                                                                                       ● ●
                                                                                                                                                                                                                       ● ●
                                                                                                                                                                                                                       ● ●
                                                                                                                                                                                                                       ●
                                                                                                                                                                                                                       ●
                                                                                                                                                                                                                       ●● ●
                                                                                                                                                                                                                           ● ●
                                                                                                                                                                                                                                  ●
                                                                                                                                                                                                                                  ●
                                                                                                                                                                                                                                  ●
                                                                                                                                                                                                                                  ●
                                                                                                                                                                                                                                    ●
                                                                                                                                                                                                                                      ●    ●
                                                                                                                                                                                                                                                  ●
                                                                                                                                                                                                                                                   ●
                                                                                                                                                                                                                                                      ●              ●
                                                                                                                                                                                                                                                                     ●
                                                                                                                                                                                                                                                                     ●
                                                                                                                                                                                                                                                                     ●
                                                                                                                                                                                                                                                                         ●●
                                                                                                                                                                                                                                                                         ●
                                                                                                                                                                                                                                                                         ●
                                                                                                                                                                                                                                                                         ●
                                                                                                                                                                                                                                                                                                                              eDNA
                                                                        ●                                                                                                ●                                     ●
                                                                                                                                                             ●                          ●●                               ●
                                                                                                                                                                                                                       ● ●                       ● ●
                                                                                                                                                             ●           ●
                                                                                                                                                                         ●
                                                                                                                                                                          ●
                                                                                                                                                                                  ●
                                                                                                                                                                                  ●
                                                                                                                                                                                  ●
                                                                                                                                                                                  ●    ●● ●
                                                                                                                                                                                        ●
                                                                                                                                                                                          ●
                                                                                                                                                                                            ●
                                                                                                                                                                                                              ●
                                                                                                                                                                                                               ●
                                                                                                                                                                                                                   ●     ● ●
                                                                                                                                                                                                                         ● ●
                                                                                                                                                                                                                         ● ●●●
                                                                                                                                                                                                                             ●●
                                                                                                                                                                                                                           ● ●
                                                                                                                                                                                                                                  ●
                                                                                                                                                                                                                                  ●
                                                                                                                                                                                                                                  ●
                                                                                                                                                                                                                                  ●
                                                                                                                                                                                                                                           ●     ●
                                                                                                                                                                                                                                                      ●●
                                                                                                                                                                                                                                                      ●
                                                                                                                                                                                                                                                      ●
                                                                                                                                                                                                                                                      ●
                                                                                                                                                                                                                                                      ●
                                                                                                                                                                                                                                                          ●
                                                                                                                                                                                                                                                          ●
                                                                                                                                                                                                                                                        ● ● ●
                                                                                                                                                                                                                                                            ●
                                                                                                                                                                                                                                                                     ●
                                                                                                                                                                                                                                                                         ●
                                                                                                                                                                                                                                                                         ●
                                                                                                                                                                                                                                                                         ●
                                                                                                                                                                                                                                                                         ●
                                                                                                                                                                                                                                                                                                                              UVC
                                                                                                                                                                                                                                                      ●   ●
                                                                                                                                                                                                                                                          ●
                                                                                                                                                                                                                                                          ●
                                                                                                                                                                                                       ●                                         ●
                                                                                                                                                                                                                                                 ●
                                0.00                                                                                                                     ●●●●● ●
                                                                                                                                                               ●     ●
                                                                                                                                                                     ●            ●
                                                                                                                                                                                  ●●     ●●          ●
                                                                                                                                                                                                     ● ●●●
                                                                                                                                                                                                         ●●●●
                                                                                                                                                                                                            ●
                                                                                                                                                                                                            ●●             ● ●●
                                                                                                                                                                                                                                   ●
                                                                                                                                                                                                                                   ●
                                                                                                                                                                                                                                  ●●             ●
                                                                                                                                                                                                                                                 ●● ●
                                                                                                                                                                                                                                                    ● ●     ●
                                                                                                                                                                                                                                                                                      0.00
                                       0                             20                           40                     60         0        20                                                                            40                             60                                 0.0   0.1   0.2     0.3         0.4      0.5
                                                                                                                       Geographic distance (km)                                                                                                                                                          Effect size

                                                                                        Figure 4.  Decay of ecological similarity with geographic distance. Ecological similarity was measured as
                                                                                        (1 − D) with D the Bray–Curtis dissimilarity index between pairs of eDNA samples (A) or UVC samples (B).
                                                                                        Each line represents 95% confide ce intervals. (C) Power curves of distance-decay relationship at a signifi ance
                                                                                        level of 0.05 for eDNA and UVC.

                                                                                             Environmental DNA metabarcoding is emerging as an powerful tool to estimate biodiversity in aquatic
                                                                                        e­ cosystems41, as numerous studies have shown the great potential of this approach to identify a wide variety
                                                                                        of ­fish27,30,32,42. Until recently, doubts remained about the ability of eDNA to detect fi e scale spatial structure
                                                                                        in marine environments that were generally considered highly connected via water ­fl w43. Nevertheless, pio-
                                                                                        neering work in Monterey Bay, California, demonstrated the potential of eDNA to describe spatial patterns of
                                                                                        marine community structure at scales of a few ­kilometers27 and more recent studies have confi med this in other
                                                                                         ­regions29–33. Similarly, our results, from transects a few meters apart within rocky reefs, and rocky reefs ranging
                                                                                        from 2 to 74 km apart, show that eDNA metabarcoding can effectively detect relatively fine-scale spatial struc-
                                                                                          ture in fish communities and provide higher resolution estimates of β diversity than traditional visual surveys.
                                                                                          The Port et al. ­study27 also characterized spatial structure along a cross-shore transect, resolving communities

Scientific Reports |                                     (2021) 11:14439 |                                                                      https://doi.org/10.1038/s41598-021-93859-5                                                                                                                                              5

                                                                                                                                                                                                                                                                                                                                   Vol.:(0123456789)
www.nature.com/scientificreports/

                                    eDNA                                                                                                                                      UVC
                                                                                                                                                                        1.0
                                    (A)                                        S9 S9
                                                                                                                                                      S4
                                                                                                                                                                               (B)                                             S6
                                                                                                                                                                                                                                                   S6

                                                               S9                                                                                                                S5
                                                                      S9                                S4              S11                                                                                                                                  S9
                                                    S5
                              0.3              S9
                                                          S5                                                                                                                                                             S9

                                                               S8 S3           S3                        S4
                                                                                                                                                                        0.5                                                                 S11                                     S9

                                                                                S3S3
                                                               S5                                                        S11
                                                                                     S3
                                                                                                                    S4
                                                           S5                                                S4                         S11
                                                    S6                S8S8
                    NMDS 2

                                                                                                                                                              NMDS 2
                              0.0
                                     S8                                                                                                                                                                                                                 S8
                                                                                                                                  S10                                                                               S7
                                                    S6
                                                                    S6                                                                                                                                                   S1                                   S11
                                          S5                                  S7                                                S10
                                                                 S6                 S1                                                                                  0.0                                                          S7
                                                                                                                                                                                                                                       S5              S4
                                                                         S1                                                                                                                                                                                   S10        S10
                                                                                    S7                                                                                                                                                            S4
                                                                                                                                                                                                         S1                   S1
                                                         S1 S1
                                                                                                                  S11
                             −0.3                                                                                                S10                                                      S2
                                                                                                                                                                                                                                                                               S8
                                                                    S1        S2
                                                                                                                                                S10

                                                                                                                                                                       −0.5                                                          S4
                                                          S2                                                                                                                                             S2
                                                                                              S2
                                                                                                   S7
                                                                               S7                                                                                                                              S5                                                   S3
                                                                                                                                                                                                                                             S3
                             −0.6                                                        S2                                                                                                                                         S3

                                           −0.5                                      0.0                                0.5                   1.0                             −1.5              −1.0          −0.5                  0.0                           0.5
                                                                                                   NMDS 1                                                                                                        NMDS 1

                                                                              Figure 5.  Spatial variation in community structure among samples based on Non-Metric Multidimensional
                                                                              Scaling (NMDS) ordinations for eDNA (A) and UVC (B). Samples are colored by site (light colored hulls)
                                                                              and triplicate water samples (in A) are colored using darker hulls. Transects within sites are represented using
                                                                              different symbols. S1 to S11 indicates site number. Color code is as in Fig. 1. Ordination are based on Bray–
                                                                              Curtis dissimilarities of the square root number of reads (A) and observed biomass (B) of fish taxa. Taxa scores
                                                                              are showed in Supplementary Fig. SM6.

                                                                                   Taxa                                           Common name                          SITE     indcls         P-value
                                                                                   eDNA
                                                                                   Sardinops melanostictus                        Japanese pilchard                    2        0.16815        0.0198
                                                                                   Gobiesocidae                                   Clingfishes                          3        0.28686        0.0198
                                                                                   Heterodontus francisci                         Horn shark                           5        0.6211         0.0198
                                                                                   Triakis semifasciata                           Leopard shark                        7        0.47448        0.0069
                                                                                   Notorynchus cepedianus                         Broadnose sevengill shark            7        0.74169        0.0069
                                                                                   Amphistichus argenteus                         Barred surfperch                     8        0.25408        0.0372
                                                                                   Chromis punctipinnis                           Blacksmith                           10       0.47518        0.0198
                                                                                   Medialuna californiensis                       Halfmoon                             10       0.55373        0.0069
                                                                                   Sphyraenidae                                   Barracuda                            10       0.48503        0.0488
                                                                                   UVC
                                                                                   Hypsypops rubicundus                           Garibaldi                            6        0.764          0.041
                                                                                   Lythrypnus dalli                               Bluebanded goby                      6        1.000          0.019

                                                                              Table 1.  List of signifi ant indicator taxa across the 11 sites. For each taxon we provide its indicator value
                                                                              (indcls), the site in which it is more prevalent and adjusted probability of obtaining as high an indicator value
                                                                              as observed over 1000 iterations.

                                                                              separated by ~ 60 m across habitat types comprising seagrass, kelp forest, sandy bottom, rocky reef and open water
                                                                              in a relatively quiescent protected a­ rea44. In contrast, all our sites were nearshore rocky reefs and kelp forests that
                                                                              were more exposed to water c­ urrents44, a combination that would be expected to limit the spatial differences in
                                                                              eDNA. Instead, our fi dings strongly reinforce the conclusion that eDNA can discriminate communities at fi e
                                                                              spatial scales as fi st established by Port et al.27, even within habitats.
                                                                                  Fish abundance estimated from eDNA data depends on several factors, including eDNA shedding, degrada-
                                                                              tion and d ­ ispersion45–48. The persistence of eDNA can vary among aquatic organisms, but a growing body of
                                                                              evidence suggest that eDNA decay rates are faster in marine compared to freshwater environments and that once
                                                                              shed eDNA may only be detectable for hours to a few ­days46–48. For instance, both Andruszkiewicz et al.47 and
                                                                              Collins et al.46 compiled previous fi dings on eDNA half-lives, showing they were relatively short in temperate
                                                                              marine environments, ranging from 6.9 h for the northern a­ nchovy45 to 63 h for the Maugean s­ kate49. Another
                                                                              study found similar eDNA decay rates in anchovy, sardine, and mackerel, with first-order rate constants on the
                                                                              order of 1­ 0−1 per h
                                                                                                  ­ our45. This corresponds to decay to near or below detection limits within 3–4 days for high
                                                                              equilibrium eDNA concentrations reached after 17–25 h in tank ­experiments45. Based on estimated inshore
                                                                              eDNA half-life and naturally occurring eDNA concentrations, Collins et al.46 concluded that eDNA may be
                                                                              detectable for around 2 days. In our natural scenario, therefore, eDNA persistence might be 2–4 days. Fram

          Scientific Reports |                 (2021) 11:14439 |                                                               https://doi.org/10.1038/s41598-021-93859-5                                                                                                                6

Vol:.(1234567890)
www.nature.com/scientificreports/

                                   et al.50, however, estimated a mean seawater residence time of 1.1 h for a typical kelp forest off Santa Barbara, an
                                  order of magnitude larger than the fish eDNA decay rate measured by Sassoubre et al.45. Th s would suggest that
                                  all fish eDNA would be flushed out of the forest every hour. Our results, however, showed high within-transect
                                   similarity and greater between-transect variability within kelp forest sites, suggesting that seawater residence
                                   time in the forest is longer than Fram et al.50 estimated, or that eDNA generation rates are also very high. Resi-
                                  dence times in a larger kelp forest off San Diego were estimated to be as long as 7 ­days51, and in any case water
                                   flow velocities 1 m above the seafloor, where our samples were collected, are likely much slower than velocities
                                   closer to the surface due to boundary ­effects52. Furthermore, there is likely high within-forest variability in water
                                   residence time due to bottom t­ opography53 and kelp d    ­ ensity54. Landscape-scale maps of water mixing would be
                                   valuable for more detailed interpretation of eDNA data in future studies, although our results suggest that homog-
                                   enization through water mixing is not a barrier to understanding spatial patterns of kelp forest fish communities.
                                       Our results strongly reinforce the efficacy of eDNA for measuring biodiversity, but the ability to estimate
                                   biomass of species would signifi antly enhance eDNA’s utility as a monitoring and management tool. We found
                                   a signifi ant, albeit weak, relationship between the number of sequence reads and the biomass (log scale) of the
                                   18 taxa jointly detected by eDNA and UVC (Supplementary Fig. S1). For instance, the California Sheephead
                                   (Semicossyphus pulcher) displayed both the highest biomass (245 g) and number of reads (290 reads) per transect.
                                   The low explanatory power of variability in this the relationship ­(r2 = 0.22) could be interpreted as indicating large
                                  species-specific differences in eDNA shedding or decay rate. However, the high mobility of fishes and consequent
                                  limitations of a snapshot UVC survey in estimating their biomass also likely contributes. These are encourag-
                                  ing results linking prevalence of eDNA to fish biomass but still great caution is required when linking species
                                  biomass with eDNA ­reads48. Further investigation of sampling and methodological approaches to improve this
                                   relationship would be extremely valuable.
                                       The Santa Barbara Coastal Long Term Ecological Research program (SBC LTER) has a nearly 20-year time
                                   series of fish community data in the Santa Barbara Channel to compare to our snapshot of eDNA metabarcoding
                                   results. Interestingly, eDNA metabarcoding detected taxa never recorded since the time series began in 2000. For
                                   instance, we detected nine reads of great white shark at a single site (9: Carpinteria) where juvenile great white
                                   sharks are known to occur, are often recorded via acoustic tags and visual sightings, and were also detected in
                                   another study using a species-specific eDNA ­assay55, but are highly mobile, making their detection by divers
                                   unlikely. Barred surfperch and California lizardfish, species characteristic of adjacent sandy bottom habitats,
                                   were also not previously recorded by SBC LTER, and some species previously recorded by SBC LTER were only
                                   detected in this sampling event by eDNA metabarcoding, including the less common and highly mobile elasmo-
                                   branchs leopard sharks and bat rays. eDNA was therefore particularly useful to detect species that are otherwise
                                   difficult to see in kelp forest habitats due to elusive behaviors and ability to quickly avoid divers. Our detection of
                                   seven Chondrichthyes is particularly interesting given that MiFish—U primer set is designed to target primarily
                                   bony ­fis es56, while another primer set, Mifish—E was specifically designed for Chondrichthyes. Amplification
                                  through both primer sets could maximize our overall detections.
                                       Surprisingly, we found relatively small overlap in taxa identifi d by both visual and eDNA metabarcoding
                                  surveys, with only 11 species detected by both surveys. Th s disparity is in part due to the inability of our target
                                  amplified region to adequately discriminate between closely related species. For instance, the recent evolution-
                                  ary radiation of rockfishes (genus Sebastes) led to an incredible diversity of 110 commercially and ecologically
                                  important ­species57, only one of which, Sebastes auriculatus, the Brown Rockfish, could be discriminated based
                                   on the universal 12S MiFish primers used in this study. Species complexes characterized by recent evolution-
                                   ary radiations such as rockfishes pose challenges for eDNA discrimination. One way to overcome this could be
                                   to rely on alternative primers specifically developed for these species. For instance, a rockfish-specific primer
                                   set has been developed and successfully discriminated 28 out of 44 commercially harvested s­ pecies58. Further
                                  improvements could be also be made through development and curation of more comprehensive DNA reference
                                  ­libraries59, or using multiple primers to target different groups.
                                       Traditional survey methods require trained divers that count fish within a restricted area, and thus are
                                   expensive and limited in spatial extent. Divers are limited in their ability to see fish by varying water clarity
                                   and habitat heterogeneity. We found that single eDNA water samples captured many more taxa than the visual
                                   surveys, taxa were discovered much more quickly with additional eDNA samples, and eDNA samples at a given
                                   transect had high reproducibility. Th s suggests that eDNA likely samples a larger effective volume of habitat,
                                   integrating biodiversity over small spatial and temporal scales and circumventing difficulties caused by differ-
                                   ences in microhabitat types and fish ­behavior32,42. Our results collectively demonstrate the repeatability and
                                   reliability of eDNA approaches and effici cy as compared to UVC. Although triplicate eDNA water samples
                                   were collected within only an hour of each other, they displayed smaller than expected taxonomic variability
                                   and smaller compositional variability as compared to UVC. In addition, fewer eDNA samples were required to
                                   detect a given number of taxa in the SBC compared to diver surveys. Lastly, eDNA had increased power to detect
                                   spatial correlation in fish communities. On the other hand, eDNA methods have their own limitations that will
                                   become clearer as we better understand the spatio-temporal dynamics of DNA molecules in the ocean. PCR
                                   amplifi ation bias can also be an issue with eDNA and PCR replicates can be used to alleviate it. The fact that 22
                                   species were detected only through UVC in this study reinforces that UVC and eDNA provide complementary
                                   information about biodiversity, and underscores the continued value of traditional visual surveys.
                                       There is growing evidence from freshwater s­ ystems60, and pioneering studies in marine e­ nvironments30 that
                                   eDNA is a promising tool to investigate patterns and change in marine biodiversity. Our results confi m that
                                   eDNA can resolve spatial patterns in marine communities even at relatively fi e scales, and demonstrate its util-
                                   ity for the measurement of β diversity. A previous study using diver survey data showed that β diversity of kelp
                                   forest fish communities in our region mainly arise over broad spatial scales exceeding the extent of the present
                                   study rather than small spatial ­scales36. A similar study using eDNA data could reveal much more fi e-grained

Scientific Reports |   (2021) 11:14439 |                https://doi.org/10.1038/s41598-021-93859-5                                                      7

                                                                                                                                                   Vol.:(0123456789)
www.nature.com/scientificreports/

                                            variability in these communities that was undetected by traditional methods. Th s capability to detect differences
                                            at a finer spatial scale would be a more powerful way to guide spatial management, including Marine Protected
                                            Areas (MPAs), off hore energy development, or aquaculture. Similarly, eDNA could be used to track changes in
                                            fish communities over time, in the face of global climate change and consequently shifting species ­distributions61.
                                            Our results signifi antly bolster the conclusion that eDNA will be an invaluable tool to track spatiotemporal
                                            changes in aquatic ecosystems, including coastal oceans. We expect the effective area an eDNA sample integrates
                                            to be a function of the rates of water fl w, eDNA generation and degradation. Further work is needed to advance
                                            our understanding of the dynamics of eDNA in the natural environment, including modeling of how differences
                                            in water movement and eDNA decay affect within and between-site variability.
                                                For fish communities, our results show that eDNA can provide better spatial resolution of differences in β
                                            diversity than visual surveys, the current standard measurement. These results, combined with the relatively
                                            low field effort required to collect eDNA samples and the simultaneously dropping costs and improving meth-
                                            ods of DNA metabarcoding, reinforce the recommendations of Ausubel et al.62, in particular that biodiversity
                                            scientists and monitoring programs should begin sampling eDNA as soon as possible across a wide range of
                                            aquatic ecosystems.

                                            Methods
                                            Study system. We focused on shallow subtidal rocky reefs from the Santa Barbara Channel located in the
                                            northern portion of the Southern California Bight (Fig. 1). Anchored to rocky substrate, giant kelp (Macrocystis
                                            pyrifera) forms underwater forests that provide habitat for a great variety of ­species35, including many commer-
                                            cially and recreationally important fish species. We focused on nine sites (sites 1–9) spanning an 80 km stretch
                                            of mainland and two sites (sites 10–11) located on the northern coast of the Santa Cruz island that bound the
                                            Santa Barbara Channel (Fig. 1).

                                            Underwater visual surveys. Underwater visual surveys (UVC) of fish communities in the Santa Barbara
                                            Channel have been conducted annually from 2000 to 2018 by the Santa Barbara Coastal Long Term Ecologi-
                                            cal Research program (SBC LTER: http://​sbc.​ltern​et.​edu). Each year, in late July to early August, trained divers
                                            performed UVC to record the abundances and sizes of fish taxa within multiple fi ed 80 ­m2 transects distributed
                                            among the eleven rocky reef sites. Over these 19 years, SBC LTER detected 64 distinct taxa of fishes across 748
                                            transects, including 57 bony fishes and seven elasmobranchs. In 2017, we jointly censused fish taxa and sam-
                                            pled water for DNA metabarcoding at 27 transects distributed across the 11 rocky reef sites (2–3 transects per
                                            site; Fig. 1). Size of fish taxa visually recorded was converted to biomass (g dry mass m­ −2) using species-specific
                                            relationships. Organisms that were difficult to visually identify to species (e.g. Gibbonsia spp.) were lumped
                                            into higher taxonomic categories and treated as a single taxon in our analyses. A complete description of the
                                            sampling methods, geographic and taxonomic coverage and links to the data and metadata are found in ­Reed63.

                                            eDNA sampling, extraction and sequencing. Triplicate water samples were collected within an hour,
                                            simultaneously with UVC, from July 17th to July 25th at each transect survey in 2017 using a 1 L Nalgene poly-
                                            carbonate bottle 1 m above bottom at the center of each transect. Within each site, we randomly selected all three
                                            replicates from one transect and one replicate at the remaining transects for eDNA analysis. In total, we analyzed
                                            49 water samples, allowing us to hierarchically assess variability within transects, among transects within sites,
                                            and among sites.
                                                 For each eDNA sample, 1 L of water was filtered onto a 47 mm diameter, 0.22 µm pore size, polyvinylidene
                                             difluoride (PVDF) membrane filter (Millipore, USA) and stored at − 80 °C prior to extraction. DNA was extracted
                                            using a Qiagen DNeasy Blood and Tissue Kit following the manufacturer’s protocol with some modifi ations. The
                                             complete protocol is published on protocols.io (https://​dx.​doi.​org/​10.​17504/​proto​cols.​io.​n2udg​ew). Metabarcod-
                                            ing of the 12S mitochondrial rRNA gene was completed using a two-step PCR protocol and the MiFish-U primer
                                            ­set56. Samples were analyzed alongside other environmental samples across two sequencing plates as follows. Pri-
                                            mary PCR reactions were carried out using 1 µl DNA extract in triplicate with a no-template control (NTC) run
                                            for each 96-well plate. Primary PCR primers were as follows, listed in 5′ to 3′ direction: Fluidigm CS1 + MiFish-
                                            U-F ACA​CTG​ACG​ACA​TGG​TTC​TACA GTC​GGT​AAA​ACT​CGT​GCC​AGC​and Fluidigm CS2 + MiFish-U-R
                                            TAC​GGT​AGC​AGA​GAC​T TG​GTCT CAT​AGT​GGG​GTA​TCT​AAT​CCC​AGT​TTG​. Pooled PCR products were
                                            then run through an agarose gel to confi m target amplifi ation and lack of off- arget amplifi ation across envi-
                                            ronmental samples and lack of amplifi ation in NTC. PCR products were then purified and size selected using
                                            the Agencourt AMPure XP bead system (Beckman Coulter, USA) and a second agarose gel run to confi m
                                            primer removal and retention of target amplicons. A 20 µl aliquot of each purifi d PCR product was then sent to
                                            Research Technology Support Facility (RTSF) Genomics Core at Michigan State University (MSU) for secondary
                                            PCR amplifi ation and sequencing. Secondary PCR amplifi ation targeted the CS1/CS2 ends of the primary PCR
                                            products and added dual indexed, Illumina compatible adapters with barcodes. Secondary Fluidigm PCR primers
                                            listed in 5′ to 3′ direction were: PE1-BC-CS1 (forward): AAT​GAT​ACG​GCG​ACC​ACC​GAG​ATC​T-[i5-BC(index
                                            2)]-ACA​CTG​ACG​ACA​TGG​T TC​TACA and PE2-BC-CS2 (reverse): CAA​GCA​GAA​GAC​GGC​ATA​CGA​GAT​
                                            -[i7-BC(index 1)]-TAC​GGT​AGC​AGA​GAC​T TG​GTCT. Secondary PCR products were run through an agarose
                                             gel to confi m presence of target amplicons and lack of off- arget amplifi ation in environmental samples and lack
                                             of amplifi ation in NTC. They were then run through Invitrogen SequalPrep Normalization Plate (ThermoFisher
                                            Scientific) using the manufacturer’s protocol to create a pooled library. The pooled product was then loaded on a
                                            standard MiSeq v2 fl w cell and sequenced in a 2 × 250 bp paired end format using a v2 500-cycle MiSeq reagent
                                             cartridge. A 10% PhiX spike was added. Primers complementary to the Fluidigm CS1 & CS2 oligomers were
                                             added to appropriate wells of the reagent cartridge to server as sequencing and index read primers. Base calling

          Scientific Reports |   (2021) 11:14439 |                https://doi.org/10.1038/s41598-021-93859-5                                                       8

Vol:.(1234567890)
www.nature.com/scientificreports/

                                  was done by Illumina Real Time Analysis (RTA) v1.18.54 and output of RTA was demultiplexed and converted
                                  to FastQ format with Illumina Bcl2fastq v2.18.0. We also amplifi d two negative extraction controls and three
                                  PCR controls and sequenced them in parallel with the 49 samples. Also amplified on each sequencing plate was
                                  a set of three PCR no-template controls (NTCs) as well as extraction negative controls which were extracted
                                  alongside the environmental samples on the plate (1 × per plate corresponding to these samples).

                                  Bioinformatics. Illumina MiSeq sequences were processed using a bioinformatic pipeline adapted from
                                  the banzai ­pipeline64 (https://​github.​com/​jimmy​odonn​ell/​banzai/​blob/​master/​banzai.​sh), which links together
                                   bioinformatic programs through a shell script. Reads were merged through ­PEAR65, quality filtered through
                                  ­VSEARCH66, demultiplexed using awk, primers removed through c­ utadapt67, dereplicated, and clustered using
                                   swarm with d = ­168. Taxonomy was assigned through blastn searches to NCBI GenBank’s non-redundant nucleo-
                                  tide database (nt).
                                       Blast results were filtered using MEGAN6’s lowest common ancestor (LCA) ­algorithm69. Only hits with ≥ 85%
                                   sequence identity, ≥ 100 bitscore and whose bitscores were within the top 2% of the highest bitscore value for
                                   each Operational Taxonomic Unit (OTU) were considered by MEGAN6. The MEGAN6 parameter LCA percent
                                   was set to 85, allowing for up to 15% of top hits to be off target and still have the majority taxonomy assigned.
                                   Th s parameter value was chosen to allow for minor numbers of incorrectly annotated GenBank entries—effec-
                                   tively allowing for OTUs which had many high-quality hits to a taxa to still be assigned to that taxa even if there
                                   existed a high-bitscore hit to another GenBank sequence annotated to an unrelated taxa. We decided this was
                                   more advantageous than the disadvantage caused by ignoring small numbers of true closely related sequences.
                                   Furthermore, post-MEGAN6 filtering was performed to ensure only contigs with a hit of ≥ 97% sequence iden-
                                   tity and ≥ 300 bitscore were annotated to the species level. Only contigs with a hit of ≥ 95% sequence identity
                                   and ≥ 200 bitscore were annotated to the genus level. Annotations were elevated to the next highest taxonomic
                                   level for contigs that failed those conditions.
                                       Two studies previously used eDNA to survey rocky reef ­communities27,28. Both studies used a higher percent
                                  identity threshold for all blastn hits and were therefore more stringent in their taxonomic assignments. Port
                                  et al.27 used a threshold of 98% and Andruszkiewicz et al.28 used a threshold of 97% identity. We used a simi-
                                  larly high threshold of 97% identity to assign OTUs to the species level and 95% identity to the genus level, but
                                  allowed family and higher-level annotations to occur with blast hits above an 85% identity threshold. Since these
                                  hits also have MEGAN6’s LCA algorithm applied to them, we can have increased confidence in their accuracy
                                  despite their lower percent identity.
                                       Post-bioinformatic processing, samples contained a total number of reads ranging from a maximum of
                                  22,013 reads to a minimum of 1413 reads across a total of 2386 OTUs. This corresponded to a total of 294,010
                                  Eukaryotic reads, 1493 Bacterial reads, and 35,822 reads that were unassigned. Raw FASTQ files contained an
                                   increased number of bacterial sequences which have a longer amplifi ation fragment (~ 300 bp) but these reads
                                  were largely removed within the bioinformatic pipeline by setting PEAR parameters to limit paired-end read
                                  merging assembly to between 100 and 260 bp in length.
                                       Across our PCR no-template controls (NTCs), we detected a total of 9 families that had greater than 5 reads
                                  within a NTC sample. Th s included 8156 reads of Oncorhynchus kisutch (Coho Salmon), 379 reads of family
                                  Pleuronectidae and 143 reads of Homo sapiens. These OTUs were dropped from our analysis. The remaining
                                  detections had fewer than 50 reads across 6 NTCs and included Engraulidae (22 reads), Paralichthyidae (43 reads),
                                  Sebastidae (30 reads), Clupeidae (13 reads), Bovidae (15 reads), and Suidae (8 reads). Terrestrial taxa (Bovidae
                                  and Suidae) were removed across our analysis but for the remaining taxa we considered this contamination
                                  minor and acceptable in sequenced NTCs. Across two extraction blanks which were sequenced, the vast majority
                                  of reads were to Homo sapiens (18,951 total, due to one sample with 18,944 reads). Remaining contamination
                                  was < 5 reads total per taxa apart from 17 reads of Oncorhynchus kisutch and 15 reads of Paralichthyidae which
                                   we considered minor and acceptable in sequenced extraction blanks.

                                  Defining the regional pool of taxa.          We selected 1360 and 39 OTUs assigned to either bony (Actinopteri)
                                  and cartilaginous (Chondrichthyes) fishes. These two classes exhibited a total of 239,818 and 5472 sequence reads
                                  across all samples respectively. We removed 9 OTUs corresponding to taxa whose geographic distribution did
                                  not overlap with our study area as well as 58 OTUs assigned at a taxonomic level higher than family. We then
                                  merged OTUs at the species levels resulting in 118 and 19 OTUs for Actinopteri and Chondrichthyes respectively,
                                  from which we removed 20 OTUs exhibiting fewer than five reads across all samples. We also decided to hier-
                                  archically merge annotations for OTUs un-assigned at species or genus levels in order to better compare data
                                  types between eDNA and UVC and conservatively estimate the number of unique taxonomies detected through
                                  eDNA. Th s accounted for the potential inflation of unique taxonomic annotations in our sequence data caused
                                  by minor sequence variation within a species or by small errors in the sequencing process. A typical example
                                  would be when two closely related OTUs share a genus level annotation, but while one highly abundant OTU
                                  is assigned to a species, the other less abundant OTU is left unassigned at the species level. Our assumption is
                                  that the unassigned OTU is likely the result of sequence error or minor sequence variation within a species that
                                  makes it a worse match to the reference sequence. Here we are conservatively measuring diversity by merging
                                  these two OTUs and assigning their taxonomy to the most abundant one. Th s reduces our ability to detect a
                                  closely related species not found within our reference database but for the purpose of this study we considered
                                  annotation errors caused by sequence variation from a dominating organism were more detrimental in our
                                  dataset than losing sequence variation caused from detecting a mixture of species absent and present within our
                                  reference database. Th s leads us to conservatively estimate total diversity detected by our sequence data. We
                                  hierarchically merged at both the genus and family levels in the presence of unassigned OTUs. When multiple

Scientific Reports |   (2021) 11:14439 |               https://doi.org/10.1038/s41598-021-93859-5                                                     9

                                                                                                                                                 Vol.:(0123456789)
www.nature.com/scientificreports/

                                            OTUs were assigned to the same genus and one was unassigned at the species level we did as follows: (i) if an
                                            OTU unassigned at the species level was most abundant, we merged and assigned all OTU(s) to the genus-level
                                            (N = 2; both Sebastes genus) or (ii) if one of the species-level OTUs was most abundant, we merged and assigned
                                            the genus-level OTU to that species-level OTU annotation (N = 24). We adopted the same strategy with families
                                            containing OTUs unassigned at the genus level as follows: (i) if the OTU assigned at the family-level was most
                                            abundant, we merged and assigned all OTU(s) to the family-level (N = 4) and (ii) if a genus- (or species-) level
                                            OTU was most abundant, we merged and assigned the family level OTU to that OTU’s taxonomy (N = 18). Th s
                                            procedure allowed us to defi e the regional pool of taxa in a more equivalent way to the visual data, narrowing
                                            down the fi al number of unique taxonomically assigned OTUs to 69. For comparison purpose, we also pro-
                                            duced a table of 1402 OTUs for which we limited OTUs to the phylum Chordata and only removed OTUs from
                                            common contaminants (families Hominidae, Bovidae, Canidae, Suidae), birds (Class Aves), and fish familes not
                                            present in this geographic area (families Centrarchidae, Cichlidae, Terapontidae), but did not follow any other
                                            of the previously mentioned filtering steps. Finally, samples were rarefi d to the lowest read number (N = 829)
                                            using the program ­phyloseq70 in R v3.6.0.

                                            Statistical analysis. We additively ­partitioned71 the regional taxonomic richness estimated with eDNA
                                            (γeDNA) into four hierarchical spatial components as:
                                                                                  γeDNA = αBOT + βBOT + βTR + βSITE .                                         (1)
                                                αBOT corresponds to the mean taxonomic richness within individual bottles. The three β components rep-
                                            resent the mean spatial variability among samples within a given hierarchical level, that is variability among
                                            triplicate bottles within transects (βBOT ), variability among transects within sites (βTR ) and variability among
                                            sites within the Santa Barbara Channel (βSITE ). We similarly partitioned the taxonomic richness estimated with
                                            UVC (γUVC ) into three hierarchical spatial components as:
                                                                                       γUVC = αTR + βTR + βSITE .                                             (2)
                                                αTR corresponds to the mean taxonomic richness within transects. The smallest hierarchical level being differ-
                                            ent for eDNA and UVC (bottle vs. transect), αBOT + βBOT in Eq. (1) equals αTR in Eq. (2). We then evaluated the
                                            significance of each component using randomization of the original sample by taxa matrix. We compared each
                                            component to its expected value calculated 999 times by individual based randomization of the original sample
                                            by taxa matrix. We built Taxa-Area Relationships (TAR) by randomly selecting an initial sample (i.e., a bottle for
                                            eDNA or a transect for UVC), and then increasing the number of samples by one unit by including neighboring
                                            samples. Th s procedure was repeated for all possible combination of initial sample to draw 95% Confide ce
                                            Intervals (CI), from one up to 49 water samples for eDNA or 27 transects for UVC. We then investigated the rela-
                                            tionship between taxa richness and area sampled by fitting different models. We compared linear (y = a + b × S),
                                            exponential (y = a × ­eb×S) or piecewise-linear relationships (two linear models with one breaking p ­ oint72) between
                                            taxonomic richness (y) and area sampled (S). In the case of exponential relationships, the steeper the slope (b)
                                            the higher the spatial turnover in taxonomic richness. Since historical records of fish communities in the Santa
                                            Barbara Channel were available across 748 transects surveyed from 2000 to 2018, we used this information to
                                            estimate the TAR for UVC beyond the 27 focal transects. Additional transects were randomly drawn from the
                                            historical records, and 499 bootstraps were performed to estimate 95% CI.
                                                We computed the Bray–Curtis dissimilarity between pairs of samples to evaluate spatial variation in com-
                                            munity structure. We used variation partitioning to hierarchically partition the total variation in community
                                            structure among samples into the following spatial components: variation among sites, among transects and
                                            among triplicates water samples for ­eDNA73. Geographic distances among samples ranged from 0 (triplicate
                                            samples) to 74 km for eDNA or to 14 m to 74 km for UVC. We examined the relationship between ecological
                                            similarity, measured as (1 − D) with D the Bray–Curtis dissimilarity index, and geographic distance between
                                            pairs of samples and tested the significance of these relationships based on Mantel’s tests. We also performed
                                            a power analysis of Mantel’s test at a signifi ance level of 0.05 to draw power curves for eDNA and UVC for
                                            effect sizes ranging from 0 to 0.574. We then performed Non-Metric Multidimensional Scaling (NMDS) based
                                            on the Bray–Curtis dissimilarities to visualize compositional differences among samples. Finally, we conducted
                                            indicator species analysis following Dufrene and L    ­ egendre75 to identify taxa associated with specific rocky reef
                                            sites. All Bray–Curtis dissimilarities were based on the square root number of reads for eDNA and observed
                                            biomass for UVC of fish taxa. All analyses were performed using R version 3.6.076. Additive diversity partition-
                                            ing was performed using the adipart function of the vegan p      ­ ackage77 and randomizations of the original data
                                            were carried out using the oecosimu function from vegan. Piecewise-linear relationships were build using the
                                            R package segmented72. Power analysis of Mantel’s test was performed using the function mantelPower from R
                                            package biotools74.

                                            Data availability
                                            Environmental DNA data has been archived in the Sequence Read Archive (SRA) database (https://​www.​ncbi.​
                                            nlm.​nih.​gov/​sra) under the accession number PRJNA667508.

                                            Received: 13 November 2020; Accepted: 8 June 2021

          Scientific Reports |   (2021) 11:14439 |               https://doi.org/10.1038/s41598-021-93859-5                                                    10

Vol:.(1234567890)
www.nature.com/scientificreports/

                                  References
                                   1. IPBES. Global Assessment Report on Biodiversity and Ecosystem Services of the Intergovernmental Science—Policy Platform on
                                      Biodiversity and Ecosystem Services (eds Brondizio, E. S. et al.) (IPBES Secretariat, 2019).
                                   2. Millennium Ecosystem Assessment. Ecosystems and Human Well-Being: Biodiversity Synthesis ed Ma (World Resources Institute,
                                      2005). http://​www.​loc.​gov/​catdir/​toc/​ecip0​512/​20050​13229.​html. Accessed June 2019.
                                   3. Hooper, D. U. et al. A global synthesis reveals biodiversity loss as a major driver of ecosystem change. Nature 486(7401), 105 (2012).
                                   4. Vellend, M. et al. Homogenization of forest plant communities and weakening of species–environment relationships via agricultural
                                      land use. J. Ecol. 95(3), 565–573. https://​doi.​org/​10.​1111/j.​1365-​2745.​2007.​01233.x (2007).
                                   5. Karp, D. S. et al. Intensive agriculture erodes β-diversity at large scales. Ecol. Lett. 15(9), 963–970. https://​doi.​org/​10.​1111/j.​1461-​
                                      0248.​2012.​01815.x (2012).
                                   6. Anderson, M. J. et al. Navigating the multiple meanings of β diversity: A roadmap for the practicing ecologist. Ecol. Lett. 14(1),
                                      19–28. https://​doi.​org/​10.​1111/j.​1461-​0248.​2010.​01552.x (2011).
                                   7. Socolar, J. B., Gilroy, J. J., Kunin, W. E. & Edwards, D. P. How should beta-diversity inform biodiversity conservation?. Trends Ecol.
                                      Evol. 31(1), 67–80. https://​doi.​org/​10.​1016/j.​tree.​2015.​11.​005 (2016).
                                   8. Mori, A. S., Isbell, F. & Seidl, R. β-Diversity, community assembly, and ecosystem functioning. Trends Ecol. Evol. 33(7), 549–564
                                      (2018).
                                   9. Vellend, M. Conceptual synthesis in community ecology. Q. Rev. Biol. 85(2), 183–206 (2010).
                                  10. Wang, S., Lamy, T., Hallett, L. M. & Loreau, M. Stability and synchrony across ecological hierarchies in heterogeneous metacom-
                                      munities: Linking theory to data. Ecography (Cop) 42(6), 1200–1211. https://​doi.​org/​10.​1111/​ecog.​04290 (2019).
                                  11. Olden, J. D. Biotic homogenization: A new research agenda for conservation biogeography. J. Biogeogr. 33(12), 2027–2039. https://​
                                      doi.​org/​10.​1111/j.​1365-​2699.​2006.​01572.x (2006).
                                  12. Loreau, M., Mouquet, N. & Gonzalez, A. Biodiversity as spatial insurance in heterogeneous landscapes. Proc. Natl. Acad. Sci.
                                      100(22), 12765–12770 (2003).
                                  13. Harrison, S. Species Diversity, Spatial Scale, and Global Change (Sinauer Sunderland, 1993).
                                  14. Sax, D. F. & Gaines, S. D. Species diversity: From global decreases to local increases. Trends Ecol. Evol. 18(11), 561–566 (2003).
                                  15. Hillebrand, H. & Matthiessen, B. Biodiversity in a complex world: Consolidation and progress in functional biodiversity research.
                                      Ecol. Lett. 12(12), 1405–1419 (2009).
                                  16. Magurran, A. E. & McGill, B. J. Biological Diversity: Frontiers in Measurement and Assessment (Oxford University Press, 2010).
                                  17. Usseglio, P. Quantifying reef fishes: Bias in observational approaches. In Ecology of Fishes on Coral Reefs (ed Mora, C.) 270–273
                                      (Cambridge University Press, 2015). https://​www.​cambr​idge.​org/​core/​books/​ecolo​gy-​of-​fishes-​on-​coral-​reefs/​quant​ifying-​reef-​
                                      fishes-​bias-​in-​obser​vatio​nal-​appro​aches/​66076​0F9E6​2CC61​DEB48​C8124​AD44C​DC. Accessed June 2019.
                                  18. Caldwell, Z. R., Zgliczynski, B. J., Williams, G. J. & Sandin, S. A. Reef Fish survey techniques: Assessing the potential for standard-
                                      izing methodologies. PLoS One 11(4), e0153066. https://​doi.​org/​10.​1371/​journ​al.​pone.​01530​66 (2016).
                                  19. Worm, B. et al. Impacts of biodiversity loss on ocean ecosystem services. Science 314(5800), 787–790 (2006).
                                  20. Barbier, E. B. Marine ecosystem services. Curr. Biol. 27(11), R507–R510 (2017).
                                  21. Goodwin, K. D. et al. DNA sequencing as a tool to monitor marine ecological status. Front. Mar. Sci. 4, 107. https://​doi.​org/​10.​
                                      3389/​fmars.​2017.​00107 (2017).
                                  22. Deiner, K. et al. Environmental DNA metabarcoding: Transforming how we survey animal and plant communities. Mol. Ecol.
                                      26(21), 5872–5895. https://​doi.​org/​10.​1111/​mec.​14350 (2017).
                                  23. Taberlet, P., Coissac, E., Pompanon, F., Brochmann, C. & Willerslev, E. Towards next-generation biodiversity assessment using
                                      DNA metabarcoding. Mol. Ecol. 21(8), 2045–2050. https://​doi.​org/​10.​1111/j.​1365-​294X.​2012.​05470.x (2012).
                                  24. Creer, S. et al. The ecologist’s fi ld guide to sequence-based identifi ation of biodiversity. Methods Ecol. Evol. 7(9), 1008–1018.
                                      https://​doi.​org/​10.​1111/​2041-​210X.​12574 (2016).
                                  25. Stat, M. et al. Ecosystem biomonitoring with eDNA: Metabarcoding across the tree of life in a tropical marine environment. Sci.
                                      Rep. 7(1), 12240. https://​doi.​org/​10.​1038/​s41598-​017-​12501-5 (2017).
                                  26. Bakker, J. et al. Environmental DNA reveals tropical shark diversity in contrasting levels of anthropogenic impact. Sci. Rep. 7(1),
                                      16886. https://​doi.​org/​10.​1038/​s41598-​017-​17150-2 (2017).
                                  27. Port, J. A. et al. Assessing vertebrate biodiversity in a kelp forest ecosystem using environmental DNA. Mol. Ecol. 25(2), 527–541.
                                      https://​doi.​org/​10.​1111/​mec.​13481 (2016).
                                  28. Andruszkiewicz, E. A. et al. Biomonitoring of marine vertebrates in Monterey Bay using eDNA metabarcoding. PLoS One 12(4),
                                      e0176343. https://​doi.​org/​10.​1371/​journ​al.​pone.​01763​43 (2017).
                                  29. Yamamoto, S. et al. Environmental DNA metabarcoding reveals local fish communities in a species-rich coastal sea. Sci. Rep. 7,
                                      40368. https://​doi.​org/​10.​1038/​srep4​0368 (2017).
                                  30. O’Donnell, J. L. et al. Spatial distribution of environmental DNA in a nearshore marine habitat. PeerJ 5, e3044. https://​doi.​org/​10.​
                                      7717/​peerj.​3044 (2017).
                                  31. Jeunen, G.-J. et al. Environmental DNA (eDNA) metabarcoding reveals strong discrimination among diverse marine habitats
                                      connected by water movement. Mol. Ecol. Resour. 19(2), 426–438. https://​doi.​org/​10.​1111/​1755-​0998.​12982 (2019).
                                  32. Stat, M. et al. Combined use of eDNA metabarcoding and video surveillance for the assessment of fish biodiversity. Conserv. Biol.
                                      33(1), 196–205 (2019).
                                  33. West, K. M. et al. eDNA metabarcoding survey reveals fine-scale coral reef community variation across a remote, tropical island
                                      ecosystem. Mol. Ecol. 29(6), 1069–1086. https://​doi.​org/​10.​1111/​mec.​15382 (2020).
                                  34. Graham, H. M. Effects of local deforestation on the diversity and structure of Southern California giant kelp forest food webs.
                                      Ecosystems 7(4), 341–357. https://​doi.​org/​10.​1007/​s10021-​003-​0245-6 (2004).
                                  35. Miller, R. J. et al. Giant kelp, Macrocystis pyrifera, increases faunal diversity through physical engineering. Proc R Soc B Biol Sci
                                      285(1874), 20172571 (2018).
                                  36. Lamy, T. et al. Scale-specific drivers of kelp forest communities. Oecologia 186(1), 217–233 (2018).
                                  37. Vergés, A. et al. Long-term empirical evidence of ocean warming leading to tropicalization of fish communities, increased her-
                                      bivory, and loss of kelp. Proc. Natl. Acad. Sci. 113(48), 13791–13796 (2016).
                                  38. Steneck, R. S. et al. Kelp forest ecosystems: Biodiversity, stability, resilience and future. Environ. Conserv. 29(04), 436–459 (2003).
                                  39. Nekola, J. C. & White, P. S. The distance decay of similarity in biogeography and ecology. J. Biogeogr. 26(4), 867–878. https://​doi.​
                                      org/​10.​1046/j.​1365-​2699.​1999.​00305.x (1999).
                                  40. Claisse, J. T. et al. Biogeographic patterns of communities across diverse marine ecosystems in southern California. Mar. Ecol.
                                      39(S1), e12453. https://​doi.​org/​10.​1111/​maec.​12453 (2018).
                                  41. Jerde, C. L., Wilson, E. A. & Dressler, T. L. Measuring global fish species richness with eDNA metabarcoding. Mol. Ecol. Resour.
                                      19(1), 19–22. https://​doi.​org/​10.​1111/​1755-​0998.​12929 (2019).
                                  42. Sigsgaard, E. E. et al. Seawater environmental DNA refl cts seasonality of a coastal fish community. Mar. Biol. 164(6), 128. https://​
                                      doi.​org/​10.​1007/​s00227-​017-​3147-4 (2017).
                                  43. Nickols, K. J., Wilson White, J., Largier, J. L. & Gaylord, B. Marine population connectivity: Reconciling large-scale dispersal and
                                      high self-retention. Am. Nat. 185(2), 196–211. https://​doi.​org/​10.​1086/​679503 (2015).

Scientific Reports |   (2021) 11:14439 |                    https://doi.org/10.1038/s41598-021-93859-5                                                                          11

                                                                                                                                                                           Vol.:(0123456789)
You can also read