CO2 Dynamics and Heterogeneity in a Cave Atmosphere: Role of Ventilation Patterns and Airow Pathways
←
→
Page content transcription
If your browser does not render page correctly, please read the page content below
CO2 Dynamics and Heterogeneity in a Cave
Atmosphere: Role of Ventilation Patterns and
Airflow Pathways
Lovel Kukuljan
Karst Research Institute ZRC SAZU, Titov trg 2, 6230 Postojna, Slovenia
Franci Gabrovsek ( gabrovsek@zrc-sazu.si )
Karst Research Institute ZRC SAZU, Titov trg 2, 6230 Postojna, Slovenia https://orcid.org/0000-0001-
8397-6487
Matthew D. Covington
Department of Geosciences, University of Arkansas, Fayetteville, AR 72701, Arkansas, USA
Vanessa E. Johnston
Karst Research Institute ZRC SAZU, Titov trg 2, 6230 Postojna, Slovenia
Research Article
Keywords: dynamics and distribution of CO2, direction of the airflow, spatially distributed observations
DOI: https://doi.org/10.21203/rs.3.rs-616965/v1
License: This work is licensed under a Creative Commons Attribution 4.0 International License.
Read Full License
Page 1/34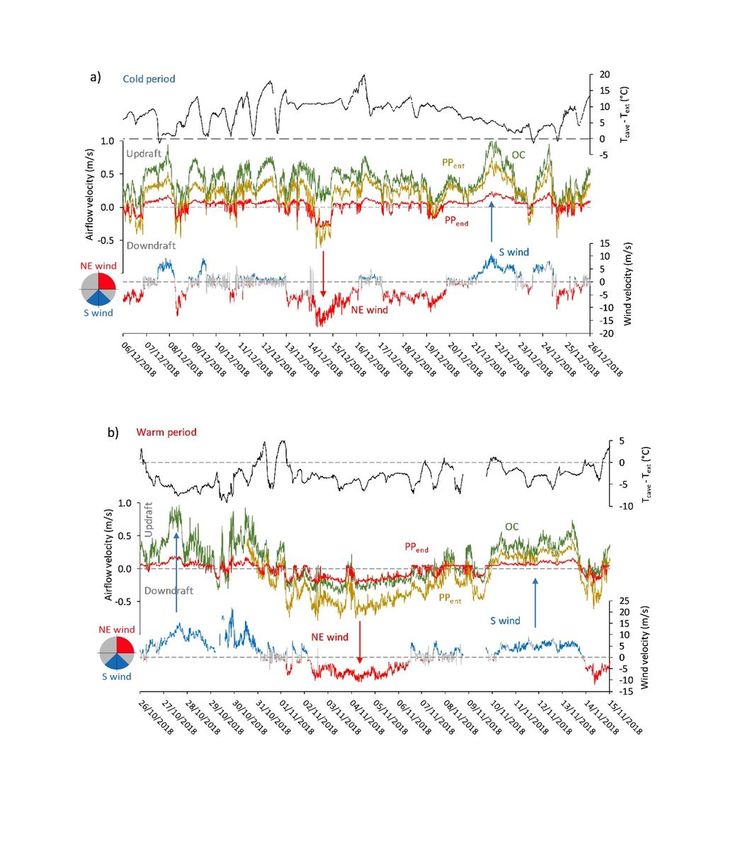
Abstract
Understanding the dynamics and distribution of CO2 in the subsurface atmosphere of carbonate karst
massifs provides important insights into dissolution and precipitation processes, the role of karst
systems in the global carbon cycle, and the use of speleothems for paleoclimate reconstructions. We
discuss long-term microclimatic observations in a passage of Postojna Cave, Slovenia, focusing on high
spatial and temporal variations of pCO2. We show 1) that the airflow through the massif is determined by
the combined action of the chimney effect and external winds and 2) that the relationship between the
direction of the airflow, the geometry of the airflow pathways, and the position of the observation point
explains the observed variations of pCO2. Namely, in the terminal chamber of the passage, the pCO2 is
low and uniform during updraft, when outside air flows to the site through a system of large open
galleries. When the airflow reverses direction to downdraft, the chamber is fed by inlets with diverse flow
rate and pCO2, which enter via small conduits and fractures embedded in a CO2-rich vadose zone. If the
spatial distribution of inlets and outlets produces minimal mixing between low and high pCO2 inflows,
high and persistent gradients in pCO2 are formed. Such is the case in the chamber, where vertical
gradients of up to 1000 ppm/m is observed during downdraft. The results presented in this work provide
new insights into the dynamics and composition of the subsurface atmosphere and demonstrate the
importance of long-term and spatially distributed observations.

Introduction
Carbon dioxide (CO2) is known to be an important greenhouse gas and its distribution between the
atmosphere, oceans, and vegetation is well studied and documented. In karst areas CO2 plays a crucial
role in dissolution and precipitation of carbonates, which may play an important role in carbon
budget (Liu et al. 2010; Jeannin et al. 2016). Therefore, a deeper understanding of CO2 fate and transport
in the vadose zone of karst is needed. In vadose caves, the exchange of CO2 between the atmosphere and
water films flowing on the rock surface drives precipitation and dissolution of calcite. The identification
and understanding of CO2 dynamics also provides crucial information on speleothem growth and decay,
their use as paleoclimate proxies, occupational safety in show caves, and the role of karst areas in the
global carbon cycle (Baldini et al. 2008, 2018; Serrano-Ortiz et al. 2010; Baldini 2010; Martin 2017; Liñán
et al. 2018; Guirado et al. 2019).

The CO2 concentration in cave air varies over a wide range of values, from around atmospheric
concentrations (~410 ppm) to more than two orders of magnitude higher (Ek and Gewelt 1985; Batiot-
Guilhe et al. 2007; Houillon et al. 2017). The instantaneous partial pressure of CO2 (pCO2) at each
position depends on sources, sinks, and transport fluxes. The main sources of CO2 in caves are: (1) the
degassing of groundwater and dripping water, (2) advection and diffusion from the soil and epikarst
zone, (3) decomposition of organic matter introduced into the cave or deep vadose zone, (4)
anthropogenic or biogenic production, and (5) geogenic production (Baldini et al. 2006; Baldini 2010;
Breecker et al. 2012; Milanolo and Gabrovšek 2015; Prelovšek et al. 2018). It is widely recognized that the
                                                  Page 2/34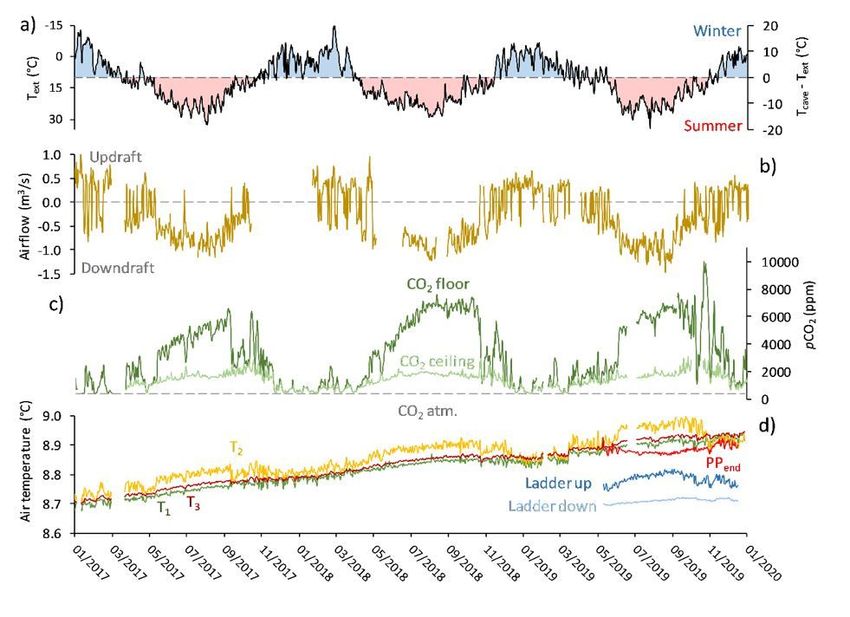
soil and epikarst CO2 reservoir, which is constantly replenished by plant material decay, soil
microorganism metabolism, and root respiration, is a major source of cave CO2 (Appelo and Postma
2005; Baldini 2010; Breecker et al. 2012). Organic material can be transported deeper into the vadose
zone and, when oxidized, become a source of CO2. As a result, the CO2 reservoir expands into a deeper
vadose zone, where it is often referred to as a subsoil carbon source or ground air (Atkinson 1977;
Serrano-Ortiz et al. 2010; Mattey et al. 2016; Baldini et al. 2018). This CO2 reservoir is now well recognized
through contemporary research of the karst vadose zone pCO2 in boreholes (Benavente et al. 2010, 2015),
direct measurements in the soil zone (Blecha and Faimon 2014; Garcia-Anton et al. 2017), carbon isotope
records in speleothems (Noronha et al. 2015), hydrochemistry of drip water (Bergel et al. 2017), or case
studies with long-term monitoring (Mattey et al. 2016, 2021; Bourges et al. 2020).

The secondary porosity of the karst vadose zone allows the underground storage of CO2, but it also
allows air circulation, which mediates the exchange of ground air with the outside atmosphere.
Ventilation through caves and the entire vadose zone can make an important contribution to the net
carbon balance of ecosystems (Serrano-Ortiz et al. 2010). The extent and relative importance of the
mechanisms forcing ventilation depend on the geographical location and altitude, meteorological
conditions, the number and orientation of cave entrances, and the general cave morphology (Borsato et
al. 2015; Covington and Perne 2015). The driving forces of cave ventilation may act on a transient or
periodic (diurnal or seasonal) time scale, with the seasonal being most common in the temperate zone,
where the temperature difference between the cave and outer atmosphere is large enough to cause
density-driven airflows (James et al. 2015). Short-term fluctuations in the prevailing cave airflow may be
caused by variations in the external atmospheric pressure (Pflitsch et al. 2010) or by the wind-driven
effect caused by strong winds over the surface topography (Kowalczk and Froelich 2010).

The seasonality of cave ventilation is directly reflected in the pCO2 values. pCO2 maxima are often
observed in warm periods when CO2 production in the soil is highest and the cave air is static (e.g.
formation of a cold trap in a descending cave) or when the airflow is directed from the soil zone and the
surrounding karst massif towards the cave (Milanolo and Gabrovšek 2009; Faimon and Ličbinská 2010;
Pla et al. 2016a; Peyraube et al. 2017; Covington et al. 2020). Minima are observed during strong
circulation when the high inflow of outside air with low pCO2 dilutes the cave air. In the absence of
airflow, the pCO2 of a cave balances with the pCO2 of the surrounding vadose zone and reaches
potentially extreme values (Houillon et al. 2017; Bourges et al. 2020). As an exception, CO2 seasonality
can be induced by winds in a tropical environment that may otherwise have no seasonal variations
(Noronha et al. 2017), as suggested by James et al. (2015). In paleoclimate studies, CO2 seasonality has
been recognized as an important modulating factor introducing a seasonal bias in speleothem
geochemistry (Spötl et al. 2005; Baldini et al. 2008; Kowalczk and Froelich 2010; Sherwin and Baldini
2011; Cowan et al. 2013; James et al. 2015). However, spatially high-resolution CO2 measurements in
caves have rarely been carried out, although heterogeneity and steep CO2 gradients may well be common.
These ultimately influence drip water geochemistry on a micro-local scale within the cave environment

                                                  Page 3/34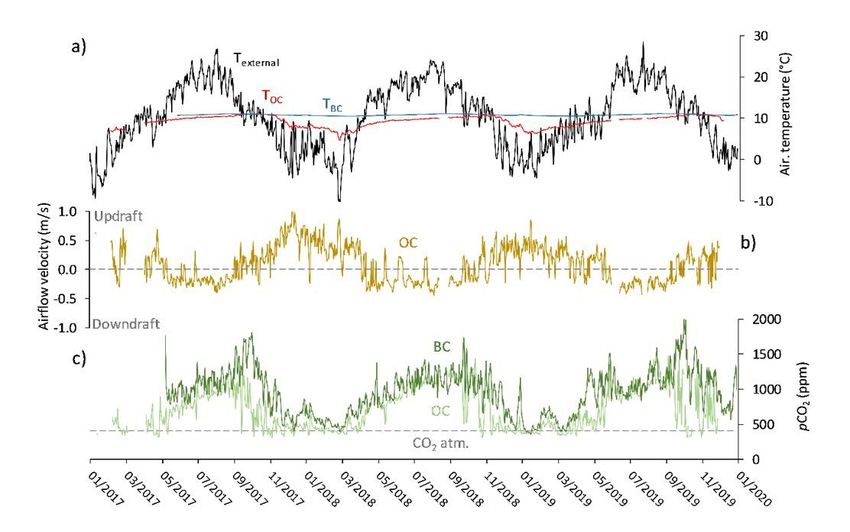
(Ek and Gewelt 1985; Baldini et al. 2006; Whitaker et al. 2009; McDonough et al. 2016). Finally,
mineralization at karst springs has also been shown to be controlled by cave ventilation, which controls
CO2 levels in the vadose zone (Jeannin et al. 2017; Covington et al. 2021).

Contemporary research reveals additional, possibly universal CO2 phenomena that are often neglected or
simply not recognized due to sparse pCO2 measurements—vertical gradients and local CO2 accumulation
behind constrictions, in fissures and depressions, and an increase in pCO2 with distance from the
entrance (Ek and Gewelt 1985; Baldini et al. 2006; Whitaker et al. 2009; Benavente et al. 2010; Breecker et
al. 2012; Cowan et al. 2013; Ek and Godissart 2014; McDonough et al. 2016; Prelovšek et al. 2018;
Bourges et al. 2020). In a conceptual model of CO2 transport through the unsaturated karst zone, direct
advection from the soil zone has become a preferred mechanism over diffusion to explain the spatio-
temporal variation of CO2 in caves (Covington 2016; Lang et al. 2017). However, the particular conditions
of homogeneity or non-homogeneity of cave pCO2, require further research.

The objective of this work is to show how different airflow pathways influence the spatio-temporal
pattern of CO2 within a cave environment and to explain certain specific phenomena related to CO2, such
as high-frequency temporal variation, spatially steep vertical gradients, and stratification. Over a period of
three years, we continuously monitored the cave climate and, with high spatial resolution, frequently
measured pCO2 in a dead-end Pisani Passage of Postojna Cave (Slovenia). Based on these data we
propose a general conceptual model of CO2 transport through the karst vadose zone, which builds on the
current understanding of CO2 dynamics and transport in karst. The results imply the need for a thorough
understanding of the cave environment in order to improve the reliability of paleoclimatic, geochemical, or
similar research, and to ensure the safety of visitors in show caves.

Materials And Methods
2.1 Study site

Postojna Cave (abbr. PC; 45° 46’ N, 14° 12’ E) is a part of a 24 km long cave system in central Slovenia
(Fig. 1). It is an active stream cave fed by the allogenic Pivka River (511 m a.s.l., Qavg ≈ 5 m3/s) and is
hydrologically connected to Planina Cave where it discharges onto Planinsko Polje, a part of the
catchment area of the Ljubljanica springs (Blatnik et al. 2019; Šebela 2019). The cave has two different
levels, a lower (epi)phreatic and an upper dry level that is visited by about 800,000 tourists per year. The
cave system has three entrances connected by open passages, and two entrances, connected to other
parts of the system by an artificial tunnel, which is closed by airtight doors. In addition, many “breathing
holes” have been identified on the surface, whose connection to PC is confirmed or strongly suspected.
The overburden between the upper level of the cave and the surface is between 34 m and 105 m (Šebela
2010). The configuration of many entrances at different altitudes enables year-round ventilation of the
cave. The ventilation shows two different seasonal regimes, winter (typically upward) and summer
(typically downward). In spring and fall there is a shorter transitional regime when the direction of airflow

                                                   Page 4/34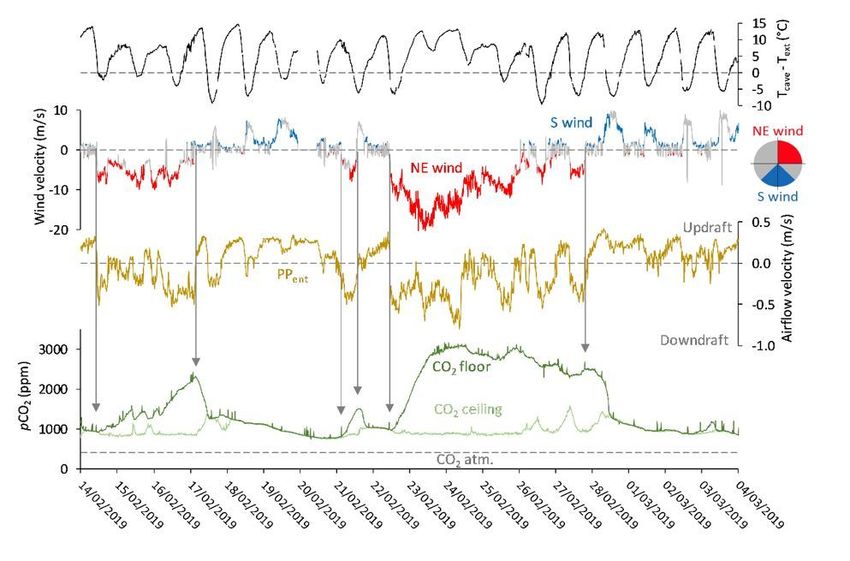
fluctuates (Šebela and Turk 2011; Gregorič et al. 2014). The surface is largely covered by Dinaric beech
and silver fir forests (Krajnc et al. 2017).

The easternmost and highest elevated passages of Postojna Cave are Pisani Passage (abbr. PP, slov.
Pisani rov) and Brezimeni Passage (abbr. BP, slov. Brezimeni rov; Fig. 1). Pisani Passage (entrance at
529.5 m a.s.l.) is a 515 m long side-passage extending northwards and ending with breakdown related to
the formation of the Velika Jeršanova collapse doline (Šebela and Čar 2000). It is formed within thin- and
thick-bedded limestones of the Upper Cretaceous, which are strongly tectonically fissured in some places,
creating the large collapse chambers (e.g. SC Hall (Šebela 1998), Fig. 1). Much of the passage is filled
with clay-rich cave sediments and highly decorated with speleothems. While it is mostly developed
horizontally, PP has several low-lying places, here called “depressions”, which we call First depression
(FD), Ladder depression (LD), and Red Hall (RD). The vadose zone thickness above the passage is 100 m
at the entrance and decreases to 30 m towards the end. The last part of the passage has two parts that
are called Red Hall and White Hall (WH) which can be considered to be a single chamber with a volume of
about 6800 m3. Brezimeni Passage is formed in similar lithology and extends ~400 m to the southeast,
rising and branching towards the end. It is characterized by a large collapse chamber halfway along the
passage and a high chimney about 30 m further down the passage, which is probably connected to the
surface.

Although Postojna (533 m a.s.l.) is close to the Mediterranean Sea (20 km), it has a continental climate
with cold winters and warm/hot summers. The average annual air temperature is 9.3°C, the coldest
month is January with -0.1°C and the warmest July with 19°C (average of the period 1981-2010). The
average annual precipitation for the same climate period is 1500 mm, with precipitation generally more
concentrated in fall and in the colder months. During the 2017-2019 study period, average monthly mean
air temperatures were above the long-term average, especially in the summer months, and warming in the
range of 0.35–0.45°C per decade has been observed. There are two types of strong regional winds in
Postojna – bora is a gusty, cold and generally dry katabatic wind blowing from the north-east, while jugo
is a generally humid wind blowing from the south. As Postojna is surrounded by mountainous terrain
(>1000 m a.s.l.) to the north and the east, it is mostly influenced by the north-eastern winds blowing from
the interior over the Postojna Gate mountain pass. Winters are generally windier, while summers have a
higher frequency of calm days (ARSO 2021).

Karst massifs are subject to heat exchange between rock, air, and water (Luetscher and Jeannin 2004).
Although the fluids penetrating the massif exhibit daily and seasonal cycles and long-term trends, the
massif establishes an equilibrium temperature (Badino 2005), which can be detected in thermally very
stable (non-ventilated) parts of cave systems and in deep groundwater and water trickles that percolate
through the vadose zone (Badino 2010). In the Postojna region, temperatures between 8.5°C and 9°C are
typically measured in such situations.

2.2 Microclimatic monitoring

                                                 Page 5/34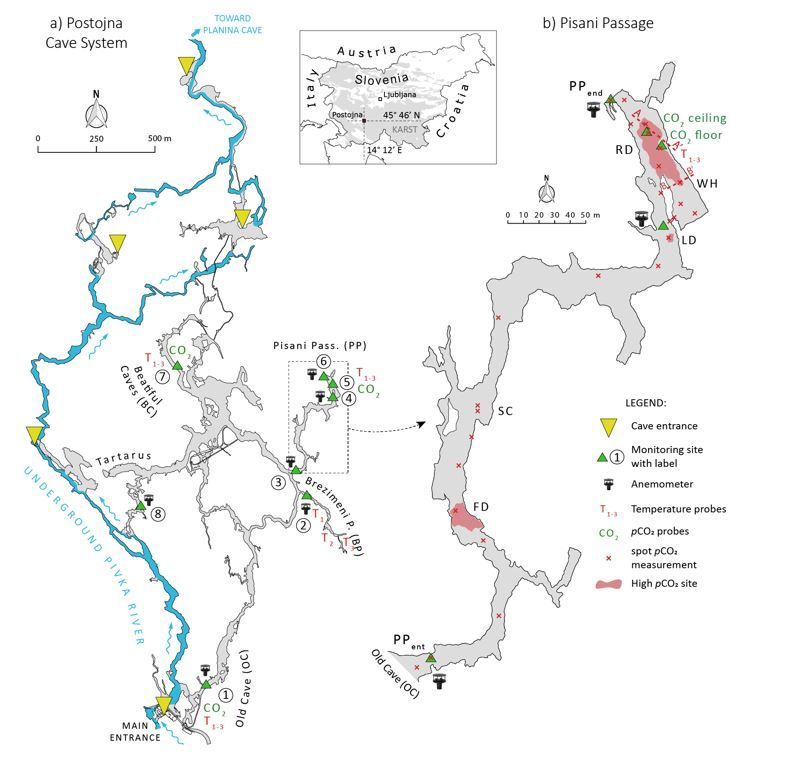
Microclimatic monitoring in Postojna Cave was established to obtain general patterns of cave
microclimate and to assess the impact of tourist visits. The backbone of the monitoring network was
established in the period of 2009–2012 at four sites (1, 4, 7, and 8 in Fig. 1). The stations were installed
along the main airflow pathways (sites 1 and 8), in the places where the greatest impact of tourists was
expected (site 7), and in the remote, unvisited parts of the cave (sites 2, 3–6). All instruments are
connected to data loggers, additionally, stations 1, 3, 5, and 7 are or were also connected to the web
server via the existing optical line or DTN protocol. Details about the measurement system, data
acquisition, transmission, and storage are given by Gabrovšek et al. (2014). The stations record with a
resolution of 10 min an ambient temperature at three vertical positions with Pt100 temperature sensors
(resolution 0.01°C; accuracy ±0.1°C), a CO2 concentration (Vaisala GMP222 and GMP252 probes;
measuring range 0–10.000 ppm; accuracy ±1.5% of full scale and ±2% of reading for GMP222, and ±2%
of reading for GMP252), and wind speed and direction (ultrasonic Gill Windsonic anemometer; resolution
0.01 m/s; accuracy ±2% at 12 m/s; directional accuracy ±3° at 20 m/s). The original network was
extended by additional wind speed (Gill Windsonic), temperature (HOBO MX2203 TidbiT; resolution
0.01°C, accuracy ±0.2°C), and CO2 instruments, mostly in Pisani Passage and Brezimeni Passage (T1–
T3). Here, the wind speed time series has been modified to include the direction for each station—positive
values for an updraft (typical winter situation) and negative values for a downdraft (typical summer
situation). Monitoring in the farthest chamber of the Pisani Passage (i.e., Red Hall, abbr. RD, slov. Rdeča
dvorana) started in 2012, but the older data are sparse due to energy shortage and related instrument
failures. Since 2016, the station has been connected to the cave’s power line via a UTP cable, which is
also used to transmit the data. The station receives three temperature inputs and two CO2 measurements,
which are marked as CO2 floor and CO2 ceiling, positioned 6.5 m above the latter (Fig. 2c). Ventilation in
the PP is monitored at its entrance (site 3), while sites 4 and 6 are discontinuous, and airflow data are
only available for shorter periods. Additional temperature HOBO loggers were installed in PP at sites 3, 4,
and 6 in 2019.

2.3 Spot CO2 measurements

The spot CO2 concentrations were measured with a Vaisala portable CO2 meter (GM70) with GMP222 or
GMP252 probes. All measurements were automatically compensated to the standard temperature and
pressure (298 K, 1013 hPa). Occasionally, the readings were compared between several Vaisala meters,
calibrated at different times, to detect potential drift. The differences were within the range of the
expected uncertainty. Spot pCO2 measurements were carried out with an equilibration time of at least 2
minutes with unattended automatic recording to eliminate interference from respired CO2. Longitudinal
CO2 profiles along PP were obtained by spot measurements of pCO2 at 26 predefined positions ~1 m
above the ground (completely marked on Fig. 1 and Fig. S1 and partially marked in Fig. 2c). The
procedure was repeated on average 28 times at all sites over several seasons and ventilation regimes
(from 13 September 2017 until 16 January 2020). The vertical CO2 profile in RD was obtained by setting
up a Tyrolean traverse with a pulley system, which allowed an exact horizontal and vertical positioning of
the CO2 instrument (location marked in Fig. 1). In this way, a grid of CO2 values was created twice, on 30
                                                  Page 6/34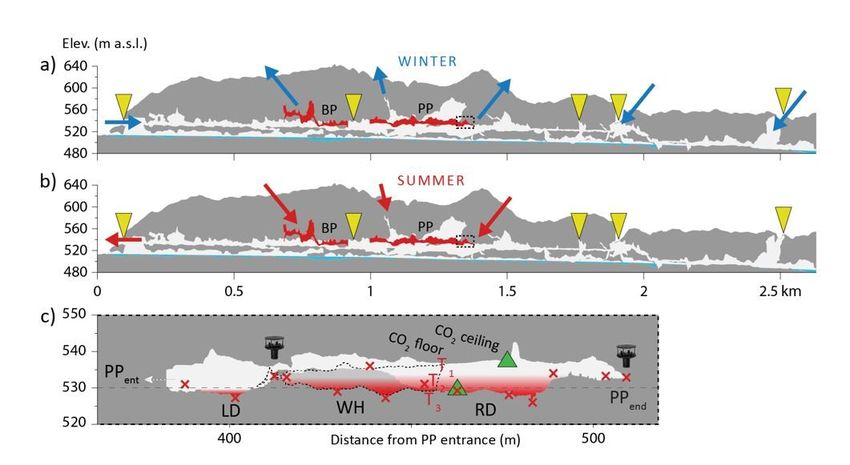
May 2018 and 7 August 2018, along the entire horizontal and vertical span of the cross section. As the
profiles showed uniform values in the horizontal direction and high gradients in vertical direction, the
following seven surveys were carried out at a single horizontal position. For more details, see section S2
in the supplementary material.

2.4 Other data sources

Meteorological and climatic data of external conditions (air temperature and pressure, wind speed and
direction, precipitation, and snow cover) were obtained from the national meteorological stations of the
Slovenian Environmental Agency in Postojna 1.2 and 2 km SSW from the main entrance of the PC
representative of typical meteorology above the cave (ARSO 2021). The extended profiles and cross-
sections in the PP were accurately drawn using data from the 3D laser scanning survey carried out in
2013 by Sven Philipp and Jan Will from the Darmstadt University of Technology, Germany, and Franjo
Drole from the Karst Research Institute ZRC SAZU, Slovenia. Similarly, the surface proximity was acquired
from the LiDAR DEM data (ARSO 2020).

Results And Discussion
3.1 Microclimatic characteristics of the Postojna Cave System

The ventilation pattern shows typical seasonal and diurnal variations, which are characteristic for a
dynamically ventilated cave system with several entrances (Fig. 3a). In winter, cold outside air flows into
the cave through the main entrance at the base of the structural escarpment. The air, heated by the
massif, is then driven by buoyancy through the cave passages and numerous small but open airflow
pathways connecting the cave with the topographic surface above. In summer the situation is reversed.
The air enters the massif at inlets on the surface, cools down in contact with the massif, and flows along
largely unknown pathways to the cave and along the cave towards the main entrance (Fig. 2a and b).
During the transition regimes, the outside temperature rises above and below the cave temperature daily,
so that diurnal changes from updraft to downdraft are observed (typically in spring and fall). In all graphs
negative values for the airflow velocity are used for the downdraft situation and positive for the updraft
situation. Although the chimney effect is the dominant driving factor of cave airflow, external wind also
drives subsurface ventilation, as will be discussed in Section 3.3. However, a detailed analysis of wind-
induced cave airflow in Postojna Cave is provided in another paper (Kukuljan et al., 2021).

Seasonal/daily temperature variations depend strongly on the relative position with respect to the main
ventilation pathway and the distance from the entrances. Points near the main entrances and along the
main ventilation pathways show much higher seasonal temperature variations (±3.5°C at OC), which
decrease towards the cave interior (±0.4°C at BC) and towards the most distant dead-ends (±0.1°C at PP).
The average air temperature in the system is between 9°C and 11°C and a phase delay between the
outside and seasonal average cave temperature reaches several months (Šebela and Turk 2011). In some
places, especially in BC, the presence of tourists interrupts the typical cave temperature for a short time
(Šebela et al. 2015).
                                                  Page 7/34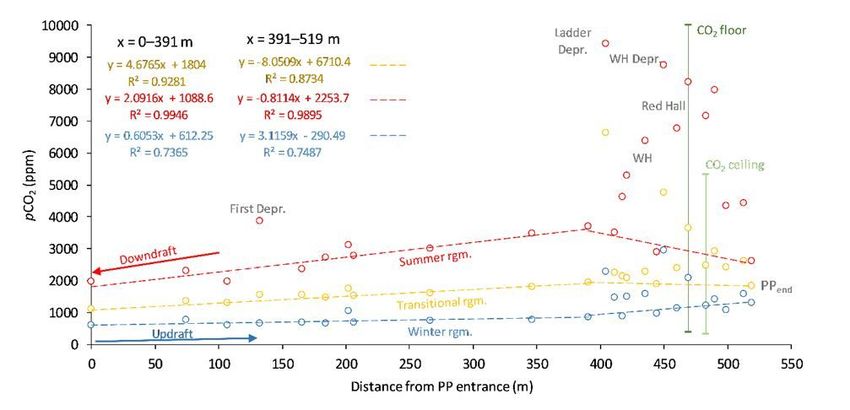
The seasonality of the ventilation is also reflected in the composition of the cave atmosphere. In summer,
the air enters underground at a topographically higher surface, passes mostly through smaller openings
and enters the main cave system. Downdraft seasonally coincides with increased biogenic CO2
production during the warm season, resulting in increased pCO2 values in the cave (Lang et al. 2017).
During updraft, outside air enters the cave through large entrances and dilutes the CO2 throughout the
entire cave system (Fig. 3c). pCO2 along the main ventilation pathways can decrease to atmospheric
levels. Various circumstances can lead to a substantially uneven distribution of pCO2 in the cave. In a
poorly ventilated passage, the pCO2 in the cave is nearly in equilibrium with the pCO2 of the surrounding
vadose zone. In the case of Pisani Passage, high pCO2 values were considered to be the result of poor
ventilation (Prelovšek et al. 2018). The main proposed sources of CO2 were direct seepage of CO2-
enriched air from the vadose zone and degassing of the percolating water, which showed equilibrium
pCO2 values similar to those measured in the cave air. Gregorič et al. (2013) found similar fluctuations in
another trace gas, radon, whose activity concentration reached extremely high values (up to 45 kBq/m3,
annual mean ~25 kBq/m3). The authors suspect that in addition to stagnating summer air conditions,
thick soil layers, surface proximity and clay-rich cave sediments could be responsible for such extremes.
The Pisani Passage is, therefore, an ideal candidate to study the CO2 dynamics of PC.
3.2 Microclimatic observations in the Pisani Passage
3.3 Cave airflow
The airflow velocity into/out of the Pisani Passage is measured at its entrance, where the passage is
limited to a cross-sectional area of 1.42 m2. The air flow rate is shown in Fig. 4b. In general, the airflow
follows the ventilation regimes typical of Postojna Cave, updraft for Tcave > Text (typically in winter,
positive values) and downdraft for Tcave < Text (typically in summer, negative values, Fig. 4a and Fig. 4b).
The PP, thus presents an airflow pathway that connects the inner part of the cave (OC) with the higher-
lying surface. However, there are no physically known connections between the PP and the surface,
suggesting that the air mainly follows a network of small conduits and fractures. Most of these airflow
pathways are too small to be localized exactly, but a site of detectable, seasonally reversible airflow was
found at the far end of PP (PPend), suggesting that the entire passage is ventilated.
The temperature records in Fig. 4c show small differences at different vertical position in the Red Hall
and in the PPend. Similar temperatures were recorded in the Ladder Depression (LD)(Fig. 4c), During
downdraft the temperature span along the entire Pisani Passage is less than 0.4 K (8.5°C-8.9°C).
In Fig.4b one can observe a steady dominant downdraft in warm periods and updraft in cold periods. In
cold periods, however, clear intervals of downdraft can also be observed, which is contrary to the forcing
of the chimney effect. The correlation of the direction of the cave airflow with various possible drivers
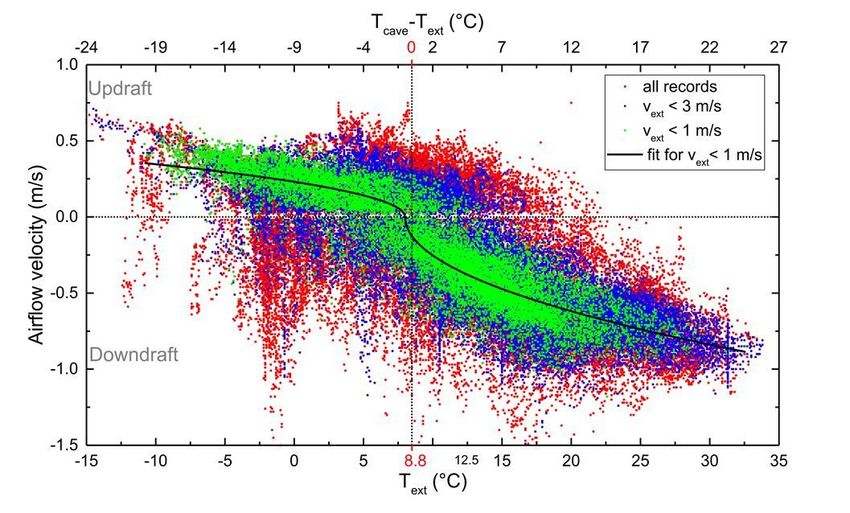
showed that such downdrafts are caused by the external wind gusts. Fig. 5a shows the airflow velocity at
OC and PP in relation to the outside wind during one such a cold period. Note that for visual clarity, the
Page 8/34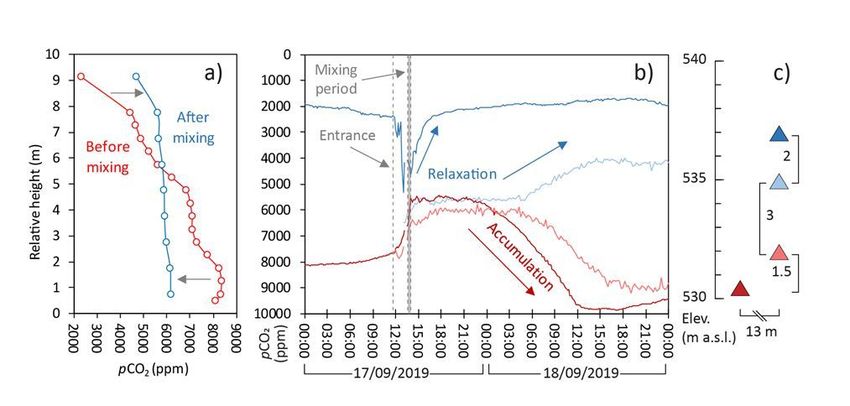
wind speed has been oriented and colored depending on the prevailing direction; positive values for winds
of 0–90° and 270–360° (winds 0–90° are colored red and marked NE), and negative values for 90–270°
(winds 135–225° are colored blue and marked S). The decrease of an updraft or the complete reversal of
the airflow to a downdraft occurs during periods of the northeastern external wind, especially with gusts
of >10 m/s (marked by the red arrow). In some periods these reversals occur despite of the fact that Tcave
is more than 10°C above Text. On the other hand, an increase of updraft (blue arrow) is observed when the
wind is blowing from a S direction. The effect is similar in the warm period (Fig. 5b), where the typical
downdraft (Tcave
the change in the surface vegetation cover, increasing number of visitors, or whether is it due to another
reason. Warming has also been observed in other parts of Postojna Cave (Šebela et al. 2015).

3.4 The longitudinal gradient of CO2

Spot pCO2 measurements were carried out during different seasons and ventilation regimes to
investigate the general dynamics and possible gradients of CO2 across Pisani Passage. As already
observed by Prelovšek et al. (2018), an increasing trend with distance from the entrance is confirmed,
independent of the ventilation regime (Fig. 7). However, this rule does not apply to the Red Hall at the far
end of PP nor to other weakly ventilated or unventilated sites, which apparently protect the CO2 from
advection. We have found that all CO2 rich sites are located in morphological depressions (see Fig. 1, Fig.
3c, and Fig. S1). The seasonal differences are seen as changes in the size and slope of the longitudinal
CO2 gradient from the entrance to the inner cave–the winter gradient is the gentlest and the summer
gradient the steepest. These gradients are similar to those measured in Ste-Anne Cave (5.3 ppm/m (Ek
and Gewelt 1985)) or in Srednja Bijambarska Cave (0.2–2.2 ppm/m (Milanolo and Gabrovšek 2009)).

3.5 Temporal CO2 dynamics in the Red Hall

In general, the seasonal variation of pCO2 in Pisani Passage corresponds to the variations in other
sections of the Postojna cave system; low values in cold periods due to strong dilution by the outside air,
and high values in warm periods due to advection from the CO2-rich vadose zone. A closer look, however,
reveals an interesting phenomenon in the final chamber of PP (Red Hall), where during the downdraft the
pCO2 is significantly higher near the floor than at the ceiling (Fig. 4d). The pCO2 at the floor station can
even exceed 10,000 ppm, while the maximum daily value at the ceiling probe is only 3200 ppm. The
differences between floor and ceiling can reach almost 8000 ppm during the summer season, indicating
a permanent, drastically different air composition within only 6.5 m of vertical difference. Both values
and their difference show a gradual increase from mid-May to mid-October, when pCO2 in the soil and the
epikarst is expected to increase as well. During the updraft, the air in the RD is well mixed and the pCO2
can fall well below 1000 ppm. This apparent “stratification” will be discussed further in the next section.

The pCO2 fluctuations in Red Hall are directly related to the airflow in Pisani Passage, which is not only
driven by the chimney effect, which explains the seasonal dynamics, but also by the wind effect. The
wind-driven effect on cave ventilation is explained in another paper (Kukuljan et al., 2021), here we
present the effect on pCO2. An example of a winter period (18 days) is shown in Fig. 8, where the chimney
effect forces an updraft. During most of the period, the pCO2 on the floor and the ceiling of Red Hall are
almost equal and low (~1000 ppm). However, during periods of strong NE wind, the direction of the
airflow reverses towards downdraft, whereupon the floor and ceiling pCO2 curves are immediately
separated. The floor pCO2 increases, while the ceiling pCO2 even shows an initial decrease, followed by a
moderate increase. When the outside wind direction and thus the airflow direction along the PP is
reversed, the updraft situation with the mixed atmosphere is restored within a few hours. This effect also

                                                  Page 10/34
occurs during the rest of the year. However, in the high summer season, it is suspected that a maximum
CO2 flux from the karst massif is reached, so that the NE wind only increases the speed of the airflow,
while the CO2 concentration remains the same or even decreases slightly. The southerly wind causes a
temporary mixing of the air in RD or, if it lasts long enough, a decrease of the total pCO2, regardless of the
season or the ventilation regime.
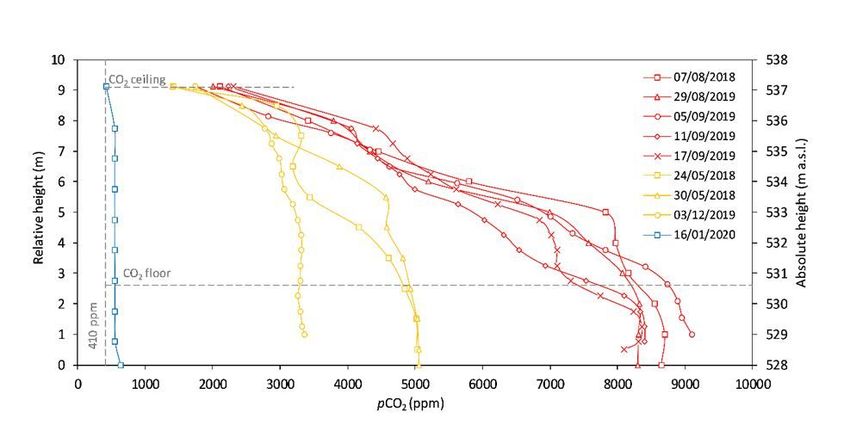
3.6 Vertical CO2 profile
To investigate the phenomenon of apparently vertically stratified air in Red Hall in full spatial detail, we
measured vertical CO2 profiles. This was done by gradually lowering the instrument from the ceiling to
the floor at different horizontal positions. Two complete grid profiles of 8 m in height and 20 m length
were created to confirm that the stratification is present in the entire cross-section of the chamber (Fig. 9).
After uniform values were found in the horizontal position, only one position (14 or 16) was selected for
the subsequent profiles (for more details on profile setup, see section S2 in the supplementary materials).
The pCO2(height) curves show two distinct gradients with maximum values at the floor of the hall and
minimum values at the ceiling.
The profiling was repeated in different ventilation regimes to obtain a temporal resolution of the CO2
profiles as shown in Fig. 10. A typical winter regime with updraft is characterized by an almost uniform
CO2 distribution, while during downdraft the curves take on a characteristic shape and in extreme cases
reach gradients of almost 1000 ppm per vertical meter. The maximum difference resulting from the
available time series of the fixed floor and ceiling stations corresponds to a gradient of 1200 ppm/m
(daily average). Similar curves were reported from borehole measurements in a karstic environment by
Benavente et al. (2010, 2015).
The stratification in Red Hall is built up on the time scale of hours to days after the reversal of the airflow
from updraft to downdraft regime. We have observed that our movement in the lower part of the chamber
disturbs the stable stratification, but the characteristic profile restores within a few hours (few examples
are available in Fig. S4b). To study this phenomenon in more detail, we deliberately force-mixed the air by
stirring it with flat panels in RD for 20 min so that CO2 was distributed almost evenly throughout the
chamber. During this experiment we deployed two additional CO2 meters at intermediate heights between
the CO2 stations on the floor and the ceiling. Fig. 11a shows the vertical profile before and after the
mixing, and Fig. 11b shows the recordings of four CO2 probes during the restoration of the characteristic
profile. The experiment was performed in the summer ventilation regime (i.e., Tcave < Text), where we
expected constant downdraft conditions. While the relaxation curve at the ceiling shows a typical
exponential decrease almost immediately after the mixing, the concentrations at other positions begin to
change 12 hours later. The comparison with the external wind data showed that the delay occurred during
a southerly wind, which may have temporarily restricted the accumulation and relaxation of the lower
probes. As soon as the wind changed direction, the accumulation and relaxation processes continued.
However, this was a rather surprising situation, since the simultaneous separation of the pCO2 curves is
Page 11/34much more common (visible in time series in Fig. 8 and Fig. S4). The reason for these apparent
differences in responses has not yet been found.
The characteristic response times for CO2 curves were investigated by fitting the data points to an
exponential function. For the experiment of 17th of September 2019, the accumulation rates were 5.00 h
for the lower (temporary) CO2 instrument and 7.14 h for the floor CO2 station. The relaxation times were
shorter, from 1.41 to 4.00 h, for the ceiling CO2 station and the upper instrument. The short characteristic
time needed for restoration of a distinct CO2 profile can only be explained by advective inflow of CO2-rich
and CO2-poor air (Covington 2016; Lang et al. 2017). A plausible explanation is that there are several
inputs with different CO2 concentrations and that their flow distribution is such that the mixing is
negligible. A pronounced CO2 input is located at the far end of PP at 533 m a.s.l., 4 meters below the
ceiling CO2 station (marked PPend, Fig. 2c). It is a narrow passage with a measurable airflow showing
typical downdraft volume flow rates of about 0.05 m3/s and low pCO2 values (1350–5180 ppm, average
2000 ppm, n = 30), which is comparable to the ceiling CO2 station. The volume flow at the PPend is about
14% of the volume flow that is discharged out of PP during downdraft.
Several places with extreme CO2 levels have been located in Red Hall, White Hall and at the Ladder
depression, although none of them has detectable airflow. One of them is a small flowstone-covered
depression in the White Hall (Fig. S5a). We have performed similar mixing tests as described above where
the air in depression was well mixed with the surrounding low-CO2 air. After mixing is stopped, a high
concentration is restored with a characteristic relaxation time of 0.02–0.07 h in a warm period and an
order of magnitude slower in a cold period (Fig S5b). Such a rapid increase during the downdraft
indicates an advective inflow with a small volume flow rate but high pCO2. Based on these
measurements and observations we propose a conceptual model of CO2 transport in the Red/White Hall,
which explains the observed phenomena.
4 The conceptual model of CO2 transport
The advection driven by the chimney or wind effect is the main mechanism for CO2 transport and the
reason for the observed fluctuations of CO2 concentration in the Pisani Passage atmosphere. Throughout
the year an average of 0.54 m3/s of air is exchanged with the surface. Although it is an important
ventilation pathway in the Postojna Cave system, the temperature in the passage is very stable, indicating
an efficient heat exchange between the rock mass and the air. This indicates that the air enters and exits
the passage through many small pathways (such as solutionally enlarged fractures and small conduits)
that provide a high ratio of rock surface area to air volume required for efficient heat exchange. The entire
area of Postojna Cave is strongly tectonised with numerous faults, fractures and crushed zones. These
elements were also mapped along the entire Pisani Passage (Šebela 1992, 1998).
Figure 12 shows a conceptual model of airflow and CO2 dynamics between the outside atmosphere and
PP. During the updraft regime, air with low pCO2 coming from the main entrance through the Old Cave
Page 12/34dominates along the entire Pisani Passage and exits to the surface along open pathways (blue arrows in
Fig. 12a). During the downdraft regime the air enters the passage from the surface through many
pathways with different aeraulic conductivities (red arrows in Fig. 12a). One can imagine a complex flow
network of fractures and conduits along which the air flows from the surface to the cave (Fig. 12b). The
air can enter the network enriched with soil CO2 to varying degrees, depending on the soil thickness, the
CO2 production rate, and the porosity of the soil and the airflow network (Pla et al. 2016b). Furthermore,
CO2 may enter the airflow by diffusion from poorly ventilated compartments of the massif and reach the
junctions with high pCO2 pathways. Generally, pathways with high flow rate are expected to be less
enriched with CO2 once entering the cave, compared to poorly ventilated pathways. An example of a fast
flow pathway is PPend in Red Hall, the only inflow with a detectable airflow, and where the overall lowest
pCO2 values were observed in the Red Hall. The inflows with the highest CO2 concentration cannot
currently be detected because the air velocity is too low, but we can locate areas with high CO2
concentrations and estimate the flux (Fig. S5). It has already been shown that the updraft in PP during
cold periods contributes significantly to the soil CO2, thus obviously requiring the existence of an
underground CO2 reservoir (Krajnc et al. 2017). Similarly, Faimon et al. (2020) found a clear relationship
between updraft (UAF) and downdraft (DAF) modes of subsurface ventilation and the CO2 concentration
and δ13C isotopic composition of soil air fluxes at the breathing spot above the probable cavity in Hranice
Karst (Czech Republic). The concepts presented in that paper agree well with the concept presented here.
The geometry of the system seems to be important for the formation of the vertical CO2 profile.
Significant vertical differences discovered during the measurements (Fig. 9 and Fig. 10) support the idea
of dividing the Red/White Hall chambers into at least two, vertically stratified, microclimatic
compartments. The upper compartment is efficiently ventilated by the inflow of CO2-poor air from PPend,
while the lower compartment is filled with slow seepage of CO2-rich air, emerging from cracks in the walls
or from the floor (Fig. 12b). The boundary between these compartments is between 533 and 535 m a.s.l.,
which coincides with the height of the outflow from RD/WH, and the height of the inflow at PPend (Fig. 2c
and Fig. 9). The spatial characteristics of the CO2-rich pathways are not yet clear. Although we have not
found high-CO2 inflows at or near the ceiling, it is likely that they surround the entire cave perimeter as
illustrated in Fig. 12b. Airflow near the ceiling could mask these sources. Further work on the analysis of
the spatially variable δ13CO2 signals within the cave could provide further insights (Mandić et al. 2013;
Krajnc et al. 2017).
The CO2 dynamics for the rest of the Pisani Passage is presented as a longitudinal profile in Fig. 7. A
positive gradient is expected in the cold season, when the outside air enters the cave through the large
main entrances. Along the flow towards the interior of the massif the air is enriched with (mainly)
remnant CO2 and CO2 degassing from the calcite precipitating trickles. An inverse gradient would be
expected in the warm period, which is not the case in PP. There, the air enters the passage along many
small hardly detectable pathways enriched with vadose CO2 to different degrees. The change of pCO2
Page 13/34along the passage depends on the longitudinal distribution, flow rate and pCO2 of the inlets. Decrease of
pCO2 along the flow path indicates increasing contribution of inlets with lower pCO2.
In order to clarify the hypothesis of low flow high-CO2 and fast flow low-CO2 pathways, a comparison
with observations in the Brezimeni Passage (BP) can be made, which connects to the Old Cave 50 m
from Pisani Passage (Fig. 1). The passage is similar in length to PP but has a smaller cross-section on
average. The decisive element for the airflow dynamics of this passage is the high chimney in the middle
section, as shown schematically in the Supplement (Fig. S6). Although we have not yet located the exact
surface opening, it is assumed that it is connected by an efficient airflow pathway. This is indicated by an
average airflow rate of 3.44 m3/s, which is almost 7 times that of the PP (0.54 m3/s). Further on, its role
is particularly reflected in the annual temperature records at three different positions in the passage (Fig.
S7a). The amplitude of the seasonal variations at two sites (T1 and T2) along the dominant airflow
pathway between the chimney and the OC is more than 2°C, while the temperature recording away from
the dominant pathway (T3) shows a variation (0.25°C) that is one order of magnitude smaller. The typical
diurnal variation is also visible in the time series of the airflow velocity (Fig. S7b). The dominant airflow
pathway is also evident in the pCO2 data, where values of only 515 ppm were measured during the
downdraft below the chimney and over 3000 ppm further away from the chimney (Sept 2018; Fig. S8). In
summary, strong inlets/outlets like the chimney in BP, dominate the dynamics and composition of the
cave atmosphere and obscure the contribution of smaller pathways that certainly exist. Such a dominant
pathway is not present in PP, which makes the contribution of smaller pathways more obvious. The
results could also be discussed in terms of the concepts proposed by Lang et al. (2017). They
emphasized the importance of advective flows from the epikarst (abbreviated AIFE) for CO2
concentration in caves. Therefore, Pisani Passage can be considered as a cave with geometry A (sensu
Lang et al. (2017)) with an open lower entrance and “hidden” upper entrances. Although the Brezimeni
Passage has no known upper entrance, it falls into geometry C based on airflow dynamics, with two open
entrances with weak sources from soil/epikarst. While in Pisani Passage the AIFE plays a crucial role in
the resulting CO2 concentrations, in Brezimeni Passage it is obscured by the concentrated airflow entering
through the chimney.
The effect of the external wind on cave airflow in Postojna Cave and thus on pCO2 is clearly visible in the
data (Figs. 4–6). A detailed analysis and quantitative assessment of the relative importance of the
chimney effect and the wind-driven effect, supported by CFD simulations, is discussed by Kukuljan et al.
(in review), so we give only a brief outline here. The surface above PC is characterised by karstified terrain
with many dolines, while the main entrance is located on a south-facing scarp. Wind flow over a rough
topography induces a variable pressure field at the surface and at the cave openings. External winds
induce differential pressure between different entrances and “blowholes” (air inlets and outlets).
Therefore, the relative orientation and position of entrances is important. In warm periods, NE winds
enhance the downdraft driven by the chimney effect in OC and PP, while the S winds oppose the chimney
effect and diminish the cave airflow. Conversely, in cold periods, the NE winds oppose the updraft driven
by the chimney effect and can even reverse it to downdraft causing an increase in pCO2 values, as
Page 14/34discussed in Section 3.3. The southerly wind increases the updraft in the cave, which is especially
noticeable at the OC site, which is closest to the main cave entrance. Figs. 5a and 5b show how the high-
frequency variation in the outside wind also affects the high-frequency variation in the time series of the
cave airflow. Similar wind-driven cave ventilation has been studied in a cave in Florida (Kowalczk and
Froelich 2010) and in a tropical cave on the island of Guam, where seasonal density-driven airflows are
otherwise unexpected (Noronha et al. 2017).
Although it appears that the chimney effect and wind effect control the CO2 dynamics in PP, there may be
other factors involved. In some cases, CO2 dynamics in mature caves has been found to be controlled by
variation of drip rate, water infiltration or saturation of vadose zone (Milanolo and Gabrovšek 2015;
Bourges et al. 2020). Theoretically, airflow and infiltration water pathways are shared within a vadose
zone, and in this way saturation with water can limit or block the gas exchange between the cave and the
exterior (Cuezva et al. 2011; Garcia-Anton et al. 2014; Pla et al. 2016b). In the case of PP, however, we
have not found that this effect is significant in the CO2 dynamics studied (at the level of continuous
variation of pCO2 or the specific CO2 phenomena described previously). A redistribution of the airflow
through larger, open, and non-saturated pathways may obscure the significance of this effect. If it is
present nevertheless, it may be more pronounced in the cold period, when more precipitation is normally
recorded in Postojna and rates of evapotranspiration are lower. It is also expected that snow cover or
freezing of the soil could restrict gas exchange, as only the larger openings would remain open due to the
melting effect of the rising warm cave air. The longest period in the years 2017–2019 with continuous
snow cover was February 2018, when the cold fronts brought about 30 cm of snowfall. This month-long
period with a low average outside temperature of –2°C was characterized by a strong accumulation of
CO2, which reached a maximum of 2500 ppm at the floor station in the Red Hall. Although it is probable
that the air discharge from the cave was blocked by the snow cover or the soil freezing, the same period
is also characterized by the longest continuous NE wind event, which may also have limited the air
discharge (i.e., expected updraft). Therefore, we could not study these effects in detail separately. As
suggested by some recent studies in the Mediterranean (Cuezva et al. 2011; Garcia-Anton et al. 2014,
2017; Pla et al. 2016a), prolonged warm periods increase soil permeability and cause increased soil gas
exchange. Although the long-term effects can only be speculated, we might expect that longer dry
seasons would limit soil biogenic CO2 production and reduce overall CO2 flux due to increased
ventilation. However, in our case we did not found this limiting threshold, but rather increasingly
prolonged periods of high CO2 in the RD (Fig. 4c). This behavior could be explained by the greater role of
subsoil CO2 sources, which are less affected by outside conditions (Mattey et al. 2016). The CO2
dynamics were also compared with the change in atmospheric pressure, but did not show a significant
correlation. Previous research in PC confirms that pressure equalization is practically instantaneous, so
that no barometric airflow is expected (Šebela and Turk 2011).
Although the specific configuration of the airflow pathways in the Pisani Passage may be considered as
local and hardly generalized, we believe that these observations are not unique and that such situations
would be (or have been) recorded in other caves where the airflow system connecting the cave to the
Page 15/34surface consists of several non-dominant airflow pathways. In reality, there are many more caves with a
single-entrance that are, nevertheless, better ventilated than caves with continuous, unobstructed
passages between numerous entrances. A poorly mixed cave atmosphere would probably lead to high
gradients of parameters (such as CO2 and temperature) between different parts of the cave and
microclimatic environments. These can be easily identified and investigated by denser and more careful
measurements of pCO2. Certainly such micro-local CO2 environments also have an important influence
on the hydrochemistry of dripping water and subsequent analysis for paleoclimate or similar research.
This is already obvious in the case of the RD, where the floor underneath the drip spots shows a large
number of characteristic dissolution features, so-called corrosion cups. While these are the subject of
ongoing research, we postulate that high vertical CO2 gradients during the downdraft profoundly alter the
hydrochemistry of the drip water. In the upper air compartment, the drips equilibrate to a low pCO2 level,
while in the lower one they reach a much higher pCO2 value and become corrosive. The kinetics and long-
term effects of such a heterogeneous environment on the geochemistry of speleothems is still an
important open research question.
Conclusions
Ventilation has a strong influence on the composition of the cave atmosphere. In the case of Postojna
Cave, the ventilation is driven by the combined chimney and wind effects. During updraft, the fresh
outside air enters through the main entrances and dilutes the cave atmosphere in terms of CO2. During
downdraft, the air enters at higher elevations and is then enriched with CO2 along different airflow
pathways, crossing the CO2-rich soil, epikarst, and vadose zone. When reaching the cave, these pathways
have inlets with different airflow rates and different pCO2. In most situations, the air from different inlets
mixes in the cave and individual contributions are not easily observed. We have found that in the case of
Pisani Passage, a dead-end side passage of Postojna Cave, the specific configuration of the inlets and
the position of the outflow from the Red Hall/White Hall terminal chamber produces vertically-stratified
compartments with different airflow pathways well separated. The upper compartment has a high airflow
rate and low pCO2 inputs, while the lower compartment has low airflow rates and high pCO2 inputs. This
leads to a strong vertical gradient of pCO2, which is quickly restored after forced or natural mixing caused
by the reversal of the airflow direction. On cold days, there is usually strong air mixing in the chamber and
the corresponding gradient is negligible. In exceptional cases, pCO2 stratification may also occur during
cold periods, which we have found to be related to the wind-pressure effect of north-easterly gusts. These
strong gusts suppress the chimney effect and turn the updraft toward a downdraft, restoring the pCO2
stratification. Outside winds also influence the larger-scale cave ventilation by increasing or decreasing
cave ventilation depending on their direction and the direction of the air density-driven ventilation, which
results in high frequency variations in the cave airflow time series. Our preliminary observations suggest
that long periods of an environment with high-CO2 content near the cave floor can have a large influence
on the hydrochemistry of drip water. The results of this study imply the need for a thorough assessment
of the cave environment at a micro-local level in order to increase the reliability of paleoclimatic,
Page 16/34geochemical or similar cave research, but also to ensure the safety of visitors in frequently visited show
caves.
Declarations
Funding
The research was partially funded by the project “Methodology for monitoring the sustainable use of
karst show caves with automatic measurements – role model – Postojna cave” (L6-9397), which was
financially supported by the Slovenian Research Agency. The work of LK was supported by the Young
Researchers Programme of the Slovenian Research Agency.
Conflicts of interest/Competing interests
Not applicable.
Availability of data and material
Available from the authors upon request..
Code availability
Not applicable.
Authors' contributions
Lovel Kukuljan, Franci Gabrovšek and Vanessa E. Johnston designed the study, collected data, and
maintained the instruments of the study sites. The data analysis and graphic presentation was carried
out by Lovel Kukuljan and Franci Gabrovšek. Vanessa E. Johnston and Matthew D. Covington proofread
and corrected the manuscript. All authors have read and approved the final version of the manuscript.
Acknowledgements
We thank Boštjan Grašič and Primož Mlakar for setting up and maintaining the monitoring system in
Postojna Cave.
Electronic Supplementary Material
The online link to the electronic supplementary material of this article will be available after the final
revision of the manuscript.
Ethics approval
Not applicable.
Consent to participate
Page 17/34Not applicable.
Consent for publication
Not applicable.
References
1. Appelo T, Postma D (2005) Geochemistry, groundwater and pollution (Second Edition)
2. ARSO (2021) Ministry of the environment and spatial planning, Slovenian Environmental Agency.
http://meteo.arso.gov.si/met/en/. Accessed 6 May 2021
3. ARSO (2020) Ministry of the environment and spatial planning, Slovenian Environmental Agency.
http://gis.arso.gov.si/evode/profile.aspx?id=atlas_voda_Lidar@Arso. Accessed 2 Jul 2020
4. Atkinson TC (1977) Carbon dioxide in the atmosphere of the unsaturated zone: An important control
of groundwater hardness in limestones. J Hydrol 35:111–123. https://doi.org/10.1016/0022-
1694(77)90080-4
5. Badino G (2005) Underground drainage systems and geothermal flux. Acta Carsologica 34:277–316.
https://doi.org/10.3986/ac.v34i2.261
6. Badino G (2010) Underground meteorology - “What’s the weather underground?” Acta Carsologica
39:427–448
7. Baldini JUL (2010) Cave atmosphere controls on stalagmite growth rate and palaeoclimate records.
In: Pedley HM, Rogerson M (eds) Tufas and Speleothems: Unravelling the Microbial and Physical
Controls, 336th edn. Geological Society of London, London, pp 283–294
8. Baldini JUL, Baldini LM, McDermott F, Clipson N (2006) Carbon dioxide sources, sinks, and spatial
variability in shallow temperate zone caves: Evidence from Ballynamintra Cave, Ireland. J Cave Karst
Stud 68:4–11
9. Baldini JUL, Bertram RA, Ridley HE (2018) A first approximation of the Earth’s second largest
reservoir of carbon dioxide gas. Sci Total Environ 616–617:1007–1013.
https://doi.org/10.1016/j.scitotenv.2017.10.218
10. Baldini JUL, McDermott F, Hoffmann DL, et al (2008) Very high-frequency and seasonal cave
atmosphere PCO2 variability: Implications for stalagmite growth and oxygen isotope-based
paleoclimate records. Earth Planet Sci Lett 272:118–129. https://doi.org/10.1016/j.epsl.2008.04.031
11. Batiot-Guilhe C, Seidel J-L, Jourde H, et al (2007) Seasonal variations of CO₂ and 222Rn in a
mediterranean sinkhole - spring (Causse d’Aumelas, SE France). Int J Speleol 36:51–56.
https://doi.org/10.5038/1827-806x.36.1.5
12. Benavente J, Vadillo I, Carrasco F, et al (2010) Air carbon dioxide contents in the vadose zone of a
Mediterranean karst. Vadose Zo J 9:126–136. https://doi.org/10.2136/vzj2009.0027
13. Benavente J, Vadillo I, Liñán C, et al (2015) Influence of the ventilation of a karst show cave on the
surrounding vadose CO2 reservoir (Nerja, South Spain). Environ Earth Sci 74:7731–7740.
Page 18/34https://doi.org/10.1007/s12665-015-4709-8
14. Bergel SJ, Carlson PE, Larson TE, et al (2017) Constraining the subsoil carbon source to cave-air CO2
and speleothem calcite in central Texas. Geochim Cosmochim Acta 217:112–127.
https://doi.org/10.1016/j.gca.2017.08.017
15. Blatnik M, Mayaud C, Gabrovšek F (2019) Groundwater dynamics between planinsko polje and
springs of the ljubljanica river, Slovenia. Acta Carsologica 48:199–226.
https://doi.org/10.3986/ac.v48i2.7263
16. Blecha M, Faimon J (2014) Karst soils: Dependence of CO2 concentrations on pore dimension. Acta
Carsologica 43:55–64
17. Borsato A, Frisia S, Miorandi R (2015) Carbon dioxide concentration in temperate climate caves and
parent soils over an altitudinal gradient and its influence on speleothem growth and fabrics. Earth
Surf Process Landforms 40:1158–1170. https://doi.org/10.1002/esp.3706
18. Bourges F, Genty D, Perrier F, et al (2020) Hydrogeological control on carbon dioxide input into the
atmosphere of the Chauvet-Pont d’Arc cave. Sci Total Environ 716:.
https://doi.org/10.1016/j.scitotenv.2020.136844
19. Breecker DO, Payne AE, Quade J, et al (2012) The sources and sinks of CO2 in caves under mixed
woodland and grassland vegetation. Geochim Cosmochim Acta 96:230–246.
https://doi.org/10.1016/j.gca.2012.08.023
20. Covington MD (2016) 8. The importance of advection for CO2 dynamics in the karst critical zone: An
approach from dimensional analysis. In: Feinberg JM, Gao Y, Alexander Jr. EC (eds) Caves and Karst
Across Time. Geological Society of America, p 0
21. Covington MD, Knierim KJ, Young HA, et al (2021) The impact of ventilation patterns on calcite
dissolution rates within karst conduits. J Hydrol 593:125824.
https://doi.org/10.1016/j.jhydrol.2020.125824
22. Covington MD, Knierim KJ, Young HA, et al (2020) Cave airflow patterns control calcite dissolution
rates within a cave stream: Blowing Springs Cave, Arkansas, USA. In: EarthArXiv.
https://eartharxiv.org/t7a4q/. Accessed 22 Jun 2020
23. Covington MD, Perne M (2015) Consider a cylindrical cave: A physicist’s view of cave and karst
science. Acta Carsologica 44:363–380. https://doi.org/10.3986/ac.v44i3.1925
24. Cowan BD, Osborne MC, Banner JL (2013) Temporal variability of cave-air CO2 in central Texas. J
Cave Karst Stud 75:38–50. https://doi.org/10.4311/2011ES0246
25. Cuezva S, Fernandez-Cortes A, Benavente D, et al (2011) Short-term CO2(g) exchange between a
shallow karstic cavity and the external atmosphere during summer: Role of the surface soil layer.
Atmos Environ 45:1418–1427. https://doi.org/10.1016/j.atmosenv.2010.12.023
26. Domínguez-Villar D, Lojen S, Krklec K, et al (2015) Is global warming affecting cave temperatures?
Experimental and model data from a paradigmatic case study. Clim Dyn 45:569–581.
https://doi.org/10.1007/s00382-014-2226-1
Page 19/34You can also read