Monitoring tidal hydrology in coastal wetlands with the "Mini Buoy": applications for mangrove restoration
←
→
Page content transcription
If your browser does not render page correctly, please read the page content below
Hydrol. Earth Syst. Sci., 25, 1229–1244, 2021
https://doi.org/10.5194/hess-25-1229-2021
© Author(s) 2021. This work is distributed under
the Creative Commons Attribution 4.0 License.

Monitoring tidal hydrology in coastal wetlands with the
“Mini Buoy”: applications for mangrove restoration
Thorsten Balke1 , Alejandra Vovides1 , Christian Schwarz2 , Gail L. Chmura3 , Cai Ladd1 , and Mohammad Basyuni4
1 Schoolof Geographical and Earth Sciences, University of Glasgow, Glasgow, G12 8QQ, United Kingdom
2 Schoolof Marine Science and Policy, University of Delaware, Lewes, 19958 DE, United States
3 Department of Geography, Mc Gill University, Montreal, QX H3A 0B9, Canada
4 Department of Forestry, Faculty of Forestry, Universitas Sumatera Utara, Medan 20155, Indonesia

Correspondence: Thorsten Balke (thorsten.balke@glasgow.ac.uk)

Received: 4 November 2020 – Discussion started: 4 December 2020
Revised: 9 February 2021 – Accepted: 9 February 2021 – Published: 11 March 2021

Abstract. Acquiring in situ data of tidal flooding is key          1     Introduction
for the successful restoration planning of intertidal wetlands
such as salt marshes and mangroves. However, monitoring            1.1    Tidal flooding and coastal wetlands
spatially explicit inundation time series and tidal currents can
be costly and technically challenging. With the increasing         Tidal flooding is the main driver of species distribution
availability of low-cost sensors and data loggers, customized      and ecosystem functioning in intertidal wetlands (i.e. salt
solutions can now be designed to monitor intertidal hydrody-       marshes and mangroves). Inundation determines the compo-
namics with direct applications for restoration and manage-        sition of plant communities through physiological inundation
ment.                                                              and salt-tolerance limits, soil anoxia, and altered competitive
   In this study, we present the design, calibration, and appli-   ability along the tidal flooding gradient (Bockelmann et al.,
cation of the “Mini Buoy”, a low-cost underwater float con-        2002; Jiménez et al., 1991; van Loon et al., 2007; Matthijs
taining an acceleration data logger for monitoring tidal in-       et al., 1999; Pennings and Callaway, 1992; Silvestri et al.,
undation characteristics and current velocities derived from       2005). Tidal currents can disperse propagules (Delgado et
single-axis equilibrium acceleration (i.e. logger tilt).           al., 2001; Koch et al., 2009; Van der Stocken et al., 2013;
   The acceleration output of the Mini Buoys was calibrated        Wiehe, 1935) and dislodge seedlings when drag forces ex-
against water-level and current-velocity data in the hypertidal    ceed the stability threshold of rooted seedlings (Balke et al.,
Bay of Fundy, Canada, and in a tidally reconnected former          2011, 2014; Wiehe, 1935; Xiao et al., 2016). Interactions
aquaculture pond complex in North Sumatra, Indonesia. Key          between tidal currents and the friction created by vegeta-
parameters, such as submersion time and current velocities         tion (Bouma et al., 2013; Schwarz et al., 2018; Temmer-
during submergence, can be determined over several months          man et al., 2007) determine the evolution of intertidal land-
using the Mini Buoy. An open-source application was devel-         scapes through flow routing and altered sedimentation pat-
oped to generate ecologically meaningful hydrological in-          terns (i.e. biogeomorphic feedbacks). Monitoring flooding
formation from the Mini Buoy data for mangrove restora-            gradients and tidal currents is not only key to understanding
tion planning. We present this specific SE Asian mangrove          intertidal wetland functioning but is also a prerequisite for
restoration application alongside a flexible concept design        the design and monitoring of successful restoration projects
for the Mini Buoy to be customized for research and man-           in the intertidal zone (Lewis, 2005; Primavera and Esteban,
agement of intertidal wetlands worldwide.                          2008; Wolters et al., 2005). Mangrove restoration projects
                                                                   in particular have shown low success rates due to the lack
                                                                   of hydrological site assessments prior to restoration (Pri-
                                                                   mavera and Esteban, 2008; Wodehouse and Rayment, 2019).
                                                                   Here, we present the design, calibration, and application of

Published by Copernicus Publications on behalf of the European Geosciences Union.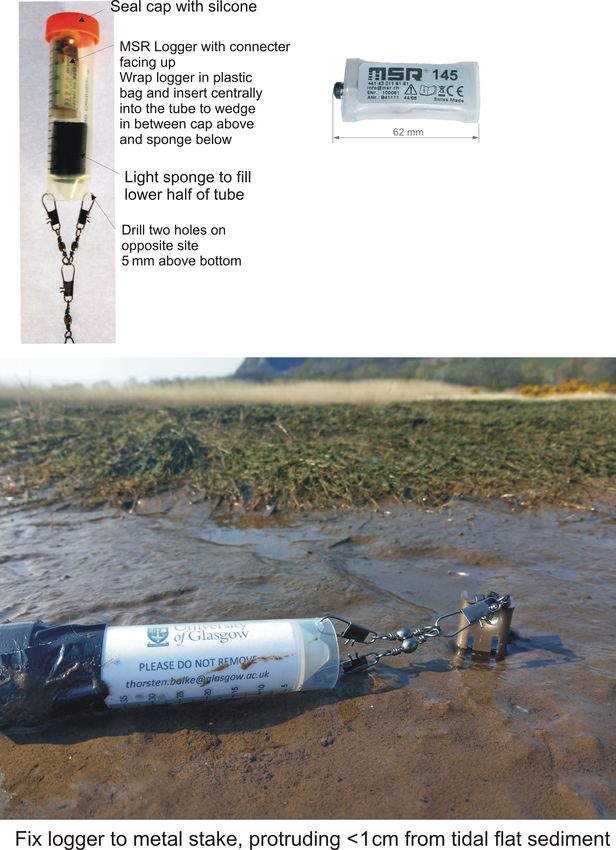
1230                                   T. Balke et al.: Monitoring tidal hydrology in coastal wetlands with the “Mini Buoy”

a bottom-mounted underwater float equipped with an accel-              Proisy et al. (2018) note that large-scale mangrove restora-
eration data logger (from here on referred to as the “Mini          tion across disused and abandoned aquaculture ponds re-
Buoy”) to monitor inundation duration and current veloci-           quires the assessment of elevations and hydrological con-
ties in intertidal environments with a specific application for     ditions in each individual pond, since conditions can differ
SE Asian mangrove restoration.                                      greatly depending on the site history. Hydrological site as-
                                                                    sessments in such complex anthropogenic tidal landscapes
1.2    Hydrological and hydrodynamic bottlenecks to                 can thus quickly become costly and time-demanding. Man-
       mangrove restoration                                         grove restoration manuals do acknowledge the need to as-
                                                                    sess site-specific tidal flooding and hydrodynamic exposure
Assessing the local hydrology prior to mangrove restoration         and propose practical “low-tech” solutions for their quantifi-
is needed to determine whether conditions are too harsh for         cation. A manual published by the Mangrove Action Project,
seedlings to survive and need to be mitigated (Albers and           for example, advocates measuring the elevation of a restora-
Schmitt, 2015) or whether insufficient flooding may lead to         tion site (using optical levelling equipment or a hose water
hypersalinity or succession towards terrestrial plant commu-        level) against known references such as local tide gauges or
nities (Lewis, 2005). One of the main reasons for mangrove          elevations of nearby mangrove stands (Lewis and Brown,
deforestation in the past, and hence one of the major oppor-        2014). Semi-quantitative methods to assess hydrodynamic
tunities for mangrove restoration today, is aquaculture ponds       exposure, such as gypsum clod cards, are also proposed
(Dale et al., 2014; Primavera and Esteban, 2008). Breach-           (Lewis and Brown, 2014). These methods are low-cost and
ing the embankments of such ponds, built within previous            locally implementable, but not all are quantitative, scalable,
mangrove forests, is an effective way to restore mangrove           or comparable across mangrove environments. We propose
forests. However, previous excavation of sediment and al-           that monitoring tidal inundation and hydrodynamic exposure
tered tidal channels and remaining weirs may have altered the       using accelerometer technology could be an affordable, glob-
hydrology. Hence spatially explicit monitoring of inundation        ally available, and quantitative method to assess hydrological
durations is required prior to attempting mangrove restora-         site suitability for mangrove restoration.
tion (Dale et al., 2014). Especially stagnant water and in-
hibited drainage can locally create restoration bottlenecks in      1.4   Accelerometer technology to monitor tidal currents
abandoned tidal pond complexes. At hydrodynamically ex-
posed sites, where current velocities are able to dislodge re-      Accelerometer technology is widely used, from measuring
cently rooted mangrove propagules, inundation-free periods          shock and triggering safety air bags in the transport indus-
of several days provide a window of opportunity (WoO) to            try (MacDonald, 1990) to quantifying the physical activity
surpass critical establishment thresholds (Balke et al., 2011,      of humans (Beanland et al., 2014; Passfield et al., 2017) and
2014). WoO are particularly important to assess in unassisted       analysing particle movement in geosciences (Akeila et al.,
restoration projects to predict suitability for natural coloniza-   2010). Equilibrium acceleration data from two axes relative
tion by mangrove pioneer species.                                   to the gravity vector can be used for precise tilt measure-
                                                                    ments of objects. This principle is used in dip-current meters
1.3    Monitoring tidal inundation and currents
                                                                    which relate the tilt of a bottom-mounted float with current
Inundation frequency and duration of tidal wetlands are gen-        velocities and the drag forces exerted on the float (Figurski et
erally derived from nearby tide gauges or in situ pressure-         al., 2011; Hansen et al., 2017). A similar single-axis acceler-
sensor deployments. The data are then projected onto digital        ation tilt calculation principle (i.e. the acceleration relative
elevation models or transects derived from levelling. Tidal         to the horizontal plane relates to the sine of the tilt angle) was
current velocity is typically monitored using electromagnetic       applied here to determine inundation of the Mini Buoy and to
flow meters (EMFs), acoustic Doppler velocimeters (ADVs),           correlate equilibrium acceleration of the Mini Buoy with cur-
or acoustic Doppler current profilers (ADCPs) (see, for ex-         rent velocities (Fig. 1). For a detailed description of the indi-
ample, Mullarney et al., 2017). The need for existing mon-          vidual forces acting on bottom-mounted floats, see Figurski
itoring infrastructure and specialist equipment and knowl-          et al. (2011). Commercial dip-current meters have recently
edge means that capacity for hydrological and hydrodynamic          become available; however, to the best of our knowledge,
monitoring may not always be readily available for restora-         they do not routinely include the analysis of flooding char-
tion practitioners. Hydrodynamic time series data are also          acteristics for intertidal applications and are still costly com-
often limited in their duration due to the high demand for          pared to the described setup with off-the-shelf components.
storage and battery capacity or due to concerns over theft or       Moreover, commercial dip-current meters with a fixed cali-
damage during storms. Hence long-term variability, rare dis-        bration cannot be customized. Adding additional sensors (as
turbance events, or stochastic WoO in coastal wetlands are          shown here, for example, a temperature sensor) or changing
often missed.                                                       the shape and size of the float and length of the tether offers
                                                                    flexibility for the application in different environments. The
                                                                    single-axis tilt calculation principle offers the benefit of re-

Hydrol. Earth Syst. Sci., 25, 1229–1244, 2021                                        https://doi.org/10.5194/hess-25-1229-2021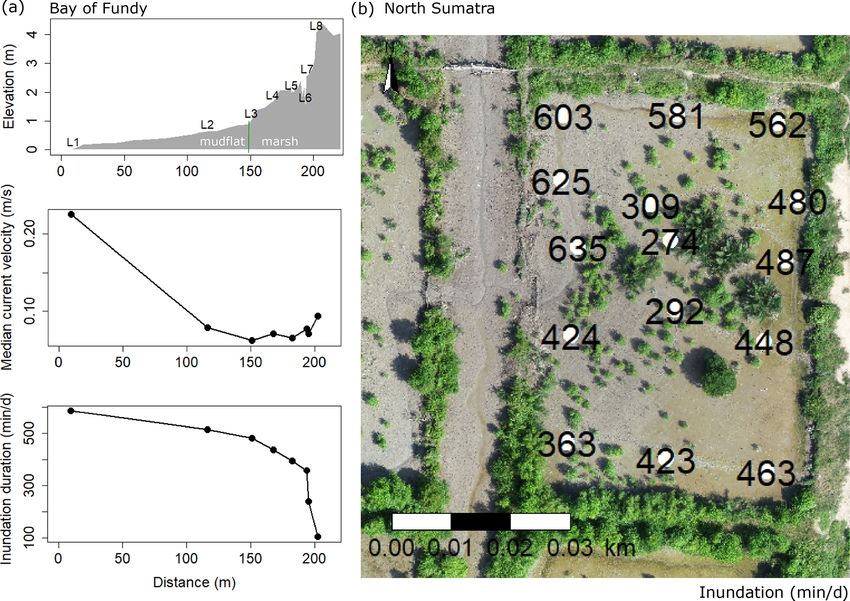
T. Balke et al.: Monitoring tidal hydrology in coastal wetlands with the “Mini Buoy”                                                   1231

                                                                           standing 50 mL centrifuge tube (CentriStar, Corning), and
                                                                           three fishing swivels (see Figs. 1a and A1 and Table A2 for a
                                                                           detailed description; overall weight = 42.3 g, displaced vol-
                                                                           ume = 70 mL, and length of tube + swivels = 21.5 cm). Ad-
                                                                           ditional loggers can fit on top of the tube such as the HOBO
                                                                           MX2202 temperature and light sensor (see photo in Fig. 1
                                                                           as used in the Bay of Fundy deployment). The Mini Buoy is
                                                                           anchored near the sediment surface and will float up when
                                                                           submerged and dip into the current according to the veloc-
                                                                           ity magnitude near the bed. The acceleration data logger in-
                                                                           side the Mini Buoy records gravitational acceleration as G-
                                                                           forces (g) along the three axes of the tube relative to the grav-
                                                                           ity vector. Only y-axis acceleration was used in this study;
                                                                           hence any single-axis acceleration logger can be used for the
                                                                           Mini-Buoy. The MSR 145 B4A accelerometer (MSR Elec-
                                                                           tronics GmbH, Switzerland) used in this study has a capacity
                                                                           of 2 million measurements and an internal rechargeable bat-
                                                                           tery. The data recording for x-axis and z-axis acceleration
                                                                           can be inactivated to increase storage capacity of the device.
                                                                           The sensitivity of the logger was set to 2g. The USB connec-
                                                                           tor of the logger was facing upward in the tube; hence y ac-
                                                                           celeration was 0g when the logger was stationary in a hori-
Figure 1. (a) Movements of a small bottom-mounted float (the Mini
                                                                           zontal (not submerged) position and −1g when (submerged)
Buoy) equipped with an acceleration data logger during high and
low tide. Single-axis equilibrium acceleration (i.e. tilt) of the buoy
                                                                           in a vertical position (Fig. 1). The time-averaged (i.e. equi-
was calibrated against water-level and current-velocity data using an      librium) y-axis acceleration output of the sensor (Yacc ) cor-
acoustic Doppler current meter (pictured). The Mini Buoy consists          responds to the tilt angle (θ ) of the sensor relative to the hor-
of a flat-bottom centrifuge tube which is tethered to the tidal flat us-   izontal plane (i.e. orthogonal to the gravity vector) following
ing fishing swivels and a metal stake. The acceleration data logger        Eq. (1):
is a self-contained unit with internal battery and storage. Single-axis
equilibrium acceleration (with y-axis acceleration = −1g when ver-         Yacc [g] = −1g × sin(θ ).                                     (1)
tical, i.e. flooded, and 0g when horizontal, i.e. not flooded) corre-
lates with the sine of the data logger tilt relative to the horizontal     Y -axis acceleration was acquired every second for short-term
plane. (b) Additional data loggers for temperature and light can be        deployments (several days) and every 10 s for long-term de-
attached on top of the Mini Buoy. Further details on dimensions and        ployments (single deployments of approx. 5 months are pos-
logger specifications are available in the Appendix.                       sible). We have chosen the described setup as the loggers,
                                                                           tube, and tether are globally available, and the selected data
                                                                           logger itself has a waterproof housing and sufficiently large
duced data storage requirements (i.e. increased deployment                 internal data storage for deployments across multiple spring–
durations) and the potential application of more economic                  neap tidal cycles.
sensors.
   Here we describe the Mini Buoy, primarily as a design                   2.2     Field sites
concept for the low-cost monitoring of abiotic conditions
in periodically inundated intertidal ecosystems. We further                2.2.1    Bay of Fundy (Canada)
present a fully calibrated Mini Buoy design with an open-
source online data analysis application to assess tidal flood-             A short-term deployment of 9 d using eight Mini Buoys (L1–
ing (inundation and current velocities) for ecological man-                L8) measuring acceleration at 1 Hz was carried out along
grove restoration planning with reference to habitat require-              a tidal flat to salt marsh transect in the Bay of Fundy,
ments of SE Asian mangrove species.                                        Canada (45◦ 470 6.8000 N, 64◦ 370 17.3000 W). The Mini Buoys
                                                                           in the Bay of Fundy were also fitted with a HOBO MX2202
                                                                           temperature and light sensor on top of the centrifuge tube
2     Methods                                                              (Fig. 1b). Measurements commenced on 9 June and ended
                                                                           on 17 June 2018. A Nortek Aquadopp 300 m current meter
2.1    The Mini Buoy setup                                                 was installed 5 m seaward of Mini Buoy L1 for calibration. In
                                                                           addition, a pressure sensor (In- Situ Rugged TROLL) mea-
The Mini Buoy consists of three readily available off-                     sured continuously at 1 Hz, and on-site barometric pressure
the-shelf components: an acceleration data logger, a self-                 correction was carried out using a second logger. The eleva-

https://doi.org/10.5194/hess-25-1229-2021                                                 Hydrol. Earth Syst. Sci., 25, 1229–1244, 2021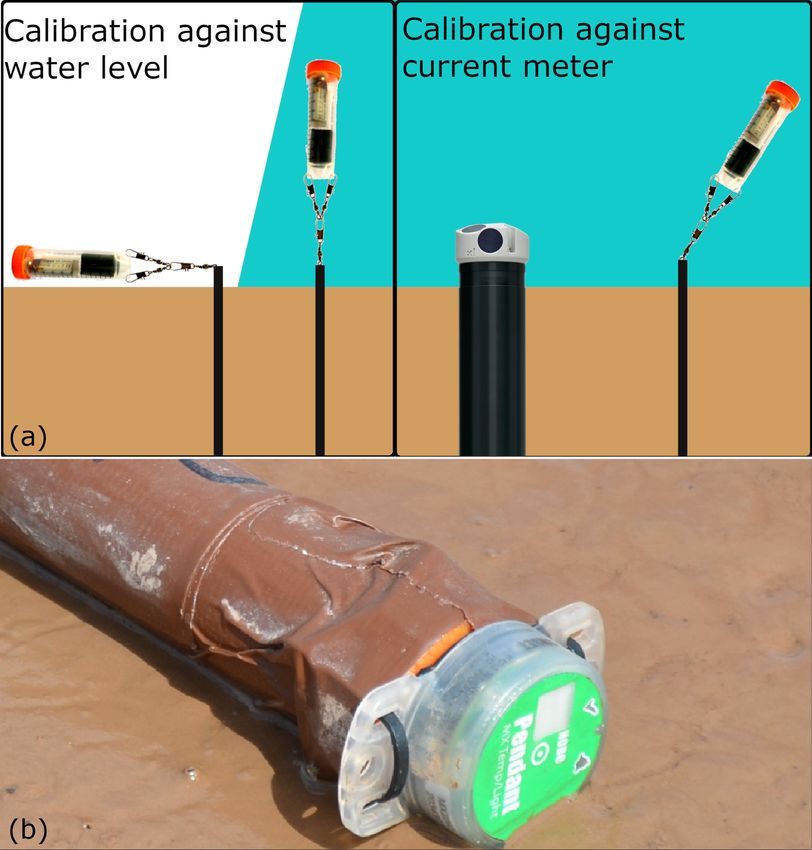
1232                                   T. Balke et al.: Monitoring tidal hydrology in coastal wetlands with the “Mini Buoy”

tions along the transect were surveyed using an Emlid Reach         2.3   Training dataset to predict Mini Buoy inundation
View differential GPS rover with real-time kinematic posi-
tioning. The vegetation along the transect was < 10 cm in           Linear discriminant analysis (LDA) with R packages MASS
height and sparse enough for the logger to rest horizontally        (Venables and Ripley, 2002) and klaR (Weihs et al., 2005)
on the sediment surface when not inundated (L4–L8 are lo-           was used to differentiate inundated time steps from non-
cated within the marsh). Metal rods were used to anchor the         inundated time periods using the acceleration data. The LDA
Mini Buoys in place. This site serves as a test of the Mini         is a machine learning tool that requires a training dataset
Buoy design concept in very energetic hypertidal conditions.        (i.e. inundation time series at the Mini Buoy location) to then
                                                                    predict inundation events for other Mini Buoys and time pe-
2.2.2   North Sumatra (Indonesia)                                   riods. This approach was chosen as it can be directly ap-
                                                                    plied to other Mini-Buoy designs that may have different
Short-term deployment sites                                         buoyancy, dimensions, and data loggers. Mini-Buoys clos-
                                                                    est to the Aquadopp current meter and pressure sensor (L2–
A short-term deployment of 7 d was carried out along the
                                                                    L5 at the Bay of Fundy and B9, B11, B12, and B14 in
east coast of North Sumatra (Fig. 2b; Percut Sei Tuan,
                                                                    North Sumatra) were selected to generate a training dataset at
Deli Serdang) starting on 27 November 2019. A total of
                                                                    1 min resolution containing flooded and non-flooded classes
15 Mini Buoys (B2–B16) measured acceleration at 1 Hz in-
                                                                    based on water-level and elevation data. For North Suma-
side an abandoned, naturally recolonizing, aquaculture pond
                                                                    tra, water-level data were linearly interpolated to 1 min fre-
(3◦ 430 22.8600 N, 98◦ 460 15.2900 E). This pond is connected
                                                                    quency using the Aquadopp pressure sensor diagnostic out-
through constructed tidal channels to the main estuary and
                                                                    put, and water-level data were generated directly from a sep-
partially recolonized by Avicennia spp., Rhizophora spp., and
                                                                    arate pressure data logger at 1 min frequency at the Bay of
Nypa fruticans. This site was transformed into aquaculture
                                                                    Fundy. The Mini Buoys were considered “flooded” when
ponds in 2002 and subsequently abandoned. One main chan-
                                                                    fully submerged (i.e. bed elevation + 20 cm). The LDA then
nel directly connects the study pond to the surrounding ponds
                                                                    separated and predicted flooded and non-flooded cases using
and the estuary through a previously breached embank-
                                                                    1 min median y acceleration and the difference between the
ment. The channel was equipped with an additional Mini
                                                                    1 min 75th and 25th percentile of the y acceleration (i.e. the
Buoy (B1) which was calibrated using an upward-facing
                                                                    variability of y-axis measurements) as predictor variables.
Nortek Aquadopp 300 m current meter located 5 m north of
                                                                    The klaR package provides apparent error rates (i.e. the pro-
Mini Buoy B1 (Fig. 2b; see also “channel” deployment in
                                                                    portion of observed cases incorrectly predicted), and addi-
Fig. 6). The logger elevations of B9, B11, B12, and B14 in
                                                                    tional cross-validation using LDA predictions for a subset of
relation to the pressure sensor of the current meter were es-
                                                                    Mini Buoys was carried out. The generated LDAs were used
tablished using a Leica optical level. An aerial image was ac-
                                                                    to predict all Mini Buoy inundation classifications (L1–L8
quired using a DJI Phantom 4, and Mini Buoy locations were
                                                                    and B2–B16) to create time series of inundation characteris-
mapped using ground targets. An additional short-term Mini
                                                                    tics and subsequently predict current velocities.
Buoy was placed on a tidal flat facing the open coast directly
seaward of colonizing Avicennia marina seedlings (“Open
                                                                    2.4   Mini-Buoy calibration against current velocity
coast” deployment in Fig. 6 (3◦ 440 1.5500 N, 98◦ 460 31.3400 E).

Long-term deployment sites                                          At both study sites an Aquadopp 300 m current meter
                                                                    (Nortek) was installed with the measurement head 20 cm
Long-term deployments of approximately 50 d were con-               above the sediment surface. The blanking distance was set
ducted at three locations: (i) North Sumatra at an aban-            to 35 cm, and the device measured in diagnostic mode with
doned pond in Percut Sei Tuan, where tidal regulation with a        1025 sample bursts every hour at 1 Hz (internal sampling
sluice system was still partially active (deployment “Aban-         rate = 23 Hz). Median y acceleration over a 1 min period for
doned pond 1” in Fig. 6: 3◦ 430 33.7700 N, 98◦ 460 22.7000 E;       both Mini Buoys (L1 at Bay of Fundy and B1 in North Suma-
7 October 2019); (ii) at the Percut Sei Tuan short-term             tra) was correlated with the median current velocities for both
study site described above (see “long-term” logger nested           horizontal velocity axes over a 1 min period.
within the short-term deployment in Fig. 2b), which was                The site- and design-specific calibration curves were fur-
exposed to regular tidal inundation (“Abandoned pond 2”             ther used to predict current velocities for all deployed Mini
in Fig. 6: 3◦ 430 23.8600 N, 98◦ 460 14.7800 E; 7 October–          Buoys (Fig. 2). In order to separate individual high-tide
26 November 2019); and (iii) at a recent restoration site           events for each Mini Buoy, inundation events were separated
at Belawan with active planting of Rhizophora apiculata             whenever no inundation occurred for at least 100 min. As
in May 2019 (“Pond restoration” in Fig. 6: 3◦ 450 15.7400 N,        partially inundated Mini Buoys during early phase of sub-
98◦ 420 22.4300 E; 9 October–26 November 2019).                     mergence or late stages of emergence may create inaccurate
                                                                    velocity predictions, a buffer time period at the start and end
                                                                    of each high tide was implemented. The first and last 10 min

Hydrol. Earth Syst. Sci., 25, 1229–1244, 2021                                        https://doi.org/10.5194/hess-25-1229-2021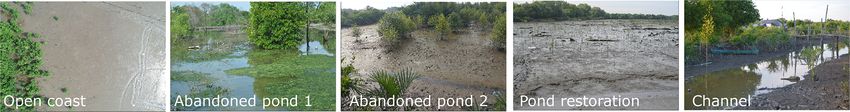
T. Balke et al.: Monitoring tidal hydrology in coastal wetlands with the “Mini Buoy” 1233
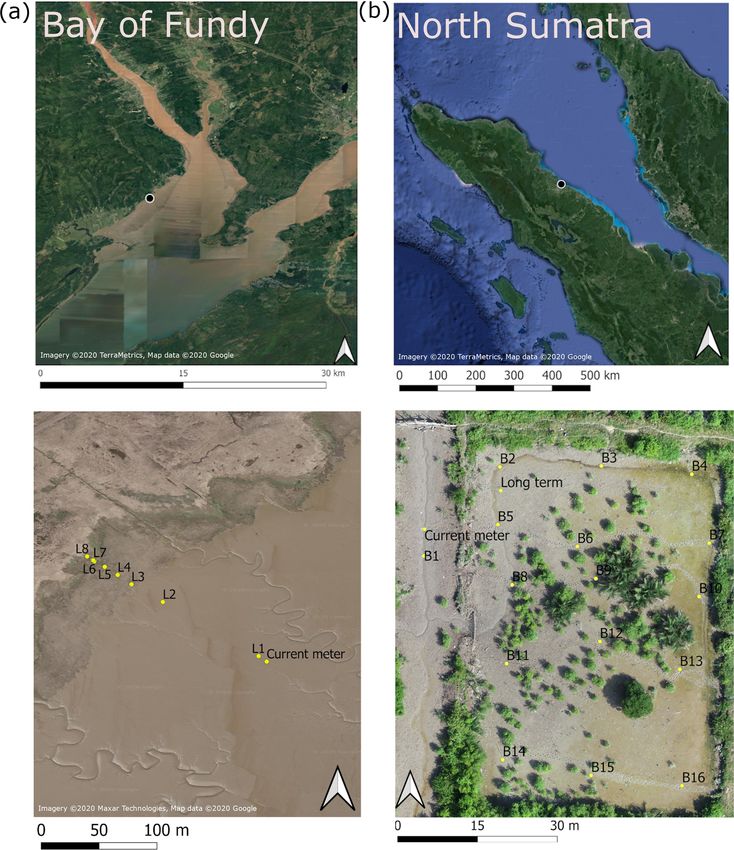
Figure 2. (a) The study sites in the Bay of Fundy, Canada, with eight Mini Buoys with a temperature and light sensor (see Fig. 1b) deployed
along an elevational transect. L1 and L2 are located on the tidal flat, L3 is at the marsh edge, and L4–L8 are within the salt marsh (bottom left).
(b) The short-term study site in Percut Sei Tuan, North Sumatra, Indonesia, with 16 Mini Buoys (B1–B16) deployed across an abandoned
aquaculture pond that was naturally recolonized by mangrove plants (drone image on bottom right). Both study sites were equipped with a
Nortek Aquadopp current meter close to L1 and B1 to calibrate the Mini Buoys. Maps were created using © QGIS.
of each predicted tide for Bay of Fundy data and 50 min 3 Results
for the North Sumatra time series were not used for veloc-
ity predictions. This buffer duration was based on the time it 3.1 Flooding and current-velocity calibration
takes for the tide to rise and fall by 20 cm (i.e. the Mini Buoy
height) at each site, as estimated from water-level measure-
ments. Inundation durations were calculated from the pre- The LDA separated the Mini Buoy data in inundated and
dicted inundation categories using the LDA, and each high non-inundated time steps with apparent error rates of 0.008
tide event was separated into two equal halves to separate ap- for merged L2–L5 Mini Buoy data (Bay of Fundy) and
proximate flood and ebb tides. Overall current velocities for of 0.015 for merged B9, B11, B12, and B14 Mini Buoy
the entire monitoring period were predicted as median val- data (North Sumatra) (Fig. 3a). Using Mini Buoy data of L2
ues and 75th percentiles to reduce the influence of outliers and L3 as a training dataset to predict L4 inundation classi-
(e.g. due to passing boats, waves, or turbulence). fication with the LDA at 1 min intervals at the Bay of Fundy
transect produced 1.57 % false predictions. Cross-validating
predictions with an LDA generated from B11 and B12 to
predict B14 at the North Sumatra site produced 1.4 % false
https://doi.org/10.5194/hess-25-1229-2021 Hydrol. Earth Syst. Sci., 25, 1229–1244, 2021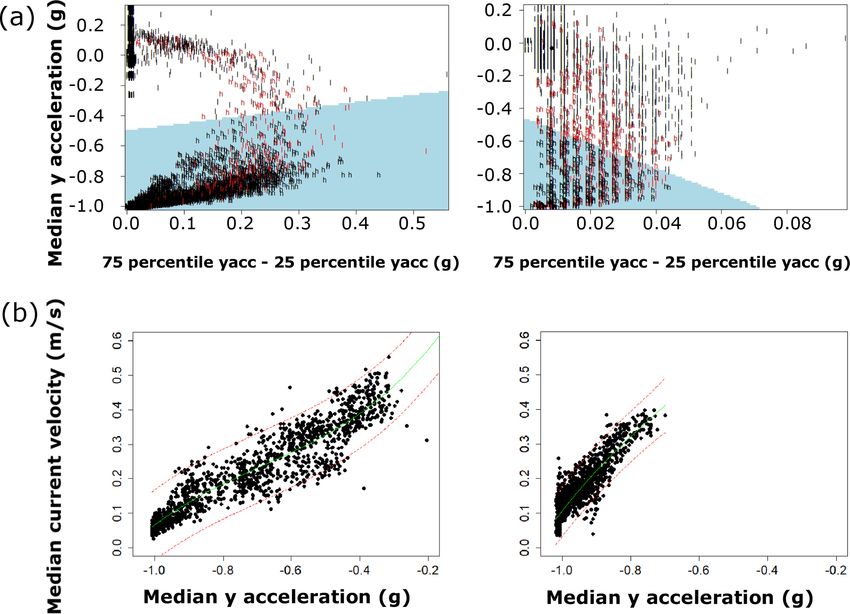
1234                                  T. Balke et al.: Monitoring tidal hydrology in coastal wetlands with the “Mini Buoy”

predictions when validated against water-level classification.     cess: 9 March 2021). The shorter inundation durations gen-
The variability of the y-axis acceleration within the 1 min        erally corresponded to the more densely recolonized areas
time step (i.e. differences between the 75th and 25th per-         of the abandoned pond, whereas the southeast corner of the
centile of y acceleration) was different between both field        pond and the channel with inundation durations exceeding
sites. Percentile ranges of up to 0.5g were recorded at the        460 min d−1 showed a lack of recolonization by mangrove
Bay of Fundy; the Mini Buoy within the tidal channel in            trees (Fig. 5b). However, these are short-term assessments
North Sumatra showed values of up to 0.08g. This is likely         to test the Mini Buoy performance, and further investiga-
attributed to the more dynamic conditions at the Bay of            tion into inundation durations should be carried out across
Fundy, where significant wave heights calculated from the          spring–neap cycles as described in Sect. 3.2.
Aquadopp data reached 0.73 m during the monitoring period.            All Mini Buoy acceleration data, temperature and light
Mini Buoys deployed further away from the pressure sensor          data, and Aquadopp data are available online (https://zenodo.
were not considered for calibration as the local water lev-        org/record/4521304, last access: 9 March 2021).
els may be influenced by local flooding and draining pattern
through tidal channels.                                            3.2     Hydrological site assessments for mangrove
   Median current velocities for 1 min time steps at both lo-              restoration in SE Asia using the Mini Buoy
cations correlated with median y-axis acceleration over the                application
same time step and were best described using a third-order
polynomial regression rather than a sine function (Fig. 3b).
The polynomial fit may be attributed to a change in the            3.2.1    Development of the Mini Buoy R shiny
proportion of the sampled velocity profile (i.e. the Mini                   application
Buoy dips into faster currents and hence stays closer to
the bed when compared to low currents). The calibration            An online app, using the R package shiny (Chang et al.,
curves for both field sites show that current velocities above     2020), was created as a quick and easy way to assess lo-
∼ 0.1 m s−1 could be measured by the Mini Buoy. The Bay            cal hydrological site conditions prior to restoration of man-
of Fundy Mini Buoys fitted with a temperature and light            groves with reference to requirements of SE Asian mangrove
logger showed a slightly higher sensitivity to low veloci-         species. Acceleration data acquisition can be reduced to
ties (likely due to reduced buoyancy). Velocities measured         10 s intervals to allow for longer deployment periods across
at the Bay of Fundy reached up to 0.5 m s−1 , whereas veloc-       spring–neap tidal cycles and seasons. For calibration of low-
ities at the North Sumatra tidal channel stayed generally be-      frequency data, Mini Buoys B1, B11, and B12 were resam-
low 0.4 m s−1 . After applying the identification of individual    pled at 10 s intervals. The same analyses for inundation pre-
tides and removing the buffer time periods at the start and end    dictions using the LDA and correlation against current veloc-
of each inundation event, continuous predictions of veloci-        ities (as described above) were carried out over 15 min time
ties were achieved (see Fig. 4 for examples of tidal current       periods. Mini Buoys were considered submerged in the cal-
predictions). Averaged tidal current predictions and inunda-       ibration time series when measured water levels were above
tion durations were plotted across the elevation transect at the   the Mini Buoy for the entire 15 min period. Instead of the
Bay of Fundy and showed a rapid decrease in median current         LDA, a fixed acceleration threshold was applied to differenti-
velocities with increasing distance from the main channel          ate between flooded and non-flooded time steps. This thresh-
(Fig. 5a). An increase in median current velocities was ob-        old allows for the use of the Mini Buoy and the R shiny ap-
served at the edge of the highest salt marsh terrace compared      plication without the need to load training datasets and was
to the lower marsh elevations. Animations of the predicted         informed by the results of the LDA. The fixed threshold pre-
inundation events and current velocities are available from        dictions were further cross-validated against the LDA predic-
the online materials (https://zenodo.org/record/4521304, last      tions for Mini Buoys B11 and B12.
access: 9 March 2021).                                                The LDA using 10 s interval acceleration data for 15 min
   Predicted median current velocities within the disused          time step predictions achieved an apparent error rate of 0.017
aquaculture pond at the North Sumatra study site mostly            for Mini Buoys B11 and B12 (Fig. A3). A fixed threshold
ranged between 0.09 and 0.12 m s−1 and were thus near              of −0.5g median y-axis acceleration to separate inundated
the detection limit of this Mini Buoy design. Two buoys,           and non-inundated events was applied to replace the LDA
within the channel filling and draining the abandoned aqua-        predictions. With a fixed threshold, inundation events were
culture pond, B5 and B8, reached median velocities of              wrongly classified 2.49 % of the time when compared with
0.13 m s−1 (see Fig. 4 for B8 predictions). Inundation dura-       LDA predictions for buoys B11 and B12. Correlation be-
tion ranged between 292 and 635 min d−1 within the aban-           tween y acceleration measured by the Mini Buoys and me-
doned pond (Fig. 5b). The spatial pattern of inundation du-        dian current velocities measured by the Aquadopp current
ration showed that drainage occurred via the tidal creek in        meter in 15 min intervals was best explained using linear
the northern part of the pond (see animation of inundation         regression (Vcur = 1.173 + 1.059 · Yacc , Radj = 0.7724, P <
events online at https://zenodo.org/record/4521304, last ac-       0.05). This low-frequency calibration matches the calibration

Hydrol. Earth Syst. Sci., 25, 1229–1244, 2021                                       https://doi.org/10.5194/hess-25-1229-2021
T. Balke et al.: Monitoring tidal hydrology in coastal wetlands with the “Mini Buoy”                                                        1235

Figure 3. Training data for the Mini Buoy calibration at both study sites. (a) Linear discriminant analysis (LDA) with prediction of flooded
and non-flooded time steps of L2–L5 (Bay of Fundy, left) and B9, B11, B12, and B14 (North Sumatra, right) based on acceleration data and
validated against measured water levels. The error rate of the LDA for the Bay of Fundy was 0.008 and for North Sumatra 0.015 (l is low
tide, h is high tide, and red letters are false predictions). The blue-shaded area indicates the range of values for which inundation is predicted
by the LDA. The LDA was then used to predict inundation events for all Mini Boys. (b) Polynomial regression provided the best fit for the
median y-axis acceleration [Yacc (g)] against the measured current velocity [Vcur (m s−1 )] for 1 min intervals at both study sites. L1 Bay
                                                                                               2 = 0.84, P < 0.05; B1 North Sumatra: function
of Fundy: Vcur = Yacc 0.8812 + (1.9209 · Yacc ) + ((2.1394) · Yacc2 ) + ((1.0344) · Yacc3 ), Radj
                                                                                  2 = 0.79, P < 0.05. Dotted red lines show the 95 % prediction
Vcur = Yacc 1.488 + ((2.893) · Yacc ) + ((2.921) · Yacc2 ) + ((1.410) · Yacc3 ), Radj
intervals. Note that the Mini Buoy design differs slightly between both case studies as the Bay of Fundy design has an additional temperature
and light logger attached.

against 1 Hz acceleration data for values within the calibra-              also be used directly online via https://mangroverestoration.
tion dataset (Fig. A3).                                                    shinyapps.io/MiniBuoyApp/ (last access: 9 March 2021).
   The R shiny application calculates inundation and current-
velocity statistics for the entire monitoring period: av-                  3.2.2    Application of the Mini Buoy and the R shiny
erage high tide duration (min), average flooding dura-                              application
tion (min d−1 ), flooding frequency (d−1 ), maximum dura-
tion of WoO (d) equal to the longest inundation-free pe-                   This 15 min fixed threshold analysis as described above was
riod, median current velocity (m s−1 ), 75th percentile cur-               implemented in the R shiny app to allow for deployment
rent velocity (m s−1 ), and difference of flood–ebb median                 over longer durations and without calibration or training
velocity (m s−1 ). The R shiny application separates indi-                 datasets and is aimed at mangrove restoration practitioners
vidual inundation events (i.e. high tides) using a minimum                 in SE Asia. We applied the Mini Buoy and the R shiny
inundation-free period of 100 min and removes the first and                app across five different mangrove settings in North Suma-
last 60 min of each inundation event for current-velocity pre-             tra (Fig. 6, Table 1). None of the deployments on tidal flats
dictions to avoid misinterpretation of velocities in very shal-            within abandoned aquaculture ponds (Abandoned pond 1,
low or stagnant water. The application also allows for a com-              Abandoned pond 2, and Pond restoration site deployments)
parison with a second Mini Buoy to assess differences in                   recorded median current velocities or 75th percentile ve-
conditions between a restoration target site and a reference               locities above the detection limit. Only the short-term open
site which has the desired conditions/habitat (i.e. previously             coast and the tidal channel deployments showed 75th per-
successful restoration site or site with natural colonization              centile velocities of up to 0.2 and 0.17 m s−1 , respectively.
of the desired species). The R shiny app code and a Mini                   The Abandoned pond 1 site had prolonged periods of stag-
Buoy handbook for logger programming, field deployment,                    nant water (i.e. low-frequency and long inundation periods)
and data analysis are available via GitHub. The app can                    due to a sluice system partially in operation during the mon-

https://doi.org/10.5194/hess-25-1229-2021                                                 Hydrol. Earth Syst. Sci., 25, 1229–1244, 2021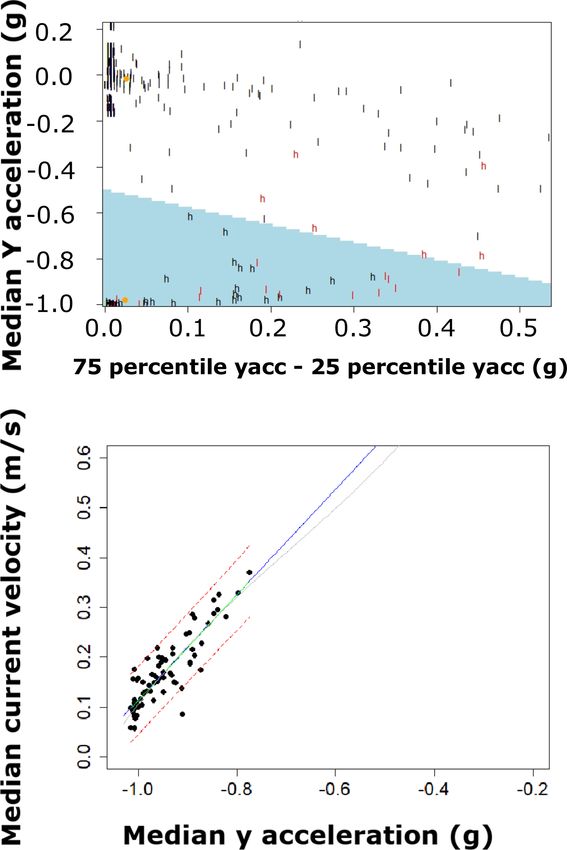
1236 T. Balke et al.: Monitoring tidal hydrology in coastal wetlands with the “Mini Buoy”
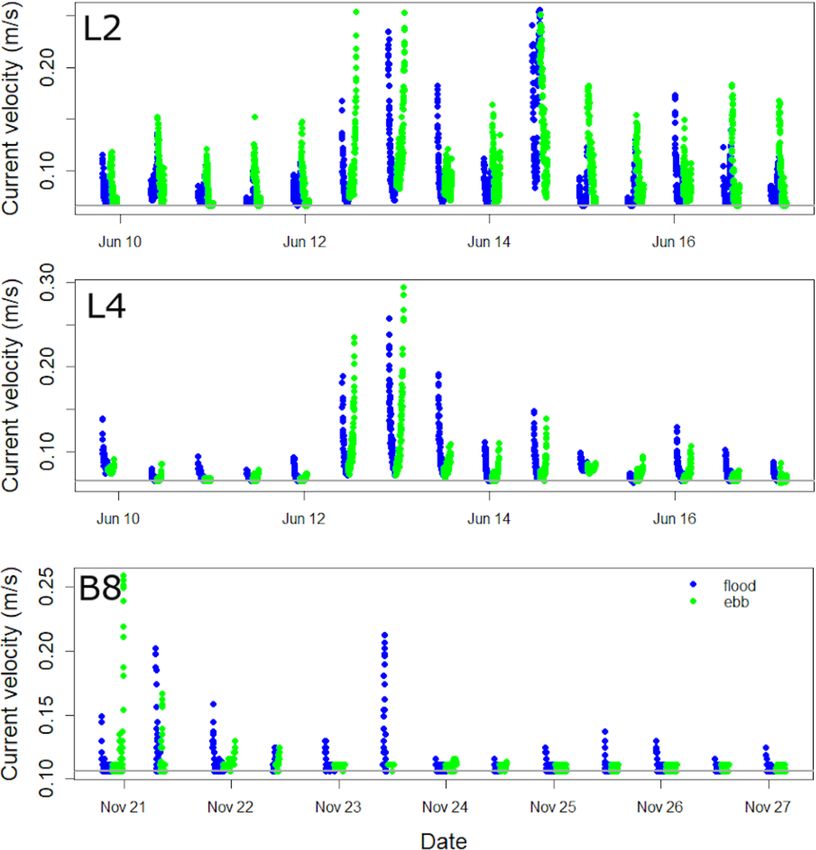
Figure 4. Examples of predicted current velocities during predicted inundation events for L2, L4, and B8 using the LDA (Fig. 3a) for
inundation and regression analysis for velocity predictions (Fig. 3b). Colours denote the first and second half of the inundation time period
(approx. flood and ebb tide), and the grey line indicates the detection threshold (i.e. Bay of Fundy (L2, L3) = 0.06 m s−1 , North Sumatra
(B8) = 0.106 m s−1 ; see Fig. 3b).
itoring period, whereas Abandoned pond 2 (i.e. “long-term” application in mangrove restoration, rehabilitation, and cre-
in Fig. 2) and the Pond restoration site could freely flood and ation projects in SE Asia. This application can be easily cus-
drain through openings in the embankment. Only the Pond tomized to other regions with different species requirements
restoration site showed inundation-free WoO for more than and flooding characteristics. Calibrating the acceleration data
two consecutive tides during the monitoring period. of the Mini Buoy against water-level and current-velocity
data showed that current velocities in excess of 0.1 m s−1
(> 0.06 m s−1 with added temperature and light loggers at
4 Discussion the Bay of Fundy) could be detected. Inundation events could
be correctly identified using the Mini Buoy, with misclassifi-
We successfully designed and calibrated the Mini Buoy, a cations below 1.6 % and 2.5 % when using a machine learn-
small bottom-mounted float equipped with acceleration data ing approach or a fixed vertical acceleration threshold respec-
logger, in contrasting intertidal environments. We further de- tively. With measurement intervals of 10 s, the Mini Buoys
veloped the Mini Buoy into a ready-to-use tool for mangrove as described here can be deployed for several months be-
restoration hydrological site assessments with a focus on dis- fore data retrieval and battery recharging becomes necessary
used aquaculture ponds and unvegetated tidal flats with refer- (the authors have successfully deployed the Mini Buoy for
ence to SE Asian mangrove species. This study (i) provides 164 d in a separate study using the design presented here).
a design concept for low-cost monitoring of abiotic param- Whilst the Mini Buoys were able to represent a wide range of
eters in intertidal environments and (ii) enables practition- flood–ebb conditions, the current design has a limited capac-
ers to directly implement the Mini Buoy using an R shiny
Hydrol. Earth Syst. Sci., 25, 1229–1244, 2021 https://doi.org/10.5194/hess-25-1229-2021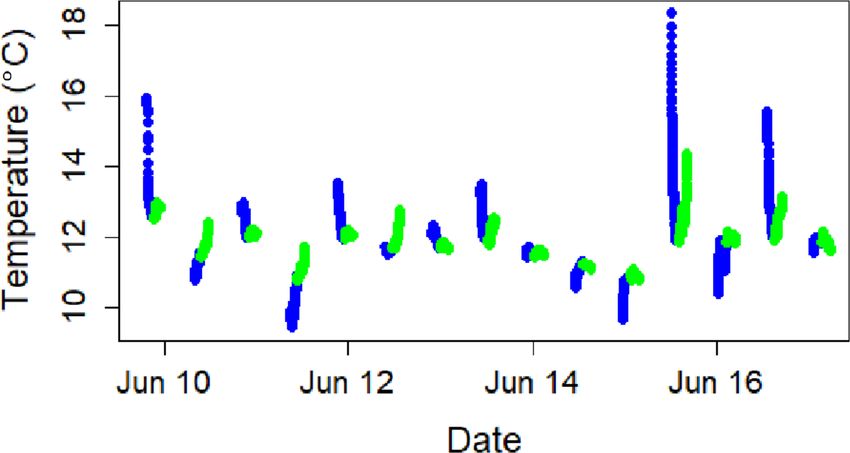
T. Balke et al.: Monitoring tidal hydrology in coastal wetlands with the “Mini Buoy”                                                      1237

Figure 5. (a) Summary of predicted median current velocities and inundation duration for the entire monitoring duration (based on 1 min
aggregated data) along the elevational gradient of the terraced salt marsh at the Bay of Fundy. (b) Inundation duration (min d−1 ) at the logger
locations at the North Sumatra field site.

Table 1. Summary of site characteristics in North Sumatra using the Mini Buoy and the R shiny application. Note that “Abandoned pond 2”
corresponds with the long-term location, and “Channel” corresponds with B1 in Fig. 2. Only “Open coast” and “Channel” show current
velocities above the detection threshold. At the Abandoned pond 1 site a sluice system was partially in operation, leading to prolonged
non-tidal flooding.

           Indicator                                 Open     Abandoned pond 1       Abandoned pond 2       Restoration    Channel
                                                     coast
           Monitoring period (d)                      6.25                 50.15                   50.64          47.45       6.64
           Average high tide duration (min)          310.0                6492.0                   282.3          218.2      343.8
           Flooding frequency (d−1 )                  1.92                  0.20                    1.90           1.60       1.96
           Maximum duration of WoO (d)                0.36                  0.91                    0.84           3.64       0.34
           Average flooding duration (min d−1 )      624.0                1298.5                   556.8          373.3      702.9
           Median current velocity (m s−1 )           0.14                  0.11                    0.11           0.09       0.13
           75th percentile velocity (m s−1 )          0.20                  0.11                    0.11           0.09       0.17
           Flood–ebb median velocity (m s−1 )         0.01                  0.00                    0.00           0.00      −0.01

ity to measure low current velocities (< 0.1 m s−1 ) and can-             ment and analysis (e.g. no levelling or specialist hydrological
not make current-velocity predictions when the Mini Buoy                  knowledge required) make this a suitable tool to assess hy-
is partially submerged (i.e. when water depths are below or               drological site conditions at ecologically relevant scales. Ad-
around 20 cm). The latter issue is resolved in the R shiny                ditional loggers used in combination with the Mini Buoy can
app by implementing an algorithm that detects individual in-              provide further insight into the temporal variability of abiotic
undation events and can identify non-tidal flooding events                conditions in combination with tidal flooding, for example
(e.g. due to sluice gate operations). Moreover, a buffer period           in water quality studies (see flood and ebb temperature plot
around the start and end of each inundation (1 h in the R shiny           in Fig. A4). Calibrations in two very contrasting conditions
app) is deleted to ensure that no erroneous current-velocity              (i.e. Bay of Fundy and North Sumatra) showed that the con-
predictions for partially inundated loggers are made. Despite             cept design is robust and easy to implement, even in strong
the lower accuracy of current-velocity information provided               currents and humid and hot climates and on soft muddy tidal
by the Mini Buoys compared to conventional hydrodynamic                   flats. We demonstrated that the single-axis acceleration tilt
monitoring equipment, the low costs and quick direct deploy-              calculation principle is of sufficient accuracy to identify eco-

https://doi.org/10.5194/hess-25-1229-2021                                                Hydrol. Earth Syst. Sci., 25, 1229–1244, 2021
1238 T. Balke et al.: Monitoring tidal hydrology in coastal wetlands with the “Mini Buoy” Figure 6. Photographs of deployment sites in North Sumatra. logically relevant inundation and current-velocity informa- could be included in site suitability assessments for wave ex- tion. Hence it is possible to reduce the costs of the Mini Buoy posed tidal flats; however, such sites are generally not recom- even further. mended for restoration in the first place due to low success The primary information that the Mini Buoys provide is rates (Wodehouse and Rayment, 2019). in situ flooding characteristics. These data can be compared Our mangrove site comparison (Fig. 6, Table 1) using the to species-specific flooding thresholds from the literature. Mini Buoys demonstrated how hydrological site conditions Van Loon et al. (2007), for example, estimated from a 1- can vary locally. Abandoned pond 1 was the only site which month flooding time series in the Mekong delta that flood- exceeded the 800 min d−1 inundation threshold due to a tem- ing duration was between 800 and 400 min d−1 for man- porarily closed sluice gate in the second half of the moni- grove pioneers Avicennia spp. and Sonneratia spp., whereas toring period. Hence the data from the Mini Buoy suggested the Rhizophora spp.–Ceriops spp.–Bruguiera spp. zone had that the remaining mangrove trees in Abandoned pond 1 (see 400–100 min d−1 inundation durations on average. In ad- photo in Fig. 6) will die off if the present flooding regime dition to the physiological tolerance to flooding of estab- is maintained. Flooding duration in the Abandoned pond 2 lished plants, mangrove propagules of Avicennia spp. require site was generally suitable for mangrove pioneer coloniza- approximately 1–5 inundation-free days to sufficiently root tion, and current velocities were below the detection limit. against dislodgement by the tide on bare tidal flats (i.e. WoO) This was corroborated by the recent establishment of Avi- (Balke et al., 2015). The stronger the hydrodynamic forcing cennia spp. saplings and trees at the site. The Pond restora- upon first submergence, the longer the required WoO (i.e. the tion site assessment confirmed that previously planted Rhi- longer the roots required to stay anchored). The Mini Buoy is zophora apiculata at this site is likely to survive as the flood- well suited as a tool to identify WoO as it measures inunda- ing duration is slightly below 400 min d−1 , and no signifi- tion and hydrodynamic forcing directly on the tidal flat where cant current velocities were detected. This was the only site new establishment may occur. The Mini Buoy can be further where WoO of > 1 d were detected during the monitoring customized to include the detection of very shallow inun- period, which suggests that additional natural colonization dation events on tidal flats, for example to study propagule could be expected if propagule dispersal is not hindered. The dispersal. Whereas WoO may be very stochastic and require predicted current velocities of the “Open coast” tidal flat lo- deployment across seasons or even years to detect, average cation (Table 1) showed the typical tidal pattern with flood, inundation conditions and velocities can be adequately esti- slack, and ebb tides (see R shiny example in the Zenodo mated with monitoring across one or more spring–neap tidal repository). cycle (> 15 d). Seasonal variability of conditions, especially Physiological tolerance to tidal inundation and establish- with respect to the fruiting season of the desired species, ment thresholds of mangroves also depend on other environ- should be accounted for where possible. To allow for a first mental factors such as soil anoxia, soil porewater salinity, rapid assessment of hydrological site suitability without ex- bioturbation, and microclimate (Krauss et al., 2008). These pert knowledge and with a single Mini Buoy, the R shiny app factors may enhance or restrict the flooding tolerance of man- contains several warning/interpretation messages related to grove seedlings and trees at a given location. We therefore SE Asian mangrove habitat suitability. For general site un- advocate the deployment of two Mini Buoys in tandem (as suitability (WoO < 1 d and for inundation durations > 800 or implemented in the R shiny application) in order to gen- < 100 min d−1 ), warning messages will appear. Velocities erate site-specific physiological thresholds, rather than rely are classified as low (≤ 15 cm s−1 ) and high (> 15 cm s−1 ) to on published information alone. This is especially recom- allow for a first estimation of hydrodynamic exposure. Warn- mended during short-term deployments over single spring– ing messages will also appear where measurements do not neap cycles. One Mini Buoy monitoring the conditions at the cover spring and neap tidal cycles (i.e. are shorter than 15 d). target restoration site can be compared to Mini Buoy data For more detailed single-deployment approaches, Mini Buoy from a local reference site with the desired conditions and data could be combined with a parameterized model of WoO plant community. This has several benefits: (i) the reference of the local pioneer species, including root-growth rates and site will likely experience the same regional stochastic vari- stability thresholds (Balke et al., 2014, 2015). Wave exposure ation in water levels (i.e. wind setup) over the monitoring Hydrol. Earth Syst. Sci., 25, 1229–1244, 2021 https://doi.org/10.5194/hess-25-1229-2021
T. Balke et al.: Monitoring tidal hydrology in coastal wetlands with the “Mini Buoy”                             1239

period, (ii) the reference site will have the same local species
pool, and (iii) the reference site will have similar edaphic soil
conditions. Reference sites should show recent seedling es-
tablishment of the desired species as conditions suitable for
seedling establishment are not equal to conditions required
for survival of mature mangrove trees (Krauss et al., 2008).
An example of the R shiny application output for a compar-
ative deployment between is provided in the Zenodo reposi-
tory.

5   Conclusions

With this study we were able to show that low-cost moni-
toring of hydrological conditions in intertidal environments
(inundation and current velocities) across multiple spring–
neap tidal cycles is possible using single-axis accelerome-
ter technology and readily available materials for an under-
water float (i.e. the Mini Buoy). Whereas this approach can
be a useful tool in coastal research, we especially highlight
the Mini Buoy as a stand-alone tool for easy-to-implement
hydrological site suitability assessments prior to mangrove
restoration. The Mini Buoy can be globally implemented as
a standard for mangrove restoration site assessments as it is
low-cost, easy to transport across borders, difficult to spot on
the tidal flat, and not prone to storm damage as it is close
to the ground and does not require specialist knowledge in
coastal engineering or data analysis. Especially in the com-
plex hydrological networks of abandoned aquaculture ponds
in SE Asia, the Mini Buoy has the potential to efficiently as-
sess site- and pond-specific conditions with only a few Mini
Buoys rotated around the site. Learning from past mistakes
in mangrove restoration, where a lack of hydrological site as-
sessments has led to very low restoration success rates (Dale
et al., 2014; Kodikara et al., 2017; Zaldivar-Jimenez et al.,
2010), this new affordable and easy-to-implement technol-
ogy will be able to assist urgently needed upscaling of future
mangrove rehabilitation efforts (Worthington and Spalding,
2018).

https://doi.org/10.5194/hess-25-1229-2021                                Hydrol. Earth Syst. Sci., 25, 1229–1244, 2021
1240                                    T. Balke et al.: Monitoring tidal hydrology in coastal wetlands with the “Mini Buoy”

Appendix A

Table A1. Components of the Mini Buoy (without temperature and light loggers).

   Item                                                                                         Size                          Weight
   Corning® 50 mL PP centrifuge tubes, self-standing CentriStarTM                               114.9 mm (L)                  14.6 g
   Accelerometer MSR 145 B4A (MSR Electronics GmbH, Switzerland)                                20 × 14 × 62 mm (W × H × L)     18g
   3x Interlock snap fishing swivel with barrel (#1)                                            55 mm (L)                      1.9 g
   Foam to insert at bottom of logger, plastic bag to wrap accelerometer, tape, silicone seal   various                       < 4g
   Total                                                                                                                      42.3 g

Figure A1. Mini Buoy components and installation.

Hydrol. Earth Syst. Sci., 25, 1229–1244, 2021                                               https://doi.org/10.5194/hess-25-1229-2021
T. Balke et al.: Monitoring tidal hydrology in coastal wetlands with the “Mini Buoy”                                                        1241

Figure A2. Calibration of 10 s measurement interval data for 15 min time steps. (a) Linear discriminant analysis for North Sumatra
dataset (B11 and B12) using 10 s interval acceleration data and aggregation over 15 min time steps (l is low tide, h is high tide, and red letters
are false predictions). Additionally, the LDA group averages are indicated as orange dots. The −0.5 y acceleration threshold to separate inun-
dation from non-inundation time steps was applied for the R shiny application. Linear regression (blue line) provided the best fit for the me-
dian y-axis acceleration [Yacc (g)] against the measured current velocity of B1 [Vcur (m s−1 )] for 15 min intervals: Vcur = 1.173+1.059·Yacc ,
Radj = 0.7724, P < 0.05. The grey line shows the 1 Hz deployment regression line of Fig. 3 and the green line the predictions within the
measured range of values.

Figure A3. Time series example of temperature data at the Bay of Fundy Mini Buoy L2. Measured temperature during inundation by the
Hobo data logger fixed to the top of the Mini Buoy L2. Colours indicate first and second half of inundation.

https://doi.org/10.5194/hess-25-1229-2021                                                 Hydrol. Earth Syst. Sci., 25, 1229–1244, 2021
1242                                     T. Balke et al.: Monitoring tidal hydrology in coastal wetlands with the “Mini Buoy”

Code availability. Code     is   available   on    GitHub        at   Margaret Kalacska for loan of the Emlid DGPS rover. We thank
https://doi.org/10.5281/zenodo.4304146 (Balke, 2021a).                Bejo Slamet, Nurdin Sulistiyono, Yunta Bimantra, Riska Amelia,
 1. Mini Buoy R shiny app code (.R)                                   Muttia Chandra, and Nur Indah Lestari for help with fieldwork at
                                                                      Percut Sei Tuan. We thank Zulkifli and Legiman for allowing us to
 2. Mini Buoy Manual.                                                 access the former aquaculture ponds at Percut Sei Tuan. We thank
Zenodo repository: https://doi.org/10.5281/zenodo.4521304 (Balke      Yagasu for allowing us to access their restoration site at Belawan.
et al., 2021).
 1. Readme file
                                                                      Financial support. This research has been supported by
 2. Aquadopp data (.dia):
                                                                      UK Research and Innovation (grant nos. NE/P014127/1
2.1. North Sumatra                                                    and NE/S008926/1).
2.2. Bay of Fundy
 3. Mini Buoy data (.csv):
                                                                      Review statement. This paper was edited by Hubert H. G. Savenije
3.1. Bay of Fundy: Mini Buoy acceleration L1–8 and temperature        and reviewed by two anonymous referees.
     and light data
3.2. North Sumatra study site: Mini Buoy acceleration B1–16
3.3. North Sumatra additional sites (.csv)                            References
       –   Open coast, Percut Sei Tuan
       –   Abandoned pond 1, Percut Sei Tuan non-tidal                Akeila, E., Salcic, Z., and Swain, A.: Smart Pebble for Monitor-
                                                                        ing Riverbed Sediment Transport, IEEE Sens. J., 10, 1705–1717,
       –   Abandoned pond 2, Percut Sei Tuan (study site)
                                                                        https://doi.org/10.1109/JSEN.2010.2046726, 2010.
       –   Restoration pond, Belawan                                  Albers, T. and Schmitt, K.: Dyke design, floodplain restoration and
       –   Channel (B1)                                                 mangrove co-management as parts of an area coastal protection
 4. Animations of inundation and velocity predictions (mp4, gif):       strategy for the mud coasts of the Mekong Delta, Vietnam, Wetl.
                                                                        Ecol. Manage., 23, 991–1004, https://doi.org/10.1007/s11273-
4.1. Bay of Fundy animation of current velocities at 10 min time
                                                                        015-9441-3, 2015.
     steps, arbitrary scale for the bars (.gif)
                                                                      Balke, T.: Mini Buoy application for mangrove restora-
4.2. Inundation animation of the North Sumatra field site for two       tion hydrological site suitability assessment, Zenodo,
     tidal cycles: (.mp4)                                               https://doi.org/10.5281/zenodo.4304146, 2021a.
 5. Mini Buoy application screenshots.                                Balke, T.: Mini Buoy app, available at: https://mangroverestoration.
                                                                        shinyapps.io/MiniBuoyApp/ (last access: 9 March 2021), 2021b.
                                                                      Balke, T., Bouma, T., Horstman, E., Webb, E., Erftemeijer, P., and
                                                                        Herman, P.: Windows of opportunity: thresholds to mangrove
Data availability. The R shiny app can be used directly online un-
                                                                        seedling establishment on tidal flats, Mar. Ecol. Prog. Ser., 440,
der https://mangroverestoration.shinyapps.io/MiniBuoyApp/ (last
                                                                        1–9, https://doi.org/10.3354/meps09364, 2011.
access: 9 March 2021).
                                                                      Balke, T., Herman, P. M. J., and Bouma, T. J.: Critical tran-
                                                                        sitions in disturbance-driven ecosystems: identifying Win-
                                                                        dows of Opportunity for recovery, J. Ecol., 102, 700–708,
Author contributions. TB designed the Mini Buoy, carried out the        https://doi.org/10.1111/1365-2745.12241, 2014.
data analysis and coding of the R shiny app, and led the writing      Balke, T., Swales, A., Lovelock, C. E., Herman, P. M. J., and
of the manuscript. TB and MB carried out fieldwork in Indonesia.        Bouma, T. J.: Limits to seaward expansion of mangroves:
TB and GLC carried out fieldwork at the Bay of Fundy. CS assisted       Translating physical disturbance mechanisms into seedling
with hydrodynamic analyses for the Bay of Fundy dataset. TB, AV,        survival gradients, J. Exp. Mar. Biol. Ecol., 467, 16–25,
CS, GLC, CL, and MB jointly wrote and improved the final paper.         https://doi.org/10.1016/j.jembe.2015.02.015, 2015.
                                                                      Balke, T., Vovides, A., Schwarz, C., Chmura, G. L., Ladd, C.,
                                                                        and Basyuni, M.: Monitoring of tides in coastal wetlands with
Competing interests. The authors declare that they have no conflict     the ‘Mini Buoy’: applications for mangrove restoration, Zenodo,
of interest.                                                            https://doi.org/10.5281/zenodo.4521304, 2021.
                                                                      Beanland, E., Main, L. C., Aisbett, B., Gastin, P., and
                                                                        Netto, K.: Validation of GPS and acceleroeter technol-
Acknowledgements. Thorsten Balke and Alejandra Vovides ac-              ogy in swimming, J. Sci. Med. Soprt., 17, 234–238,
knowledge NERC grant NE/P014127/1 for financial support.                https://doi.org/10.1016/j.jsams.2013.04.007, 2014.
Thorsten Balke acknowledges the Early Career Mobility Scheme          Bockelmann, A.-C., Bakker, J. P., Neuhaus, R., and Lage, J.: The
of the University of Glasgow and the British Society for Geomor-        relation between vegetation zonation, elevation and inundation
phology for additional financial support to conduct fieldwork at        frequency in a Wadden Sea salt marsh, Aquat. Bot., 73, 211–221,
the Bay of Fundy. Thorsten Balke and Cai Ladd acknowledge               https://doi.org/10.1016/S0304-3770(02)00022-0, 2002.
Living Deltas NE/S008926/1. Mohammad Basyuni acknowledges             Bouma, T. J., Temmerman, S., Duren, L. A., Martini, E., Van-
DIPI-LPDP grant NE/P014127.1 for financial support. We thank            denbruwaene, W., Callaghan, D. P., Balke, T., Biermans, G.,

Hydrol. Earth Syst. Sci., 25, 1229–1244, 2021                                           https://doi.org/10.5194/hess-25-1229-2021
T. Balke et al.: Monitoring tidal hydrology in coastal wetlands with the “Mini Buoy” 1243 Klaassen, P. C., Steeg, P., Dekker, F., Koppel, J., Vries, M. B., grove Forests of the Mekong Delta, Oceanography, 30, 34–47, and Herman, P. M. J.: Organism traits determine the strength https://doi.org/10.5670/oceanog.2017.312, 2017. of scale-dependent bio-geomorphic feedbacks: A flume study on Passfield, L., Hopker, J. G., Jobson, S., Friel, D., and Za- three intertidal plant species, Geomorphology, 180–181, 57–65, bala, M.: Knowledge is power: issues of measuring training https://doi.org/10.1016/j.geomorph.2012.09.005, 2013. and performance in cycling, J. Sports Sci., 35, 1426–1434, Chang, W., Joe Cheng, J. J. A., Xie, Y., and McPherson, J.: shiny: https://doi.org/10.1080/02640414.2016.1215504, 2017. Web Application Framework for R, available at: https://CRAN. Pennings, S. C. and Callaway, R. M.: Salt Marsh Plant Zonation: R-project.org/package=shiny (last access: 9 March 2021), 2020. The Relative Importance of Competition and Physical Factors, Dale, P., Knight, P., and Dwyer, P.: Mangrove rehabilitation: a Ecology, 73, 681–690, https://doi.org/10.2307/1940774, 1992. review focusing on ecological and institutional issues, Wetl. Primavera, J. H. and Esteban, J. M.: A.: A review of man- Ecol. Manage., 229, 587–604, https://doi.org/10.1007/s11273- grove rehabilitation in the Philippines: successes, failures 014-9383-1, 2014. and future prospects, Wetl. Ecol. Manage., 16, 345–358, Delgado, P., Hensel, P. F., Jiménez, J. A., and Day, J. W.: https://doi.org/10.1007/s11273-008-9101-y, 2008. The importance of propagule establishment and physical fac- Proisy, C., Viennois, G., Sidik, F., Andayani, A., Enright, J. A., tors in mangrove distributional patterns in a Costa Rican es- Guitet, S., Gusmawati, N., Lemonnier, H., Muthusankar, G., tuary, Aquat. Bot., 71, 157–178, https://doi.org/10.1016/S0304- Olagoke, A., Prosperi, J., Rahmania, R., Ricout, A., Soulard, 3770(01)00188-7, 2001. B., and Suhardjono: Monitoring mangrove forests after aqua- Figurski, J. D., Malone, D., Lacy, J. R., and Denny, M.: An inexpen- culture abandonment using time series of very high spatial sive instrument for measuring wave exposure and water veloc- resolution satellite images: A case study from the Peran- ity: Measuring wave exposure inexpensively, Limnol. Oceanogr. cak estuary, Bali, Indonesia, Mar. Pollut. Bull., 131, 61–71, Meth., 9, 204–214, https://doi.org/10.4319/lom.2011.9.204, https://doi.org/10.1016/j.marpolbul.2017.05.056, 2018. 2011. Schwarz, C., Gourgue, O., Belzen, J., Zhu, Z., Bouma, T. J., Koppel, Hansen, A. B., Carstensen, S., Christensen, D. F., and Aagaard, T.: J., and Temmerman, S.: Self-organization of a biogeomorphic Performance Of A Tilt Current Meter In The Surf Zone, Coast. landscape controlled by plant life-history traits, Nat. Geosci., 11, Dynam., 218, 944–954, 2017. 672–677, https://doi.org/10.1038/s41561-018-0180-y, 2018. Jiménez, J. A., Sauter, K., and Jimenez, J. A.: Structure and Dynam- Silvestri, S., Defina, A., and Marani, M.: Tidal regime, salinity and ics of Mangrove Forests along a Flooding Gradient, Estuaries, salt marsh plant zonation, Estuar. Coast. Shelf Sci., 62, 119–130, 14, 49, https://doi.org/10.2307/1351981, 1991. https://doi.org/10.1016/j.ecss.2004.08.010, 2005. Koch, E. W., Ailstock, M. S., Booth, D. M., Shafer, D. J., Temmerman, S., Bouma, T. J., Koppel, J., Wal, D., De Vries, M. and Magoun, A. D.: The Role of Currents and Waves in B., and Herman, P. M. J.: Vegetation causes channel erosion in a the Dispersal of Submersed Angiosperm Seeds and Seedlings, tidal landscape, Geology, 35, 631–634, 2007. Restor. Ecol., 18, 584–595, https://doi.org/10.1111/j.1526- Van der Stocken, T., De Ryck, D. J. R., Balke, T., Bouma, T. J., 100X.2010.00698.x, 2009. Dahdouh-Guebas, F., and Koedam, N.: The role of wind in hy- Kodikara, K. A. S., Mukherjee, N., Jayatissa, L. P., Dahdouh- drochorous mangrove propagule dispersal, Biogeosciences, 10, Guebas, F., and Koedam, N.: Have mangrove restoration porjects 3635–3647, https://doi.org/10.5194/bg-10-3635-2013, 2013. worked? An independent study in Sri Lanka, Restor. Ecol., 25, van Loon, A. F., Dijksma, R., and van Mensvoort, M. 705–716, 2017. E. F.: Hydrological classification in mangrove areas: A Krauss, K. W., Lovelock, C. E., McKee, K. L., López- case study in Can Gio, Vietnam, Aquat. Bot., 87, 80–82, Hoffman, L., Ewe, S. M. L., and Sousa, W. P.: En- https://doi.org/10.1016/j.aquabot.2007.02.001, 2007. vironmental drivers in mangrove establishment and Venables, W. N. and Ripley, B. D.: Modern Applied Statistics early development: A review, Aquat. Bot., 89, 105–127, with S, 4th Edn., Springer, New York, 2002. https://doi.org/10.1016/j.aquabot.2007.12.014, 2008. Weihs, C., Ligges, U., Luebke, K., and Raabe, N.: klaR Analyzing Lewis, R. R.: Ecological engineering for successful management German Business Cycles, edited by: Baier, D., Decker, R., and and restoration of mangrove forests, Ecol. Eng., 24, 403–418, Schmidt-Thieme, L., Springer-Verlag, Berlin, 2005. https://doi.org/10.1016/j.ecoleng.2004.10.003, 2005. Wiehe, P. O.: A Quantitative Study of the Influence of Tide Lewis, R. R. and Brown, B. M.: Ecological Mangrove Rehabilita- Upon Populations of Salicornia Europea, J. Ecol., 23, 323–333, tion A Field Manual for Practitioners, 3rd Edn., Canadian Inter- https://doi.org/10.2307/2256124, 1935. national Development Agency, USAID, Oxfam, 2014. Wodehouse, D. C. J. and Rayment, M. B.: Mangrove area and MacDonald, G. A.: A review of low cost accelerometers propagule number planting targets produce sub-optimal rehabili- for vehicle dynamics, Sens. Actuat. Phys., 21, 303–307, tation and afforestation outcomes, Estuar. Coast. Shelf Sci., 222, https://doi.org/10.1016/0924-4247(90)85060-H, 1990. 91–102, https://doi.org/10.1016/j.ecss.2019.04.003, 2019. Matthijs, S., Tack, J., Van Speybroeck, D., and Koedam, N.: Man- Wolters, M., Garbutt, A., and Bakker, J. P.: Salt-marsh grove species zonation and soil redox state, sulphide concentra- restoration: evaluating the success of de-embankments tion and salinity in Gazi Bay (Kenya), a preliminary study, Man- in north-west Europe, Biol. Conserv., 123, 249–268, grov. Salt Marsh., 3, 243–249, 1999. https://doi.org/10.1016/j.biocon.2004.11.013, 2005. Mullarney, J., Norris, B., Bryan, K., Fricke, A., Sandwell, Worthington, T. and Spalding, M.: Mangrove Restoration Potential: D., and Culling, D.: A Question of Scale: How Turbulence A global map highlighting a critical opportunity, The Nature Around Aerial Roots Shapes the Seabed Morphology in Man- Conservancy, available at: https://oceanwealth.org/wp-content/ https://doi.org/10.5194/hess-25-1229-2021 Hydrol. Earth Syst. Sci., 25, 1229–1244, 2021
You can also read