Air pollution, methane super-emitters, and oil and gas wells in Northern California: the relationship with migraine headache prevalence and ...
←
→
Page content transcription
If your browser does not render page correctly, please read the page content below
Elser et al. Environmental Health    (2021) 20:45
https://doi.org/10.1186/s12940-021-00727-w

 RESEARCH                                                                                                                                         Open Access

Air pollution, methane super-emitters, and
oil and gas wells in Northern California: the
relationship with migraine headache
prevalence and exacerbation
Holly Elser1, Rachel Morello-Frosch2, Alice Jacobson3, Alice Pressman3, Marianthi-Anna Kioumourtzoglou4,
Richard Reimer5 and Joan A. Casey4*

  Abstract
  Background: Migraine–an episodic disorder characterized by severe headache that can lead to disability–affects
  over 1 billion people worldwide. Prior studies have found that short-term exposure to fine particulate matter
  (PM2.5), nitrogen dioxide (NO2), and ozone increases risk of migraine-related emergency department (ED) visits. Our
  objective was to characterize the association between long-term exposure to sources of harmful emissions and
  common air pollutants with both migraine headache and, among patients with migraine, headache severity.
  Methods: From the Sutter Health electronic health record database, we identified 89,575 prevalent migraine cases
  between 2014 and 2018 using a migraine probability algorithm (MPA) score and 270,564 frequency-matched
  controls. Sutter Health delivers care to 3.5 million patients annually in Northern California. Exposures included 2015
  annual average block group-level PM2.5 and NO2 concentrations, inverse-distance weighted (IDW) methane
  emissions from 60 super-emitters located within 10 km of participant residence between 2016 and 2018, and IDW
  active oil and gas wells in 2015 within 10 km of each participant. We used logistic and negative binomial mixed
  models to evaluate the association between environmental exposures and (1) migraine case status; and (2)
  migraine severity (i.e., MPA score > 100, triptan prescriptions, neurology visits, urgent care migraine visits, and ED
  migraine visits per person-year). Models controlled for age, sex, race/ethnicity, Medicaid use, primary care visits, and
  block group-level population density and poverty.
  (Continued on next page)

* Correspondence: jac2250@cumc.columbia.edu
4
 Department of Environmental Health Sciences, Mailman School of Public
Health, Columbia University, 722 W 168th St, Rm 1206, New York, NY
10032-3727, USA
Full list of author information is available at the end of the article

                                      © The Author(s). 2021, corrected publication May 2021. Open Access This article is licensed under a Creative Commons
                                      Attribution 4.0 International License, which permits use, sharing, adaptation, distribution and reproduction in any medium or
                                      format, as long as you give appropriate credit to the original author(s) and the source, provide a link to the Creative
                                      Commons licence, and indicate if changes were made. The images or other third party material in this article are included in
                                      the article's Creative Commons licence, unless indicated otherwise in a credit line to the material. If material is not included in
                                      the article's Creative Commons licence and your intended use is not permitted by statutory regulation or exceeds the
                                      permitted use, you will need to obtain permission directly from the copyright holder. To view a copy of this licence, visit
                                      http://creativecommons.org/licenses/by/4.0/. The Creative Commons Public Domain Dedication waiver (http://
                                      creativecommons.org/publicdomain/zero/1.0/) applies to the data made available in this article, unless otherwise stated in a
                                      credit line to the data.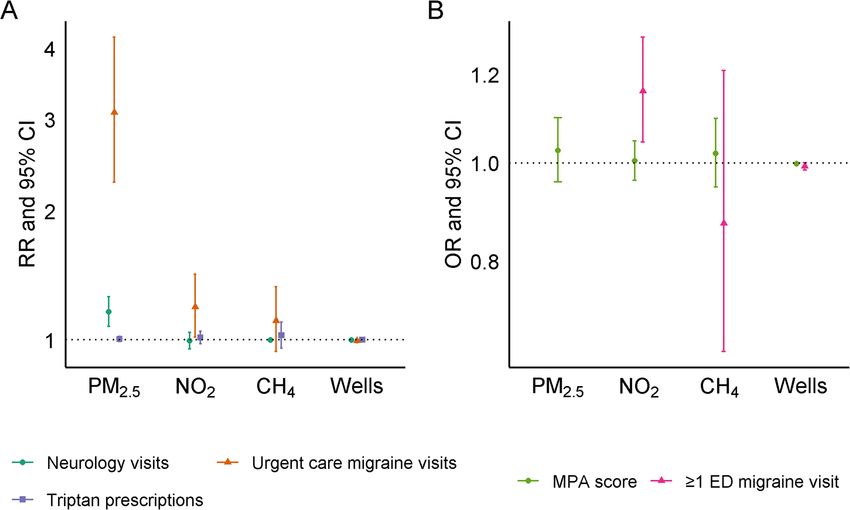
Elser et al. Environmental Health   (2021) 20:45                                                               Page 2 of 14

  (Continued from previous page)
  Results: In adjusted analyses, for each 5 ppb increase in NO2, we observed 2% increased odds of migraine case
  status (95% CI: 1.00, 1.05) and for each 100,000 kg/hour increase in IDW methane emissions, the odds of case status
  also increased (OR = 1.04, 95% CI: 1.00, 1.08). We found no association between PM2.5 or oil and gas wells and
  migraine case status. PM2.5 was linearly associated with neurology visits, migraine-specific urgent care visits, and
  MPA score > 100, but not triptans or ED visits. NO2 was associated with migraine-specific urgent care and ED visits,
  but not other severity measures. We observed limited or null associations between continuous measures of
  methane emissions and proximity to oil and gas wells and migraine severity.
  Conclusions: Our findings illustrate the potential role of long-term exposure to multiple ambient air pollutants for
  prevalent migraine and migraine severity.
  Keywords: Electronic health records, Migraine, Methane, oil and gas fields, Nitrogen dioxide, Particulate matter,
  Environmental exposure

Introduction                                                  monoxide, nitrogen dioxide (NO2), and coarse particles
Migraine is an episodic disorder characterized by severe      (PM10) have also been linked with migraine-specific ED
headache often associated with nausea or sensitivity to       visits in case-crossover studies based on daily clinic data
light and sound. In 2016, the estimated global prevalence     from 1000,000 patients from the National Health Insur-
of migraine was 14.4% with over 1.04 billion individuals      ance Program in Taiwan [23, 24]. A cross-sectional sur-
affected [1]. In the United States (U.S.), migraine is most   vey of 7785 primary care patients of the Geisinger Clinic
common among individuals aged 30 to 39 and follows a          in 2014 found that individuals exposed to the highest
social gradient wherein migraine is less common among         levels of unconventional natural gas development were
wealthier individuals [2, 3]. Migraine can lead to disabil-   more likely to have migraine headache [27]. Unconven-
ity; in the U.S., estimated annual costs associated with      tional natural gas development can produce PM2.5, vola-
migraine range from $13 to 16.6 billion annually due to       tile organic compounds (VOCs), noise and light
lost productivity, work and school absences, and short-       pollution, and stressful community changes that could
term disability [4–7].                                        trigger migraine [28].
   Given the episodic nature of migraine headache, con-          To date, few studies have considered the implications
siderable attention has been paid to the study and identi-    of long-term exposure to common environmental pol-
fication of common triggers. Among the most frequently        lutants–which may capture potential residential dispar-
self-reported triggers of migraine are sleep disturbances     ities in the burden of headache based on local average
and fatigue; stress or relief of stress; menstruation and     air quality–and no analyses have been conducted in the
pregnancy; smoking; and food and alcohol [8–12]. Fac-         Western U.S. or on specific air pollution sources. Re-
tors such as noise, season, and weather variations have       cently, the California Air Resources Board (CARB) con-
also been implicated as migraine triggers [8, 13–15]. Ex-     ducted an air survey of methane super-emitters, point
amples of common sources of environmental noise that          sources of methane emissions, including dairies, landfills,
may precipitate a migraine attack include traffic-related     refineries, and oil and gas infrastructure [29]. These fa-
noise from roads, railways, aircrafts, and parking cars       cilities emit a variety of co-pollutants such as SO2,
[16]. Individuals with migraine frequently attribute their    hydrogen sulfide, PM2.5, and VOCs [30–32], and the
headaches to weather variations, including changes in         new CARB data provide an opportunity to assess their
temperature and barometric pressure [11, 13, 17–19].          implications for migraine. California is also a top-10 U.S.
   Research to date also implicates short-term exposure       producer of crude oil, with over 200,000 oil and gas
to a variety of air pollutants as triggers for migraine       wells drilled in the state [33].
headache. Fine particulate matter (PM2.5) is among the           The present study leverages data from the Sutter
most frequently studied pollutants; increased levels of       Health electronic health record (EHR) database in
PM2.5 have been associated with more frequent                 Northern California and builds on prior research linking
migraine-specific emergency department (ED) visits in         air pollutants and migraine headache. Our analyses in-
Canada, Taipei, and South Korea [20–24], although, a          clude an expanded set of exposure measures, including
case-crossover study of 7054 patients in Boston reported      long-term ambient PM2.5 and NO2 concentrations, me-
no significant association with ED visits [25]. In a time-    thane emissions, and active oil and gas wells as mea-
series study of 1059 ED visits recorded at a Vancouver        sured at the beginning of the study period. We selected
hospital, levels of sulfur dioxide (SO2) were associated      these exposures, particularly methane super-emitters
with ED visits for migraine [26]. Levels of ozone, carbon     and active oil and gas wells, because if linked to
Elser et al. Environmental Health   (2021) 20:45                                                              Page 3 of 14

migraine, policies could reduce emissions at the source.      km2) using data from the 2014–2018 American Commu-
Whereas past research has largely relied on migraine-         nity Survey.
specific ED visits as a crude proxy for severe headache,
we incorporate additional measures of headache severity.      Migraine case ascertainment and control selection
We conducted a case-control study to ascertain whether        Both cases and controls were selected from the study
migraine case status was associated with long-term ex-        base of eligible patients over the age of 18 with at least
posure to any of the four environmental exposure mea-         one primary care encounter during the five-year study
sures as compared with controls. Next, we conducted a         period (2014–2018) that resided in one of 27 counties in
case-case analysis to ascertain whether environmental         Northern California. We ascertained case status using
exposures were associated with more severe headache           the Migraine Probability Algorithm (MPA), a validated
among individuals with established diagnosis of mi-           approach for identification of individuals diagnosed with
graine. We hypothesized a priori that environmental ex-       migraine from EHR data [35]. Briefly, a numeric score
posures would be associated with both migraine case           that ranges from zero to 101 is calculated based on the
status and with disease severity.                             following criteria: encounters (hospital inpatient, emer-
                                                              gency room and outpatient) with a primary or secondary
Methods                                                       diagnostic code for migraine from the International
We conducted a case-control study and case-case ana-          Classification of Diseases, Ninth Revision (ICD-9 346.xx)
lysis to examine the relationship between migraine se-        or Tenth Revision (ICD-10 G43.xxx); an ICD-9 or ICD-
verity and exposures of interest. This approach was           10 code for migraine in the patient’s Significant Health
selected based on computational feasibility, and because      Problem List (SHP); and filled prescriptions for
disease-based sampling is efficient when multiple expo-       migraine-specific abortive medications (i.e., triptans, er-
sures are considered and when the outcome of interest         gotamines). An MPA score greater than 10 is consistent
is relatively rare [34]. Cases and controls were identified   with diagnosis of migraine. We selected three controls
through the Sutter Health EHR database. Sutter Health         for every case from the Sutter EHR database. Controls
is a large, mixed-payer, integrated healthcare system in      were frequency matched to cases based on age category
Northern California that delivers comprehensive medical       (18–29; 30–44; 45–54; 55–64; 65 or older), sex, year of
services through its network of 24 acute-care hospitals       entry into Sutter primary care, and primary-care follow-
and more than 100 ambulatory clinics. Approximately           up time (0–6 months, 7–24 months, > 24 months).
3.5 million patients receive care through Sutter each year
at hospitals and clinics located in 22 counties; our study    Migraine severity
subjects resided in 27 urban and rural counties. Sutter’s     Among cases (i.e., individuals with MPA > 10), we de-
Epic EHR (Epic Systems Corporation, Verona, Wiscon-           fined the following count variables to capture migraine
sin) is fully integrated across all hospital and ambulatory   severity (1) all-cause neurology visits per year; (2)
sites. Data for cases and controls were retrospectively       migraine-specific urgent care visits per year; (3) triptans
extracted from the Sutter EHR for the study period be-        prescribed per year. We additionally defined two dichot-
tween January 1, 2014 and December 31, 2018.                  omous measures to capture migraine severity: (4) 0 ver-
   Patient demographic data from the EHR included sex         sus ≥1 migraine-specific emergency department (ED)
(male, female), race/ethnicity (non-Hispanic Asian,           visit during the study period; and (5) MPA score > 100
Black, white, other, or Hispanic); and marital status (di-    (more severe) versus MPA score 11–100 (less severe).
vorced, separated, widowed; married or partnered; single;
other or unknown). We used date of birth to compute           Air pollution, methane emission, and oil and gas wells
age in years at the start of follow-up. Health characteris-   We considered four separate exposure measures in our
tics extracted from the EHR included whether the indi-        analyses. These included PM2.5, NO2, methane super-
vidual was a Medicaid beneficiary (yes, no); body mass        emitters, and active oil and gas wells. Exposure to air
index (BMI) category in kg/m2 [less than 18.5 (under-         pollutants and to oil and gas wells was estimated based
weight); 18.5–24.9 (normal); 25–29.9 (overweight); 30–        on average values at the beginning of the study period
34.9 (obese class 1); 35–39.9 (obese class 2); 40 or more     (in 2015). Methane emissions measures were based on
(obese class 3)]; number of and reason for primary care,      data collected between 2016 and 2018.
specialty care, urgent care, and emergency department
visits. We assigned residential address for the study         PM2.5 and NO2
period (2014–2018) based on address of record in Octo-        We used patient addresses to link annual average con-
ber 2019. Using assigned residential address, we linked       centration of PM2.5 and NO2 estimates at the block
block group-level percent living below the federal pov-       group-level derived from annual-average integrated em-
erty threshold and population density (individuals per        pirical geographic regression models [36]. The approach
Elser et al. Environmental Health (2021) 20:45 Page 4 of 14
relied on universal kriging and took regulatory monitor- continuous IDW sum of all active wells within 10 km,
ing data, satellite imagery, and measures of land use and re-scaled so that coefficients in linear models correspond
traffic as inputs. PM2.5 and NO2 achieved standardized to a 1000-unit increase in the IDW sum. The second
RMSEs of 0.86 μg/m3 and 0.87 ppb, respectively. These was an indicator variable for presence of any active oil
variables were re-scaled such that coefficients in linear or gas well within 10 km.
models correspond to each 5 μg/m3 increase in PM2.5
and each 5 ppb increase in NO2, respectively. Statistical analyses
We first conducted a case-control analysis in which we
Methane emissions examined the association between migraine status and
Data on methane emissions were provided by CARB as each of the four exposures. Next, we conducted a case-
described in Duren et al. 2019 [29]. In brief, CARB led case analysis to examine whether migraine severity was
the first California Methane Survey to provide systematic associated with each of the exposures.
information on methane point sources across the state
via Next Generation Airborne Visible/Infrared Imaging Case-control analysis
Spectrometer (AVIRIS-NG) flights conducted between For the case-control analyses, we used generalized linear
2016 and 2018. The AVIRIS-NG flights identified 564 mixed models with a logit link with county-specific ran-
distinct sources of methane plumes and captured aver- dom intercepts to account for potential within-county
age hourly emission rates in kilograms per hour (kg/ clustering. All models controlled for our matching vari-
hour). Examples of sources of methane plumes identified ables: categorical age and sex, as recommended [37], and
by AVIRIS-NG flights included oil and gas wells, dairies, race/ethnicity, Medicaid use, number of primary care
and landfills. To estimate exposure to methane emis- visits per year, and block group-level population density
sions for the present study, we calculated the sum kg/ and poverty. We specified four separate statistical
hour of emitted methane from all sources within 10 km models to examine the association between migraine sta-
of each participant j’s residence and weighted the emis- tus and each of the environmental exposures of interest
sions by the inverse-distance squared between each (i.e., PM2.5, NO2, methane super-emitters, and active oil
super-emitter, i, and patient j’s residence: and gas wells). We used generalized additive mixed
Xn models with penalized smoothing splines to capture po-
Ei
; tential non-linearities in the exposure-response relation-
i¼1 d 2ij ships. As a secondary analysis, we used the binary
exposure specification for both methane super-emitters
where E is the emission rate at super-emitter i in kg/
and active wells (i.e., any super-emitter within 10 km vs.
hour and d is the distance in kilometers between super-
none and any well within 10 km vs. none).
emitter i and participant j. We created two exposure
metrics based on methane emission rates. The first was
Case-case analysis
the sum of methane emissions (in kg/hour) within 10
In the case-case analyses, we utilized negative binomial
km, re-scaled so that model coefficients corresponded to
mixed models (for count of neurology visits, migraine-
a 100,000 kg/hour increase in methane emissions. The
related urgent care visits, and prescriptions for triptans)
second was an indicator variable for presence of any me-
and logistic mixed models (for ≥1 migraine-related ED
thane super-emitter within 10 km.
visit per person-year vs. less and MPA score > 100 vs.
10–100) with random intercepts for county to examine
Oil and gas wells
the association between migraine severity and the expos-
Finally, we obtained records for active oil and gas wells
ure of interest. We controlled for the same set of poten-
as of December 2015 from the California Division of Oil,
tial confounding variables as described for the case-
Gas and Geothermal Resources website (CA DOGGR).
control analysis, assessed deviations from linearity using
To estimate exposure to active wells, we used inverse-
penalized smoothing splines, and as a secondary analysis
distance weighting (IDW) of active wells within 10 km of
considered binary specifications of super-emitters and
each participant, j:
active wells.
Xn 1
;
i¼1 d 2ij Sensitivity analyses
We conducted the following sensitivity analyses. First,
where i is an active well located within 10 km of the par- we separated exposure to super-emitters into two cat-
ticipant and d is the distance in kilometers between well egories: (1) dairy/cattle manure and landfills and (2) all
i and participant j. We created two exposure metrics other industrial types, which included power plants, re-
based on exposure to active wells. The first was a fineries, wastewater treatment facilities, oil and gasElser et al. Environmental Health (2021) 20:45 Page 5 of 14
distribution (e.g., oil/gas compressors, gas distribution annual average NO2 concentration the odds of migraine
lines), and oil and gas production (e.g., oil/gas waste la- case status increased by 1.02 times (95% CI: 1.00, 1.05).
goons, oil/gas plugged wells). We did so under the as- We also estimated that for every 100,000 kg/hour in-
sumption that methane co-pollutant emissions would crease in IDW sum of methane emissions within 10 km,
differ by these two categories. Second, we repeated our the odds of migraine case status also increased (OR =
main case-control and case-case analyses with additional 1.04, 95% CI: 1.00, 1.08). We found no evidence of an as-
adjustment for BMI category and marital status. Finally, sociation between migraine case status and block-group
in our case-case analysis of migraine-specific ED visits, level PM2.5 concentrations or for active oil or gas wells
we additionally adjusted for distance from the patient’s within 10 km (Fig. 2, Supplementary Table 1A). In our
address of record to the nearest ED. secondary analysis with dichotomized methane emission
For all models, we evaluated residual spatial autocor- and active wells, we found no association between any
relation using Moran’s I [38], which indicated no re- super-emitter or any active well within 10 km and mi-
sidual spatial autocorrelation in any of the analyses. graine (Supplementary Table 1B).
Analyses were conducted using R 3.6.0 (R Foundation In our case-case analysis, meant to evaluate the associ-
for Statistical Computing, Vienna, Austria). The ation between environmental exposures and migraine
Columbia University (Protcol #: AAAT0085), University frequency/severity, we observed mostly linear relation-
of California, Berkeley (Protocol #: 2013-10-5693), and ships, except for the association between PM2.5 and odds
Sutter Health (IRBNet #:1452543–1) Institutional Review of any migraine ED visit during the study period (Sup-
Boards approved this study. plementary Fig. 4). For the other severity outcomes, we
found that each 5 μg/m3 increase in annual average
Results block-group level PM2.5 concentration was associated
The study based included 1,433,236 individuals with at with increased frequency of outpatient neurology visits
least one primary care visit within the Sutter Health sys- (RR = 1.18, 95% CI: 1.09, 1.29), increased frequency of
tem in Northern California between 2014 and 2018. migraine-specific urgent care visits (RR = 3.09, 95% CI:
Based on MPA score, we initially identified 92,673 mi- 2.28, 4.18) and MPA score greater than 100 (OR = 1.14,
graine cases and 278,019 matched controls. We excluded 95% CI: 1.07, 1.22). We found no evidence of an associ-
3065 cases and 7327 controls who resided outside of 27 ation between increased PM2.5 concentration and fre-
Northern California counties; 29 cases and 100 controls quency of prescribed triptans (RR = 1.03, 95% CI: 0.97,
who lacked block group-level poverty data; and 4 cases 1.10).
and 28 controls missing PM2.5 data (Supplementary Increased block group-level NO2 concentration was
Fig. 1). The final study population included 89,575 cases not associated with triptans, outpatient neurology visits
and 270,564 controls in 27 counties (Supplementary or MPA score, but we found that each 5 ppb increase in
Fig. 2, Supplementary Fig. 3). NO2 concentration was associated with increased fre-
Migraine cases were most common between the ages quency of migraine-specific urgent care visits (RR = 1.22,
of 30–44 years (N = 33,036, 36.9%) and occurred pre- 95% CI: 1.02, 1.46) and with increased odds of having at
dominantly among females (N = 73,908, 82.5%). Migraine least one migraine-specific ED visit during follow-up
cases were more likely to be non-Hispanic white as com- (OR = 1.16, 95% CI: 1.05, 1.29) (Fig. 3, Supplementary
pared with controls (58.7% versus 48.2%) and had more Table 2A).
frequent primary care outpatient encounters and out- A 100,000-unit increase in the IDW sum of overall me-
patient neurologist visits (Table 1). The 2015 average an- thane emissions within 10 km was associated with in-
nual concentrations of PM2.5 and NO2; methane creased frequency of migraine-specific urgent care visits
emission rates; and the location of active oil and gas (RR = 1.12, 95% CI: 0.92, 1.36). Having any methane emit-
wells are depicted in Fig. 1. The median PM2.5 concen- ter within 10 km was also associated with increased fre-
tration at patient addresses was 8.7 μg/m3 (min = 3.7, quency of urgent care visits (RR = 1.32, 95% CI: 1.14, 1.54)
max = 13.3) and the median NO2 concentration was 7.7 (Fig. 3, Supplementary Tables 2A and 2B). Proximity to
ppb (min = 1.1, max = 15.2). Of 564 super-emitters sur- super-emitters was not associated with the frequency of
veyed in the state, 60 (10.6%) were located within 10 km triptan prescriptions, outpatient neurologist visits,
of study participants, including 35 dairies/landfills and migraine-specific ED visits, or MPA score. Presence of any
25 other types of super-emitters. active oil and gas wells within 10 km was associated with
In our case-control analysis we observed only linear increased frequency of outpatient neurologist visits (RR =
associations between exposure and migraine case status. 1.09, 95% CI: 1.03, 1.16), frequency of migraine-specific
We found some evidence for an association between mi- urgent care visits (RR = 1.43, 95% CI: 1.21, 1.70), and odds
graine case status and block-group level NO2 concentra- of at least one migraine-specific ED encounter per person-
tion. We estimated that for every 5 ppb increase in year of follow-up (OR = 1.11, 95% CI: 1.00, 1.24). WeElser et al. Environmental Health (2021) 20:45 Page 6 of 14
Table 1 Patient demographics, healthcare utilization, and environmental exposures for migraine cases and controls from Sutter
Health in Northern California, 2014–2018
Migraine cases Controlsa
N = 89,575 N = 270,564
Patient Demographics
Age Category, N (%)
18–29 years 16,952 (18.9) 51,112 (18.9)
30–44 years 33,036 (36.9) 99,792 (36.9)
45–54 years 19,226 (21.5) 58,169 (21.5)
55–64 years 12,578 (14.0) 38,093 (14.1)
≥ 65 years 7783 (8.7) 23,399 (8.7)
Sex, N (%)
Female 73,908 (82.5) 223,230 (82.5)
Male 15,667 (17.5) 47,334 (17.5)
Race/Ethnicity, N (%)
Non-Hispanic
Asian 9278 (10.4) 52,794 (19.9)
Black 3685 (4.1) 10,253 (3.8)
White 52,579 (58.7) 130,418 (48.2)
Other 11,351 (12.7) 41,907 (15.5)
Hispanic 12,682 (14.2) 34,192 (12.6)
Marital Status, N (%)
Divorced/Separated/Widowed 7444 (8.3) 18,881 (7.0)
Married/Significant Other 51,390 (57.4) 155,644 (57.5)
Single 22,659 (25.3) 63,801 (23.6)
Other/Unknown 8082 (9.0) 32,238 (11.9)
3
Body Mass Index Category (kg/m ), N (%)
Underweight (< 18.5) 1672 (1.9) 5636 (2.0)
Normal (18.5–24.9) 33,801 (37.7) 112,014 (41.4)
Overweight (25–29.9) 26,969 (30.1) 79,209 (29.3)
Obese Class 1 (30–34.9) 14,595 (16.3) 39,405 (14.6)
Obese Class 2 (35–39.9) 6835 (7.6) 17,388 (6.4)
Obese Class 3 (40+) 4614 (5.2) 11,658 (4.3)
Missing 1089 (1.2) 5254 (1.9)
Block Group-Level Variables, Median (IQR)
Percent Poverty 7.2 (3.5, 14.3) 6.6 (3.2, 13.1)
2
Population Density (individuals per km ) 2211 (901, 3593) 2292 (954, 3592)
Medicaid Beneficiary, N (%)
Yes 6929 (7.7) 15,105 (5.6)
No 82,646 (92.3) 255,459 (94.4)
Healthcare Utilization
Encounters per person-year
Primary care, Median (IQR) 2.4 (1.4, 4.0) 1.9 (1.2, 3.1)
Neurology, Mean (SD) 1.2 (3.4) 0.2 (1.0)
Urgent Care (Migraine-Specific), Mean (SD) 0.2 (2.7) –
Emergency (Migraine-Specific), N (%) 0.1 (0.7) –
≥ 1 visit during the study period 3987 (4.5) –Elser et al. Environmental Health (2021) 20:45 Page 7 of 14
Table 1 Patient demographics, healthcare utilization, and environmental exposures for migraine cases and controls from Sutter
Health in Northern California, 2014–2018 (Continued)
Migraine cases Controlsa
N = 89,575 N = 270,564
< 1 visit during the study period 85,588 (95.5) –
Triptan prescriptions per person-year, mean (SD) 0.6 (2.6)
MPA Score – N (%) 66.6 (31.5) –
11 - 100 59,599 (66.5) –
> 100 29,976 (33.5) –
Environmental Exposures
Air Pollutants, Median (IQR)
NO2, ppb 7.7 (5.7, 10.2) 8.1 (5.9, 10.4)
PM2.5, μg/m 3
8.7 (7.8, 9.6) 8.9 (7.8, 9.7)
CH4 Emissions
Any super-emitter within 10 km, N (%) 18,457 (20.6) 57,224 (21.1)
Total IDW emissions in kg/hour, Mean (SD) 21,461 (192,973) 26,070 (180,548)
Active Oil and Gas wells
Any oil or gas well within 10 km, N (%) 13,179 (14.7) 37,010 (13.7)
Total IDW wells, Mean (SD) 604 (6468) 603 (6459)
IDW Inverse-distance weighted; IQR Interquartile range; MPA Migraine probability algorithma Frequency-matched on age category, sex, year of entry into Sutter
primary care, and primary-care follow-up time (0–6 months, 7–24 months, ≥ 24 months)
found no evidence of an association between our continu- severity among patients with migraine. Our case-control
ous measure of active oil and gas wells and any of the five analysis revealed increased odds of exposure to NO2 and
measures of migraine severity (Fig. 3, Supplementary Ta- methane super-emitters among patients with migraine
bles 2A and 2B). as compared with frequency-matched population con-
We conducted a sensitivity analysis in which we separ- trols without clinical diagnosis of migraine. In our case-
ately considered dairies and landfills versus all other me- case analysis, migraine severity–as measured by fre-
thane super-emitters. Overall, these findings were largely quency of triptan prescriptions, outpatient neurology
consistent with our main findings for both the case- visits, migraine-specific urgent care and ED visits, and
control and case-case analyses; the association was MPA score–was most strongly and consistently associ-
stronger for dairies and landfills (RR = 1.18, 95% CI: ated with average PM2.5 and NO2 exposure.
0.37, 3.87) than for other super-emitters (1.08, 95% CI: Research to date has focused primarily on short-term
0.85, 1.36), albeit with widely overlapping confidence in- exposure to air pollutants as a trigger for migraine. Al-
tervals. In re-analysis of the case-control and case-cases though relatively few studies have focused on chronic
studies with additional controls for BMI category and exposure, evidence to date nevertheless suggests that
marital status, results did not differ from those of our chronic exposure to common pollutants may be import-
primary analysis (Supplementary Figs. 5 and 6). Results ant in the etiology, severity, or frequency of headache in-
were also unchanged when we incorporated distance to cluding migraine. Using linked records from the Taiwan
the nearest Sutter hospital in the ED visit case-case ana- National Health Insurance Research Database and
lyses (Supplementary Fig. 7). Taiwan Air Quality Monitoring Database, Hong et al.
(2020) found that frequency of recurrent headaches
Discussion among children younger than 18 years of age increased
Past research links short-term exposure to a range of air with higher-level exposure to several air pollutants in-
pollutants with ED visits migraine headache. Our study cluding PM2.5, CH4, NO2, and total hydrocarbons [39].
builds upon previous studies and considers the implica- Adetona et al. (2020) conducted a cross-sectional study
tions of long-term environmental exposures for mi- among residents of a community adjacent to a large
graine. Using data from the Sutter Health EHR database open landfill in Lagos, Nigeria. Results of that study indi-
in Northern California, we examined relationships be- cated that chronic exposure to emissions from open
tween a wide range of environmental exposures–includ- combustion of municipal solid waste—a major source of
ing PM2.5, NO2, methane super-emitters, and oil and gas particulate matter, polycyclic aromatic hydrocarbons,
wells–and both migraine headache and headache and toxicants such as polychlorinated biphenyls andElser et al. Environmental Health (2021) 20:45 Page 8 of 14 Fig. 1 Distribution of environmental exposures within study region. Block group level 2015 annual average concentration of a. PM2.5 and b. NO2. c. Methane emission rate based on the California Methane Survey, conducted between 2016 and 2018. D. Location of active oil and gas wells as of December 2015 brominated flame retardants—was associated with in- disadvantaged communities [43–45], and the substantial creased odds of daily occurrence of headache [40]. economic and social costs associated with migraine in Moreover, in animal models, chronic exposure to acro- the United States [2, 46–49]. Our findings therefore mo- lein, which is prevalent in both indoor and outdoor air tivate careful examination of the extent to which dispar- pollution, yielded physiologic changes consistent with ate levels of exposure to harmful emissions and levels of migraine [41, 42]. community air pollution translate to greater burden of Results of the present study further demonstrate the migraine headache and the associated economic and so- potential importance of long-term residential exposures cial costs particularly in already disadvantaged for migraine severity. One important implication of communities. these findings is that in more heavily polluted communi- To our knowledge, ours is the first study to examine ties, individuals may be more likely to suffer from mi- the implications of exposure to methane super-emitters graines or may suffer from more frequent headaches. for migraine; we identified an association between The existing literature consistently demonstrates the dis- super-emitter exposure and migraine case status but not proportionate burden of air pollution in already migraine severity. Methane super-emitters included
Elser et al. Environmental Health (2021) 20:45 Page 9 of 14
Importantly, we assigned methane super-emitter ex-
posure based on data collected between 2016 and 2018,
while we included migraine cases in the Sutter EHR
database between 2014 and 2018. This complicates the
temporal ordering of exposure and response. However,
reverse causality seems an implausible alternative ex-
planation for our results, as we know of no reason that
individuals with migraine would cause systematic in-
creases in local super-emitter exposure or would move
closer to a super-emitter post-diagnosis. It is possible,
however, that our findings reflect residential sorting of
individuals predisposed to migraine into localities where
methane emissions are higher on average [54, 55]. In the
U.S., migraine follows a social gradient and is more com-
mon among lower-income individuals who are also more
likely to live in more polluted neighborhoods [2, 3]. We
aimed to address this important source of confounding
by adjusting for patient Medicaid use and block-group-
level population density and poverty. Future research
should specifically examine co-pollutants that may ex-
plain the apparent link between methane emissions and
migraine, and to disentangle the role of residential sort-
ing and confounding by socioeconomic status from any
etiologic role that methane plays in the onset or exacer-
bation of migraine headaches.
Unlike several prior studies that rely on ED visits as a
rough proxy for disease severity, our case-case analysis
Fig. 2 Association between environmental exposures and odds of considered a more comprehensive set of proxies ob-
being a migraine case versus control. Results from a mixed logistic tained from EHR data including non-emergency
model with a random intercept for county adjusted for individual-
migraine-specific healthcare visits, migraine-related
level age category (18–29, 30–44, 45–54, 55–64, ≥65), race/ethnicity
(Hispanic, non-Hispanic Asian, non-Hispanic-Black, non-Hispanic medication use, a validated migraine severity score, and
White, and non-Hispanic other), sex, Medicaid use, number of overall neurology visits among patients with migraine.
primary care visits per person-year during the study period, and We also used splines to consider potential non-
block group-level population density and poverty. OR are per 5 μg/ linearities in exposure-response relationships between
m3 for PM2.5, per 5 ppb for NO2, per 100,000 kg/hour increase in IDW
each environmental exposure and our migraine severity
sum of methane emissions within 10 km for super-emitters, and per
1000-unit increase in IDW sum of all wells within 10 km for active oil outcome measures. Consistent with past research [2, 3],
and gas wells we observed an association between NO2 exposure and
migraine severity as measured by migraine-specific ur-
gent care visits and migraine-specific ED visits even at
dairies and waste lagoons, landfills, power plants, re- NO2 levels well below the current national standards
fineries, wastewater treatment facilities, and oil and gas (our population-average annual exposure was around 8
production and distribution infrastructure. Although ppb compared to the U.S. Environmental Protection
methane itself is not directly toxic to humans, it is often Agency annual standard of 53 ppb).
co-emitted with other noxious compounds. The hetero- Past research finds an association between short-term
geneous group of super-emitters considered in this study exposure to PM2.5 and migraine-specific ED visits [2, 3].
also produce a wide range of co-pollutants including Our analysis demonstrated an association with long-
volatile organic compounds, ammonia, hydrogen sulfide, term, annual average PM2.5 across a more comprehen-
and particulate matter, several of which are odorous sive set of clinical proxies for headache severity, includ-
[50–52]. Methane also contributes to the formation of ing outpatient neurology visits and migraine-specific
ground-level ozone, previously implicated as a trigger for urgent care visits. For ED visits, we found a paradoxical
migraine headache [23, 24]. In addition, super-emitters, inverse u-shaped exposure-response wherein individuals
such as oil and gas wells, produce noise pollution [53]. with the lowest and highest levels of average PM2.5 had
Both noise and odors have been consistently linked with the lowest odds of ED visit. This relationship persisted
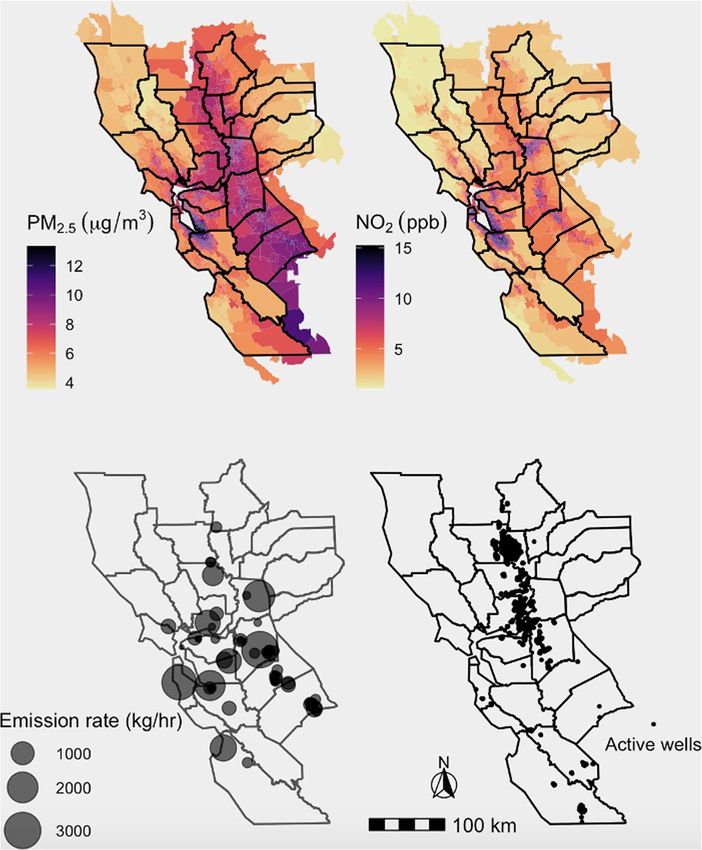
migraine headache [8, 13–15]. even after we incorporated additional statistical controlsElser et al. Environmental Health (2021) 20:45 Page 10 of 14 Fig. 3 Association between environmental exposures and severity of migraine case status. Associations estimated with mixed logistic and negative binomial models with random intercepts for county adjusted for individual-level age category (18–29, 30–44, 45–54, 55–64, ≥65), race/ ethnicity (Hispanic, non-Hispanic Asian, non-Hispanic-Black, non-Hispanic White, and non-Hispanic other), sex, Medicaid use, number of primary care visits per person-year during the study period, and block group-level population density and poverty. Neurology visits, urgent care migraine- specific visits, and triptan prescriptions were parameterized as continuous counts per person-year and analyzed using negative binomial models (Panel a). ED migraine visits were dichotomized as zero vs. ≥ 1 during the study period, and MPA score as > 100 versus less (Panel b). ORs and RRs are per 5 μg/m3 for PM2.5, per 5 ppb for NO2, per 100,000 kg/hour increase in IDW sum of methane emissions within 10 km for super-emitters, and per 1000-unit increase in IDW sum of all wells within 10 km for active oil and gas wells for distance to nearest Sutter ED. As our analysis differs The association between PM2.5 and migraine severity from previous studies that consider short-term PM2.5 may be partly explained by correlation between PM2.5 levels and risk of ED visits, this finding could reflect mis- and other exposures known to precipitate migraine alignment of the examined exposure window (annual headache (namely, noise and noxious odors) [8, 13–15]. average PM2.5) with an acute outcome (ED visits). PM2.5, is known to activate the sympathetic nervous sys- Communities with higher annual PM2.5 concentrations tem, result in systemic inflammation, and trigger cardio- may also have higher peak and long-term average expos- vascular events [56, 57], and may also directly result in ure that gives rise to ED visits. We know of no research migraine. The smallest fraction of the PM2.5 particles, ul- that demonstrates higher levels of PM2.5 as protective trafine particulate matter (≤ 0.1 μm in diameter [58]), against migraine headaches. This relationship could re- may have a disproportionately large role. Ultrafine parti- flect residential sorting where individuals with migraine cles–unlike the larger component particles of PM2.5–can move out of high PM2.5 communities. As migraine- transverse the blood-brain barrier and reach the brain specific emergency department visits are relatively rare directly through the olfactory bulb [59]. in these data, we suspect that the observed relationship Despite making up just a small portion of the total is driven by relatively less frequent use of emergency de- PM2.5 mass concentration, these circumstances raise the partments for headache among individuals living in the possibility that the apparent association between PM2.5 few counties with the highest PM2.5 levels. This finding and migraine severity in this and previous studies could also implies possible geographic disparities in either ac- be partially explained by neurotoxic effects secondary to cess to or use of care for severe migraine headaches un- exposure to the ultrafine component of PM2.5 [60, 61]. related to proximity or insurance status that should be The U.S. EPA does not regulate ultrafine particulate explored in future research. matter, meaning exposure estimates are sparse and
Elser et al. Environmental Health   (2021) 20:45                                                           Page 11 of 14

epidemiologic studies rare. Future migraine research         the Sutter catchment area, leading to systematic under-
should aim to evaluate the effects of ultrafine particles    estimation of long-term exposures among cases, and
on migraine and disentangle the effects of concomitant       therefore, underestimation of effect estimates.
exposure to noise, odor, PM2.5, and ultrafine particles.        While our study incorporates a more comprehensive
  Our analyses include all individuals with migraine         set of proxy measures for migraine headaches as com-
followed from 2014 to 2018 but do not distinguish be-        pared with previous studies (which typically relied on
tween individuals with previously diagnosed migraine at      migraine ED visits), we lacked any direct measure of
the beginning of the study period (i.e., prevalent cases)    headache frequency among patients with migraine (e.g.,
and individuals diagnosed with migraine throughout the       headache diaries). Our results rest on patients seeking
study period (i.e., incident cases). This makes ascertain-   clinical care for migraine. If individuals with higher
ment of an etiologic role of environmental exposures in      levels of environmental exposure were systematically less
either migraine onset or exacerbation challenging. As        likely to seek migraine treatment, our results may be at-
discussed previously, we cannot eliminate the possibility    tenuated. Headache diaries would circumvent this prob-
that our findings may reflect residential sorting, wherein   lem and further examination of the relationship between
individuals with existing migraine are more likely to res-   migraine and the environment in datasets where direct
ide in health-harming communities, for example those         measures of headache frequency are available [62–64]
of lower socioeconomic status or with higher levels of       would further our understanding of this relationship.
pollutants. Alternatively, individuals with migraine and        Fourth, our analysis includes a comprehensive set of
the financial means to do so may choose to leave com-        potential confounding variables. Nevertheless, we note
munities with environmental exposures that trigger their     the absence of several critical variables–including
headaches. The direction and magnitude of bias attribut-     individual-level income, educational attainment, and em-
able to residential sorting is therefore difficult to        ployment status–that may be important confounders in
anticipate.                                                  studies that use treatment seeking as a proxy for head-
  Although our analyses include individuals with mi-         ache severity, given past research showing that migraine
graine followed from 2014 to 2018, exposures were ei-        plays a key role in disability, absence from work or
ther measured at the beginning of the study period in        school, and that migraine follows a social gradient and is
2015 (annual average PM2.5, NO2, and presence of oil         less common in wealthier individuals [2, 5, 7]. Further,
and gas wells) or as values between 2016 and 2018 (me-       we lacked information on environmental noise pollution,
thane super-emitter emissions and presence). We as-          which may trigger migraines [65] and often co-occurs
sume relatively stable levels of long-term air pollution     with sources of air pollution.
and oil and gas well exposure during the study period.          Finally, we drew participants from a single healthcare
Methane super-emitter measurements took place be-            system in Northern California. This may limit
tween 2016 and 2018, but emission trends likely vary         generalizability to other populations including individ-
over time. Exposures were also assigned based on a sin-      uals who are uninsured or have limited health insurance.
gle residential address on the index date and therefore      Northern California also differs meaningfully from the
do not capture exposure accrued during time spent out-       rest of the U.S. in the quality and extent of environmen-
side the home and also do not reflect potential moves        tal exposures and population demographics. The rela-
between 2014 and 2018. Future research should en-            tionship between migraine and environment may differ
deavor to incorporate time-varying measures of air pol-      by region, season, and based on individual characteris-
lution, oil and gas wells, and methane emissions in          tics. This motivates ongoing study of the relationship be-
relation to migraine onset and exacerbation in order to      tween migraine in the environment in varied contexts.
better characterize the dynamic relationship between en-
vironment and migraine.                                      Conclusions
  Residential addresses were ascertained in October          In this study, we demonstrate an association between
2019 after the study period. Selection bias could result,    long-term NO2 and methane super-emitter exposure
for example, if individuals with migraine headache in        and odds of being a migraine patient. We also find an-
highly polluted counties moved to less polluted counties     nual average NO2 and PM2.5 exposure associated with
outside of the Sutter catchment areas. Because a small       migraine headache severity. Our study expanded the
minority of individuals lived outside of the Sutter catch-   scope of environmental pollutants considered as risk fac-
ment area in October 2019 (3.3% of cases and 2.6% of         tors for migraine and included numerous measures of
controls), we expect any resultant bias to be minimal.       migraine severity derived from EHR data and contrib-
Some differential exposure misclassification could also      utes to the existing literature on migraine and the envir-
arise if individuals with migraine headache in highly pol-   onment by explicitly considering long-term exposure to
luted counties moved to less polluted counties within        common pollutants. These findings illustrate the
Elser et al. Environmental Health          (2021) 20:45                                                                                           Page 12 of 14

potential role of ambient air pollution for prevalent mi-                         Funding
graine and migraine severity. Future studies are needed                           This study was funded by the California Air Resources Board
                                                                                  (CARB#18RD018) and the National Institutes of Environmental Health
that establish the temporal ordering of exposure and                              Sciences (R00 ES027023 and P30 ES009089).
outcome and the relevant exposure period as well as that
determine the most relevant air pollutants. In addition,                          Availability of data and materials
                                                                                  The Sutter Health electronic health record data are considered Protected
researchers should consider the potential heterogeneity                           Health Information under the Health Insurance Portability and Accountability
in the relationship between migraine and the environ-                             Act of 1996 (HIPAA) in the United States, and as such are not publicly-
ment across different geographic contexts and within                              available. PM2.5 and NO2 data are available for download at: https://www.
                                                                                  caces.us/data. Methane data are available via https://www.nature.com/
population subgroups. Such studies could identify envir-                          articles/s41586-019-1720-3#data-availability. Oil and gas well data are avail-
onmental risk factors on which we could intervene to re-                          able at https://www.conservation.ca.gov/calgem/Pages/Oil-and-Gas.aspx.
duce the population burden of migraine.
                                                                                  Declarations
Abbreviations                                                                     Ethics approval and consent to participate
BMI: Body mass index; CARB: California air resources board; ED: Emergency         The Columbia University (Protocol #: AAAT0085),
department; EHR: Electronic health records; IDW: Inverse distance weighted;       University of California, Berkeley (Protocol #: 2013-10-5693), and Sutter Health
MPA: Migraine probability algorithm; NO2: Nitrogen dioxide; PM2.5: Fine           (IRBNet #: 1452543–1) Institutional Review Boards approved this study.
particulate matter; SO2: Sulfur dioxide; U.S.: United States; VOCs: Volatile
organic compounds                                                                 Consent for publication
                                                                                  Not applicable. Only anonymized data were used.

Supplementary Information                                                         Competing interests
The online version contains supplementary material available at https://doi.      The authors declare that they have no conflicts of interest.
org/10.1186/s12940-021-00727-w.
                                                                                  Author details
                                                                                  1
                                                                                   Stanford University School of Medicine, Stanford Center for Population
 Additional file 1: Fig. S1. Ascertainment of migraine cases and controls         Health Sciences, Stanford, USA. 2Department of Environmental Science,
 from Sutter Health electronic health record data, 2015–2018. Fig. S2.            Policy, and Management and School of Public Health, University of California
 Counties included in the analysis in Northern California (left) and              Berkeley, Berkeley, CA, USA. 3Research, Development and Dissemination,
 distribution of Sutter hospitals (right). Fig. S3. Distribution of migraine      Sutter Health, Sacramento, USA. 4Department of Environmental Health
 cases and controls. Fig. S4. Flexible dose-response between levels of            Sciences, Mailman School of Public Health, Columbia University, 722 W 168th
 PM2.5 (μg/m3) and odds of having ≥1 ED visit over the course of the              St, Rm 1206, New York, NY 10032-3727, USA. 5Department of Neurology and
 study period. From mixed logistic models with penalized smoothing                Neurological Science, Stanford University School of Medicine, Stanford, USA.
 splines for PM2.5, random intercept for county, adjusted for individual-
 level age category (18–29, 30–44, 45–54, 55–64, 3 65), race/ethnicity (His-      Received: 19 August 2020 Accepted: 12 April 2021
 panic, non-Hispanic Asian, non-Hispanic-Black, non-Hispanic White, and
 non-Hispanic other), sex, Medicaid use, number of primary care visits per
 person-year during the study period, and block group-level population            References
 density and poverty. Fig. S5. Association between environmental expo-            1. Stovner LJ, Nichols E, Steiner TJ, Abd-Allah F, Abdelalim A, Al-Raddadi RM,
 sures and odds of being a migraine case versus control. Fig. S6. Associ-             et al. Global, regional, and national burden of migraine and tension-type
 ation between environmental exposures and severity of migraine case                  headache, 1990–2016: a systematic analysis for the global burden of disease
 status. Fig. S7. Association between PM2.5 and migraine-specific ED                  study 2016. Lancet Neurol. 2018;17(11):954–76. https://doi.org/10.1016/S14
 visits, adjusted for distance to nearest Sutter hospital. Table S1A. Associ-         74-4422(18)30322-3.
 ations between continuous environmental exposures and migraine status.           2. Lipton RB, Bigal ME, Diamond M, Freitag F, Reed M, Stewart WF. Migraine
 Table S1B. Associations between dichotomized environmental expo-                     prevalence, disease burden, and the need for preventive therapy.
 sures and migraine status. Table S2A. Associations between continuous                Neurology. 2007;68(5):343–9. https://doi.org/10.1212/01.wnl.0000252808.
 environmental exposures and measures of migraine severity. Table S2B.                97649.21.
 Associations between binary environmental exposures and measures of              3. Lipton RB, Stewart WF, Diamond S, Diamond ML, Reed M. Prevalence and
 migraine severity.                                                                   burden of migraine in the United States: data from the American migraine
                                                                                      study II. Headache J Head Face Pain. 2001;41(7):646–57. https://doi.org/10.1
                                                                                      046/j.1526-4610.2001.041007646.x.
Acknowledgements                                                                  4. Lofland J. Impact of migraine headache in the United States. Adv Stud
The authors thank Kathy V. Tran, graduate of the School of Public Health at           Pharm. 2007;4:8–10.
UC Berkeley, for her work in assembling the oil and gas well dataset and          5. Porter JK, Di Tanna GL, Lipton RB, Sapra S, Villa G. Costs of acute headache
Sylvia Sudat, biostatistician at Sutter Health, for her assistance with patient       medication use and productivity losses among patients with migraine:
geocoding and assembly of the analytic dataset.                                       insights from three randomized controlled trials. PharmacoEconomics-open.
                                                                                      2019;3(3):411–7. https://doi.org/10.1007/s41669-018-0105-0.
                                                                                  6. Berg J, Ramadan NM. Societal burden of the headache. The headaches.
Authors’ contributions                                                                Philadelphia: Lipencott & Williams; 2006;35–42.
JAC and RMF conceived the study. AP, HE, JAC, MAK, and RMF developed              7. Gilligan AM, Foster SA, Sainski-Nguyen A, Sedgley R, Smith D, Morrow P.
the study design and statistical methodology. AJ assembled the health data.           Direct and indirect costs among United States commercially insured
JAC analyzed the data and produced the Figs. HE and JAC drafted the                   employees with migraine. J Occup Environ Med. 2018;60(12):1120–7.
manuscript. All authors read, provided feedback, and approved the final               https://doi.org/10.1097/JOM.0000000000001450.
manuscript.                                                                       8. Prince PB, Rapoport AM, Sheftell FD, Tepper SJ, Bigal ME. The effect of
                                                                                      weather on headache. Headache J Head Face Pain. 2004;44(6):596–602.
                                                                                      https://doi.org/10.1111/j.1526-4610.2004.446008.x.
Authors’ information                                                              9. Chabriat H, Danchot J, Michel P, Joire J, Henry P. Precipitating factors of
Not applicable.                                                                       headache. A prospective study in a national control-matched survey in
Elser et al. Environmental Health (2021) 20:45 Page 13 of 14
migraineurs and nonmigraineurs. Headache J Head Face Pain. 1999;39(5): 31. California Air Resources Board. Landfill Activities 2020 [Available from:
335–8. https://doi.org/10.1046/j.1526-4610.1999.3905335.x. https://ww2.arb.ca.gov/sites/default/files/classic/cc/landfills/landfills.htm.
10. Henry P, Auray J, Gaudin A, Dartigues J, Duru G. Lantéri–Minet M, et al. 32. California Air Resources Board. Refiner Emergency Air Monitoring
prevalence and clinical characteristics of migraine in France. Neurology. Assessment Report Objective 2: Evaluation of Air Monitoring Capabilities,
2002;59(2):232–7. https://doi.org/10.1212/WNL.59.2.232. Gaps, and Potential Enhancements 2019 [Available from: https://ww3.arb.ca.
11. Spierings EL, Ranke AH, Honkoop PC. Precipitating and aggravating factors gov/fuels/carefinery/crseam/o2reamarfinal.pdf?_ga=2.149873781.2
of migraine versus tension-type headache. Headache J Head Face Pain. 58059090.1593094388-358911420.1591295298.
2001;41(6):554–8. 33. Energy Information Agency. California State Energy Profile 2020 [Available
12. Peatfield R, Glover V, Littlewood J, Sandler M, Clifford RF. The prevalence of from: https://www.eia.gov/state/print.php?sid=CA.
diet-induced migraine. Cephalalgia. 1984;4(3):179–83. https://doi.org/10.104 34. Jewell NP. Statistics for epidemiology. Boca Raton: CRC press; 2003. https://
6/j.1468-2982.1984.0403179.x. doi.org/10.1201/9781482286014.
13. Wöber C, Holzhammer J, Zeitlhofer J, Wessely P, Wöber-Bingöl Ç. Trigger 35. Pressman A, Jacobson A, Eguilos R, Gelfand A, Huynh C, Hamilton L, et al.
factors of migraine and tension-type headache: experience and knowledge Prevalence of migraine in a diverse community—electronic methods for
of the patients. J Headache Pain. 2006;7(4):188–95. https://doi.org/10.1007/ migraine ascertainment in a large integrated health plan. Cephalalgia. 2016;
s10194-006-0305-3. 36(4):325–34. https://doi.org/10.1177/0333102415590242.
14. Charles A. The evolution of a migraine attack–a review of recent evidence. 36. Kim SY, Bechle M, Hankey S, Sheppard L, Szpiro AA, Marshall JD.
Headache J Head Face Pain. 2013;53(2):413–9. https://doi.org/10.1111/hea Concentrations of criteria pollutants in the contiguous U.S., 1979–2015: Role
d.12026. of prediction model parsimony in integrated empirical geographic
15. Eross E, Dodick D, Eross M. The sinus, allergy and migraine study (SAMS) regression. PLoS One. 2020;15(2):e0228535.
CME. Headache J Head Face Pain. 2007;47(2):213–24. https://doi.org/1 37. Mansournia MA, Jewell NP, Greenland S. Case-control matching: effects,
0.1111/j.1526-4610.2006.00688.x. misconceptions, and recommendations. Eur J Epidemiol. 2018;33(1):5–14.
16. Friedman DI, De Ver Dye T. Migraine and the environment. Headache J https://doi.org/10.1007/s10654-017-0325-0.
Head Face Pain. 2009;49(6):941–52. https://doi.org/10.1111/j.1526-4610.2009. 38. Bivand RS, Pebesma EJ, Gomez-Rubio V. In: Gentleman R, Hornik K,
01443.x. Parmigiani G, editors. Applied spatial data analysis with R. New York, NY:
17. Yang AC, Fuh J-L, Huang NE, Shia B-C, Peng C-K, Wang S-J. Temporal Springer; 2008.
associations between weather and headache: analysis by empirical mode 39. Hong S-Y, Wan L, Lin H-J, Lin C-L, Wei C-C. Long-term ambient air pollutant
decomposition. PLoS One. 2011;6(1):e14612. https://doi.org/10.1371/journal. exposure and risk of recurrent headache in children: a 12-year cohort study.
pone.0014612. Int J Environ Res Public Health. 2020;17(23):9140. https://doi.org/10.3390/
18. Turner L, Molgaard C, Gardner C, Rothrock J, Stang P. Migraine trigger ijerph17239140.
factors in a non-clinical Mexican-American population in San Diego county: 40. Adetona O, Ozoh OB, Oluseyi T, Uzoegwu Q, Odei J, Lucas M. An
implications for etiology. Cephalalgia. 1995;15(6):523–30. https://doi.org/10.1 exploratory evaluation of the potential pulmonary, neurological and other
046/j.1468-2982.1995.1506523.x. health effects of chronic exposure to emissions from municipal solid waste
19. von Mackensen S, Hoeppe P, Maarouf A, Tourigny P, Nowak D. Prevalence fires at a large dumpsite in Olusosun, Lagos, Nigeria. Environ Sci Pollut Res.
of weather sensitivity in Germany and Canada. Int J Biometeorol. 2005;49(3): 2020;27(24):30885–92. https://doi.org/10.1007/s11356-020-09701-4.
156–66. https://doi.org/10.1007/s00484-004-0226-2. 41. Kunkler PE, Zhang L, Johnson PL, Oxford GS, Hurley JH. Induction of chronic
20. Szyszkowicz M, Kaplan G, Grafstein E, Rowe B. Emergency department visits migraine phenotypes in a rat model after environmental irritant exposure.
for migraine and headache: a multi-city study. Int J Occup Med Environ Pain. 2018;159(3):540–9. https://doi.org/10.1097/j.pain.0000000000001124.
Health. 2009;22(3):235–42. 42. Kunkler PE, Zhang L, Pellman JJ, Oxford GS, Hurley JH. Sensitization of the
21. Szyszkowicz M, Stieb DM, Rowe BH. Air pollution and daily ED visits for trigeminovascular system following environmental irritant exposure.
migraine and headache in Edmonton, Canada. Am J Emerg Med. 2009;27(4): Cephalalgia. 2015;35(13):1192–201. https://doi.org/10.1177/033310241557484
391–6. https://doi.org/10.1016/j.ajem.2008.03.013. 5.
22. Lee H, Myung W, Cheong H-K, Yi S-M, Hong Y-C, Cho S-I, et al. Ambient air 43. Woo B, Kravitz-Wirtz N, Sass V, Crowder K, Teixeira S, Takeuchi DT.
pollution exposure and risk of migraine: synergistic effect with high Residential segregation and racial/ethnic disparities in ambient air pollution.
temperature. Environ Int. 2018;121(Pt 1):383–91. https://doi.org/10.1016/j. Race Soc Probl. 2019;11(1):60–7. https://doi.org/10.1007/s12552-018-9254-0.
envint.2018.09.022. 44. Colmer J, Hardman I, Shimshack J, Voorheis J. Disparities in PM2. 5 air
23. Chen C-C, Tsai S-S, Yang C-Y. Association between fine particulate air pollution in the United States. Science. 2020;369(6503):575–8. https://doi.
pollution and daily clinic visits for migraine in a subtropical city: Taipei, org/10.1126/science.aaz9353.
Taiwan. Int J Environ Res Public Health. 2015;12(5):4697–708. https://doi. 45. O'Neill MS, Jerrett M, Kawachi I, Levy JI, Cohen AJ, Gouveia N, et al. Health,
org/10.3390/ijerph120504697. wealth, and air pollution: advancing theory and methods. Environ Health
24. Chiu H-F, Yang C-Y. Air pollution and daily clinic visits for migraine in a Perspect. 2003;111(16):1861–70. https://doi.org/10.1289/ehp.6334.
subtropical city: Taipei, Taiwan. J Toxic Environ Health A. 2015;78(9):549–58. 46. De Lissovoy G, Lazarus SS. The economic cost of migraine. Present state of
https://doi.org/10.1080/15287394.2015.983218. knowledge. Neurology. 1994;44(6 Suppl 4):S56.
25. Mukamal KJ, Wellenius GA, Suh HH, Mittleman MA. Weather and air 47. Lipton RB, Stewart WF, Scher AI. Epidemiology and economic impact of
pollution as triggers of severe headaches. Neurology. 2009;72(10):922–7. migraine. Curr Med Res Opin. 2001;17(sup1):s4–12.
https://doi.org/10.1212/01.wnl.0000344152.56020.94. 48. Hu XH, Markson LE, Lipton RB, Stewart WF, Berger ML. Burden of migraine
26. Szyszkowicz M, Rowe B, Kaplan G. Ambient Sulphur dioxide exposure and in the United States: disability and economic costs. Arch Intern Med. 1999;
emergency department visits for migraine in Vancouver, Canada. Int J Occup Med 159(8):813–8. https://doi.org/10.1001/archinte.159.8.813.
Environ Health. 2009;22(1):7–12. https://doi.org/10.2478/v10001-009-0006-7. 49. Ferrari MD. The economic burden of migraine to society. Pharmacoeconomics.
27. Tustin AW, Hirsch AG, Rasmussen SG, Casey JA, Bandeen-Roche K, Schwartz BS. 1998;13(6):667–76. https://doi.org/10.2165/00019053-199813060-00003.
Associations between unconventional natural gas development and nasal and 50. Casey JA, Kim BF, Larsen J, Price LB, Nachman KE. Industrial food animal
sinus, migraine headache, and fatigue symptoms in Pennsylvania. Environ production and community health. Curr Environ Health Rep. 2015;2(3):259–71.
Health Perspect. 2017;125(2):189–97. https://doi.org/10.1289/EHP281. 51. Staines A, Crowley, D., Bruen, M. and O'Connor, P. Public Health and Landfill
28. Adgate JL, Goldstein BD, McKenzie LM. Potential public health hazards, Sites. Department of Public Health; Eastern Regional Health Authority;
exposures and health effects from unconventional natural gas development. Department of Public Health Medicine and Epidemiology, University
Environ Sci Technol. 2014;48(15):8307–20. https://doi.org/10.1021/es404621d. College Dublin; 2004.
29. Duren RM, Thorpe AK, Foster KT, Rafiq T, Hopkins FM, Yadav V, et al. 52. Garcia-Gonzales DA, Shonkoff SBC, Hays J, Jerrett M. Hazardous air pollutants
California’s methane super-emitters. Nature. 2019;575(7781):180–4. https:// associated with upstream oil and natural gas development: a critical synthesis
doi.org/10.1038/s41586-019-1720-3. of current peer-reviewed literature. Annu Rev Public Health. 2019;40(1):283–
30. Zavala-Araiza D, Alvarez RA, Lyon DR, Allen DT, Marchese AJ, Zimmerle DJ, 304. https://doi.org/10.1146/annurev-publhealth-040218-043715.
et al. Super-emitters in natural gas infrastructure are caused by abnormal 53. Hays J, McCawley M, Shonkoff SBC. Public health implications of
process conditions. Nat Commun. 2017;8(1):1–10. environmental noise associated with unconventional oil and gasYou can also read