The Future of Leon County - A Report on the Status of Our Young Children - Whole Child Leon
←
→
Page content transcription
If your browser does not render page correctly, please read the page content below

The Future of
     Leon County
A Report on the Status of Our Young Children

                                                  NTAL
                                         L / ME
                                  IC A
                             YS
                        PH
                                                                                 NOM I C
                                                                                ECO
                 SP

                  RI
                       TU
                  I

                            AL                                           I NG
                                                               R   TUR
                                                  SA F E / N U

                 June 2016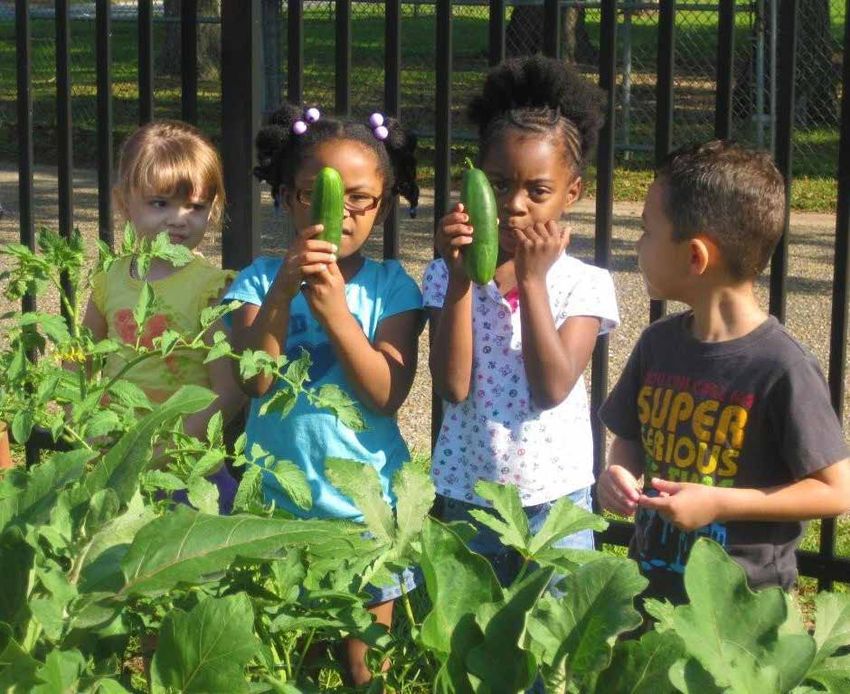
II

TABLE OF CONTENTS

Board of Directors............................................................................................................................ 2

Message from the Board................................................................................................................ 5

Status of Our Young Children......................................................................................................... 6

1. Healthy Babies, Healthy Beginnings.......................................................................................... 8
2. Family Stability............................................................................................................................ 16

3. Kindergarten Readiness ........................................................................................................... 23

Whole Child Leon Initiatives.......................................................................................................... 33

References...................................................................................................................................... 37

                                                                                                                                                      1
Whole Child Leon Board of Directors
                                                     Officers

                      Loranne Ausley                Matt Guse                      Shonda Knight
                       Founding and          Chief Executive Officer             Executive Producer
                       Current Chair         Early Learning Coalition              WCTV Anchor

                                            Acknowledgements
    The Whole Child Leon Board of Directors and staff would like to extend a special thanks to Meade
                          Grigg for his trememdous contribution to this report.

                                                        Staff
                                               Located in the Bloxham Building
                                               725 South Calhoun Street, Tallahassee, FL 32301

                                               For more information visit our website
                                               www.WholeChildLeon.org                   or call   850.487.7316
        Courtney Atkins      Marie Bryant
       Executive Director   Communication
                              Specialist

2
Whole Child Leon Board of Directors
                                                       Directors

   Laurie Dozier       Carla Doolin-Paredes          Susan Meinert Ellis           Ed Feaver           Martha Fletcher
  President, Mad           PhD Candidate              Licensed Clinical             Retired                Director
  Dog Design &            Education Policy          Social Worker, Infant/     Child & Outdoors      Leon County Schools
   Construction        Florida State University       Early Childhood             Advocate             Early Childhood
    Company                                             Mental Health                                     Programs

  Kristy Goldwire           Ed Holifield, MD          Natalie A. Kato           Arnold McKay             Holly McPhail
 Executive Director        President & CEO           Associate, Lewis,            Community                 Parent
Capital Area Healthy   Tallahassee Initiative for   Longman & Walker,        Investment Manager         Representative
   Start Coalition           Social Justice                P.A.              United Way Big Bend

  Brian R. Norris        Julia St. Petery, MD       Jacquelyn C. Steele      Connie Styons, RN, MN    Peggy Youngblood
   Principal &               Pediatrician            Human Resource           Tallassee Memorial       Divisional Director,
  Geographer                                              Director                Healthcare,         Elementary Schools
Canaan Consulting                                   Florida Commission       Women’s & Children’s    Leon County Schools
      Group                                         on Human Relations              Services

                                                                                                                         3
4

Message from the Board
Communities that commit to ensuring               These deficits can be overcome if our
all children are born healthy and are             community is committed to the following:
given an equal opportunity to develop to
                                                     TT Investing local dollars to create
their full potential are communities that
                                                        more quality early childhood
thrive. These communities understand
                                                        learning centers
the relationship between their long term
vitality and healthy birth outcomes,                 TT Using economic development
economic stability for all families, a safe             incentives to attract and support
and nurturing environment, and readiness                employers who utilize family
for kindergarten.                                       friendly practices (paid maternity
                                                        and paternity leave, support
Leon County has the ingredients to
                                                        breastfeeding) and pay a livable
be a strong community: good schools
                                                        wage,
and institutes of higher education, a
manageable size, an attractive natural               TT Lobbying state government
environment, a diverse population, and                  to accept federal dollars to
sufficient wealth to do the right thing for all         expand Medicaid so all women
its children.                                           of reproductive age will have
                                                        continuous primary health care
Unfortunately, we have serious deficits
                                                        including nutrition education,
with respect to child wellbeing that erode
our community’s potential for greatness:             TT Requiring middle and high schools
excessive low birth weight and infant                   to include health and family
mortality; too many children born into                  building education for all students,
poverty; unsafe neighborhoods and                       and
polluted environments; insufficient quality
                                                     TT Engaging residents from all
early childhood learning centers; and high
                                                        segments of the county in designing
percentages of families whose household
                                                        and implementing strategies
income is substantially below the amount
                                                        that create safe and nurturing
required to provide an equal opportunity
                                                        environments.
for their children to thrive.

Human beings are the only species that can will their own
destruction. Conversely we are the only species that can will
our success. Doing nothing results in the former. Willing success
requires action.

                                                                                               5
The Future of Leon County:
A Report on the Status of
Our Young Children

     The first 5 years of life are the most
     important years for the development
                                                     Demographic
     of the child. This period is critical to        Profile of Leon
     acquiring social, emotional and cognitive
     skills and building the foundation for          County Children
     physical, mental and emotional health
                                                     Leon County’s 2015 population is estimated
     and wellbeing. From birth to age 5 the
                                                     at slightly over 286,000. Children under
     brain develops faster than at any other
                                                     18 years of age comprise 19 % of the total
     stage in life, with ninety percent of brain’s
                                                     population, with 14,900 children younger
     physical development by age 3.25 This
                                                     than age 5, and 54,700 school-age
     development is particularly affected
                                                     children between 5 and 18 years of age.
     by the quality of adult/child interaction.
                                                     While the 5 year annual population growth
     Early childhood development lays the
                                                     rate has been around 3%, the population
     foundation and sets the course for
                                                     is projected to grow to 328,900 by 2030,
     what will happen when the child enters
                                                     with an annual growth rate decreasing to
     kindergarten and beyond.
                                                     about 1% for this period.
     To ensure that Leon County children
                                                     Leon County Public Schools (LCS)
     get the best start in life, we need to
                                                     enrollment increased by 1.6% in the last
     understand the issues that foster or inhibit
                                                     five years to 33,700. The projections for the
     positive developmental outcomes and to
                                                     next three years show a very slim increase
     identify what can be done to strengthen
                                                     in enrollment by less than 700 students to
     and support children and their families.
                                                     34,432, or less than 1% increase per year.
     This report is organized around three
                                                     Leon County schools are racially and
     major areas: 1) healthy babies, healthy
                                                     ethnically diverse with 44% of the students
     beginnings; 2) family stability; and 3)
                                                     being black, 43% white, 4% Hispanic, 4%
     school readiness. Rather than utilize a
                                                     Asian, less than 1% American Indian, and
     multitude of indicators, each of the areas
                                                     less than 1% Pacific Islander. There are
     includes an overview of the status of
                                                     over 600 students or 2% who are English
     children in Leon County using a select few
                                                     language learners in the current school
     key indicators and associated risk factors
                                                     year.
     for poor developmental outcomes. Each
     section will conclude with Whole Child          Title I public schools serve predominantly
     Leon recommendations for strategies             low-income students. The number of Title
     to improve the status of children in Leon       I schools in Leon County include 12 of the
6    County.                                         24 elementary schools, 2 of the 8 middle
Families with Children in Poverty by
       Leon County Census Tracts

schools, and 2 of the 5 high schools. Title     Almost 1 in 4 persons (24%) are below
I elementary and middle schools serve           the poverty line, with about the same
student populations where 75% or more           proportion of children under 18 in poverty
students are eligible for free or reduced       at 23%, and over 46% of single parent
lunch and for high schools the level is         households with children where the parent
72%.                                            is a woman are in poverty.

Leon County holds the distinction of            The above map shows the rate of poverty
being the most highly educated county           for Leon County families raising children.
in the state, ranking 1st in Florida counties   For reference, the US poverty rate in 2014
with 44% of persons 25 and older having         was 14.8%. As you can see, poverty
a bachelor’s degree or higher. While            affecting children in Leon County is
Leon County is slightly above average for       concentrated. This concentrated poverty
median household income ranking 24th,           leads to a host of other issues making it
the distribution of income shows a different    even more difficult for struggling families to
picture. The county is ranked 54th in the       provide a safe and nurturing environment
proportion of the population in poverty.        for their children.                              7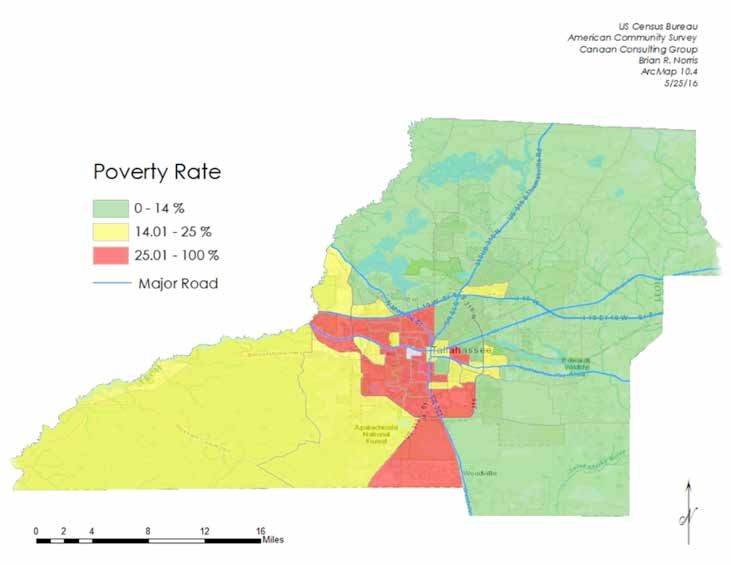
1   Healthy Babies,
     Healthy Beginnings
     Health is the foundation for the overall growth and development of
     the child. If a child’s physical and mental health are at risk, then the
     child’s development is at risk.

     INFANT MORTALITY
                                                    that did not begin declining until the 2003-
     The infant mortality rate is a broad measure
                                                    05 period. While the gap with the state
     of population health that reflects not only
                                                    rate has narrowed, the Leon rate remains
     the underlying wellbeing of mothers, infants
                                                    higher than the state and ranks 45th of 67
     and families. It is also a broader gauge of
                                                    counties in Florida for the most recent 2012-
     the community and social environment
                                                    2014 period. The twenty year reduction in
     that cultivates health and wellbeing. Over
                                                    infant deaths from 8.9 per 1000 births to
     the last twenty years, Leon County infant
                                                    7.3 equates to a reduction of fewer than 5
     mortality has been higher than the state
                                                    infant deaths per year from the over 3,000
     rate (figure 1). Unlike the state rate, Leon
                                                    annual births in Leon County.
     has not seen a consistent decline in infant
     mortality for this time period. Rather, the    In the 2012-14* period, 66 infants died in
     1991-93 period marked the beginning of         Leon County before their first birthday,
     a significant increase in infant mortality     yielding a 3 year infant mortality rate of

                Figure 1. Infant Mortality: Leon County and Florida
                               3 Year Rates, 1995-2014

8
7.3 deaths per 1,000 live births. About
two-thirds of infant deaths (44) occurred
in the neonatal period or within the first
month of life, with the remaining third (22)
of infant deaths occurring in the post-
neonatal period from one month to less
than one year. Deaths in the first month are
primarily related to prematurity, congenital
anomalies and other conditions occurring
prior to birth. After the first month,
most deaths are the result of sudden
unexpected infant death syndrome (SUID),
congenital anomalies, infection and
injury.26
*Due to the statistical instability
of relatively small numbers in Figure 2. Infant Mortality by Race
Leon County, this report uses 3 Leon County, 3 Year Rates 1995-2014
year rates where appropriate.
Significant and persistent
disparities by race contribute to
higher rates of infant mortality
in Leon County. In the 2012-2014
period, black mothers in Leon
County were 2.3 times more
likely to have an infant die than
a white mother (a black rate
of 10.7 vs 4.6 for whites) (figure
2). This disparity has been
essentially the same for the last
twenty years.
continued
9PRETERM BIRTH AND
Figure 3. Premature Births: LOW BIRTH WEIGHT
Leon County and the State Preterm birth and low birth
3-Year Rates, 1995-2014 weight are the leading causes
of infant death and disability.
Babies born preterm (before
37 completed weeks of
gestation) or at low birth weight
(less than 5.5 pounds) are at
increased risk of immediate
life-threatening problems as
well as long-term complications
and developmental delays.
Newborn complications include
respiratory distress, anemia,
infection and jaundice. Long-
term consequences can
include lung problems, cerebral
palsy, vision and hearing loss,
and learning and behavioral
Figure 4. Low Birth Weight Births: problems.26 Preterm birth and
Leon County and the low birth weight are extremely
State 3-Year Rates, 1995-2014 costly, at an estimated national
cost of $26 billion annually that
includes medical care, early
intervention and lost productivity
due to disability.4 Smoking,
poor nutrition, poverty, stress,
infections and violence can
increase the risk of a baby being
born prematurely and of low
birth weight.26
Unlike the infant mortality rate,
the use of preterm and low birth
weight as indicators of infant and
child wellness are more directly
related to measuring children
who are at risk for both short-
term and long-term health and
development problems which
directly impact the child, the
family and the community.
Using three year rates for the
most current years of reporting
10(2012-2014), 12.7% of the babies
were born premature, or 385
Figure 5. Premature Births By Race
babies per year (figure 3). For
Leon County
the same period, 9.7% of the
3-Year Rates, 1995-2014
babies were of low birthweight,
or 293 babies per year (figure 4).
Looking at trends over the last
twenty years, there has been
no significant change in the
prematurity rate in Leon County
(from 12.9% to 12.7%). However,
there has been an increase
in the proportion of low birth
weight babies, from 8.4% for
1993-1995 period to 9.7% for the
2012-2014 period.
Black babies were most likely to
be born prematurely, at 16.7%
compared to 9.6% for white
babies (figure 5). While both
white and black mothers saw a
slight reduction in prematurity Figure 6. Low Birth Weight Births By Race
rates over this twenty year Leon County, 3-Year Rates 1995-2014
time period, the relative gap
between black and white rates
remained the same, with a
black mother being 1.7 times
more likely to have a premature
baby.
A rise in the proportion of
low birth weight babies was
experienced by both blacks
and whites over this 20 years
(figure 6). However, the white
rise from 6.1% to 6.3% is very
slight and not significant. In
contrast, the black rate rose
significantly from 12.6% to
14.3%. The racial gap in low
birth weight has also remained
essentially the same for twenty
years, with black mothers over
twice (2.3) as likely to have a
low birth weight baby.
continued 11MATERNAL HEALTH low birth weight. Over one-third (34.3%)
Preconception Care of the births in Leon County are spaced
closer than 18 months apart.
If low birth weight and prematurity are
to be reduced, increasing access to TT Repeat teen pregnancies
quality preconception care is paramount. Teen pregnancies are an indication
This care should include preventive of gaps in receipt of primary health
interventions to reduce prematurity and care and health education for young
low birth weight including such things people, including family planning
as screening and counseling to reduce and counseling regarding health
smoking, alcohol and substance use and appropriate birth intervals. In Leon
obesity in pregnancy. In addition, this care County, of the teens giving birth, over
should provide counseling regarding the 15% were their second child.
prevention of unintended and rapid repeat TT Overweight and obese mothers
pregnancies. Overweight and obese women have
Indicators Related to Improving increased risks of preterm birth, low
Preconception Health of Pregnant Women birth weight and infant death. In Leon
County, 45.9% of the mothers were
TT Spacing of pregnancies overweight or obese at the time they
Inter-pregnancy intervals shorter than conceived (2011 data).
18 months are significantly associated
with increased risk of prematurity and
12Indicators Related to Improving Prenatal That proportion has not changed
and Postpartum Health that Foster Healthy since reporting began in 2004 and
Infants and Children 2005. Breastfeeding practices vary
considerably by maternal race, age
TT Smoking during pregnancy
and education. For the latest reporting
Smoking before and during pregnancy
period, 66% of black mothers in Leon
is associated with fetal growth
County initiated breastfeeding as
restriction/low birth weight, heightened
compared to 87% of the white mothers.
risk for sudden infant death, among
The only data available regarding
other notable maternal complications.
duration of breastfeeding comes from
In 2014, 135 women in Leon County
the Special Supplemental Nutrition
reported smoking during pregnancy.
Program for Women, Infants, and
TT Adequacy of prenatal care Children (WIC) that shows for the 2014-
Almost one-quarter (23%) of the 15 period, only 28% of WIC mothers
mothers in Leon County received who initiated breastfeeding continued
inadequate prenatal care when breastfeeding for at least 26 weeks and
measured by the Kotelchuck Index (the only 10% of the mothers breastfeed
most widely used index that measures exclusively for at least 26 weeks.
when prenatal care began (initiation)
and the number of prenatal visits
during pregnancy).
TT Breastfeeding
Breastfeeding promotes the health
and development of infants, not only
through the direct benefits of mother’s
milk to the infant’s immune system,
but also from the benefits of mother-
child bonding and the positive effects
on emotional and psychological
development. The American Academy
of Pediatrics recommends exclusive
breastfeeding with no supplemental
food through the first 6 months of life
and continued breastfeeding through
at least the first year. Nationally, three-
quarters of new mothers initiated
breastfeeding, a little less than half
breastfed for the first 6 months, and
only 16% exclusively breastfed for 6
months (2010).26
For the 2012-2014 period, 78.3% of
all Leon County mothers initiated
breastfeeding in the hospital.
continued 13TT Child Nutrition and Obesity assess children under the age of two
Obese children are at risk for many annually for overweight and obesity.
adverse health outcomes which Data for 2014 show that almost one-
affects their overall development and quarter (24%) of those under two
wellbeing. These include high blood are overweight or obese. While this
pressure and cholesterol, asthma percentage has varied slightly over
and many other chronic physical the last ten years it has not significantly
and psychosocial health conditions. improved.
Children who are overweight or
Available local data shows that as
obese are more likely to have severe
children get older the proportion
obesity, hypertension and diabetes in
of overweight and obese children
adulthood.26
increases. Newly collected information
Limited local data is available on from the county health department for
over-weight/obese children in very the 2015-16 school year shows that 27%
early child-hood. However, the Special of 1st graders, 33% of 3rd graders and
Supplemental Nutrition Program for 40% of 6th graders are overweight or
14 Women, Infants, and Children (WIC) obese.Recommendations for policies/ Examples of Existing
programs/activities to address the Supportive Programs/
issues: Activities:
TT City and county government and TT Tallahassee Memorial
business community aggressively HealthCare’s Baby
lobby the Florida legislature to expand Friendly Designation
Medicaid as allowed through the
TT Annual Maternal Child
Affordable Care Act.
Health Conference
TT Bolster health care provider efforts to and Community
administer behavioral, developmental, Forum
and mental health screenings in
TT Kids Incorporated –
accordance with recommended
Prenatal Program
frequency and add adverse childhood
experience (ACE) screenings to existing TT The Abiyamo Birthing
standards of pediatric practice. Project
TT Engage residents from all segments TT Breast Feeding
of the county in designing and Policy Community
implementing strategies that create Workgroup
safe and nurturing environments
TT Capital Area Healthy
for children—perhaps a series of
Start Coalition’s Home
community forums over the next
Visiting and MomCare
year facilitated by the county and
Programs
the city with participation from law
enforcement and conducted in the TT FSU College of
communities involved. Medicine’s Maternal
Mental Health
TT Family Friendly Business Practices
Advisory Board
to promote breast feeding by
encouraging private and public TT FSU Center for
employers to implement breastfeeding Prevention and Early
support practices in the work place. Intervention Policy
-Young Parent Project
TT Encourage the Early Learning Coalition
to include breastfeeding support TT Childhood Obesity
services and proper nutrition as Prevention Education
requirements for child centers that serve Coalition
children who receive subsidized care.
TT 95210-The Whole
The quality rating criteria should include
Picture of Health
both.
campaign
TT Paid Maternity Leave
TT The Oasis Center for
TT Funding for Capital Area Healthy Start Women and Girls –
Coalition’s Preconception Health Single Mom Support
Program Group
TT Require stand -alone health education TT PACE Center for Girls
classes in middle school
152 Family Stability
Safe, stable, and nurturing environments range of chronic health conditions and
are essential to prevent child maltreatment health risk behavior.3 Exposure to two or
and to assure children reach their full more adverse childhood experiences
potential. Poverty and financial instability is more common among children living
are associated with destabilizing in low-income families. The prevalence
relationships and behaviors which result of two or more of such experiences was
in adverse childhood experiences, such 35% in families below 100% of poverty,
as physical, sexual or emotional abuse, 29% in families 100-199% of poverty, 21%
living with someone who has problems in families 200-399% of poverty, and 10%
with alcohol or drugs, living with a parent in families 400% or more of poverty. The
who was divorced or separated after the more financially secure a family is, the less
child was born, or living in a household likely their children will experience adverse
that often had difficulty affording childhood experiences. Exposure to such
basics like housing and food. These experiences also affect young children’s
relationships and behaviors often result in readiness to learn. Children experiencing
adverse childhood experiences, which two or more adverse experiences are
affect social, emotional and cognitive nearly three times more likely to repeat
development and are linked to a wide at least one grade in school and almost
16Figure 7. Families with Children Under 18 and Under 5 Years
of Age Below Poverty, Leon County 2000, 2007-2014
twice as likely to be diagnosed with ADHD financial stress and instability poverty
or other behavior-related problems.5 places on the family can impede
children’s cognitive ability and their
The family has an enormous influence on
ability to learn, and can contribute
the child’s development and wellbeing
to behavioral, social and emotional
and no time in the development of the
problems and poor health. The risks
child is the family more important than the
associated with economic hardship are
critical early years of development from
greatest among children experiencing
birth to age five. During this period the
poverty earliest in life and among those
family provides the context within which
who experience persistent and extreme
children develop their social, emotional
poverty.11
and cognitive foundation.
In 2014, one in every six families (16.2%)
in Leon County with children under 18
CHILDREN IN POVERTY years of age were living in poverty. This
represents approximately 4600 families
Growing up in poverty is one of
and 12,000 children. The proportion of
the greatest threats to the healthy
families in poverty with children under
development and overall wellbeing of
age 5 is essentially the same as families
a child. Poverty affects many aspects of
with older children at 16.1%. This represents
the child’s life, including living conditions,
1,033 families and 4,060 preschoolers
nutrition, access to health care, and
(figure 7).
participation in quality child care. The
continued 17Figure 8. Comparison of Black and White Families in Poverty,
Leon County 5-Year Estimates 2010-2014
Significant disparities between black and other states and Rutgers University—
white families exist in the county. Using the Newark’s School of Public Affairs and
latest five year Census estimates, black Administration to develop estimates of
families with children are 3 times more a “financial survival income threshold”.27
likely to be in poverty than white families This survival threshold was based on the
with children (figure 8). One-third (34%) actual cost of housing, child care, food,
of all black families with children live in transportation, health care, and taxes in
poverty compared to one in ten (9%) white each of the counties in Florida. The term
families with children. ALICE, an acronym for Asset Limited,
Income Constrained, Employed is used to
As high as these poverty levels are
describe families that earn more than the
for children and families, they do not
U.S. poverty level, but less than the basic
reveal the entire magnitude of family
cost of living for the county. Combining
financial instability in Leon County. The
the households in poverty with the ALICE
methodology for estimating the official
households arrives at the total populations
U.S. poverty rate was last modified in 1974
struggling to afford basic necessities.
and is not adjusted for differences in cost
of living between states or counties. In Estimates from this report show that in
fact, an adequate living standard requires 2012 the “household survival budget” for
far more income. In 2005, an Economic a family of four (infant and pre-k children)
Policy Institute study of family budgets in Leon County was more than double
determined that up to three times more the official U.S. poverty level, or $47,493
families fall below the standards of “safe compared to the poverty threshold of
and decent-yet modest living standard” as $23,050. The total number of households
fall below the official poverty line.1 falling under the survival budget threshold
was 59,207 households or 54% of all the
Addressing the under-estimation of the
households in the county. This compares to
number of families who are financially
45 percent of the state’s households.
struggling, the United Way of Florida
partnered with the United Way in four Using the household survival budget
18Table 1. Families with Children At Risk for
Financial Instability 2014
Adjusted for Household Survival Budget Estimates
Number Between
Number Under 100% Poverty and
Total At Risk
100% of Poverty Under Survival
Budget
Families with Children Under 18 4,606 5,481 10,087
Children Under 18 11,889 14,148 26,037
Families with Children Under 5 1,033 1,229 2,262
Children Under 5 4,060 4,831 8,891
to conservatively estimate the number FAMILY STRUCTURE
of children and their families at risk for
financial and social instability would result The number of parents in the household
in an increase in of the following depicted plays an important role in the growth
in (Table 1). and development of children. Children
growing up in single-parent families
Recently released county level estimates typically have access to fewer economic
of food insecurity for 2014 produced and emotional resources than two-parent
by Feeding America underscores the families. Children in single-parent families
relationship between financial status and are more likely to have poorer health
family stability and the need for expanded outcomes, learning disabilities and are less
benchmarks of financial instability far likely to graduate from high school or go to
above federal poverty levels. An estimated college.8
21.8 percent of Leon County residents were
food insecure at least some time during During the 2010-2014 period, 30,282 or 58%
the year in 2014, meaning they lacked of children less than 18 years of age lived
access to enough food for an active, in households with two parents, 14,646 or
healthy life. Leon County has the third 28% lived in a mother-only household, and
highest level of residents experiencing 3,149 or 6% lived in a father-only household
food insecurity among Florida’s 67 (figures 9 and 10 on the following page).
counties. The food insecurity rate for Leon Comparing 2006-2010 with 2010-2014,
County children is estimated at 23.2% the proportion of children under 18 years
(12,550 children) with 45% of these children of age living in two-parent households
over 185% of federal poverty levels. increased slightly, while at the same time
Food insecurity is particularly significant the percentage of children living in single
among children due to their increased parent families (both mother and father
vulnerability and the potential for long- only households) decreased slightly from
term impacts on cognitive and social- 35% in 2006-2010 to 34% in 2010-2014
emotional development, poorer school period.
performance and general health and Family structure differs with race and
wellbeing. ethnicity. During the 2010-2014 period,
(see http://www.feedingamerica.org/hunger-in- 6,680 or 24% of white children, 12,756 or
america/impact-of-hunger/child-hunger/child- 62% of the black children and 34% of
development.html)
continued 19Figure 9. Family Structure for Children Under 18 in
Leon County, 5-Year Estimates 2010-2014*
*
Figure 10.
Number of Children By Family Structure Type
5-Year Estimate, 2010-2014
20Hispanic families lived in single-parent
households
Family structure is also related to
household income and poverty. Single
parent families are particularly vulnerable
to poverty and low income. In 2010-2014,
Leon County children in single parent
households were over 4 times more likely to
live in poverty (43%) than children in two-
parent households (9.8%).
By far the highest and most persistent rates
of poverty are experienced by families
headed by single mothers. Families with
preschool age children are hit the hardest.
In 2014, over half (57%) of families with
preschool age children headed by a much higher levels of poverty; beginning
single female were in poverty with almost in 2000 with a very high rate of 46% rising
half (46%) with children under 18 were in to a rate of between 60% and 57% from
poverty (figure 11). Poverty decreased for 2010 to 2014. Most alarming is the fact
these families in the 90’s only to rise from that the recession hit this group of families
33% in 2000 for families with children under the hardest with no evidence yet that
18 to 46% in 2014. Families with preschool the poverty levels have declined to pre-
children saw a similar effect but with recession levels.
Figure 11. Families with Female Head of Household with
Children Under 18 and Under 5 Years of Age in Poverty
21Recommendations for policies/ Examples of
programs/activities to address the Existing Support
issues: Programs /Activities
TT Encourage local governments, those who TT Tallahassee Food
contract with local governments and who Network’s iGrow
receive incentives from local government Urban Agriculture
to move towards a more livable wage of Program
at least $10 per hour.
TT Capital Area
TT Encourage banks and credit unions Community Action
to create short term, low interest loans Agency’s Getting,
for emergency relief to stop predatory Staying Ahead
lending. Program
TT Encourage financial institutions (banks TT Goodwill Industrial-
and credit unions) to provide low interest Big Bend, Inc. -
loans to startup businesses that will be Career Campus
located in low income neighborhoods, Program
employ residents of these areas.
TT Career Source
TT Encourage expansion of community Jobseekers
gardens, eco-tourism, installation and
TT Tallahassee
maintenance of solar units on homes).
Community
TT Use economic development incentives College Work Force
(e.g. Blue Print 2000) to attract and Development
support employers who utilize family
TT Lively Technical
friendly practices (paid maternity and
Center
paternity leave, support breastfeeding)
and pay a livable wage. TT FAMU Small Business
Development
TT Encourage all businesses to implement
Center
family friendly practices that enable
single parents to maintain continuous TT America’s Second
employment (maybe some tax incentives Harvest of the Big
tied to this). Bend
TT Encourage prominent business leaders to
leverage their networks and experiences
to prompt their peers to invest in every
child’s pathway to success, and to
support “family friendly” workplace
policies.
223 Kindergarten Readiness
Early childhood growth and development quality of early childhood development
sets the foundation for K-12 and beyond. affects physical and mental health.
From birth to age 5, children acquire Comprehensive early childhood programs
language, develop social-behavioral, that include health, nutrition, and learning
learning and problem-solving skills and reduce risk factors associated with
obtain knowledge that is essential for hypertension, diabetes and other chronic
helping them succeed in school and in life. diseases and increase the likelihood
When a child enters kindergarten ready that a child will achieve higher levels of
for school with literacy and attention- occupational achievement and income.15
related skills, they are more likely to have
The five domains that are commonly
later academic success.9 Children who
understood to define healthy child
do not get high-quality early childhood
development are also the same key
experiences are 25 percent more likely
elements of kindergarten readiness. The
to drop out of school, 40 percent more
domains include: physical well-being
likely to become teen parents, and 60
and motor development; 2) social and
percent less likely to attend college.22,23
Furthermore, it has been shown that the continued 23emotional development (positive social school year there have been two major
behaviors when interacting with others); types of screening instruments used to
cognitive skills (including numbers, determine readiness:
patterns, and shapes); 4) language
1) Literacy/Emergent Reading Readiness:
and early/emergent literacy; and 5)
Measures two basic skills, letter
approaches to learning (the ability to
recognition and initial sound fluency/
concentrate and follow directions).
phonemic awareness, and the results
These domains are interrelated, so for
are used to assess reading readiness.
example, a child’s ability to regulate
From 2006-07 through 2008-09 the
emotions, thoughts and behaviors can
Dynamic Indicators of Basic Early
help them manage stress and control
Literacy Skills (DIBELS) was used. In
their impulses so that they can learn more
2009-10, the Florida Assessment for
easily in school. Children may be more
Instruction in Reading (FAIR) was used.
developed in some domains than others
In 2014-15 an expanded version of the
and their development does change
FAIR, FAIR-FS, was implemented.
over time, especially with the right kind of
environment and support.19,24 2) Multi-Domain, General Readiness
Screening: Screens for several more
The social, emotional and behavioral
domains of readiness and uses subsets
components of a child’s development are
of more comprehensive, commercially
complex and early childhood education
available instruments. The Early
requires more than development of
Childhood Observation System
cognitive skills13. Social, emotional and
(ECHOS) was used from 2006-2007 until
behavioral difficulties are now among
2014-15 when it was replaced with the
the top five chronic disabilities affecting
Work Sampling System (WSS).
children in this country and they are more
than twice as likely to occur in children in Due to difficulties experienced during
poverty.12,20 These problems usually start implementation of the two new readiness
before children enter school and affect screening instruments beginning in the
their ability to manage emotions, follow 2014-15 school year, the 2016 legislature
directions, solve problems, organize and directed the Florida Office of Early
complete tasks, and get along with peers Learning not to accept readiness rates for
and adults, all of which are necessary for 2014-2015 or 2015-2016 school years. For
learning in the classroom. If not addressed, this reason, this report uses the last official
these problems can have adverse effects kindergarten readiness data for the 2013-14
on children’s academic success and future school year.
income.6,18
Readiness levels for emergent reading
There was no statewide standard for for Leon County show that for the last
screening a child’s readiness for school available year of data, 2013-14, a little
until the legislature mandated this over one in five children (22%) entering
requirement in 1997. The statewide system kindergarten were not consistently
was implemented in 1999-2000. Although demonstrating the skills required for
the actual screening instruments have kindergarten in this area (figure 12).
24 changed over the years, since the 2006-07 Although not totally comparable, trendFigure 12. Kindergarten Early Literacy/Reading Readiness
Using FAIR School Years 2009-10 Thru 2013-14
Figure 13. Kindergarten Early Literacy/Reading Readiness
Using Dibels, School Years 2005-06 Thru 2008-09
data using two different screens (FAIR Readiness levels using the broader
and DIBELS) show that there has been developmental screen of kindergarten
improvement in these reading/language readiness, ECHOS, shows slightly lower
readiness scores over the last ten years proportions of children ready for
(figure 13). continued 25Figure 14.
Kindergarten Readiness (ECHOS) By Level Demonstrating Skills
School Years 2005-06 Thru 2013-14
kindergarten, with a little over one in four in Leon County. Comparing readiness
children (27-28%) entering kindergarten levels between children entering Title I
not consistently demonstrating the elementary schools (those serving a high
necessary skills (figure 14). The trend in proportion of low-income neighborhoods)
this broader developmental screen shows with those entering non-Title I schools
no real change over the most recent shows significant differences in readiness
years, with the percentage of children (table 2). On reading readiness, 35
not consistently demonstrating the skills percent of the children attending Title
necessary for kindergarten ranging I elementary schools for 2012-13 were
between 26-29%. not consistently demonstrating the skills
necessary for kindergarten upon entry
Following the previous discussion on the
compared to 13% of the children in non-
influence of poverty and family stability, it
Title 1 schools. Results from the broader
is no surprise that school readiness varies a
developmental screen, ECHOS, show
great deal by family income. Results from
that 44 percent of the children attending
the National Early Childhood Longitudinal
Title I elementary schools for 2012-13 were
Study found that less than 50% of low-
not consistently demonstrating the skills
income children enter school with the
necessary for kindergarten compared to
essential skills needed to be successful,
21% of the children in non-Title 1 schools.
compared to 75% of higher income
The readiness results are very similar for
children.16 Moreover, these disparities
both screens; children attending Title
widen over time.9
I elementary schools were over two
Significant disparities of readiness levels and one-half times more likely not to
26 based on family income are evident be consistently demonstrating the skillsTable 2.
Comparison of Leon County School Children Not Ready for Kindergarten
In Title 1 (Low-Income) Schools and All Other Public Elementary Schools Readiness on
Emergent Reading Readiness and General Readiness, Fall 2012
Emergent Reading Readiness General Readiness
(FAIR) (ECHOS)
Total Number of Percentage of Total Number of Percentage of
Number of Students Not Students Not Number of Students Not Students Not
Students Consistently Consistently Students Consistently Consistently
Screened Demonstrating Demonstrating Screened Demonstrating Demonstrating
2012-13 Necessary Skills Necessary Skills 2012-13 Necessary Necessary Skills
Title 1/All Other
Skills
Schools
Title 1 Schools 883 309 35% 1,089 479 44%
Non-Title 1 Schools 1,221 165 13% 1,243 259 21%
Total 2,104 473 22% 2,332 437 32%
Source: Florida Department of Education, Office of Early Learning
necessary for kindergarten using the
reading readiness screen than children
attending non-Title 1 schools; and on the
broader developmental screen, children
attending Title I elementary schools were
twice as likely not to be consistently
demonstrating the skills necessary for
kindergarten than children attending non-
Title 1 schools.
The data on kindergarten readiness for
Leon County is cause for concern. One of
every four children entering kindergarten
is not fully ready to participate, and these
numbers have remained fairly constant
over the last ten years. Even more alarming
are the significant disparities in readiness
based on the economic status of a child’s
family. As the research shows, without
significant efforts to reduce the gap in
readiness in the early grades, the gaps
found upon entry into kindergarten persist served by a Title 1 school in Leon County,
and even widen as children go through they are two and one-half times less likely
the school system, resulting in a host of to be consistently demonstrating the skills
poor outcomes for the child, the family necessary for kindergarten than a child
and the community. Thus, due to situations entering a non-Title 1 school. These gaps
not under the control of a young child, one in readiness significantly reduces the
in four children enter kindergarten at a likelihood that every child has an equal
distinct disadvantage in Leon County. If a chance to succeed in school and in life.
child lives in a low-income neighborhood continued 27Leon County single year Census estimates
for 2014 (the latest year available) show
that over 2,100 or 41% of children ages
3 and 4 were not enrolled in preschool.
Caution should be taken when interpreting
one year census estimates as they are
prone to normal sampling variation from
year-to-year. However, the trend over
the last ten years show Leon County
experienced an expansion of enrollment
from 2005 to 2008, where in 2005 an
estimated 3,000 children (45%) were
not enrolled in preschool, to a low of
CHILDREN NOT ATTENDING 1,500 children (28%) not enrolled in 2008.
PRESCHOOL After 2009 enrollments fell back to levels
resembling those found in 2005 and 2006
High-quality pre-kindergarten programs
(figures 15 and 16).
for children age 3 and 4 are not only
important in preparing children for Looking at Leon County census estimates
success in kindergarten but lead to higher of 10 year trends in the percentage of low-
levels of educational attainment, career income children ages 3 and 4 who attend
advancement and earnings. Federally preschool yields interesting results (figures
funded Head Start and the Florida 17 and 18).From 2005-2008, the percent of
Voluntary Pre-Kindergarten Programs children enrolled in preschool in poverty
have expanded access but a great many averaged about 8%. Beginning in 2009, the
children, especially 3 year olds, continue proportion of children in poverty tripled to
to be left out. This situation continues to approximately 25% and appears to have
exacerbate socioeconomic differences in remained at that level after adjusting for
educational attainment. annual sampling variability.
continued
Figure 15.
Percent of Children Ages 3 and 4 Not In Nursery School/Preschool*
Leon County, 2005-2014 Estimates
28Figure 16.
Number of Children Ages 3 and 4 Not In Nursery School/Preschool*
Leon County, 2005-2014 Estimates
––––– Children Not in Nursery School/Preschool
Figure 17.
Percent of Children in Preschool Below Poverty
Leon County, 2005-2014
Figure 18.
Children Ages 3 & 4 in Nursery School/Preschool By Poverty Status
Leon County, 2005-2014 Estimates
29Table 3.
Changes Over Time in Leon County Preschool Enrollment for Children Ages 3 and 4
A Comparison of Two Time Periods
Census Estimates, 3-Year Averages 2005-2007 and 2012-2014
Number of Children Percent of Children
Average Average Adjusted Average Average Change
Annual Annual Change Annual Annual Between
2005-07 2012-14 Between 2005-07 2012-14 Periods
Periods
No. of Children 3 and 4 Years of Age 6,906 5,995 -911 -13.2%
Children Not Enrolled in Preschool 2,823 2,377 -74 40.9% 39.7% -1.2%
Children Enrolled Living Below 585 1172 762 11.6% 24.0% 12.5%
Poverty
Children Enrolled in Public School 1,656 2,083 645 40.6% 55.7% 15.1%
Children Enrolled in Private School 2,427 1,536 -571 59.4% 44.3% -15.1%
Source: U.S. Census, American Community Survey
The changes that have occurred during The Pre-Kindergarten Program (VPK) has
the ten year period beginning in 2005, are helped expand access to a preschool
best seen by using a comparison of the first curriculum that improves kindergarten
three years of the period with the last three readiness in children 4 years of age.
years of data available, 2012-14 (table Publicly funded, it began in the 2005-
3). Comparing the three year annual 2006 school year. VPK is provided in
averages for these two time periods a variety of settings, both public and
reveals several significant changes: private. VPK and instruction averages
less than a half of a school day. The
1) There appears to be no significant
latest figures indicate that 79 percent of
change in the proportion of 3 and 4
children who completed VPK were ready
year olds not enrolled in preschool,
for kindergarten, while only 55 percent
with the most recent period showing
of children who did not attend VPK were
an annual average of 39.7% not
kindergarten ready. There has been no
enrolled compared to 40.9% not
significant expansion of the program
enrolled in the earlier period.
since its inception. The enrollment in Leon
2) The proportion of children enrolled County has been between 2000 and 2200
who are below poverty has more four year olds, with an average annual
than doubled between these two enrollment of approximately 2,100 for
periods, representing an additional the last three years. An estimated 70% of
enrollment of 762 children below the total number of four year olds in the
poverty for the most recent period. county participated during the same time
period.
3) Parallel to the increase in low-
income students is the increase in There are numerous examples of
the percentage of children enrolled preschool programs that show significant
in publicly funded preschool, rising improvements in school readiness.
from approximately 41% in the 2005- High quality is the common element of
2007 period to 56% for the 2012-2014 preschool programs that have the largest
period. effect on both kindergarten readiness and
30 long term performance and achievement.These programs not only improve
academic achievement but also have
sustained benefits for other components
of school performance that include lower
rates of special education use, reduced
grade repetition, and higher high school
graduation rates.17 While beneficial to
children from all backgrounds, the positive
effects of successful programs tends
to be larger for more disadvantaged
children.14 The investment in high-quality
preschool programs is returned through
improved outcomes during the school-
age years and beyond. Investment in
high quality early childhood programs
for disadvantaged children delivers a
7-10% return on investment where the
short and long term costs are more than High-quality preschool programs require a
offset through reduction in the need for significant investment in resources. Despite
special education and remediation, better evidence that investing in early childhood
health outcomes, reduced need for social is critically important, there is substantial
services, low criminal justice costs and underinvestment in the development
increased self-sufficiency and productivity of children under five years of age. The
of the individual and their families.7,13,14 For National Institute for Early Education
those who begin kindergarten not fully Research which conducts annual surveys
ready and the longer schools and the of state preschool quality and access
community wait to intervene to correct the found that Florida’s 2014-15 Pre-K per-pupil
initial disadvantage, the more costly it is.13 spending is ranked 39th out of 43 states
who have Pre-K programs. In addition,
The most important component of
Florida’s Voluntary Pre-Kindergarten
effective preschool programs is high
program meets only 3 of 10 national
quality for which there are several
quality standards. Of the 41 states with
common features: the quality of the
Pre-K programs, Florida is not one of the
teacher-child relationship; employing
26 that require teachers to have at least a
a proven curriculum with teachers that
bachelor’s degree or the 37 that require
are trained to implement the curriculum
teachers to have training in Pre-K or early
effectively; quality supports through
childhood.21
teacher coaching and professional
development; and a systematic approach More and more states and local
to monitoring and improving quality.17 communities are understanding that
Most importantly, there is evidence that without more investment in access to cost
investing in preschool programs without effective quality early learning programs
investing in high-quality programs may before age 5, the disparities in K-12 school
result in few if any of the benefits found performance and beyond may not
with the most successful programs.28 improve and could increase. 31Recommendations for policies/programs/activities to
address the issues:
TT Invest local dollars to increase quality TT Support public awareness of and family
funding for Leon County children education about the importance of the
eligible for subsidized care from early years
approximately $3,500 per year to $5,000
TT Early childhood professionals who are
per year. A total annual increase of
essential to program quality should
approximately $2 million dollars
receive workforce training aligned
TT Encourage Community commitment to integrated quality standards in
to achieving universal access to a manner that protects workforce
high-quality early learning and care diversity and improves compensation.
programs for children age 0–5
TT create a “one-stop shop” online
TT Provide funding to Early Learning portal in conjunction with a physical
Coalition to support a rigorous quality referral center(s) to provide parents
rating system for all child care centers and caregivers with easy identification
and make the results public for each of and access to all available early
center. Require every licensed child childhood services
care center that receives any public
TT Invest in efforts to increase public
funding and is rated a quality center
awareness through a multimedia
to serve at least 25% of its children from
campaign that provides information
those eligible for subsidized care.
to families about the consequences
TT Insure that all children are read to for of toxic stress and the importance of
at least an hour a day from the day brain development. To do this, the state
they leave the hospital until they are should enlist a variety of messengers,
in kindergarten—impossible, maybe; including leaders of media, cities,
critical, absolutely. This requires counties, hospitals, libraries, business
engaging parents and volunteers— groups, schools, and other community
churches and social clubs may be organizations.
critical to get this done.
Examples of Existing Support Programs /Activities
TT Florida State University Center for Autism and Related Disabilities
(CARD) Autism Navigator
TT Early Learning Coalition’s Quality Rating System Pilot
TT FREE Early Childhood Developmental Screening Days
TT Family First Initiative
TT FSU Center for Prevention and Early Intervention Policy-Baby Court
TT PACT–Early Childhood System of Care
32TT Community
Participation and
Ownership in Early
Childhood Success
TT All Children Are Healthy
at age 1
TT All Children Are Making
Whole Child Leon (WCL) addresses critical community Appropriate Progress
issues affecting young children and is a catalyst to
TT All Children Enter
create partnerships that solve problems. WCL works to
Kindergarten Ready to
bring together public, private and nonprofit partners –
Succeed
child advocates, business leaders, government officials,
educators, parents and caregivers to form a solid TT Families are
foundation needed to create systemic change. empowered to raise
children that are
Central to the Whole Child philosophy is our work to
resilient and to promote
facilitate better integration of our community’s system of
their social-emotional
care in order to address issues related to infant mortality
developmental,
and low birth-weight, access to healthcare, family
behavioral, and
stability, school readiness and the overall health and
physical well-being
well-being of children. Driven by our mission of Building a
Community Where Everyone Works Together to Make Sure
Children Thrive, WCL is focused on the following:
Whole Child Leon Initiatives
haattenschweiler
TRADE GOTHIC COND BOLD
1. PACT Early Childhood System of Care
WCL is the lead agency for the PACT Partnership, a consortium of early
childhood providers, parents and community leaders who are working
with Whole Child Leon and the Gadsden Health Council to focus on a
community level investment in the social, emotional, developmental and
behavioral wellbeing of young children and their families to improve the
integration of services and the System of Care in the Gadsden and Leon
counties. PACT is a family driven, community based, and culturally and
linguistically competent system of care in which service and support
programs see parents and caregivers as the expert on their children.
PACT seeks input from families to understand how to improve the system.
With the help of Whole Child Leon, PACT brings together many of the
providers of services for young children from both Gadsden and Leon
Counties in an effort to identify the barriers to effective and timely
services. PACT strives to improve the wellbeing by working with parents
and caregivers, service providers, agencies and community leaders. 332. Professional Network/PACT Community Conversation Meeting
WCL facilitates a monthly meeting to provide
a forum for professionals from agencies and
organizations providing services to children
and families to
Professional Network make contacts
and exchange
ideas. In order to promote community partnership in this process,
Whole Child Leon and the PACT Partnership have come together
to create a forum where issues concerning child and family well-
being are presented followed by a facilitated discussion around
service delivery and issues affecting children and families. This
allows members to identify the issue(s) where the community’s
early childhood system where it has been successful. The
identified issues are brought forward to the PACT Coordinating Council and the WCL Board where
strategies/solutions are discussed and action items are identified and assigned to workgroups.
3. Maternal Child Health Community Health Conference
WCL, FSU College of Medicine, FAMU College of Pharmaceutical Sciences, FL DOH
Leon and Capital Area Healthy Start Coalition organized and implemented the
2nd Annual Community Health Forum and Maternal Child Health Conference in
2015. The forum planning partners bring together community residents, physicians,
community leaders, researchers, undergraduate and graduate health profession
students to increase education and engagement in issues related to achieving
maternal child health equity in our area. Our goal is to increase education and
engage community residents across the life course, as well as providers, and others
who are interested in factors that can positively impact maternal child health
equity in our community and across the state. Forum objectives are to:
1. Discuss advocacy, education, and policy strategies to address the inequity in maternal
child health for the black community through the integration of diverse community and
professional perspectives.
2. Identify priorities for the elimination of maternal child health disparities and the promotion of
health equity using a life course perspective.
3. Describe culturally responsive mechanisms useful for providers to address maternal child
health equity.
Plans are in the works for the 2016 Achieving Maternal and Child Health Conference: Our Health
Matters on October 1, 2016 and at the Gadsden Arts Center on September 30, 2016.
4. Breastfeeding Policy Workgroup
WCL co-facilitates the Breastfeeding Policy Workgroup who meets
regularly to strategize how to increase the number and duration
of women breastfeeding in our community. Pediatricians, nurses,
lactation specialists and community advocates serve on this work
group and meet monthly.
34You can also read