Navigational Behavior of Humans and Deep Reinforcement Learning Agents
←
→
Page content transcription
If your browser does not render page correctly, please read the page content below
ORIGINAL RESEARCH
                                                                                                                                            published: 22 September 2021
                                                                                                                                          doi: 10.3389/fpsyg.2021.725932

                                                Navigational Behavior of Humans
                                                and Deep Reinforcement Learning
                                                Agents
                                                Lillian M. Rigoli 1*, Gaurav Patil 1,2 , Hamish F. Stening 1 , Rachel W. Kallen 1,2 and
                                                Michael J. Richardson 1,2*
                                                1
                                                 School of Psychological Sciences, Macquarie University, Sydney, NSW, Australia, 2 Centre for Elite Performance, Expertise
                                                and Training, Macquarie University, Sydney, NSW, Australia

                                                Rapid advances in the field of Deep Reinforcement Learning (DRL) over the past several
                                                years have led to artificial agents (AAs) capable of producing behavior that meets or
                                                exceeds human-level performance in a wide variety of tasks. However, research on DRL
                                                frequently lacks adequate discussion of the low-level dynamics of the behavior itself
                                                and instead focuses on meta-level or global-level performance metrics. In doing so,
                                                the current literature lacks perspective on the qualitative nature of AA behavior, leaving
                            Edited by:          questions regarding the spatiotemporal patterning of their behavior largely unanswered.
                    Richard J. Tunney,
     Aston University, United Kingdom           The current study explored the degree to which the navigation and route selection
                       Reviewed by:             trajectories of DRL agents (i.e., AAs trained using DRL) through simple obstacle ridden
                Christoph Hoelscher,            virtual environments were equivalent (and/or different) from those produced by human
              ETH Zürich, Switzerland
                     Pouya Bashivan,
                                                agents. The second and related aim was to determine whether a task-dynamical model
             McGill University, Canada          of human route navigation could not only be used to capture both human and DRL
                     *Correspondence:           navigational behavior, but also to help identify whether any observed differences in the
                           Lillian M. Rigoli    navigational trajectories of humans and DRL agents were a function of differences in the
                lillian.rigoli@mq.edu.au
                 Michael J. Richardson          dynamical environmental couplings.
     michael.j.richardson@mq.edu.au
                                                Keywords: task-dynamical model, dynamical perceptual motor primitives, deep reinforcement learning,
                                                navigational behavior, obstacle avoidance, route selection
                   Specialty section:
         This article was submitted to
                    Cognitive Science,
               a section of the journal
                                                INTRODUCTION
               Frontiers in Psychology
                                                Rapid advances in the field of Deep Reinforcement Learning (DRL; Berner et al., 2019;
            Received: 16 June 2021              Vinyals et al., 2019) over the past several years have led to artificial agents (AAs) capable
         Accepted: 24 August 2021
                                                of producing behavior that meets or exceeds human-level performance across a wide variety
      Published: 22 September 2021
                                                of tasks. Some notable advancements include DRL agents learning to play solo or multiagent
                              Citation:
                                                video games [e.g., Atari 2,600 games (Bellemare et al., 2013), DOTA (Berner et al., 2019),
        Rigoli LM, Patil G, Stening HF,
Kallen RW and Richardson MJ (2021)
                                                Gran Turismo Sport (Fuchs et al., 2020), Starcraft II (Vinyals et al., 2019)], and even
Navigational Behavior of Humans and             combining DRL with natural language processing (NLP) to win at text-based games such
Deep Reinforcement Learning Agents.             as Zork (Ammanabrolu et al., 2020). There have also been major developments in the
           Front. Psychol. 12:725932.           application of DRL agents for physical systems, including applying DRL to automate a complex
     doi: 10.3389/fpsyg.2021.725932             manufacturing-like process for the control of a foosball game table (De Blasi et al., 2021),

Frontiers in Psychology | www.frontiersin.org                                          1                                      September 2021 | Volume 12 | Article 725932
Rigoli et al.                                                                                         Navigational Behavior Humans and DRL-Agents

using DRL to control a robotic agent during a collaborative               of the distributed interaction of physical (lawful) processes,
human-machine maze-game (Shafti et al., 2020), and for the                informational and biomechanical couplings, and contextual
control of a robotic hand performing valve rotation and finger            constraints. Accordingly, stable behavior is assumed to reflect
gaiting (Morgan et al., 2021). Recent research has also focused           a functional grouping of structural elements within an agent-
on implementing DRL agents in multiagent human-AA settings,               environment system (e.g., limbs, movements and actions of
including recent work in which a human teammate collaborated              actors, and objects and events of the task environment) that is
with unmanned aerial vehicles driven by DRL agents to douse               temporarily constrained to act as a single coherent unit (also
fire in a real-time environment, where the task goals could not           termed synergy), formed, and destroyed in response to changing
be achieved by either the human teammate or AAs alone (Navidi             task and sub-task goals and action possibilities (i.e., affordances).
et al., 2020).                                                               Central to the approach is both identifying and then defining
    In DRL, agents learn via trial-and-error by modifying their           the self-organizing physical and informational constraints and
behavior to maximize desired outcomes. Indeed, a primary                  couplings that underly the emergence of stable and effective
advantage of using DRL techniques is that AAs can be trained              human perceptual-motor behavior in the form of a non-linear
and optimized to achieve task success across a variety of tasks           dynamical system. Of particular relevance here is that, although
without prior knowledge of the dynamics of the environment                identifying and defining such non-linear dynamical models may
or the agent’s action capabilities. However, research on DRL              at first seem rather difficult, there is now a substantial body of
frequently lacks adequate discussion of the low-level dynamics            research demonstrating how human perceptual-motor behavior
of the behavior itself, and rather shifts its focuses on meta-            can be modeled (and perhaps even derived) using a simple set of
level or global-level performance metrics (e.g., Mnih et al., 2015;       dynamical motor primitives (Haken et al., 1985; Kay et al., 1987;
Pohlen et al., 2018; Berner et al., 2019; Vinyals et al., 2019).          Schaal et al., 2005; Warren, 2006; Ijspeert et al., 2013; Richardson
In doing so, the current literature lacks perspective on the              et al., 2015; Amazeen, 2018; Patil et al., 2020). Specifically,
qualitative nature of AA behavior, leaving questions regarding the        these dynamical motor primitives correspond to the fundamental
spatiotemporal patterning of their behavior largely unanswered.           properties of non-linear dynamical systems, namely (i) point-
In fact, these agents often produce behavior that is easily               attractor dynamics and (ii) limit-cycle dynamics, with the former
distinguishable from or incompatible with human behavior, and             capable of capturing discrete movements or actions (e.g., tapping
for certain applications, this can be non-optimal. For instance, in       a key, passing, or throwing a ball) by means of environmentally
the case of an AA acting alongside humans as an autonomous                coupled damped mass-spring functions, and the latter capable
squad member (Chen et al., 2018), as a robot or virtual guide             of capturing rhythmic movements (e.g., hammering, walking)
through a museum (Philippsen and Siegwart, 2003; Swartout                 by means of forced (driven) damped-mass spring systems or
et al., 2010), when training humans to perform a multiagent               non-linear self-sustained oscillators (e.g., Rayleigh or van der Pol
team task (Rigoli et al., 2020), or when navigating autonomously          oscillator). In the context of modeling human perceptual-motor
alongside humans in pedestrian areas (Carton et al., 2013) or             behavior, these dynamical primitives can be termed dynamical
on highways (Urmson et al., 2009; Wollherr et al., 2014; Weiss            perceptual-motor primitives (DPMPs).
et al., 2015). Moreover, human-like movement or navigation is                Dynamical perceptual-motor primitive models can
known to improve human-AA interaction in a myriad of ways,                successfully capture a wide range of human behaviors, from
including increases in fault tolerance, trustworthiness, work pace,       human object passing (Lamb et al., 2017), reaching, cranking,
and perceived predictability (Carton et al., 2016, 2017; Castro-          and rhythmic wiping (Kay et al., 1987; Saltzman and Kelso,
González et al., 2016; Obaid et al., 2016).                               1987), intersegmental coordination (Amazeen et al., 1998), to
                                                                          drumming and racket ball tasks (e.g., Sternad et al., 2001; Ijspeert
BEHAVIORAL DYNAMICS OF HUMAN                                              et al., 2013), as well as complex multiagent tasks (Dumas et al.,
                                                                          2014; Richardson et al., 2015; Nalepka et al., 2017, 2019; Lamb
ROUTE SELECTION                                                           et al., 2019). One of the most prominent information-based
An alternative method for controlling AA behavior is to                   models from this approach is the Fajen and Warren model
incorporate behavioral dynamics models (Warren, 2006; Warren              for route selection and obstacle avoidance (hereafter referred
and Fajen, 2008) and/or related task-dynamics models (Saltzman            to as the FW-DPMP model; Fajen et al., 2003 and Fajen and
and Kelso, 1987) of human behavior within the control                     Warren, 2003, 2004), that employs simple, point attractive, and
architecture of AAs. Consistent with the more general dynamical           repulsive mass-spring-damper functions to model the changes
and complex systems approach to human behavior (Kugler                    in bearing or heading direction, ϕ, of an agent moving toward
et al., 1980; Haken et al., 1985; Thelen and Smith, 1994;                 (attracted to) a goal location, while navigating around (repelled
Kelso, 1995, 2009; Richardson et al., 2014; Richardson and                from) environmental obstacles. An abstract illustration of the
Kallen, 2015) the behavioral dynamics approach places a                   task space used to define the FW-DPMP model is provided in
strong emphasis on self-organization and contextual emergence,            Figure 1 (left) (adapted from Fajen and Warren, 2003; Warren
whereby the organization or stable order of observed behavior             and Fajen, 2008). In short, given a reference axis, x, in an (x, y)
is not understood to be the result of any individual system               planar space, and assuming the agent is moving forward at a
component, mechanism, or centralized control structure, but               constant velocity, the FW-DPMP model defines the dynamics
rather is understood to emerge as a posterior consequence                 of an agent’s heading direction, ϕ, to a target (goal) location, g,

Frontiers in Psychology | www.frontiersin.org                         2                                 September 2021 | Volume 12 | Article 725932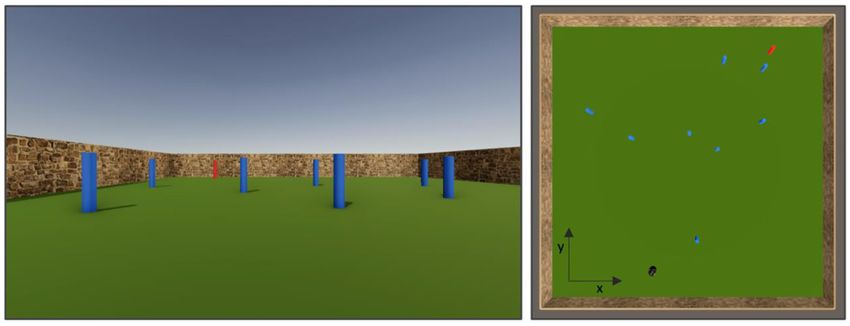
Rigoli et al.                                                                                                              Navigational Behavior Humans and DRL-Agents

  FIGURE 1 | (Left) Abstract representation of the task-space devised by Fajen and Warren (2003) to capture the bearing behavior or heading direction, ϕ, of an agent
  attracted toward a target goal, g, while avoiding environmental obstacles, o. (Right) Four examples of route selection trajectories generated by the participant-specific
  parameterized version of the Fajen and Warren (2003) model (see text for more details about the model and model functions).

while avoiding obstacles, oi using the equation                                               The simple transparency with which Equation (1) can capture
                                                                                          complex human steering behavior and locomotory navigation
                                          −c d                                          has been verified across numerous experimental procedures and

        ϕ̈ = −β ϕ̇ − γ ϕ − θg              e 1 g + c2
                                                                                          tasks (see Warren, 2006; Warren and Fajen, 2008 for reviews).
                    #obstacles
                      X                                                                 Modest extensions of Equation (1) can also capture patterns
                                 ε ϕ − θOi e−c3 ϕ−θOi e−c4 dOi

                +                                                               (1)       of collective behavior in crowd locomotor dynamics (Bonneaud
                       i=1                                                                et al., 2012; Warren, 2018), the dynamics of intercepting a moving
                                                                                          target (Fajen and Warren, 2007), robot navigation (Huang et al.,
Here, ϕ̈ represents the angular acceleration and ϕ̇ represents the                        2006) object pick-and-place tasks (Lamb et al., 2017), and
angular velocity of the agent’s heading direction, θg represents                          more recently, navigation around obstacles while using a short-
the angle of the goal direction (with respect to the agent in                             range haptic sensory substitution device (Lobo et al., 2019).
an egocentric reference frame), θOi represents the angle of an                            Moreover, it is important to note that in each of the above
obstacle i, with dg and dOi representing the distance to the                              studies, the movement trajectories generated by the model are
target and obstacle i, respectively. The model parameters β, γ ,                          not a result of a-priori computation (planning), but instead, are
and ε reflect the magnitude of damping or resistance toward                               simply a situated self-organized result of interacting attractors
changes in direction of heading, attraction to the direction of                           and repellors.
heading that leads to the goal location (i.e., positive stiffness
toward the goal direction), and the repulsion force to repel the
heading direction away from an obstacle location (i.e., negative                          CURRENT STUDY
stiffness toward obstacle direction), respectively. In other words,
for a given value of β, steering toward a goal involves changing                          The current study had two exploratory aims. The first was
heading direction or turning rate, ϕ̇, until ϕ − θg = 0 at a                              to investigate the degree to which the navigation and route
rate determined by γ , while avoiding or steering away from an                            selection trajectories of DRL agents (i.e., AAs trained using DRL)
obstacle involves a change in heading direction or turning rate,                          through an obstacle ridden environment were equivalent (and/or
ϕ̇, at a rate determined by ε away from ϕ − θo = 0. The fixed                             different) from those produced by human agents. The second
constants c1 and c2 influence the rate of decay of the attraction                         and related aim was to determine whether the FW-DPMP model
toward the goal and the scaling of the minimum acceleration                               of human route navigation [i.e., Equation (1)] could not only
(such that it never reaches zero, even for large goal distances),                         be used to capture both human and DRL navigational behavior,
respectively, and c3 and c4 influence the angular acceleration                            but also help to identify whether differences between human
away from obstacles and the rate of decay of the repulsion of                             and DRL trajectories were a function of different parametric
obstacles, respectively.                                                                  tunings in the attractive and repulsive forces that shape an agent’s

Frontiers in Psychology | www.frontiersin.org                                         3                                       September 2021 | Volume 12 | Article 725932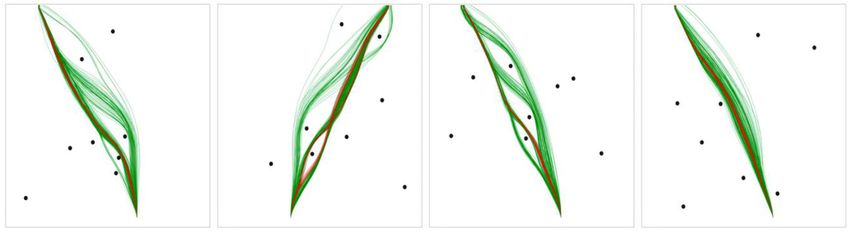
Rigoli et al.                                                                                        Navigational Behavior Humans and DRL-Agents

movement toward a goal location while avoiding obstacles.                 Method and Apparatus
Motivating the latter question was the possibility that one reason        The route selection game and interface were developed using
why DRL agents produce behavioral patterns different from                 the Unity Game Engine (Unity Technologies, San Francisco,
humans is that DRL methods over-optimize (tune) AA behavior               USA). As illustrated in Figure 2, the navigation environment
to a given task context (Hasson et al., 2020) and thus exhibit            was a 40 × 40 m square, surrounded by a “brick” textured wall,
less variability and less flexible behavioral patterning than human       with the target (goal) location represented by a red cylinder and
agents. Given the powerful function approximation properties              obstacles represented by blue cylinders (both measuring 0.5 m
of deep neural networks (Csáji, 2001; Arulkumaran et al., 2017),          wide and 1 m tall). The game could be played on both PC and
examining the similitude with which the FW-DPMP model could               MAC computers using a web browser, with the playing area
capture both DRL and human navigation also provided a way                 visualized by participants via a first-person camera view with
of determining the degree to which the DRL and human agents               a field of view of 60◦ in the vertical direction and 95◦ in the
learn to exhibit the same low-dimensional task dynamics.                  horizontal direction. Participants controlled their movements
   To achieve these aims, human participants and DRL agents               using a keyboard, with the left and right arrows used to control
navigated a subset of 18 total obstacle configurations, each with         the heading direction (turn left and right) and pressing and
two start locations and three goal/target locations, for a total of       holding down the spacebar to move forward along their current
108 unique combinations. Participants performed the task on a             heading direction. When the space bar was pressed, the velocity
computer and used keyboard keys to control their movements                of the participant’s movements within the game environment
through the environment. We examined (1) the similarities and             was constant and was set to 10 m/s and the maximum rotation
differences between the navigational trajectories exhibited by            speed was set to 25◦ with an angular acceleration of 62.5◦ /s2 .
human participants and the DRL agents and, after fitting the FW-          Participants were unable to move backwards but were able to
DPMP model to the observed human and DRL agent trajectories,              stop moving (by releasing spacebar) and turn around completely
(2) whether different parametric tunings of the FW-DPMP model             (360◦ ) using the arrow keys.
could account for any observed differences between the human                 There were 18 randomly generated obstacle configurations.
and DRL agent trajectories.                                               The positions of the obstacles for each configuration are included
   Accordingly, the rest of the paper is structured as follows.           in the Supplementary Material. From a top down view of
First, we detail the experimental method used for data collection         the playing area with (0, 0) at the center (see Figure 2), for
and the analysis methods employed to compare the observed                 each of these obstacle configurations, there were two starting
human and DRL agent trajectories. We then report the results              positions (in meters): (5, −16) and (−5, −16,), which in practice
of this analysis. Following this, we detail the FW-DPMP                   corresponded to starting from either the left or right of the
model (Equation 1) fitting procedures and report a detailed               bottom of the field, and three target locations: (12, 16), (0, 16),
analysis of the parametric differences between the simulated              or (−12, 16), which corresponded to the target being located at
human and DRL agent trajectories. Note that additional analyses           the top left, top middle, or top right of the field, respectively.
were employed to examine the degree to which the FW-                      In total, there were 108 combinations of the eighteen obstacle
DPMP model effectively captured the observed trajectories                 configurations, two starting locations, and three route types (18
and to compare FW-DPMP-simulated human trajectories to                    × 2 × 3), where each unique combination is referred to as
simulated DRL agent trajectories, which can be found in the               a “scenario.”
Supplementary Material.                                                      During a trial, if an obstacle was hit or bumped into, the trial
                                                                          would restart. A small counter was presented in the top right
                                                                          corner of the game displaying the number of successful trials
EXPERIMENTAL METHODS                                                      completed. All participants began by completing five mandatory
                                                                          successful practice trials. Following this, the experiment required
Participants                                                              participants to complete 108 successful trials. Each participant
Two hundred and five participants were recruited to participate           was assigned a set of three obstacle configurations, which
remotely using Amazon Mechanical Turk (MTurk) for monetary                included the two starting positions and the three route types,
compensation. MTurk participants ranged in age from 19 to 65              resulting in 18 unique scenarios (3 × 2 × 2) per participant. Each
years old (M = 35.5, SD = 9.4), of which 32% were female and              scenario was repeated six times resulting in a total of 108 trials
68% were male. Twenty additional participants were recruited to           per participant which were presented in a random order.
participate in-person on Macquarie University campus for course              Each of the in-person participants performed the task twice,
credit or monetary compensation to validate the data collected            once using a keyboard and once using a joystick (with the
remotely via MTurk (see section Confidence Interval Analysis for          order counterbalanced). The joystick data was collected in
these comparative results, but in short, there were no differences        order to compare the trajectories resulting from a continuous
between the groups). The in-person participants ranged in age             controller (joystick) to a discrete controller (keyboard). The
from 18 to 35 (M = 23.6, SD = 5.3), of which 55% were female              joystick controls were as follows: shifting the joystick to
and 45% were male. One of the in-person participants and 13               the left or right moved the player in that direction and
Mturk participants were dropped from the analysis due to lack             holding down the joystick’s trigger moved the player forward.
of task completion.                                                       All MTurk participants completed the task using their own

Frontiers in Psychology | www.frontiersin.org                         4                                September 2021 | Volume 12 | Article 725932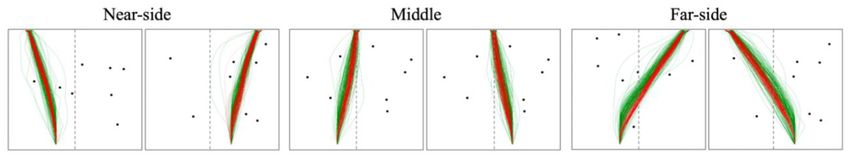
Rigoli et al.                                                                                                             Navigational Behavior Humans and DRL-Agents

  FIGURE 2 | (Left) Depiction of the game field as seen by participants, with the target represented by the red cylinder and the obstacles by the blue cylinders. (Right)
  Top-down view of game field with reference axes, with the player represented by a black peg and the target represented by the red cylinder.

personal computer and keyboard. Both in-person and MTurk                                to whether it hits an object with one of the tags [one input each
participants completed a Qualtrics survey before starting the task                      for target or obstacle], it hits an object with another tag [not a
which collected basic demographics (i.e., age, gender, ethnicity,                       target or obstacle], and it does not hit anything, thus, resulting
handedness). The survey also included a standardized set of                             in an input size of 44. Furthermore, two additional inputs were
instructions for how to play the game. Put shortly, participants                        given corresponding to the heading direction and distance of the
were told to do their best to navigate to the red target object                         target at any given time. The raycast agents’ policy was controlled
as quickly as possible, without hitting any obstacles. Lastly,                          by a deep neural network consisting of an input layer with 46
participants were made aware that they would be paid the same                           neurons, two hidden layers with 128 neurons each, and an output
amount regardless of the time taken to complete the experiment.                         layer with five outputs.
                                                                                           The visual agent was given an input from the first-
DRL Agent Training                                                                      person camera view (similar to the view presented to human
The same route selection game described above was used to train                         participants) compressed to an RGB matrix of 80 × 144. The
the DRL agents. Two types of DRL agents were trained to reach                           policy was controlled by a deep neural network consisting of two
the target while avoiding obstacles: (1) using raycast data and                         convolutional layers with kernel sizes 16 × 3 × 8 × 8 and 32 × 16
(2) using visual pixel data as inputs. A raycast is conceptually                        × 4 × 4, respectively, two hidden layers consisting of 512 neurons
like a laser beam that is fired from a point in space along a                           each, and an output layer with five outputs.
particular direction and any object that the beam hits can be                              Both raycast and visual agents were trained for 5 million
detected, thus a set of N raycasts projected at the different angles                    training steps. The hyperparameters used during training for the
from an agent’s location can provide a discrete map of objects                          agent with raycast inputs were- batch size: 128, buffer size: 2,048,
within the projected raycast region. Visual pixel data is simply                        learning rate: 0.0005, beta: 0.01, epsilon: 0.2, lambda: 0.95, num
screen capture data and is analogous to what the participants                           epoch: 3, learning rate schedule: linear and for the agent with
would see on the screen. The Unity MLAgents framework (Juliani                          visual inputs were batch size: 128, buffer size: 10,240, learning
et al., 2018) was used to train the agents whose policy was                             rate: 0.0005, beta: 0.01, epsilon: 0.2, lambda: 0.95, num epoch: 3,
refined by the Proximal Policy optimization (PPO) methodology                           learning rate schedule: linear (refer to Juliani et al., 2018 for more
(Schulman et al., 2017) of RL. Proximal Policy optimization                             details). During each episode, which lasted either for 30 s or until
uses a combination of the Clipped Surrogate Objective function                          the agent collided with an obstacle or the target, the obstacles
and multiple adaptive epochs on batches of state-action-reward                          were randomly placed in the playing area while the observations
combinations in order to update the policy of the agent, which in                       were collected every fifth frame and the environment updated at
this case, is approximated by a deep neural network. Both types of                      50 Hz. The agent was given a (+1) reward for hitting the target
agents were trained to generate five outputs corresponding to two                       and (−1) reward for either hitting an obstacle or not hitting
one-hot “move” actions [move forward or do not move] and three                          anything within the trial duration. For the first 3 million training
one-hot “rotate” actions [rotate left, do not rotate, or rotate right].                 steps, the agent’s start position and the target’s position were
    The raycast agents were given inputs from 11 rays with one                          randomly selected and for the final 2 million steps, the agent and
ray pointing straight ahead and five rays on each side spread                           the target were placed on the far sides of the playing area such
equally over 45◦ . Each ray transmitted the information about                           that the x coordinates were −16 and 16, respectively, and the
what it was detecting in a one-hot vector of size 4 corresponding                       y coordinates were randomly selected. For the first 1.5 million

Frontiers in Psychology | www.frontiersin.org                                       5                                       September 2021 | Volume 12 | Article 725932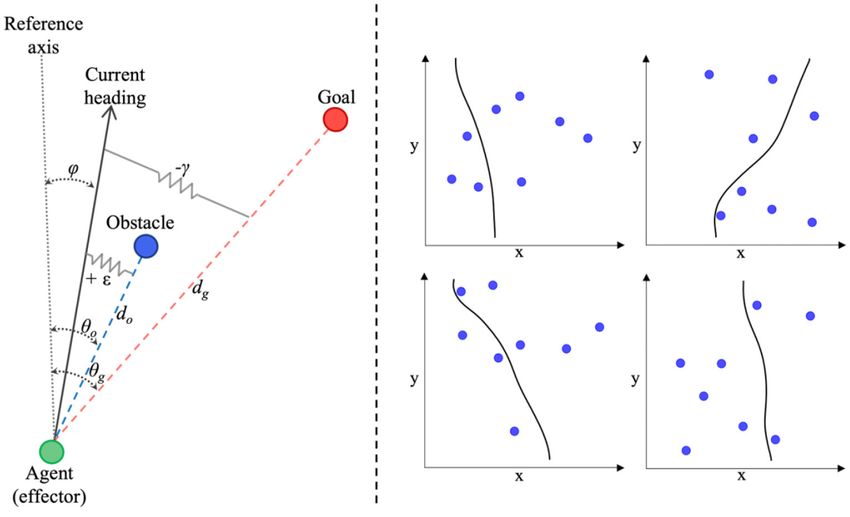
Rigoli et al.                                                                                                             Navigational Behavior Humans and DRL-Agents

  FIGURE 3 | The distance between a pair of trajectories is the average of the absolute values of di calculated for every 20 cm bin along the y-axis. This example has 16
  points per trajectory for illustration purposes, however the actual data had 160 points per trajectory.

training steps of the visual agent, the number of obstacles was                         Data Pre-processing
reduced to four in order to facilitate learning by increasing the                       The raw data for each trajectory (sampled at 50 Hz) were first
probability of a positive reward.                                                       interpolated to a standard-length of 1,000 data points. Any
   Twenty agents were trained by using the raycast and the target                       trajectory that was 1.2X longer in distance than the average
position as inputs and five agents were trained by using visual                         trajectory length for that scenario (i.e., the average cumulative
inputs. All the trained DRL agents were simulated to complete                           distance) was discarded, as these trajectories represented paths
the task of reaching the target by presenting the same scenarios                        where a human or DRL agent took a highly anomalous path to
and using the same paradigms that were used for the human                               the target. Further, any trajectory that took the participant more
participants. Note that a third set of DRL agents was trained                           than 20 s to complete was also discarded, as the average trial
using raycast data as inputs, but without any target information,                       time was only 6 s. Out of all trajectories,
Rigoli et al.                                                                                                                 Navigational Behavior Humans and DRL-Agents

  FIGURE 4 | Example scenarios from the raw human (green) and DRL agent (red) data displaying the starting positions (i.e., left or right) and target position(s) (i.e., left,
  right or middle) for each route type.

was classified as a far-side trajectory, and any trajectory with the                       were calculated by taking the x-values at the 97.5th and 2.5th
target position in the middle was classified as a middle trajectory                        percentiles within each of the 20 cm bins along the y-axis, such
(note, preliminary analysis reaved the results were symmetrical                            that 5% of the human data points fell outside of the bounds for
with regards to route type, justifying this simplification). These                         each bin. Following this, the code checked whether the mean
three classifications are hereafter referred to as “route types” (see                      DRL agent x-value for each bin was less than the upper-limit
Figure 4). Further, in order to allow for comparison between                               and greater than the lower-limit of the human CI. Finally, the
trajectories, the data was pre-processed such that each value of                           proportion of time-steps where the DRL agent mean x-value was
a trajectory in the x coordinate was binned in intervals of 20 cm                          within these bounds was calculated.
along the y axis, similar to Fajen and Warren (2003) and Lobo                                 The CI analysis was also utilized to help determine the
et al. (2019).                                                                             similarity between the human trajectories collected via Amazon
    The proceeding analyses examine the differences between the                            Mechanical Turk (MTurk) and the human trajectories collected
human and DRL agent trajectories (both raw and simulated), as                              in the lab. For each scenario, the proportion of the mean
well as the differences between the near-side, far-side, and middle                        MTurk trajectory that fell within the 95% CI of the in-lab
trajectories. In order to explore these data, three main analyses                          human trajectories was calculated. This was done separately
were employed: (i) number of preferred routes, (ii) confidence                             for the joystick-control and keyboard-control data. The analysis
interval analysis, and (iii) the distance/error between trajectories.                      revealed that 100% of the mean MTurk trajectory fell within both
These analyses are described in detail in the following sections.                          the keyboard-controlled and joystick-controlled human 95% CI
                                                                                           for all scenarios, indicating that the mean MTurk trajectory was
Preferred Paths                                                                            not significantly different from the in-lab participants (at the 5%
The number of preferred routes was examined as a global                                    level) across all scenarios. Thus, we proceeded with the MTurk
measure of the overall flexibility and variability in route selection                      data for all analyses in the paper. See Supplementary Figures 3,
displayed by the humans and DRL agents. To determine the                                   4 in Supplementary Material for example scenarios displaying the
number of routes taken by human participants and the DRL                                   mean trajectories and CIs.
agents for each scenario, any route that contained at least 10% of
the humans’ or DRL agents’ trajectories and that took a distinct
path around an obstacle or obstacles was counted as a “preferred                           Distance Between Trajectories
route” (see Figure 5 for examples of preferred routes). Preferred                          The distance measure was calculated to provide a quantitative
routes were determined by the researcher manually/by-hand.                                 measure of the difference between trajectories to allow for
                                                                                           comparisons between the human-produced and DRL agent-
Confidence Interval Analysis                                                               produced trajectories. Similar to Fajen and Warren (2003) and
A confidence interval analysis was employed to determine the                               Lobo et al. (2019), distance was calculated by taking the average of
degree to which the mean DRL agent trajectory fell within the                              the absolute value of the differences between the x-values of two
bounds of the 95% confidence interval (CI) of the human-                                   trajectories within each 20 cm bin along the y-axis (see Figure 3
produced trajectories, and thus provides a measure of the degree                           for an illustration of this process).
of similarity between the two groups. This was calculated by                                  Distance measures were calculated between human and DRL
determining whether the mean trajectory of the DRL agents was                              agent trajectories within each scenario for each possible pairing
in-between the bounds of the human 95% CI at each time-step                                of human- and DRL agent- produced trajectories. The measures
and then calculating the proportion of time-steps where the mean                           were then averaged for each route type (i.e., near-side, middle,
DRL agent trajectory lay within the bounds. This was calculated                            and far-side, see Figure 4) and across the 20 DRL agents for each
separately for each of the 108 scenarios.                                                  human participant, such that the final analysis included three
   The mean DRL agent trajectories were calculated for each                                average distance measures for each route type and for each of the
scenario by simply taking the mean x-value across all of the                               192 human participants (e.g., participant 10’s trajectories had an
DRL agent-produced trajectories within each of the 20 cm bins                              average distance of 2.69 cm across all DRL agents’ trajectories for
along the y-axis. The upper and lower 95% CIs for the humans                               near-side routes, an average distance of 2.91 cm across all DRL

Frontiers in Psychology | www.frontiersin.org                                          7                                        September 2021 | Volume 12 | Article 725932
Rigoli et al. Navigational Behavior Humans and DRL-Agents
FIGURE 5 | Example scenarios with human trajectories in green, and DRL agent trajectories in red. (A) contains one preferred path for humans and DRL agents, (B)
contains three human preferred paths and one DRL agent preferred path, (C) contains two human preferred paths and one DRL agent preferred path, (D) contains
three human preferred paths and two DRL agent preferred paths.
agents’ trajectories for middle routes, and an average distance of Confidence Interval Analysis
3.70 cm across all DRL agents’ trajectories for far-side routes). The CI analysis revealed that on average, 98.45% of the mean
Distance measures were also calculated within-groups (i.e., DRL agent trajectory fell within the human 95% CI, with a
separately for humans and DRL-agents) to provide a measure standard deviation of 9.08%. See Figure 6 for example scenarios
of within-group variability, such that the distance was calculated displaying the mean trajectories and CIs. Only two out of 108
for every possible pairing of two human-produced trajectories total scenarios contained DRL agent mean trajectories that were
(excluding trajectories produced by the same participant) within 98% within the bounds
method was used to calculate the distances for the DRL agents. of the human CI.
Finally, the same measures were calculated for the simulated In summary, the analysis revealed a high degree of
data, and the corresponding results for these measures (including similarity between the DRL agent-produced and human-
examining the degree to which the FW-DPMP model effectively produced trajectories across all scenarios, such that the DRL
captured the observed trajectories and comparing FW- agents tended to navigate through these environments in a
DPMP-simulated human trajectories to simulated DRL agent manner that was relatively indistinguishable from human agents.
trajectories) can be found in the Supplementary Material. However, as can be seen from inspection of Figure 6, at the
group-level, DRL agents not surprisingly exhibited much less
spread/variability across trajectories compared to humans.
EXPERIMENTAL RESULTS
Preferred Routes Distances Between Humans and DRL
For the human data, 41.67% of the scenarios contained greater Agent Produced Trajectories
than one preferred path, and 8.3% contained greater than two. Distances (i.e., the average of the binned X-differences) were
No scenarios contained greater than three preferred paths. For calculated between all pairs of DRL agent and human observed
the DRL agent data, 27.78% of the scenarios contained greater trajectories for each scenario in order to compare the trajectories
than one preferred path, and none contained greater than two. produced by both groups (i.e., between human-produced and
Further, 73.15% of the 108 total scenarios contained the same DRL agent-produced trajectories). This measure is hereafter
preferred path(s) for both humans and DRL agents, of which referred to as Distance(BG) , where “BG” denotes a between-
26.58% contained two preferred paths. The scenarios in Figure 5 groups comparison.
(excluding Figure 5A) were chosen to exemplify diversions from A repeated measures ANOVA was conducted in order to
normality, where humans and DRL agents chose to take a examine whether there was a difference in Distance(BG) for the
variety of paths around the obstacles to reach the target location. three route types (near-side, middle, and far-side). The analysis
However, the preferred routes chosen by humans and DRL agents revealed a significant main effect of route type, F (2,380) = 118.12,
tended to overlap across the majority of obstacle scenarios. p < 0.001, ηp ² = 0.38. Post-hoc analyses (pairwise comparisons)
Frontiers in Psychology | www.frontiersin.org 8 September 2021 | Volume 12 | Article 725932Rigoli et al. Navigational Behavior Humans and DRL-Agents
FIGURE 6 | Example scenarios with human trajectories in green, DRL agent trajectories in red, human CIs in black-dash, and DRL agent mean trajectories in
red-dash. Percent of the mean DRL agent trajectory contained in the human CI for each plot (from left to right): 91.9, 25.6, 100, 100%. (A) and (B) display rare
examples of the mean DRL agent trajectory deviating from the human tendency, captured by the human CI, while (C) and (D) display more typical cases.
conducted using the Bonferroni correction revealed that simple main effects of player on near-side location, χ 2(1) = 61.55,
Distance(BG) for the far-side location (M = 1.8, SD = 0.8) was p < 0.001, with humans (M = 1.6, SD = 0.6) having higher
significantly higher than for the near-side location (M = 1.3, Distance(WG) than DRL agents (M = 0.6, SD = 0.1); on middle
SD = 0.6), and middle location (M = 1.3, SD = 0.7; both p location, χ 2(1) = 29.26, p < 0.00, with humans (M = 1.3, SD =
< 0.001), indicating that humans and DRL agents produced 0.7) having higher Distance(WG) than DRL agents (M = 0.6, SD
more dissimilar trajectories for the far-side routes, which with = 0.0); and on far side location, χ 2(1) = 118.05, p < 0.001, with
longer travel distance presented more opportunity for divergence humans (M = 2.1, SD = 0.7) again having higher Distance(WG)
in route selection around obstacles. However, the near-side than DRL agents (M = 0.7, SD = 0.0). Thus, these results suggest
location and middle location were not significantly different from that (not surprisingly) humans exhibited higher within-group
each other, indicating that human and DRL agent trajectories variability in their trajectories as compared to DRL agents, who
remained relatively similar for these route types. appeared to exhibit more consistency (i.e., less variation) across
all the route types.
Within-Group Distances There was also a significant simple main effect of location for
Distances were calculated between all possible pairings of DRL agents, χ 2(2) = 173.71, p < 0.001. Follow-up Bonferroni-
trajectories within each scenario separately for DRL agents and
corrected pairwise comparisons of Distance(WG) for each
Humans, and thus provides a measure of within-group variation.
location revealed that for the DRL agents, Distance(WG) was
To assess the effects of player type and route type on the
significantly higher for the far-side location than both the middle
binned X-differences, hereafter referred to as Distance(WG) ,
location, b = 0.03, t (19) = 3.57, p < 0.01, and the near-
we defined a multilevel model predicting Distance(WG) , with
side location, b = 0.09, t (19) = 12.77, p < 0.001. In addition,
fixed effects (near-side, middle, or far-side), and Player (DRL
Distance(WG) was higher for the middle location than for the
agent or Human), and random effect Player ID. In the model,
near-side location, b = −0.07, t (19) = 9.20, p < 0.001. Thus, DRL
independence of residuals was assumed but due to unequal
agents exhibited the highest degree of consistency in the near-side
variance between humans and DRL agents, we specified for the
routes, and the highest degree of variability in the far-side routes.
model to estimate distinct variance for each two player types (that
Results also revealed significant simple main effect of location
is, the model estimated distinct variance for Distance(WG) for
for humans, χ 2(2) = 476.81, p < 0.001. Follow-up Bonferroni-
Human trials and for DRL agent trials). The model was fit using
corrected pairwise comparisons of Distance(WG) for each of
the maximum likelihood estimation procedure.
the locations revealed that for humans, Distance(WG) was
This model adequately fit the data, χ 2(3) = 484.62 p < 0.001.
significantly higher for the far-side location than both the middle
When the Player × Location two-way interaction was added to
location, b = 0.74, t (191) = 21.47, p < 0.001, and near-side
the model, the model again adequately fit the data, χ 2(5) = 716.79,
location, b = 0.49, t (191) = 14.15, p < 0.001. Contrary to
p < 0.001. The likelihood-ratio test of the two nested models was the results for the DRL agents, Distance(WG) for humans was
significant, χ 2(2) = 217.11, p < 0.001, suggesting that the latter significantly lower for the middle routes than for the near-side
model fit the data more appropriately, and thus the latter model routes, b = −0.25, t (191) = −7.29, p < 0.001. Thus, in contrast to
was adopted. DRL agents, humans exhibited the highest degree of consistency
In the full model, there were significant main effects of Player, in the middle routes, and the highest degree of variability in the
χ 2(1) = 66.24, p < 0.001, and location, χ 2(2) = 515.27, p < far-side routes.
0.001, and a significant Player × Location interaction, χ 2(2) = Collectively, these results indicate that humans displayed
412.11, p < 0.001. Contrasts revealed that there were significant higher variability overall [i.e., higher Distance(WG) ] in their
Frontiers in Psychology | www.frontiersin.org 9 September 2021 | Volume 12 | Article 725932Rigoli et al. Navigational Behavior Humans and DRL-Agents
FIGURE 7 | Example scenarios with human trajectories in green and DRL agent trajectories in red.
trajectories than DRL agents across all three route types, and both were then used to simulate agent-specific movement trajectories
humans and DRL agents exhibited the most variation in the far- within each scenario, resulting in a set of simulated trajectories
side routes. However, DRL agents were found to exhibit more for each human and DRL agent for all scenarios. See Figure 7 for
variability in the middle routes than the near-side routes, while examples of the simulated trajectories.
humans exhibited the opposite effect, such that there was higher
human variation for the near-side routes than the middle routes.
Parameter Analysis
In order to determine what parameter estimates underlie
MODEL-FITTING AND SIMULATIONS the differences in the human and DRL agent parameter-
defined model trajectories, we analyzed the differences in the
Model-Fitting parameters β, γ , and ε for humans and DRL agents across the
The FW-DPMP model was used to fit each of the observed
three route types. Again, these parameters represent damping
trajectories produced by human participants and the DRL agents.
on turning rate, attraction to the goal, and repulsion from
For this study, the parameters γ , ε, and β were of central
obstacles, respectively. Accordingly, we defined a multilevel
concern as these parameters are responsible for determining
model predicting parameter value with fixed effects Parameter
the goal’s “attractiveness” and stability, repulsion from obstacles,
(β, γ , or transformed ε), Route Type (near-side, middle, or far-
and damping (which acts as a frictional force to oppose angular
side), and Player (DRL agent or Human), and random effect
motion). These three parameters are ultimately responsible for
Player ID. The model was fit using the Maximum Likelihood
the resulting/emergent trajectory. Thus, we fit the model to each
estimation procedure. For readability, the simplified results are
trajectory by modulating these key parameters. For this study, all
reported here; see Supplementary Material for the full details
other parameters in Equation (1) were kept the same as inferred
of this analysis. The means, standard deviations, minimum, and
by the original Fajen and Warren (2003) formulation.
maximum values, and skew and kurtosis values for parameters β,
To determine the optimal γ , ε, and β parameters for a given
γ , ε, and the Box-Cox-transformed ε are summarized in Table 1
human or DRL agent trajectory, we employed the differential
of Supplementary Material.
evolution algorithm (Storn and Price, 1997) implemented
The full three-way model (Parameter × Route Type × Player)
in the SciPy.optimize package (Virtanen et al., 2020) which
adequately fit the data, χ 2(17) = 35458.60, p < 0.001, and revealed
is a population-based search algorithm that can optimize a
multivariate function by iteratively improving solutions based on significant main effects of parameter type, χ 2(2) = 20591.37, p <
an evolutionary process. In our case, the algorithm minimized 0.001, route type, χ 2(2) = 80.32, p < 0.001, and player type, χ 2(1) =
the dynamic time warping (DTW) distance [implemented via 34.63, p < 0.001, on parameter value. There were also significant
the python similarity-measures package (Jekel et al., 2019)] Parameter × Location, χ 2(4) = 282.33, p < 0.001, Parameter
between the observed trajectory and the simulated trajectory, × Player, χ 2(2) = 125.59, p < 0.001, and Location × Player,
using a range of parameter values until an optimal set was χ 2(2) = 74.22, p < 0.001, interaction effects on parameter value.
found that resulted in the smallest DTW error. Dynamic time
Most importantly, the Parameter × Location × Player interaction
warping is a method for measuring the similarity between two
was also significant, χ 2(4) = 121.34, p < 0.001, suggesting that
temporal sequences that may vary in speed/time by computing
the distance between sequences using a one-to-many (and many- the Location × Player interaction varied for different parameter
to-one) approach, such that the total distance between the types. Contrasts were used to break down this interaction for each
sequences is minimized without concern for synchronization of the parameter types.
between the sequences. These parameters were then averaged There were significant simple main effects of route type on
for each human/DRL agent, such that each human/DRL agent β, χ 2(2) = 159.50, p < 0.001, on γ , χ 2(2) = 95.94, p < 0.001,
ended up with their own characteristic set of parameters. The and on transformed ε, χ 2(2) = 260.96, p < 0.001. Similarly, there
average, or characteristic parameters obtained for each agent were significant simple main effects of player type on β, χ 2(1)
Frontiers in Psychology | www.frontiersin.org 10 September 2021 | Volume 12 | Article 725932Rigoli et al. Navigational Behavior Humans and DRL-Agents
= 83.05, p < 0.001, on γ , χ 2(1) = 47.77, p < 0.001, and on ε-values were significantly lower for far-side route types than
transformed ε, χ 2(1) = 14.70, p < 0.001. Interestingly, there were middle route types, b = −0.25, 95% CI [−0.43, −0.06], t (181)
also significant simple interaction effects of route type and player = −3.90, p = 0.002. For DRL agents, transformed ε-values were
type on β, χ 2(2) = 36.27, p < 0.001, on γ , χ 2(2) = 80.92, p < also significantly lower for far-side route types than middle route
types, b = −0.83, 95% CI [−0.89, −0.76], t (19) = −36.31, p
0.001, and on transformed ε, χ 2(2) = 78.31, p < 0.001. These
< 0.001, however transformed ε-values were also significantly
simple interaction effects suggest that the target-location simple lower in far-side-target trials than same-side-target trials, b =
main effects for each of the three parameter types was different −0.27, 95% CI [−0.33, −0.21], t (19) = −14.09, p < 0.001. Finally,
for human and DRL agent players. These differing effects were transformed ε-values were significantly lower in same-side trials
further investigated using contrasts. than in middle trials, b = −0.56, 95% CI [−0.63, −0.48], t (19) =
The results revealed significant simple main effects of route −21.17, p < 0.001.
type on β for both Human players, χ 2(2) = 21.74, p < 0.001, and Overall, and not surprising given the analysis of the raw
DRL agent players, χ 2(2) = 351.71, p < 0.001. Similarly, there were data trajectories above, there was much less variability in the
also significant simple main effects of route type on transformed ε parameter estimates for DRL agents than for humans across
for both Human players, χ 2(2) = 15.36, p < 0.001, and DRL agent all route types, reflecting the fact that the DRL agents were
players, χ 2(2) = 1354.99, p < 0.001. However, there was only a more finely tuned to changes in route type. Humans, on the
significant simple main effect of route type on γ for DRL agent other hand, tended to exhibit a large degree of variation in their
players, χ 2 (2) = 448.61, p < 0.001. There was not a significant trajectories, which is reflected in the wide range of parameter
simple main effect on γ for Human players, χ 2(2) = 3.80, p = estimates for their data. This can be seen from an inspection
0.150. That is, γ -values did not significantly differ as a function of Figure 8. The results revealed that damping of turning rate
of route type for human players. (i.e., β) was lowest for the middle routes for both humans and
Follow-up Bonferroni-corrected, pairwise comparisons of DRL agents. However, damping was also lower for far-side routes
parameter value means for each of the parameter types for each than for near-side routes for DRL agents, but not for humans.
of the route types and for each of the player types revealed that Furthermore, there was no effect of route type on attraction to the
for DRL agents, γ -values were significantly lower when the target target (i.e., γ ) for humans, while for DRL agents, attraction was
was on the same side as the starting position compared to when significantly different across all route types, such that attraction
the target was in the middle, b = −49.57, 95% CI [−61.46, was highest for middle routes and lowest for far-side routes.
−37.68], t (19) = −12.47, p < 0.001. Additionally, γ -values were Finally, repulsion from obstacles (i.e., ε) was lower for far-side
also significantly lower when the target was on the far side to the routes than middle routes for both humans and DRL agents, but
player’s starting position compared to when the target was in the unlike humans, repulsion for DRL agents was also lower for far-
middle, b = −81.65, 95% CI [−93.18, −70.12], t (19) = 21.18, p side routes than near-side routes, and lower for near-side routes
< 0.001. γ -values for when the target was on the same side were than middle routes.
significantly greater than values for when the target was on the
far side, b = 32.08, 95% CI [21.51, 42.65], t (19) = 9.08, p < 0.001.
DISCUSSION
For humans, β-values were significantly lower when the target
was in the middle compared to when the target was on the far side The analysis of the trajectories produced by DRL and human
to the player’s starting position, b = −3.36, 95% CI [−5.56, 0.87], agents revealed a high degree of similarity across all scenarios.
t (181) = −4.57, p < 0.001. However, there were no significant That is, the DRL agents tended to navigate through the
differences in β-values when the target was on the same side as environments in a manner that was relatively indistinguishable
the player’s starting position compared to when the target was in from human agents. Specifically, the preferred routes chosen
the middle, b = −2.42, 95% CI [−4.88, 0.04], t (181) = −2.94, p by DRL agents and humans tended to overlap across most
= 0.059, or the far side, b = −0.95, 95% CI [−3.39, 1.50], t (181) scenarios, and, on average, 98.5% of the mean DRL trajectory
= −1.16, p > 0.999. For DRL agents, β-values were similarly fell within the human 95% CI. However, the analysis of observed
significantly lower when the target was in the middle compared trajectories also revealed that humans exhibited much more
to when the target was on the far side to the player’s starting variability in their trajectories across all three route types than
position, b = −5.67, 95% CI [−6.98, −4.36], t (19) = −12.92, p < the DRL agents, which is clear upon visual observation of
0.001. However, unlike the human players, DRL agents’ β-values the trajectories produced by both groups (see Figures 5, 6 for
were significantly greater when the target was on the same side examples). Consistent with this latter finding, the comparative
than when the target was on the far side, b = 2.34, 95% CI [1.16, analysis of the parameter estimates of β, γ , and ε, which
3.51], t (19) = 5.96, p < 0.001, and when the target was in the represent damping on turning rate, attraction to the goal, and
middle, b = 8.00, 95% CI [6.72, 9.29], t (19) = 18.62, p < 0.001. repulsion from obstacles, respectively, revealed more highly
For humans, transformed ε-values did not significantly differ tuned parameter estimates for the DRL-agents compared to the
between same-side and middle route types, b = −0.14, 95% CI human agents.
[−0.33, 0.05], t (181) = −2.23, p = 0.465, and did not significantly The parameter analysis also revealed similarities between the
differ between same-side and far-side route types, b = 0.10, 95% two groups in that repulsion was highest and damping was lowest
CI [−0.09, 0.30], t (181) = 1.6, p > 0.999. However, transformed for middle routes for both DRL and human agents, reflecting
Frontiers in Psychology | www.frontiersin.org 11 September 2021 | Volume 12 | Article 725932Rigoli et al. Navigational Behavior Humans and DRL-Agents FIGURE 8 | Box plots of parameter estimates for β, γ, and Box-cox corrected ε (i.e., damping, attraction to target, and repulsion from obstacles, respectively) by route type and by player. how for the shortest-distance routes, with less time and distance Thus, within the context of relatively simple perception-action to allow for smooth adjustments in their heading, both groups tasks with a singular and easily defined task goal (and reward steered away from obstacles abruptly. Further, DRL and human structure), like the virtual navigation task explored here, the agents both exhibited low repulsion and higher damping for similarity of DRL and human behavior is much more likely. the far-side routes, indicating that for far-side routes (which on On the other hand, for more complex tasks that involve average involve the greatest travel distance) agents had more multiple sub-goals or equifinal possibilities to achieve task time to steadily adjust the angle of approach in their trajectory, success, the highly tuned, near-optimal dynamics of DRL policies such that they could smoothly avoid obstacles in the way of is also their downfall in that these policies can quickly and reaching the target, and could even closely shave (without hitting) significantly diverge from those preferred (Carroll et al., 2019) obstacles on the way given the opportunity for finer control. or even attainable by human actors (Fuchs et al., 2020). This Regarding the virtual nature of the task, a study by Fink et al. results in DRL agent behavior that is either incompatible or (2007) compared human paths while walking to a stationary non-reciprocal with respect to human behavior (Carroll et al., goal and avoiding a stationary obstacle in matched physical and 2019), or difficult for humans to predict (Shek, 2019), even virtual environments and found small, but reliable, differences requiring the human user to be more-or-less enslaved to the in locomotor paths, with a larger maximum deviation, larger behavioral dynamics of the DRL agent to achieve task success obstacle clearance, and slower walking speed in the virtual (Shah and Carroll, 2019). Moreover, consistent with the current environment. They concluded these differences were most likely findings, even when the DRL agent policies and behavior are the result of greater uncertainty regarding the egocentric location within the action landscape of human behavior (as was the case of virtual obstacles. However, they found that the trajectories here), the over-tuned nature of DRL behavioral policies are often from both environments had similar shapes with no difference unable to capture the robust variability and flexibility of human in median curvature and could be modeled with a single set behavior, requiring the implementation of rather complex and of DPMP parameter values, thus justifying the use of virtual bespoke reward structures to cultivate different “types” of agents environments to study locomotor behavior. or DRL “personalities” (e.g., over avoidant or under-avoidant On one hand, given that a simple DPMP model (FW- navigational agents). DPMP model; Fajen and Warren, 2003, 2004) can capture the The obvious advantage of DPMP models, with regard to navigational behavior of human agents in an environment with the latter point, is that such models can not only be used to obstacles, and that neural networks are powerful functional approximate human behavior across a wide range of simple and approximators (Csáji, 2001), it is perhaps unsurprising that complex task contexts (Sternad et al., 2001; Ijspeert et al., 2013; the DRL agents produced trajectories that are consistent with Dumas et al., 2014; Lamb et al., 2017; Nalepka et al., 2017), but by those produced by the human participants. Indeed, the current making simple and transparent changes to model parameters one findings suggest that the policies (state-action mappings) that can also capture the variability of human behavior. Accordingly, the DRL agents learned during training approximated the the action dynamics of AAs controlled by DPMP models can be same low-dimensional dynamics expressed by the FW-DPMP easily tuned or varied to capture various “types” of human actors model (Equation 1); and, in turn, the DRL agents produced or actor task preferences within (or even across) task contexts. trajectories that closely matched the prototypical or near-optimal However, defining the environmental couplings (information human (hyper-tuned) trajectories and human-parameterized control laws) and functional details of DPMP models of human FW-DPMP model trajectories. Indeed, one advantage of DRL behavior does have its own challenges and often requires having methods for AA development is the capacity of deep neural a comprehensive a-priori understanding of the task-dynamics networks to learn low-dimensional feature representations from in question, which itself can require a significant degree of high-dimensional state-action spaces (Arulkumaran et al., 2017). experimentation and trial and error. This is of course in stark Frontiers in Psychology | www.frontiersin.org 12 September 2021 | Volume 12 | Article 725932
You can also read