Isolating the impact of COVID-19 lockdown measures on urban air quality in Canada
←
→
Page content transcription
If your browser does not render page correctly, please read the page content below
Air Quality, Atmosphere & Health
https://doi.org/10.1007/s11869-021-01039-1

Isolating the impact of COVID-19 lockdown measures on urban air
quality in Canada
Rabab Mashayekhi 1 & Radenko Pavlovic 1 & Jacinthe Racine 1 & Michael D. Moran 2 & Patrick M. Manseau 1 &
Annie Duhamel 1 & Ali Katal 1 & Jessica Miville 1 & David Niemi 1 & Si Jun Peng 1 & Mourad Sassi 1 & Debora Griffin 2 &
Chris Anthony McLinden 2

Received: 25 October 2020 / Accepted: 28 April 2021
# Crown 2021

Abstract
We have investigated the impact of reduced emissions due to COVID-19 lockdown measures in spring 2020 on air quality in
Canada’s four largest cities: Toronto, Montreal, Vancouver, and Calgary. Observed daily concentrations of NO2, PM2.5, and O3
during a “pre-lockdown” period (15 February–14 March 2020) and a “lockdown” period (22 March–2 May 2020), when
lockdown measures were in full force everywhere in Canada, were compared to the same periods in the previous decade
(2010–2019). Higher-than-usual seasonal declines in mean daily NO2 were observed for the pre-lockdown to lockdown periods
in 2020. For PM2.5, Montreal was the only city with a higher-than-usual seasonal decline, whereas for O3 all four cities remained
within the previous decadal range. In order to isolate the impact of lockdown-related emission changes from other factors such as
seasonal changes in meteorology and emissions and meteorological variability, two emission scenarios were performed with the
GEM-MACH air quality model. The first was a Business-As-Usual (BAU) scenario with baseline emissions and the second was
a more realistic simulation with estimated COVID-19 lockdown emissions. NO2 surface concentrations for the COVID-19
emission scenario decreased by 31 to 34% on average relative to the BAU scenario in the four metropolitan areas. Lower
decreases ranging from 6 to 17% were predicted for PM2.5. O3 surface concentrations, on the other hand, showed increases up
to a maximum of 21% close to city centers versus slight decreases over the suburbs, but Ox (odd oxygen), like NO2 and PM2.5,
decreased as expected over these cities.

Keywords COVID-19 impact . Regional air quality model . Lockdown emission scenario . Air quality observation analysis .
Canadian air quality

Highlights:                                                              Introduction
• The impacts of COVID-19 on air quality in four major Canadian cities
  were analyzed for spring 2020.
                                                                         A novel coronavirus disease 2019 (COVID-19) was initially
• Higher-than-usual seasonal declines in mean daily NO2 levels were
  observed from the pre-lockdown to lockdown periods.                    reported in the city of Wuhan, China, on 31 December 2019
• The use of a chemical transport model allowed the impact of emission   and then began to spread around the world. On 11
  changes to be examined in isolation from meteorological changes.       March 2020, with cases of COVID-19 reported in 114 coun-
• Modeling a lockdown emission scenario showed reductions in mean
                                                                         tries, the World Health Organization (WHO) declared the out-
  NO2 and PM2.5 concentrations ranging from 31 to 34% and from 6 to
  17%, respectively.                                                     break of this new coronavirus a pandemic (WHO 2020). To
• Ozone levels were predicted to increase by up to 21% near the urban    control the rapid spread of the virus, most countries were
  cores while slightly decreasing over the suburbs.                      forced to adopt emergency control measures, including travel
                                                                         restrictions, regional lockdowns, social distancing, stay-at-
* Rabab Mashayekhi                                                       home and shelter-in-place orders, and shutdowns of non-
  rabab.mashayekhi@canada.ca
                                                                         essential businesses. These measures led to significant reduc-
                                                                         tions in road traffic, air travel, industrial operations, construc-
1
    Air Quality Policy-Issue Response Section, Canadian Meteorological   tion, and commercial business operations, which in turn re-
    Center, Environment and Climate Change Canada, Dorval,
                                                                         duced anthropogenic emissions of air pollutants and resulted
    Quebec, Canada
2
                                                                         in cleaner air quality worldwide (Bauwens et al. 2020; Liu
    Air Quality Research Division, Environment and Climate Change
                                                                         et al. 2020; NASA 2020; Rodríguez-Urrego and Rodríguez-
    Canada, Toronto, Ontario, Canada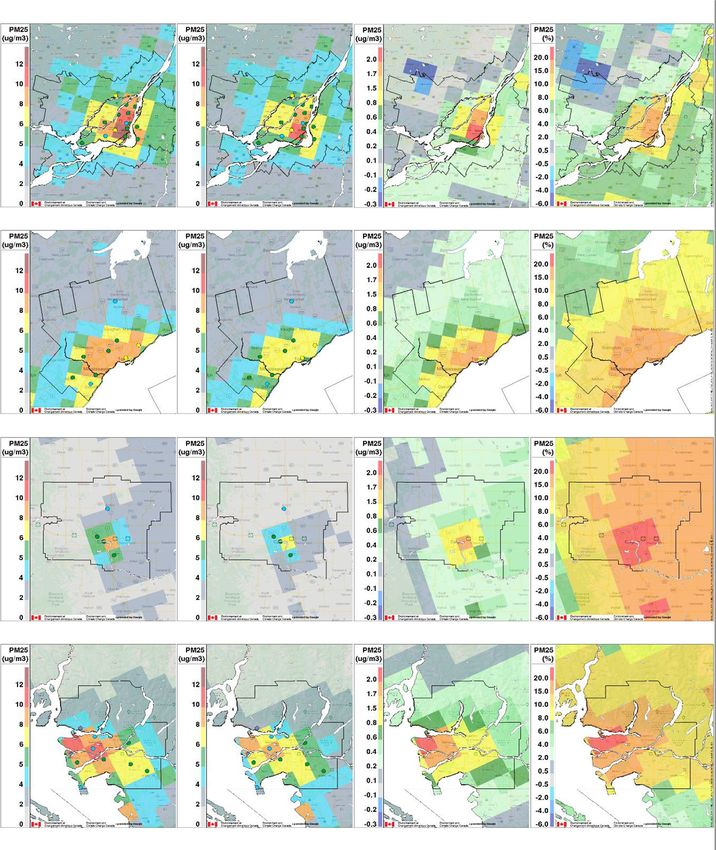
Air Qual Atmos Health

Urrego 2020). Such societal responses to the pandemic               actual meteorology but different emissions can be examined
around the world make this crisis a natural emissions-              (e.g., Menut et al. 2020; Wang et al. 2020a).
reduction experiment that provides a unique opportunity                 COVID-19-related emergency measures were introduced
to study anthropogenic impacts on air quality (AQ) in               in North America later than in China or Europe. In Canada,
many countries and the potential of future air pollution            such measures began in mid-March 2020, and reductions in
controls (Henneman et al. 2017).                                    air pollutant levels have been reported in different Canadian
    Many media articles appeared in the spring of 2020              urban areas since March 2020 (Adams 2020; Griffin et al.
reporting on satellite images released by several space agen-       2020; Rabson 2020; Xing 2020; MELCC 2020a). However,
cies that revealed a marked drop in air pollutants in different     as the world’s second-largest country but with a much lower
regions during lockdown periods (ESA 2020a, b; NASA                 population density than China or Europe, Canada poses a
2020; Schindler 2020). These articles were soon followed by         particular challenge for identifying AQ impacts from
scientific publications for different regions around the world.     COVID-19 control measures. For that reason, in this study,
Some of these scientific studies were based on satellite obser-     we have focused on large population centers where we expect-
vations (e.g., Bauwens et al. 2020; Liu et al. 2020;                ed the impacts to be the most pronounced. We have investi-
Muhammad et al. 2020; Sarfraz et al. 2020; Zhang et al.             gated the impact of activity reductions due to COVID-19 on
2020), some on analysis of near-real-time (NRT) surface mea-        NO2, PM2.5, and O3 levels in four of the largest urban areas in
surements (e.g., Rodríguez-Urrego and Rodríguez-Urrego              Canada: Montreal, Toronto, Calgary, and Vancouver. The
2020; Tobías et al. 2020; Wang et al. 2020b), and some on           first part of the study examines ground-level concentrations
modeling emission scenarios (e.g., Menut et al. 2020; Sharma        and compares measurements made during pre-COVID-19 vs.
et al. 2020; Wang et al. 2020a). Reductions ranging from 20 to      lockdown periods in 2020 and during the same periods from
40% have been reported in nitrogen dioxide (NO2) concentra-         2010 to 2019. In the second part of the study, we used the
tions in China, the USA, Italy, Spain, France, and the UK           Canadian operational air quality GEM-MACH (Global
(Berman and Ebisu 2020; Lee et al. 2020; Muhammad et al.            Environmental Multiscale–Modelling Air-quality and
2020). Reductions in PM2.5 levels as large as 65% (Bogotá,          Chemistry) model to quantify the impact of reduced emissions
Colombia) have been found in an analysis of 50 capital cities,      in isolation. We performed two 2020 emissions-scenario sim-
many in the developing world (Rodríguez-Urrego and                  ulations: a baseline “business-as-usual” (BAU) simulation
Rodríguez-Urrego 2020).                                             that employs “normal” emissions and serves as the counter-
    An important issue in the studies based on observations is      factual (Henneman et al. 2017), and a COVID-19 scenario
the difficulty in disentangling the impact of pandemic-related      that accounts for emission changes, both decreases and in-
emission reductions from other factors that might also contrib-     creases, due to lockdown measures. The “Surface observa-
ute to an observed reduction in air pollutants. Such confound-      tional analysis” section describes the analysis of NRT surface
ing factors include normal seasonal changes in meteorology,         observations and the modeling analysis is described in the
chemistry, and emissions, as well as anomalies in regional-         “Modeling approach” section. Analysis results are then
and synoptic-scale meteorology compared to typical climatic         discussed in the “Discussion” section and conclusions are
patterns (Goldberg et al. 2020). For example, changes in emis-      provided in the “Summary and conclusions” section.
sions due to lockdown measures widely coincided with the
transition from winter to spring in the Northern Hemisphere,
thus complicating efforts to isolate the pandemic-related AQ        Surface observational analysis
response. Unusual variations in weather, such as extended
cold or warm periods or wet or dry periods, can also affect         Measurement data description
pollutant levels (European Commission 2020; Schiermeier
2020). It is, therefore, challenging to quantify what fraction      Hourly NRT measurements of NO2, PM2.5, and O3 surface
of the observed AQ improvement is linked to reductions in air       concentrations for Canada were obtained from provincial and
pollutant emissions due to COVID-19 lockdowns and what              municipal air quality monitoring networks that are part of the
fraction is due to the seasonal transition from winter to spring,   larger National Air Pollution Surveillance (NAPS) Program
or to the occurrence of favorable or unfavorable spring weath-      (NAPS 2020; MELCC 2020b). The measurements are trans-
er, or to normal seasonal variations in emissions. One com-         mitted either directly to Environment and Climate Change
mon, observation-based approach is to perform an analysis of        Canada (ECCC) or indirectly via the US Environmental
pre-lockdown versus lockdown surface or satellite measure-          Protection Agency’s AirNow system (https://docs.airnowapi.
ments and compare with measurements for the same periods            org/). These measurements are then entered into the ECCC
in past years. Emission scenario modeling with atmospheric          Verification for Air QUality Models (VAQUM) system
transport models is another useful, complementary approach          (Gilbert et al. 2014), an evaluation tool that produces various
to quantify and isolate the impacts of emission change since        statistical scores of model predictions vs. measurements for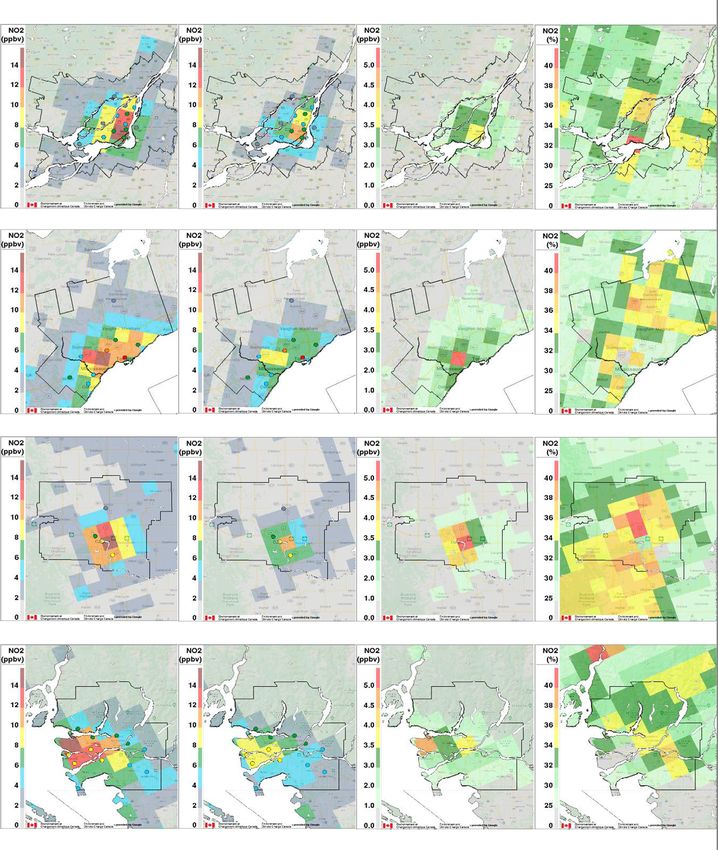
Air Qual Atmos Health

the ECCC operational AQ forecast system (e.g., Moran et al.       began a gradual exit from lockdown by announcing the re-
2013; Pavlovic et al. 2016). Before the NRT AQ measure-           moval of several regional travel restrictions and the re-
ments are used by VAQUM, they undergo a number of                 opening of some small businesses and provincial parks
quality-control tests, including identification of exceedances    (Neustaeter 2020). Driving activity can be seen to begin to
of maximum concentration thresholds (200 ppbv for NO2,            increase in the second half of April and to continue to grow
300 μg/m3 for PM2.5, 300 ppbv for O3) and minimum con-            throughout May (Figure S1). We have thus focused our anal-
centration thresholds (−3 ppbv for NO2 and O3 and −3 μg/m3        ysis on two time periods, a pre-lockdown “normal” period
for PM2.5) and detection of dubious sudden jumps and spikes       from 15 February to 14 March 2020 and a lockdown period
(see Section S1 for more details). The NRT measurements are       from 22 March to 2 May 2020, during which lockdown mea-
nevertheless considered to be preliminary and are subject to      sures were in full force everywhere in Canada. The week-long
change when different agencies release final, quality-assured     period from 15 to 21 March is considered to be a transition
measurement data sets for the same period. This last step,        period.
however, can typically take over 6 months, and in the mean-           In order to account for normal seasonal changes from
time, the NRT measurements provide valuable information on        February to May, such as increasing solar insolation and tem-
recent air quality conditions and on model forecast capability.   perature, observed surface concentrations during the pre-
However, for the period 2010–2019, which we also consid-          lockdown and lockdown periods in 2020 were compared to
ered, we obtained final NAPS measurement data sets.               the same periods in the previous 10 years (2010-2019).
    Measurements from sites located in the four largest           Figure 2 shows time series plots of NO2, PM2.5, and O3 sur-
Canadian Census Metropolitan Areas (CMA )—Montreal,               face concentrations for the February to May period for 2020
Toronto, Calgary, and Vancouver—were considered for this          and 2010–2019, for the four CMAs. Seasonal decreases can
analysis. A CMA consists of one or more adjacent municipal-       be seen for both NO2 and PM2.5 whereas O3 shows a slight
ities surrounding an urban core, where the core must have a       increase. The 2020 time series for mean NO2 volume mixing
population of at least 50,000 and the entire CMA must have a      ratio (VMR) is lower than the 2010–2019 mean for all four
total population of at least 100,000 (CMA 2011). The popu-        CMAs for both the pre-lockdown and lockdown periods,
lations of these four CMAs range from 1.6 to 6.2 million.         suggesting that early 2020 is already an atypical period.
Maps of the four CMAs and the locations of measurement            For PM2.5 concentrations, on the other hand, the 2020 mean
sites within each CMA are presented in Fig. 1. For the            time series lies below the 2010–2019 mean time series only
Montreal CMA, there are 14 measurement stations for NO2,          for Montreal and Calgary, and for O3 only the 2020 mean
15 for PM2.5, and 13 for O3; for the Toronto and Calgary          time series for Calgary is consistently higher than the 2010–
CMAs, there are a total of nine and four measurement stations,    2019 mean time series.
respectively, for all three pollutants; and for the Vancouver         Table 1 shows overall mean values for the pre-lockdown
CMA, there are 12 measurement stations for NO2, 11 for            vs. lockdown periods for 2020 and 2010–2019 for the four
PM2.5, and 12 for O3. All of these measurement sites reported     CMAs. The mean seasonal reduction in NO2 VMR (lockdown
at least 80% of the time (96% on average) during the 4 months     mean subtracted from pre-lockdown mean) observed for the
from February to May 2020, the period of interest for this        10-year baseline varies by city, from 19% for Toronto up to
study. Although some other CMAs, like Ottawa-Gatineau,            40% for Calgary (Table 1). A similar but higher seasonal
were also of interest, they each had fewer than four measure-     decline is observed in 2020 for each city, with reductions of
ment sites, a small sample size that raised concerns about        25% for Toronto, 47% for Calgary, 50% for Montreal (vs.
spatial representativeness.                                       33%), and 33% for Vancouver (vs. 27%). One can then sub-
                                                                  tract the seasonal change in 2020 from the previous 10-year
Pre-COVID versus COVID analysis                                   average change to estimate the impact of the COVID-induced
                                                                  change. These additional reductions for NO2 are 17% for
National and provincial declarations of states of emergency in    Montreal, 6% for Toronto, 7% for Calgary, and 6% for
Canada began in mid-March 2020 (Boire-Schwab et al. 2020);        Vancouver. However, this approach does not account for me-
but complete lockdown measures were not in place until 18         teorological variations (anomalies from climate averages) in
March when the USA-Canada border was officially closed to         2020, which can also impact observed concentrations inde-
all non-essential travel. Daily mobility data, including the      pendently of emission changes. For example, the pre-
“driving” and “transit” categories, which were extracted for      lockdown period in 2020 was also characterized by lower
the four CMAs from Apple mobility trends reports based on         concentrations compared to the same period in the baseline
smartphone tracking (Apple Inc 2020), show a rapid decline in     average (Table 1). Mean NO2 VMR values during the pre-
these activities for all four CMAs starting from mid-March        lockdown period in 2020 were lower than the corresponding
(Figure S1). The end of the complete lockdown period con-         values for the previous 10-year period for each CMA by 26%
sidered in this study is 2 May 2020, when individual provinces    for Montreal, 31% for Toronto, 31% for Calgary, and 11% for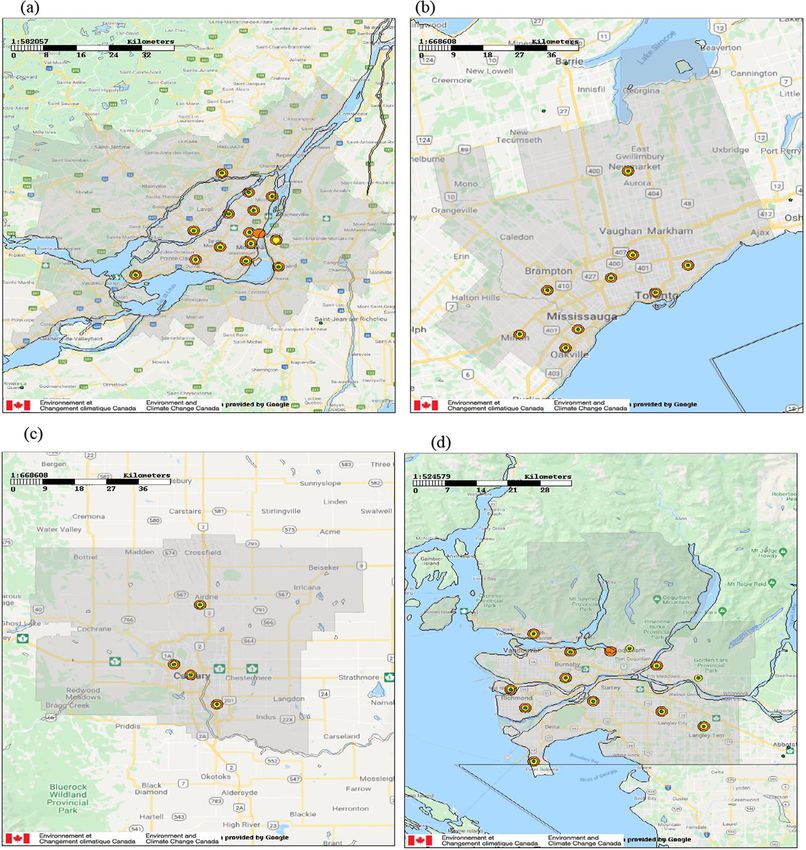
Air Qual Atmos Health

Fig. 1 Locations of NAPS monitoring stations for NO2 (shown as yellow   Montreal (15 stations, 4.1 million population), (b) Toronto (9 stations,
circles), PM2.5 (orange circles), and O3 (green circles) within the     6.2 million population), (c) Calgary (4 stations, 1.6 million population),
Canadian Census Metropolitan Areas (shaded gray regions) for (a)        and (d) Vancouver (13 stations, 2.6 million population)

Vancouver. Goldberg et al. (2020) noted that meteorological                The differences between the seasonal changes in PM2.5
patterns favored lower NO2 levels in spring 2020 compared to            surface concentration for 2020 vs. 2010–2019 for the four
spring 2019. In particular, snow cover extent and depth were            CMAs are less pronounced than those for NO2 (Table 1).
much reduced in early March in 2020 vs. 2019, which would               The observed PM2.5 seasonal decreases in 2020 in Toronto
lead to increased vertical mixing and hence could be an im-             and Calgary were smaller than the mean seasonal decreases
portant factor for Montreal, Toronto, and Calgary (Vancouver            for 2010–2019, whereas Montreal had a 4% greater reduction
has a milder climate).                                                  in 2020 than the 2010–2019 average. Vancouver, by contrast,
Air Qual Atmos Health
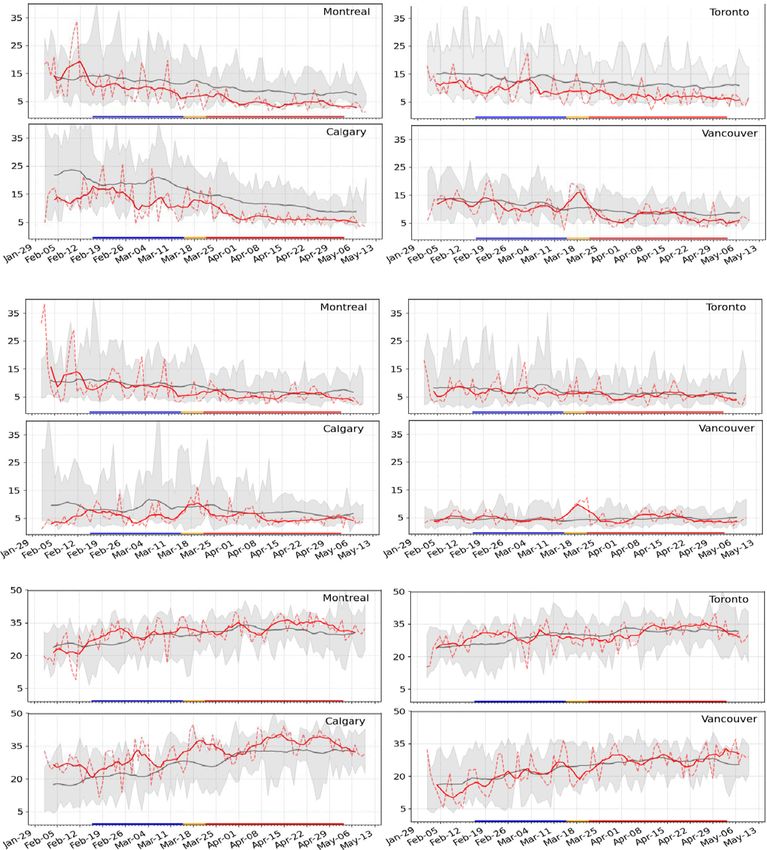
(a) 2010-2019 2020 (rolling 7-day avg) 2020 (daily avg)
(b)
(c)
Fig. 2 Time series of observed rolling 7-day average for hourly (a) NO2 daily average in 2020 and the shaded gray area presents the daily mini-
(ppbv) (b) PM2.5 (μg m-3) and (c) O3 (ppbv) surface concentrations av- mum and maximum values observed in the 10-year data. The blue, yel-
eraged over all monitoring stations within each city from 1 February to 13 low, and red lines shown on the time axis below each plot indicate the pre-
May for year 2020 (solid red line) and for the preceding 10-year-period lockdown, transition to full lockdown, and full lockdown periods,
(2010–2019) average (gray line). The dashed red line corresponds to the respectively
had a 7% increase in PM2.5 in 2020 from the pre-lockdown to 2010–2019 baseline. For O3, which has seasonal springtime
lockdown period, slightly higher than the 5% increase for the increases for the 10-year baseline for all four CMAs (15% in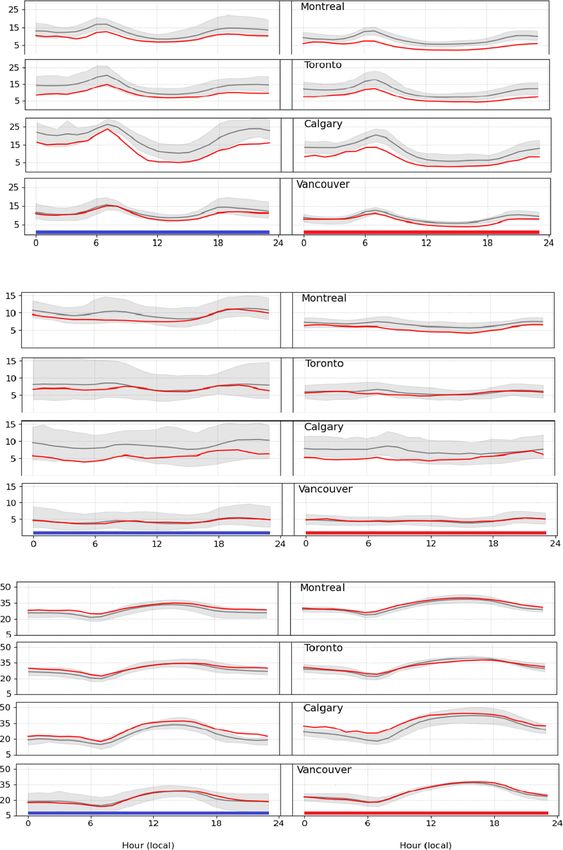
Air Qual Atmos Health
% change2
Montreal, 13% in Toronto, 36% in Calgary, and 28% in
Vancouver), the seasonal increases in 2020 were smaller for
15.3
11.0
12.8
35.9
32.2
28.4
29.0
6.0
Montreal (−4%), Toronto (−7%), and Calgary (−4%) and was
essentially unchanged for Vancouver. It is thus difficult to
Lockdown discern an obvious COVID-19 signal for either PM2.5 or O3.
It is also of interest to look at pre-lockdown and lockdown
31.7
33.3
31.7
31.7
31.4
36.1
15.0
27.1
27.6
5.0
0.0
1.8
mean diurnal time series for each city for 2020 vs. 2010–2019
(Fig. 3). In 2020, the NO2 mean diurnal time series were lower
Pre-lockdown
Mean hourly observed NO2, PM2.5, and O3 concentrations averaged over the pre-lockdown and lockdown periods in 2020 and 2010–2019 for the four CMAs
than the 10-year average during both the pre-lockdown and
O3 (ppbv)
lockdown periods for all four cities (Fig. 3(a)). Moreover, the
27.5
30.0
28.1
29.9
23.1
27.3
18.2
21.1
21.4
2020 NO 2 lockdown diurnal time series for Toronto,
9.1
6.4
1.4
Montreal, and daytime Vancouver lie below the shaded gray
% change2
regions, indicating that the 2020 values are lower than the
minimum values observed for any year in the previous 10
−31.6
−35.3
−21.3
−17.6
−17.2
−8.9
4.7
7.0
years. At the same time, the peak values for Toronto,
Montreal, and Calgary during the lockdown period, which
Lockdown
occur during morning rush hour in each city, lie below the
−17.9
−29.2
2010–2019 range. These lower values could be linked in part
−5.1
6.7
5.5
5.9
5.6
7.2
5.1
4.5
4.6
2.2
to COVID-19 lockdown measures. The PM2.5 diurnal time
PM2.5 (μg m−3)
series also show lower concentrations than the 10-year aver-
Pre-lockdown
age during both the pre-lockdown and lockdown periods for
Montreal, Calgary, and, to some extent, Toronto, whereas the
−13.3
−35.6
−9.3
2020 PM2.5 diurnal time series for Vancouver are very close to
9.8
8.5
7.5
6.8
8.7
5.6
4.3
4.3
0.0
those for the 2010–2019 period (Fig. 3(b)). Lastly, the differ-
% change2
ences in the mean diurnal time series between 2020 and the
2010–2019 baseline averages for O3 are relatively small for all
−33.1
−50.0
−18.7
−24.7
−39.7
−46.9
−27.1
−33.3
four cities (Fig. 3(c)).
The results of this simple statistical analysis confirm the
Lockdown
difficulty of trying to quantify the impact of COVID-
induced reductions in pollutant levels without considering me-
−44.7
−35.8
−39.5
−18.6
10.9
11.4
8.5
4.7
7.0
6.9
8.6
7.0
teorological anomalies. Short-term variations in meteorologi-
cal fields can also have large short-term impacts on observed
Pre-lockdown
pollutant concentrations. For example, elevated peaks of NO2
NO2 (ppbv)
and PM2.5 were observed in spring 2020 in Vancouver cen-
−26.0
−30.6
−31.2
−11.0
tered on 18 March and in mid-April (Fig. 2). A meteorological
12.7
13.4
18.9
13.0
11.8
10.5
9.4
9.3
analysis (Figure S5) found that Vancouver was under a posi-
% change in lockdown period compared to pre-lockdown period
tive geopotential anomaly at 500 hPa and a positive surface
% change 1
2010–2019
2010–2019
2010–2019
2010–2019
% change1
% change1
% change1
pressure anomaly during both of these periods (IRI 2020).
2020
2020
2020
2020
This means that for both peaks, this region was situated under
a stable, high-pressure system, which is favorable for high
(12 stations for NO2, 11 for PM2.5, and 12 for O3)
pollutant concentrations even with reduced emissions. Wang
(14 stations for NO2, 15 for PM2.5, and 13 for O3)
% change in 2020 compared to 2010–2019
et al. (2020b) also noted the importance of meteorological
Calgary (4 stations for NO2, PM2.5, and O3)
variations during the COVID-19 lockdown period.
It should also be noted that this observation-based analysis
(9 stations for NO2, PM2.5, and O3)
did not consider inter-annual changes in Canadian anthropo-
genic emissions, although marked decreases in emissions
have occurred over the 2010–2017 period for many pol-
lutants (CESI 2020). The impact of wildfire emissions
was also not considered, as wildfires are not typically a
significant PM2.5 source in early spring in Canada (e.g.,
Vancouver
Munoz-Alpizar et al. 2017).
Montreal
Toronto
Table 1
Nevertheless, the analyses presented in this section suggest
that a higher-than-usual change in observed pollutant surface
1
2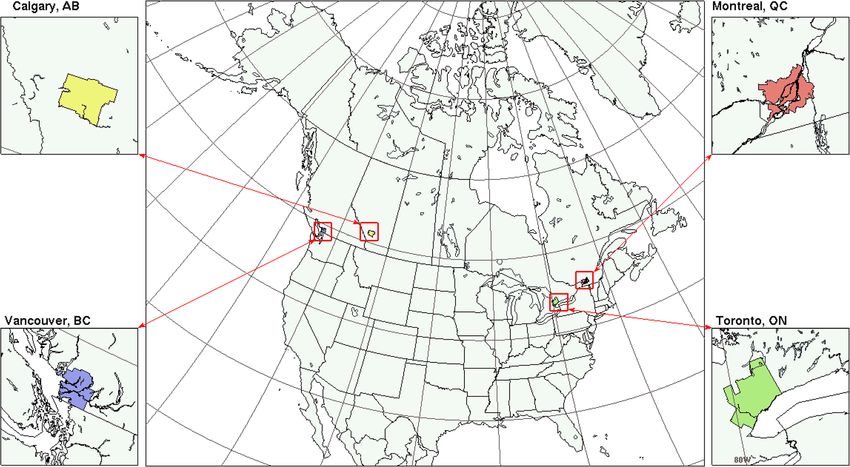
Air Qual Atmos Health

                                                                         (a)                      Lockdown
                                Pre-lockdown                                                                              2020

                                Pre-lockdown                             (b)                       Lockdown

                                Pre-lockdown                             (c)                        Lockdown

Fig. 3 Mean diurnal time series for observed hourly (a) NO2 (ppbv) (b)         metropolitan areas in Canada. The red line shows the mean values for
PM2.5 (μg m-3) and (c) O3 (ppbv) concentrations during pre-lockdown            2020 and the black line shows the mean values for 2010–2019 with the
(left panels) and lockdown period (right panels) for four major                ranges for individual years shaded in gray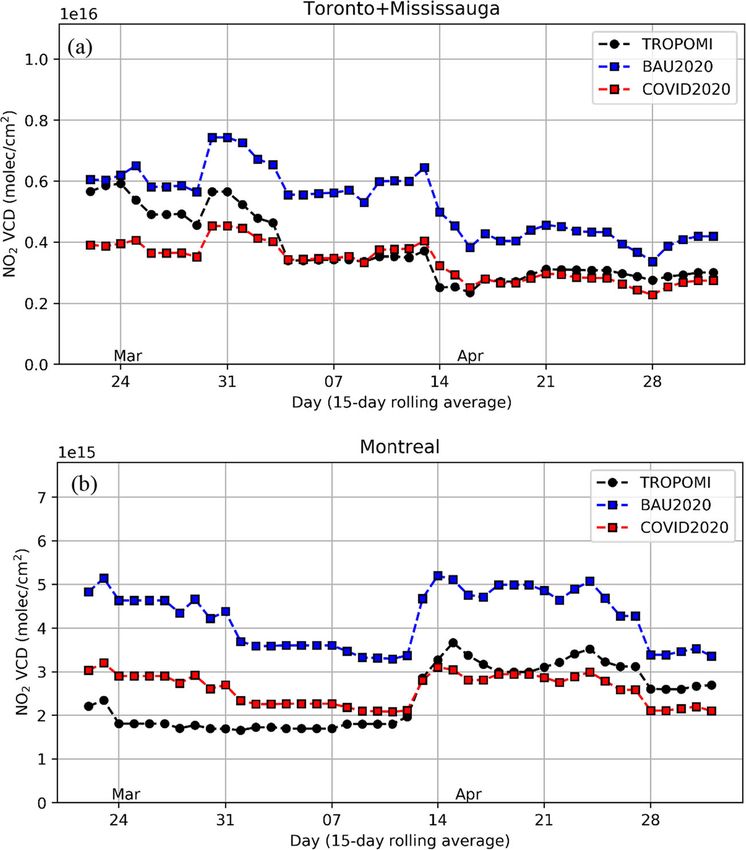
Air Qual Atmos Health

concentrations occurred in the four largest Canadian urban          condensation, coagulation, dry deposition, aerosol-cloud in-
areas during the COVID-19 lockdown period, especially for           teractions, and cloud scavenging (Gong et al. 2003); inorganic
NO2 and, to a lesser extent, PM2.5. Further quantification of       aerosol thermodynamics, cloud processing, and secondary or-
the impact of COVID-19-related measures, however, is limit-         ganic aerosol chemistry are also considered (Gong et al. 2015;
ed by the difficulty in accounting for the simultaneous impact      Makar et al. 2003; Stroud et al. 2011). A simplified, two-bin
of seasonal and inter-annual variations in meteorology and          sectional PM size distribution with Stokes diameter size bins
emissions.                                                          of 0–2.5 and 2.5–10 μm to represent fine PM (PM2.5) and the
                                                                    coarse fraction of PM10, respectively, is used by the operation-
                                                                    al version of GEM-MACH to reduce computational expense.
Modeling approach                                                       Anthropogenic emissions of 18 gas-phase species and 12
                                                                    size-bin-specific PM chemical components are needed by the
This section describes an additional analysis of the impact of      model. Plume-rise and plume-spread calculations are per-
COVID-19 measures for the four Canadian CMAs, where an              formed at each model time step for large stationary point
AQ model was used to simulate two 2020 emission scenarios.          sources to determine the model vertical layers into which
One was a BAU scenario that employed “normal” emissions             point-source emissions are injected. Biogenic emissions and
unaffected by any COVID-19 measures. The other was a                sea-salt emissions are also calculated in the model at each time
COVID-19 scenario that accounted for emission changes,              step based on meteorological fields forecast by the model.
both decreases and increases, due to lockdown measures.             Algorithms from version 3.09 of the BEIS biogenic emissions
These two scenarios were simulated using the same 2020 me-          model (Hanna et al. 2005) and from the sea-salt emission
teorology and usual seasonal changes in emissions, which            scheme of Gong et al. (2003) are used to estimate these natural
allowed the impact of the unusual, COVID-19-related emis-           emissions. The anthropogenic emissions used in this study are
sion changes to be isolated and quantified.                         described in more detail in the next section.
                                                                        For operational regional forecasting, GEM-MACH is run
Model and simulation description                                    in a one-way-coupled mode twice a day at 00 and 12 UTC to
                                                                    produce 72-h forecasts of three air pollutants (NO2, PM2.5,
The air quality model used in this study was version 3.0 of the     and O3) over North America. The forecast domain covers
ECCC Global Environmental Multiscale–Modelling Air-                 most of Canada, the continental US, and northern Mexico
quality and Chemistry (GEM-MACH) model. GEM-MACH                    (Fig. 4) on a latitude-longitude map projection and a horizon-
is an in-line, one- or two-way-coupled chemical transport           tal grid with 10-km grid spacing. In the vertical, a hybrid
model (CTM) with a detailed representation of atmospheric           sigma-pressure coordinate is used with a Charney-Phillips
chemistry, including emissions, dispersion, and removal pro-        staggered vertical grid, with 84 momentum full levels and
cesses, that is embedded within the GEM model, ECCC’s               thermodynamic half levels from the Earth’s surface up to 0.1
operational global and regional numerical weather prediction        hPa. The lowest three momentum levels are located at 20 m,
(NWP) model (Caron et al. 2015; Charron et al. 2012; Côté           60 m, and 115 m AGL and the first three thermodynamic
et al. 1998b; Côté et al. 1998a). The GEM-MACH model has            levels are located at 10 m, 40 m, and 85 m. Chemical tracers
been used operationally by ECCC for regional air quality            are assigned to thermodynamic levels.
forecasting since 2009 (Moran et al. 2010, 2013; Pavlovic               The GEM-MACH regional forecast grid is a subgrid of
et al. 2016), and version 3.0 has been operational since            a larger 10-km forecast grid used by the regional version
July 2019 (Moran et al. 2019a).                                     of the GEM NWP model. Hourly meteorological bound-
   GEM-MACH is a multi-phase, multi-pollutant CTM that              ary conditions are provided from 72-h GEM operational
considers the interactions of gas-, aqueous-, and particle-phase    meteorological forecasts. Predetermined, spatially varying
chemical components. To model gas-phase chemistry, it em-           seasonal chemical lateral boundary conditions are based
ploys an updated version of the ADOM-2 gas-phase chemical           on a 1-year simulation of the MOZART4 (Model for
mechanism with 42 species and 114 reactions (Stockwell and          OZone and Related chemical Tracers) global CTM, which
Lurmann 1989; Stroud et al. 2008; Venkatram et al. 1992).           includes a detailed treatment of tropospheric inorganic
The aqueous-phase chemistry mechanism is based on an up-            chemistry and some organic species (Pendlebury et al.
dated version of the ADOM mechanism with 13 species and             2018). The regional version of GEM uses an integration
25 reactions (Fung et al. 1991; Gong et al. 2006). The chem-        time step of 300 s while the chemistry module of GEM-
ical composition of particulate matter (PM) is represented          MACH employs an integration time step of 900 s to re-
using eight chemical components: sulfate; nitrate; ammonium;        duce computational expense. Note, though, that operator
elemental carbon; primary organic matter; secondary organic         splitting is employed to integrate the GEM-MACH chem-
matter; crustal material; and sea salt. The treatment of aerosol-   istry module and some processes such as gas-phase chem-
phase dynamics includes parameterizations of nucleation,            istry may be solved using much smaller time steps.
Air Qual Atmos Health Fig. 4 Map of the GEM-MACH domain. The boxes show the locations and spatial extent of the Census Metropolitan Areas for the four major Canadian cities considered in this study GEM-MACH performance has been evaluated in a number analysis from the regional configuration of the GEM opera- of ways against surface AQ measurements (Chen et al. 2019; tional NWP model. The initial chemical tracer fields for the Moran et al. 2018a, 2019a, b; Pavlovic et al. 2016; Robichaud first simulation of the BAU scenario were obtained from the et al. 2016; Stroud et al. 2020; Zhao et al. 2019) and against operational GEM-MACH regional forecast for 31 January peer models (Im et al. 2015b; Im et al. 2015a; Wang et al. 2020. For subsequent BAU runs, the initial chemical tracer 2015) for different model versions and time periods. To best fields came from the final forecast fields of the previous align with the present study, Table S2 summarizes objective GEM-MACH BAU run, and the initial chemical tracer fields scores for NO2, O3, and PM2.5 for recent periods in the sum- used for the first simulation of the COVID-19 scenario came mer of 2019 and winter of 2020 for the same model version from the final forecast fields of the 14 March 2020 BAU- (v3.0) and same Canadian projected 2020 emissions inventory scenario run. as used in the present study. Hourly observations from AQ measurement stations in western Canada (including Emission scenarios Vancouver and Calgary) and eastern Canada (including Toronto and Montreal) were considered separately. Mean Annual Canadian anthropogenic emissions of eight common biases for NO2 were small and negative in the winter for air pollutants (SO2, NOx, VOC, CO, NH3, PM2.5, PM10, TSP) western and eastern Canada (−0.8 and −0.5 ppbv, respective- are tabulated by province and source type in ECCC’s compre- ly) and small and positive in the summer (0.1 and 0.2 ppbv). hensive Canadian Air Pollutant Emissions Inventory (APEI O3 and PM2.5 hourly forecasts tended to have a negative mean 2020). The Canadian anthropogenic emissions used for the bias in both seasons, with a range of −5.7 to 0.3 ppbv for O3 BAU scenario are based on a projected 2020 national emis- and −2.8 to 0.3 μg m−3 for PM2.5. sions inventory that was generated by ECCC for policy stud- The two scenario simulations performed in this study ies in late 2017; the projection base-year inventory was the employed the operational configuration of GEM-MACH. 2015 APEI. The projected emissions estimates account for The BAU-scenario simulation spanned over the period from projected changes in population, economic activity, and ener- 1 February to 11 May 2020 while the simulation period for the gy use over the 5 years, from 2015 to 2020, as well as the COVID-19 scenario was shorter and started on 15 March (the implementation over this period of already-legislated air pol- beginning of the transition period). Each GEM-MACH inte- lution control measures and expected facility openings or clo- gration began at 00 UTC and ran for 24 h. The meteorological sures. However, no additional air pollution control measures initialization for each integration used a new meteorological that were not already mandated by the end of 2017 to come
Air Qual Atmos Health

into effect by the end of 2020 were considered in the projec-          to account for changes in human activities in response to re-
tion, hence the BAU name.                                              strictions during the lockdown period. Since the level of ac-
    Table 2 summarizes the BAU baseline emissions of three             tivity restrictions was similar for all regions in Canada due to
pollutants (NOx, VOC, PM2.5) in each of the four CMAs dur-             the coordinated, nationwide measures implemented across the
ing the 42-day spring lockdown period. To calculate the total          country during the lockdown period in spring 2020, we as-
emissions in each city, GEM-MACH gridded emissions were                sumed a uniform, nationwide emission change factor. To
summed for the grid cells contained within the CMA bound-              quantify the reduction in traffic, we used an estimate of daily
ary of each city. This table lists the main emission source            “driving” activities provided by Apple Inc. (Apple Inc 2020).
categories considered in this study, namely industry, road             A reduction in traffic activity ranging from 50 to 65% was
transportation, air traffic, residential heating, and other            observed for the four cities over the lockdown period
sources. The transportation sector, which in urban areas is            (Figure S1). A complementary analysis for three of the cities
dominated by emissions from on-road vehicles, is the major             that shows similar reductions can be found in Figure S3. An
source of nitrogen oxides, accounting for 40 to 47% of total           analysis of available vehicle traffic-count data for major roads
NOx emissions. This sector is also the second-largest source of        obtained for each of the cities showed similar reductions in the
fine particulate matter, contributing to 33% of total PM2.5 in         total number of cars (Figure S4 shows the Calgary analysis).
Toronto, around 25% in Montreal and Vancouver and 18% in               We thus applied a 60% decrease to on-road BAU emissions
Calgary. More than half of the total PM2.5 emissions in all four       nationwide in both urban and rural areas to estimate the cor-
cities comes from the industrial sector. In particular, the dominant   responding lockdown emissions for this sector since residents
source (75%) of PM2.5 emissions in the Calgary CMA is from             everywhere were asked to stay at home except for essential
the upstream oil and gas industry. The industrial sector also con-     travel. Aviation activity was also strongly impacted by the
tributes more than one-third of total volatile organic compound        lockdown: total commercial airline flights in Canada were
(VOC) emissions in the four urban areas and more than half in          79% lower in April 2020 compared to April 2019 (Statistics
Calgary. The other major source of VOCs is general solvent use,        Canada 2020). To account for this decrease, we assumed an
which is included in the “other” category in this table. Although      80% reduction in emissions from aircraft LTOs nationwide for
the contribution of aircraft LTO (landing and takeoff) emissions       the lockdown period.
to total urban air pollutant emissions is relatively small (ranging        In addition to the Apple traffic activity data, we also used
from 1 to 3%), its regional impact on local air quality can be         time series data for Canada obtained from the Google
significant as it is spatially localized over a small area near the    Community Mobility Reports (Google 2020) on time spent
airport. Lastly, the residential heating sector contributes as much    in different categorized community places such as work-
as 10% of NOx emissions in Toronto and 20% of total PM2.5              places, residences, parks, and transit stations. While these data
emissions in Montreal (where residential wood combustion is the        showed a marked decrease in time spent in most community
highest of the four cities).                                           spaces for the lockdown period, they also showed roughly a
    To construct the COVID-19 emission scenario, the 2020              20% increase in time spent in ‘residential’ spaces for the four
BAU baseline emissions inventory for Canada was modified               cities (Figure S2). Accordingly, we applied a 20% increase to

Table 2 Total NOx, VOC, and
PM2.5 emissions (tons) by source      CMA         Species   Industry   Road             Air       Residential   Others          Total
sector in each CMA during the                                          Transportation   Traffic   Heating
lockdown period (22 March–2                                 (−30%)     (−60%)           (−80%)    (+20%)        No change
May 2020), under the business-
as-usual (BAU) scenario. The          Montreal    NOx       1,155      1,708            75        123           848             3,909 (−36%)
percentage values in the table
                                                  VOC       2,265      456              19        462           2,966           6,168 (−14%)
header indicate the estimated
change for each sector that were                  PM2.5     1,169      641              2         464           141             2,417 (−27%)
used to build a “lockdown” emis-      Toronto     NOx       1,086      2,548            193       603           1,624           6,054 (−31%)
sion scenario. The percentage                     VOC       3,088      693              45        123           5,272           9,221 (−15%)
values in the total column indicate
                                                  PM2.5     2,082      1,251            3         173           259             3,768 (−36%)
the overall impact of the COVID-
19 scenario reductions for each       Calgary     NOx       1,060      1,563            66        200           873             3,762 (−34%)
city and pollutant.                               VOC       1,719      401              24        13            1,710           3,867 (−20%)
                                                  PM2.5     1,928      459              2         32            127             2,548 (−33%)
                                      Vancouver   NOx       745        1,402            98        110           639             2,994 (−37%)
                                                  VOC       1,964      492              35        69            2,420           4,980 (−18%)
                                                  PM2.5     626        268              3         89            82              1,068 (−31%)
Air Qual Atmos Health residential emissions nationwide for the lockdown period to morning and afternoon rush hours, weekday-weekend differ- reflect such impacts as increased home heating requirements. ences, and seasonal changes in emissions due to change in The estimated reduction factors for the other sectors are space-heating and air-conditioning loads and summer based on those used in similar emission scenario studies for vacations. Europe (EU 2020; Menut et al. 2020) and our best estimates. Emissions from the industrial sector were assumed to decrease Modeling results uniformly by 30% nationwide (note from Figure S2 that visits to or time spent in workplaces in the provinces containing the Spatial distributions of mean hourly NO2, PM2.5, and O3 con- four CMAs decreased by 50 to 60% during the lockdown), centrations during the lockdown period (22 March–2 while emissions from other sectors, such as agriculture, rail, May 2020) predicted by GEM-MACH for the BAU and and marine, were assumed to remain unchanged. It should be COVID-19 scenarios are shown in Figs .5 to 7 for each major noted that this is only an illustrative scenario representing one metropolitan area in the two left-side panels. Mean measured possible case and is subject to many uncertainties. More ac- hourly concentrations are also shown by overlaying colored curate Canadian emissions estimates for early 2020 may be circles on the predicted concentration fields at the station lo- available in the future when the 2020 APEI is released (but cations. In general, better agreement with observations is seen only annual emissions are reported). for the COVID-19 scenario for all three pollutants as com- As shown in Fig. 4, the GEM-MACH domain also includ- pared to the BAU scenario. The predicted mean NO2 and ed the continental US, Alaska, and northern Mexico. The US PM2.5 levels for the BAU scenario are higher overall than emissions used for the two scenarios came from a projected the observed mean values almost everywhere, with the excep- 2017 US National Emissions Inventory (NEI) that was based tion of two stations located near downtown Toronto for NO2. on the 2011 US NEI. This 2017 inventory was obtained from The highest NO2 and PM2.5 concentrations predicted by the version 6.3 of the US Environmental Protection Agency model are mainly distributed near the city centers or the inter- (EPA) 2011 Air Emissions Modeling Platform for policy de- sections of major highways. The spatial patterns predicted for velopment applications (Moran et al. 2018b; U.S. EPA 2016). the COVID-19 scenario are very similar, but, consistent with Mexican emissions for the two scenarios were based on the the emission reduction, the magnitudes of modeled NO2 and 2008 Mexican National Emissions Inventory, which was also PM2.5 levels for the COVID-19 scenario are generally lower obtained from the EPA 2016 Air Emissions Modeling than those predicted for the BAU scenario. By contrast, O3 Platform (U.S. EPA 2016). VMR shows a slight increase for the COVID-19 scenario The gridded emissions used by GEM-MACH for the USA compared to the BAU scenario (Fig. 7), likely as a result of and Mexico were assumed to remain the same in both scenar- reduced O3 titration by NO due to reduced NOx emissions. ios. This choice was partly made out of necessity because the Maps of the actual and relative difference fields between initial US response to the COVID-19 pandemic was very the two emission scenarios are also shown in Figs. 5–7. In complicated and varied greatly in time and by state, county, Toronto, the maximum NO2 VMR, which corresponds to a and even city (e.g., Berman and Ebisu 2020; Goldberg et al. grid cell that is located near Canada’s busiest airport and in- 2020). Trying to represent the mixed impact of full, partial, cludes important highway intersections, dropped by 41% and no lockdowns was beyond the scope of this project. (from 14.5 to 9.3 ppbv) in the COVID scenario compared to However, our analysis of a sensitivity test for the COVID-19 the BAU reference run (Fig. 5). Similar but smaller reduc- scenario that used a different US inventory (projected 2028 tions, ranging from 26% in Montreal (from 14 to 10.3 ppbv), NEI) showed that the change of US emissions had a small 32% in Calgary (from 16 to 10.8 ppbv) to 34% in Vancouver impact on the modeled concentrations for the four major (from 14 to 9.2 ppbv), were seen for the grid cells in these Canadian cities considered in this study (Figure S6). cities for which the highest NO2 VMR was predicted. Table 3 Version 3.7 of the Sparse Matrix Operator Kernel gives mean, maximum, and minimum percentage changes at Emissions (SMOKE) tool (UNC 2014), a widely used emis- the grid-cell level for the COVID-19 scenario for NO2, PM2.5, sions processing system, was used to process the three nation- and O3 concentrations for the grid cells located within each al anthropogenic emissions inventories to generate model- CMA. The average reduction predicted for NO2 VMR ranges ready hourly emissions from major point sources and surface from 31 to 34% for all four cities in response to the modeled sources. Major point sources are those large individual facili- lockdown emission reductions, but it should be noted that ties (with smokestack height greater than 15 m) for which these reductions vary across each CMA, from a minimum plume rise is calculated in the GEM-MACH model. The hour- reduction of 20% up to a maximum reduction of 42%, as a ly gridded emissions were generated for a representative week consequence of spatially varying emission changes. of each month, and so they vary by hour of the day, day of the Interestingly, the location of the highest percentage change week, and month of the year. These emissions thus account is shifted downwind of the grid cells with the highest NOx for expected temporal variations due to such factors as emissions in each city as a consequence of the complex,
Air Qual Atmos Health
(a) (b) (c) (d)
Montreal
Toronto
Calgary
Vancouver
Fig. 5 Mean hourly NO2 surface volume mixing ratio (ppbv) gridded rows from top to bottom correspond to Montreal, Toronto, Calgary, and
fields for the “full lockdown” period (22 March–2 May 2020) predicted Vancouver. Colored circles represent the locations and mean observed
by the model for the four major metropolitan areas for (a) BAU scenario, NO2 concentrations at each monitor and the thin black outlines indicate
(b) COVID lockdown scenario, (c) scenario difference (BAU–COVID), CMA boundaries.
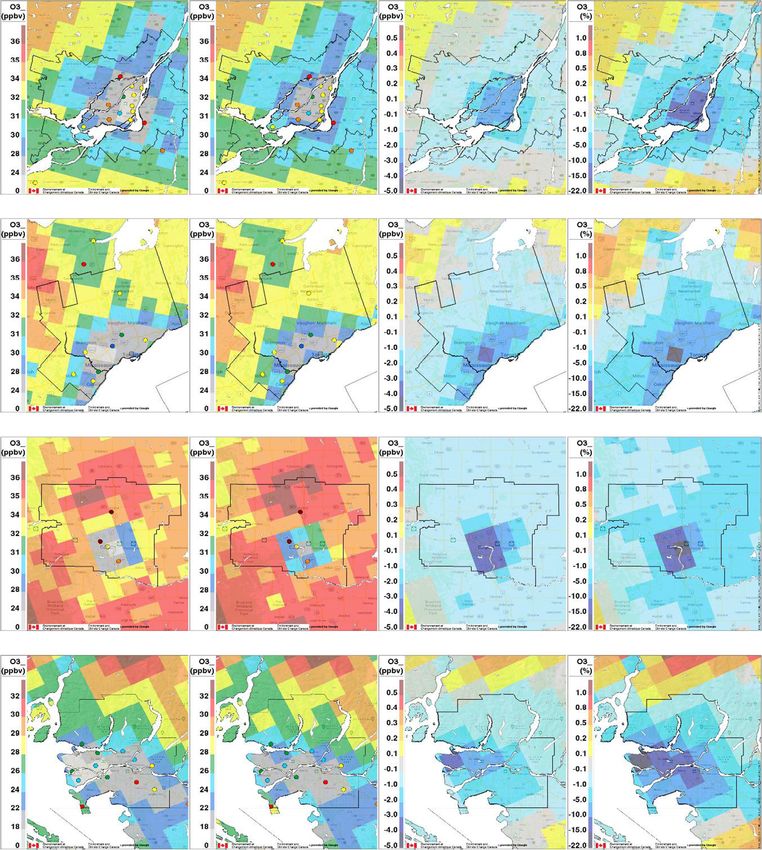
and (d) relative percentage difference ((BAU–COVID)/BAU). The fourAir Qual Atmos Health Fig. 6 The same as Fig. 5 but for PM2.5 (μg m−3) nonlinear nature of NO2 chemistry (Fig. 5). Note that Griffin The maximum predicted PM2.5 concentrations, which cor- et al. (2020) showed similar variations in NO2 column values respond to grid cells located in the downtown core of each across the Toronto urban area based on an analysis of satellite city, have also decreased in the COVID-19 scenario compared NO2 column measurements. to the BAU scenario (Fig. 6). Montreal has the highest PM2.5
Air Qual Atmos Health

       (a)   BAU                              (b)   COVID        (c) BAU-COVID                  (d) (BAU-COVID)/BAU

       Montreal

        Toronto

       Calgary

       Vancouver

Fig. 7 The same as Fig. 5 but for O3 (ppbv)

concentration (13.8 μg m−3) among the four cities under the       in these two cities. A less pronounced drop is seen in PM2.5
BAU scenario, followed by Vancouver (10.7 μg m−3). These          concentrations compared to NO2 levels for the COVID-19
peaks can partly be attributed to residential wood combustion,    scenario. This can be explained by the smaller decrease as-
which makes a significant contribution to total PM emissions      sumed in this scenario for emissions from the industrial sector
Air Qual Atmos Health
Table 3 Mean, maximum, and
minimum percentage changes in % Change
mean grid-cell concentrations for
the COVID-19 lockdown period Metropolitan area # grid cells Pollutant Mean Maximum Minimum
for the COVID-19 emission sce- Montreal CMA 60 NO2 −31.2 −41.5 −22.1
nario relative to the BAU scenario PM2.5 −5.6 −18.5 2.6
for the set of grid cells in each
metropolitan area O3 2.4 11.3 −0.3
Toronto CMA 80 NO2 −32.2 −39.0 −24.3
PM2.5 −11.8 −19.6 −6.6
O3 3.0 18.1 −0.3
Calgary CMA 61 NO2 −33.7 −41.2 −20.2
PM2.5 −17.4 −22.9 −9.6
O3 3.0 17.3 0.3
Vancouver CMA 40 NO2 −30.6 −37.4 −20.3
PM2.5 −14.4 −22.2 −6.9
O3 5.0 21.4 0.6
(30%), which is the main source of primary PM emissions, Discussion
compared to the assumed 60% decrease in traffic emissions,
which is the dominant source of NOx emissions in urban areas Surface NO2, PM2.5, and O3 measurements for the four CMAs
(Table 2). As shown in Table 3, the maximum decrease in for the pre-lockdown and lockdown periods in 2020 are com-
PM2.5 concentration in the four cities for the COVID-19 sce- pared in Figs. 2 and 3 with 2010–2019 measurements for the
nario compared to the BAU scenario ranged from 18 to 22%. same periods. Some pronounced differences were evident for
The average decrease in PM2.5 ranged from 6% for Montreal, 2020; however, it was not clear to what extent COVID-19-
13% for Toronto, 15% for Vancouver, to 17% for Calgary. related emission changes contributed to these differences
Interestingly, there is an increase (2–4%) in mean PM2.5 con- compared to meteorological variations. Since the two
centrations for some Montreal grid cells (e.g., Saint-Jérôme), modeled emission scenarios discussed in the “Modeling re-
where residential wood burning is important. This increase in sults” section used the same 2020 meteorology and thus iso-
ambient concentration levels reflects the assumed 20% in- late the impacts of COVID-19-related emission changes, it is
crease in residential heating emissions for the COVID-19 sce- of interest to compare model predictions of AQ impacts from
nario, which in a few locations overwhelmed decreases in the two scenarios against the estimates from surface
primary PM2.5 emissions from other source sectors. measurements.
Contrary to the decrease in NO2 levels during the lock- Figure S7 is similar in form to Fig. 2, but it compares city-
down, mean O3 levels for the COVID-19 scenario were pre- wide-average time series of 2020 surface observations of
dicted to increase in urban areas and decrease slightly in sub- NO2, PM2.5, and O3 with model predictions from the two
urban regions (Fig. 7). A similar response was reported by scenarios for the pre-lockdown, transition, and lockdown pe-
Menut et al. (2020) for Europe. The maximum percentage riods for each of the four CMAs. The comparison of model
increases in O3 VMR, which ranged from 11 to 21%, are seen predictions from the BAU scenario with measurements for the
for locations where the maximum decrease in NO2 was pre- pre-lockdown period (i.e., up to 14 March) gives an indication
dicted (Fig. 5). The overall average impact of the lockdown on of pre-lockdown model skill in these four urban areas. Model
O3 VMR in all four cities is small, however, only 2 to 5% NO2 VMR predictions for the pre-lockdown period are gen-
(Table 3). These cold-season increases in mean O3 levels are erally good for Montreal, Toronto, and Vancouver but are
expected in urban areas (i.e., VOC-limited regions) where biased high for Calgary. This performance is consistent with
significant decreases in NOx emissions lead to a reduction in the NO2 scores for winter 2020 for both western and eastern
O3 titration by NO. However, there were a few grid cells in Canada shown in Table S2. Model PM2.5 concentration pre-
Montreal and Toronto near the CMA boundaries where mean dictions are very good for Toronto for the pre-lockdown peri-
O3 levels were predicted to decrease for the COVID-19 sce- od but are biased high for the other three cities; Table S2 lists
nario (Fig. 7). These decreases may be linked to reduced small overall biases for PM2.5 for winter 2020 when observa-
downwind O3 production in the urban plume and the tions from all PM2.5 measurement stations in western Canada
non-linear response of ozone to NOx emission reduction and in eastern Canada were considered (−0.6 and 0.3 μg m−3,
depending on the ratio of VOC/NO x (e.g., Sillman respectively). Lastly, model O3 predictions are generally good
1999; Sillman et al. 2003). for Toronto and Vancouver for the pre-lockdown period butAir Qual Atmos Health
are biased low for Montreal and Calgary. Table S2 has a emission scenarios have also been compared to NO2 vertical
negative bias for O3 in eastern Canada (−2.1 ppbv), consistent column density (VCD) observations made by the
with the pre-lockdown O 3 time series for Montreal and Tropospheric Ozone Monitoring Instrument (TROPOMI).
Toronto in Figure S7, and a small positive bias for western Figure 8 compares a time series of 15-day running mean ob-
Canada (0.3 ppbv), consistent with the pre-lockdown O3 time served TROPOMI daily NO 2 column density values in
series for Vancouver but not Calgary in Figure S7. Toronto and Montreal during the lockdown period with model
As expected from Figs. 5–7 and Table 3, the BAU time NO2 columns sampled at each TROPOMI pixel at the satellite
series for NO2 and PM2.5 are consistently higher than the overpass time and transformed with the satellite retrieval av-
corresponding COVID-19 time series for the four CMAs eraging kernel. More details about this comparison can be
while the BAU time series for O3 are consistently lower than found in Griffin et al. (2020). It is evident that the BAU model
the COVID-19 time series. Overall, the COVID-19 scenario run overestimates column NO2 for the entire lockdown period
results for NO2 show better agreement with the observations in both cities, whereas the COVID-19 scenario with reduced
than the BAU results for Montreal and Calgary; for PM2.5, the emission run shows much better agreement with the observed
same is true for Montreal, Toronto, and Vancouver, and for TROPOMI values for both cities. Griffin et al. (2020) estimat-
O3, it is true for all four cities. This suggests that the COVID- ed that lockdown measures reduced the average NO2 column
19 scenario emissions better represent actual emissions during over Toronto by about 40%, while Goldberg et al. (2020), in a
the lockdown period. closely related study, reported a 42% reduction in the average
Figure S8 is similar in form to Fig. 3, but it compares mean NO2 column over Toronto and a 30% reduction for Montreal.
diurnal time series of 2020 surface observations of NO2, These results are similar to the model-predicted reductions of
PM2.5, and O3 for the lockdown period with model predictions 32% and 31% in average surface NO2 in Table 3. As well,
from the two emission scenarios for each of the four CMAs. Figures S10 and S11 compare mean NO2 column fields ob-
Again, the COVID-19 scenario predictions for NO2 are in served by TROPOMI with the model-predicted mean NO2
better agreement with the observations than the BAU results column fields for the COVID emission scenario for the
for Montreal and Calgary; for PM2.5, the same is true for Montreal and Toronto regions for the latter part of the lock-
Montreal, Toronto, and Vancouver, and for O3, it is true for down period. The qualitative agreement of the spatial patterns
all four cities. from the satellite and the model is very good.
Table S3 compares mean hourly NO2, PM2.5, and O3 sur- Photochemistry is a complicating factor for interpreting
face concentrations for the lockdown period averaged over all NO2 and O3 lockdown responses from both surface measure-
measurement stations in each CMA with model-predicted ments and model predictions for the two emission scenarios.
values at the same locations for the two emission scenarios. For example, NO2 levels are consistently lower across each
Seventy-five percent of the COVID-19 scenario values were urban area for the COVID-19 vs. the BAU scenario, but grid-
closer to the measured values than the BAU scenario values. cell O3 differences range from a decrease of 0.3% to an in-
This table also presents the predicted average impact of the crease of 21% (Table 3). The spatial distributions of relative
lockdown on pollutant levels in each CMA at AQ measure- differences between the two emission scenarios display even
ment station locations. Surface concentrations for the COVID- more variation: relative differences of mean NO2 VMR are all
19 scenario were lower by 30–38% for NO2 and by 15–21% positive in Fig. 5, indicating higher NO2 levels for the BAU
for PM2.5, with the largest changes in Vancouver and Calgary, scenario, but relative differences of mean O3 levels are posi-
respectively. O3 levels were higher by 6–10%, with the largest tive within the CMA boundaries though largely negative in
changes in Calgary. Note that the predicted decreases for NO2 the surrounding areas (Fig. 7). We know that NO2 and O3 are
are considerably larger than the range of 6–17% suggested by tightly coupled through the photostationary state in the day-
the analysis of surface AQ measurements (Table 1). The same time and also at night via NO titration (e.g., Brown et al. 2006;
is true for PM2.5, for which the analysis of surface AQ mea- Clapp and Jenkin 2001). For this reason, we also looked at
surements suggested a decrease of 4% for Montreal but an odd oxygen (Ox), which we defined as O3+NO2 (neglecting
increase for the other three cities relative to previous years. several nocturnal species: see Brown et al. 2006). This quan-
These differences point to the confounding impact of meteo- tity varies less than either NO2 or O3 individually and is quasi-
rological patterns and conditions, which masked the effect of conserved for unchanging emissions (e.g., Lee et al. 2020). As
the lockdown measures based on a direct analysis of AQ shown in Figures S7d and S8d, a slight decrease in mean Ox
surface measurements. Goldberg et al. (2020) came to a sim- levels is seen for the COVID-19 scenario in all four cities,
ilar conclusion in an analysis of satellite NO2 column mea- indicating that the net impact of reduced NOx emissions dur-
surements over North America for spring 2020. ing the lockdown period is a decrease in Ox levels. Figure S9
Satellite observations were discussed in the “Introduction” presents the mean Ox fields for the two emission scenarios
section as another valuable source of air quality measure- plus their actual difference and relative difference fields. The
ments. Model predictions from the BAU and COVID-19 Ox concentration relative difference fields in Figure S9 areAir Qual Atmos Health Fig. 8 15-day running mean of NO2 vertical column density for the 22 March–2 May period over (a) Toronto-Mississauga and (b) Montreal comparing the TROPOMI observations (black), with the model BAU (blue) and COVID-19 lockdown scenario (red) values more like the NO2 relative difference fields in Fig. 5 than the takeoffs, is known with high certainty for each large airport O3 difference fields in Fig. 7 in that they are also consistently (Statistics Canada 2020). Traffic-activity data (Apple Inc, positive. One key difference, though, is that the largest Ox 2020) and traffic-count data from various municipalities also relative differences occur over the urban cores where we ex- support the estimates of overall emission reductions from traf- pect the largest changes in NOx and primary PM2.5 emissions fic, although there is greater uncertainty about disaggregated to occur. Consequently, the Ox concentration relative differ- activity levels by vehicle class and road type, particularly out- ence fields for the four CMAs are more similar to the PM2.5 side the cities. Changes in industrial and residential emissions relative difference fields (Fig. 6) than they are to the NO2 are more uncertain, and emissions from other source types, relative difference fields (Fig. 5). which are significant (Table 2), were simply assumed in this The comparisons of GEM-MACH model predictions for study not to change due to COVID-19 lockdown measures. the two emission scenarios with surface and satellite air qual- While the results presented here are promising, they are still ity measurements presented in Figs. 5–8 and S7–S8 and in preliminary and they cannot confirm that the assumed sector- Table S3 suggest that the COVID-19 emission scenario agrees specific emission reductions are correct. The development of a better overall with measurements for the lockdown period in more comprehensive and realistic lockdown emission scenar- Canada than the counterfactual BAU emission scenario. io, however, will have to wait for the development and release These results suggest in turn that the assumptions made re- of a Canadian APEI for the 2020 data year (expected some- garding sectoral emission changes for the COVID-19 scenar- time in 2022). io, including reductions in traffic emissions, may be reason- Another source of uncertainty is the treatment of the US able (see also Figures S10 and S11). There are, however, emissions, which were assumed to remain unchanged for the many uncertainties associated with the COVID-19 scenario COVID-19 scenario due to the challenge and complexity of emissions. The assumed reductions in aviation emissions representing the initial US response in spring 2020 to the may have the least uncertainty since the key activity associat- COVID-19 pandemic. Other studies, though, have shown im- ed with this sector, the number of daily aircraft landings and provements in air quality in many US cities during this period
You can also read