Spatiotemporal Anomaly Detection through Visual Analysis of Geolocated Twitter Messages
←
→
Page content transcription
If your browser does not render page correctly, please read the page content below
Spatiotemporal Anomaly Detection through Visual Analysis of Geolocated
                         Twitter Messages
               Dennis Thom∗             Harald Bosch†            Steffen Koch‡          Michael Wörner§            Thomas Ertl¶

                                                    Visualization and Interactive Systems Group
                                                                University of Stuttgart

Figure 1: Spatiotemporal anomalies derived from geolocated Twitter messages represented by term clouds on a map. Some of the visible
anomalies correspond to power outage events during hurricane Irene on August 27, 2011.

A BSTRACT                                                                   1   I NTRODUCTION
Analyzing message streams from social blogging services such as             Users of location-based social or microblogging services can be
Twitter is a challenging task because of the vast number of docu-           seen as ‘semantic sensors’ [6, 20] with the ability to report and de-
ments that are produced daily. At the same time, the availability           scribe observations and events in their region by sending short ge-
of geolocated, realtime, and manually created status updates are an         olocated messages. Therefore, the advent of Location Based Social
invaluable data source for situational awareness scenarios. In this         Networks (LBSN) has brought a valuable data source to analysts in
work we present an approach that allows for an interactive anal-            the field of situational awareness and crisis response. MacEachren
ysis of location-based microblog messages in realtime by means              et al. [16] conducted a qualitative survey amongst emergency man-
of scalable aggregation and geolocated text visualization. For this         agement professionals. The result showed that at least 39% of the
purpose, we use a novel cluster analysis approach and distinguish           survey participants already used microblogging tools to gather in-
between local event reports and global media reaction to detect spa-        formation from the public and at least 26% used it to monitor the
tiotemporal anomalies automatically. A workbench allows the scal-           activities of other emergency management personnel.
able visual examination and analysis of messages featuring per-                To improve the process of manually searching and interpreting
spective and semantic layers on a world map representation. Our             important messages, geovisual analytics [1] systems can be of great
novel techniques can be used by analysts to classify the presented          value to the emergency responders. Such systems can provide ag-
event candidates and examine them on a global scale.                        gregated overviews that summarize information about a situation
Index Terms: H.5.2 [Information Interfaces and Presentation]:               and support the interactive exploration of the data.
User Interfaces—GUI; H.3.3 [Information Storage and Retrieval]:                In analyzing social media data sources, major challenges are how
Information Search and Retrieval—Clustering                                 to discover spatiotemporal events and how to handle the sheer vol-
                                                                            ume of incoming data flooding the analysis system. Examples of
   ∗ e-mail: dennis.thom@vis.uni-stuttgart.de                               events, for which significant related social media usage has been
   † e-mail: harald.bosch@vis.uni-stuttgart.de                              noted, include river floods and wildfires [22], earthquakes and ty-
   ‡ e-mail: steffen.koch@vis.uni-stuttgart.de                              phoons [17, 20], hurricanes [8], technological disasters [23], infec-
   § e-mail: michael.woerner@vis.uni-stuttgart.de                           tious diseases, and shooting incidents [3, 18, 7]. During such situ-
   ¶ e-mail: thomas.ertl@vis.uni-stuttgart.de                               ations, there is often much global and randomly distributed chatter
                                                                            about the event, which is mostly based on public news media or
                                                                            propagated through the social network channels. However, much
                                                                            more valuable and recent information can be gained from people
                                                                            directly participating in or observing the event. In our work we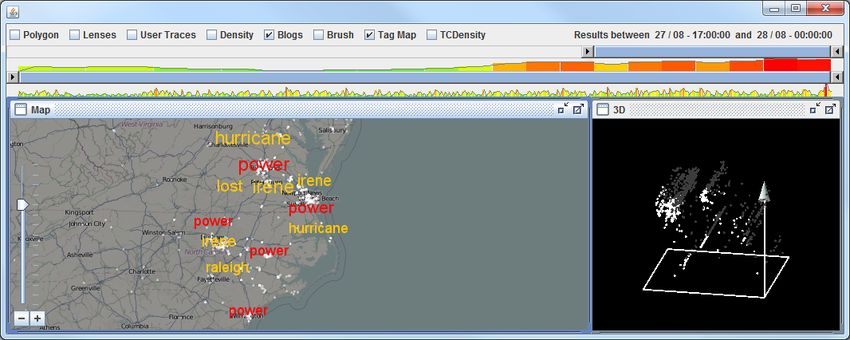
build on the assumption that messages from local witnesses of an          and purpose. Examples of such efforts can be seen on the Crisis
event can often be detected through their spatiotemporal density,         Mappers Net1 and in services such as those provided by Ushahidi2 .
similar term usage, and relative high count of contributing users. In        In the context of this paper, we concentrate on microblogging
the course of this paper we will therefore define the technical term      services that are not tailored to a specific goal. We use geolocated
‘anomaly’ to designate a kind of spatiotemporal dense topic clus-         messages from Twitter as our primary data source. However, our
ters where a single term is used in all involved messages. Using this     approach is not restricted to data from this specific service. Sakaki
strategy, anomalies corresponding to actual events can already be         et al. [20] also exploit Twitter messages (tweets) for detecting earth-
distinguished from general message clusters originating from high         quakes and the trajectory of typhoons. Their approach treats Twit-
population densities. The task of the analyst within our strategy         ter users as social sensors. The users’ messages are classified into
will be to separate anomalies resulting from minor events or ran-         earthquake related and irrelevant using a support vector machine,
dom message groups with identical term usage from such anomalies          taking into account features such as keywords and message word
corresponding to actual important events including crises, catastro-      count. They were able to show that specific events can be detected
phes, and other significant incidents.                                    from Twitter messages with high probability if task-tailored mod-
   To handle the amount of data that necessitates scalable analy-         els are employed. In their approach, static visualization is used to
sis methods and excludes many clustering techniques for anomaly           present the results but not as a part of a visual analytics loop. We
detection, we developed an enhanced Lloyd clustering scheme that          follow the idea of detecting a broader spectrum of events by using
is suitable for analyzing microblog posts from a continuous data          a detection method that makes much fewer assumptions on the un-
stream. The clustering algorithm has been optimized for scalability       derlying model. We directly exploit messages from Twitter users
by employing incremental adaption to incoming data. At the same           considering them as semantic sensors.
time, it aggregates aging data, while phasing it out of the current          With Senseplace2, MacEachren et al. [16] presented a proto-
clustering state in order to reduce the active, visualized content to a   type system that allows for querying Twitter and depicting aggre-
manageable amount. The details of this approach can be found in           gated results on a map. The places are determined by employing
Section 4.                                                                named entity recognition and reverse geocoding, resolving strings
   In this work, we address both of the challenges and build a visual     to geolocations. Our approach, in contrast, works directly on the
analytics method that is suitable for the detection, visualization,       whole stream of geolocated tweets and performs a scalable, geospa-
and analysis of spatiotemporal anomalies based on the clustering          tial analysis by employing an algorithm in the form of a streaming
approach, thereby allowing for scalable aggregation and user inter-       operator. The study by MacEachren et al. [16] also indicated that
action. The two main components of the system are an analysis             the tag cloud view which was suggested as one means for aggregat-
workbench and a monitoring module incorporating the spatiotem-            ing microblog contents was considered inadequate by some of the
poral anomaly detection mechanism. Using the workbench, ana-              specialists. We do not see this result as a contradiction to our ap-
lysts can review findings, explore the message sets, and capture im-      proach that uses ‘tag clouds’ in a broader sense, since the sketched
portant events (cf. Section 3). The detection mechanism constantly        tag cloud of their mockup display, unlike our visualization, is sepa-
clusters the incoming data stream on a per term basis and stores spa-     rated from the map view in a layout similar to ‘Wordle’. White and
tiotemporal anomalies along with their time and location (cf. Sec-        Roth presented an application for crime investigation with Twitter-
tion 4). Since the clustering employed in the detector is designed        Hitter [27], suggesting geospatial analysis of Twitter messages as
as a best effort mechanism – being particularly suited for a high         a suitable means for addressing different tasks in criminal investi-
performance real time analysis of streaming social media data – the       gation. Cartoblography by Field and O’Brien [5] discusses the cre-
full power of its results unfolds only if it is integrated with an in-    ation of map mashups for representing Twitter content in different
teractive visualization method. Using this method, a broad amount         layouts.
of anomalies can be displayed on a map view using spatiotempo-
ral term clouds aggregating the textual content of messages, which        2.2 Visualizing Information with Tag Clouds
will help analysts decide which anomalies may be important events         In the context of this document we use the notion ‘tag cloud’ to
and therefore qualify for further investigation. Furthermore, inter-      refer to a specific type of visual representation. Even if tag clouds
active query mechanisms can be used to filter or widen the base set       are commonly used in web pages today, their meaning, their role
of messages, and flexible and adaptive layout mechanisms allow an         in interaction, and their layout differs. They were used to display
adjustment of semantic resolution of visualized terms to the zoom         the most frequent tags assigned by users to digital documents as
level selected in the map-view (cf. Section 4.2).                         part of the creation of folksonomies and are now also used to sum-
                                                                          marize text collections, e.g., by representing the most frequent or
2     BACKGROUND                                                          important words, and almost any other kind of (meta)data [26]. Fur-
Impact and influence of social media as well as their range of cov-       thermore, tag clouds are used as navigation help, e.g., to display a
erage has seen unpreceded growth during recent years. The more            list of electronic documents containing a selected tag, or to facil-
information is brought into these media by an increasing number of        itate retrieval tasks, such as sending/creating/modifying queries to
users, the better they cover and reflect real-world aspects, merely       document repositories as part of a search task [10]. Many layouts
by producing digital traces of them. Often, this helps to communi-        exist and provide different benefits for different tasks and situations
cate events that are interesting for a given task quicker than other      as, for some of them, described by Lohmann et al. [14]. Multiple
channels such as classical news media.                                    new variants of generating and employing tag clouds have been pro-
                                                                          posed in the InfoVis community during recent years. Wordle[25],
2.1    Geovisualization for Social Media Analysis                         for example, has become very popular through its great aesthet-
                                                                          ics. Also the way that tag clouds could be exploited during ana-
The rise of microblogging services and the particular success of          lytic tasks beyond providing an abstraction of electronic document
Twitter has consequently seen some interest in different research         collections and allowing for ‘topic’-based document navigation has
communities trying to exploit these fast new channels, e.g., for          seen some new developments lately. Here, tag clouds are used,
building and improving decision making systems for crisis man-            as part of other visualizations, for depicting temporal change and
agement [24]. However, events or microblog messages, from which           trends [4, 11, 21]. If used for showing spatial or spatiotemporal
events can be derived, are buried under loads of messages that may
be irrelevant for an analytic task. Some approaches therefore aim at         1 http://crisismappers.net/

setting up dedicated social media services with very specific scope          2 http://www.ushahidi.com/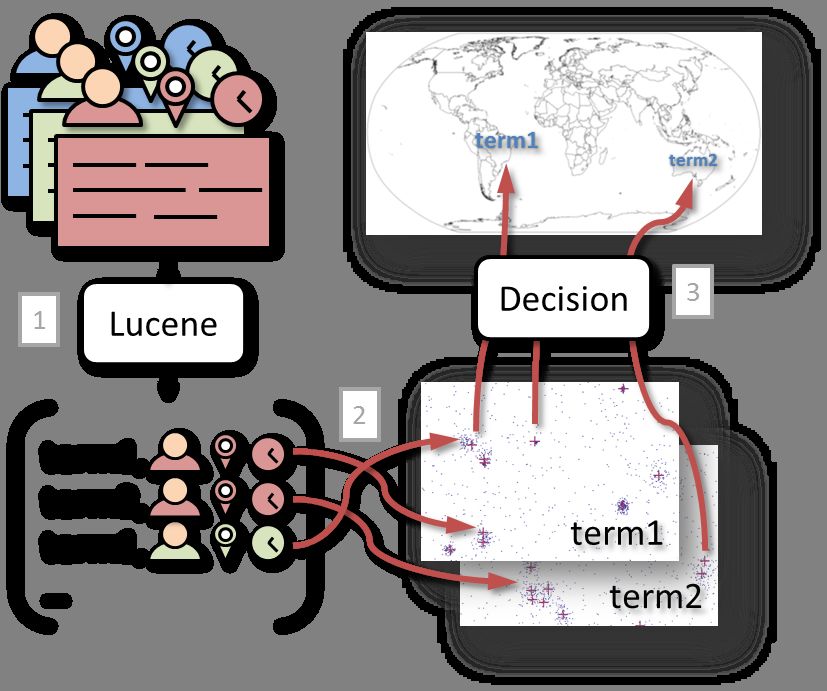
correlations of digital artifacts in a geographic context, they are also          mentation to access the Streaming API service of Twitter. The re-
referred to as tag maps [9].                                                      ceived information is then stored locally in three different ways. We
   Wood et al. [28] present an approach similar to ours regarding                 maintain a database with separate tables for user IDs and messages
the visual representation of results and the idea of applying spa-                to allow for on demand access to message details during the anal-
tial clustering. However, their approach differs in some important                ysis. Additionally the message text is fed into an Apache Lucene
aspects: They do not exploit the temporal dimension for cluster-                  analyzer6 , which tokenizes the stream into single terms. For now,
ing, which leaves it to the user to explore tag frequency by inter-               this supports only English and we discard foreign messages. From
active specification of time intervals, while we employ a tag-cloud-              the resulting set of terms, we remove web links and frequent stop
like visualization to represent potentially interesting events in time            words and build a full text search index to allow for fast retrieval of
and space automatically. Furthermore, Wood et al. use a straight-                 message ids for any given term. Once tokenized and cleaned, the
forward ‘binning’ approach, that allows for hierarchical clustering,              term set is passed on to the spatiotemporal anomaly detector along
but comes at the cost of having a fixed, potentially suboptimal grid              with the timestamp, user ID, and location of the message. The de-
structure, that might represent spatial clusters inadequately at cer-             tector creates a list of spatiotemporal term usage anomalies for dis-
tain levels of detail. Additionally, our visual approach as well as the           covering potentially relevant events. See Section 4 for a detailed
employed analytics methods aim at combining realtime and post                     description of the spatiotemporal anomaly detector.
analysis of events that can be derived from geolocated Twitter mi-
croblog messages. We also put special emphasis on visual scal-                    3.2 Analysis Workbench
ability and scalability of automatic event detection. Trendsmap3                  The ScatterBlogs analysis system originated from our VAST Chal-
is another spatiotemporal approach for depicting clusters in geolo-               lenge submission [2] for the task of analyzing a large set of syn-
cated Twitter messages in realtime, but for a fixed predefined time               thetic geolocated microblog messages. Its purpose is to enable
span covering one week. Exploration and analysis of ‘historical’                  analysts to work on quantitative as well as qualitative findings by
data is not possible. To the best of our knowledge there also exists              not only automatically identifying anomalies, but also summariz-
no detailed description on the clustering mechanism as it is used                 ing and labeling event candidates as well as providing interaction
in the Trendsmap tool. The work presented here is quite different                 mechanisms to examine them.
from the original idea of tag clouds and has common characteristics                  In order to employ ScatterBlogs in future crisis management or
with other usages, such as labeling geographical points of interest               post event analysis scenarios, we upgraded the approach to operate
[15]. However, since users generally refer to our visualization as                on real life data, with a particular focus on Twitter messages. To
tag cloud, we will stick to the term.                                             achieve this, scalability is a key aspect for most of the components,
                                                                                  since we now face a constant high volume data stream, tremen-
3     T HE S CATTERBLOGS A NALYSIS S YSTEM                                        dously larger than the synthetic data set for which ScatterBlogs was
                                                                                  initially developed. We therefore defined different layers of data ex-
In this section we describe the collection of Twitter data as well
                                                                                  amination for an ongoing analysis session to address the most chal-
as the basics of our visual analytics tool ScatterBlogs. It can be
                                                                                  lenging scalability issues. The base layer is the complete dataset of
divided into two main components. The first component monitors
                                                                                  collected messages, which can only be handled in aggregated form
the incoming Twitter messages and transforms them into a scalable
                                                                                  in the interactive front end. Nevertheless, the base layer is always
storage format, that supports interactive analysis. The second one
                                                                                  available to be included into the current analysis context, which rep-
is an analysis workbench for the exploration of current and past
                                                                                  resents the examination layer, and is populated by filtering the base
anomalies that were either detected by the monitor or were defined
                                                                                  set using full text search or spatiotemporal filtering. The analysis
ad-hoc during the analysis using interactive tools, geographic areas,
                                                                                  context is transfered into fast storage on demand, preferable to in-
and terms.
                                                                                  memory representations, allowing for an interactive access to the
3.1    Monitoring the Twitter Streaming API                                       full information of individual messages or message groups.
                                                                                     The most important views of the workbench are an interactive
Twitter is one of the most popular microblogging services that of-                world map, a hierarchical time slider incorporating message density
fers publicly available and geolocated messages of broad coverage.                histograms, and a selection management component (for the latter
When users post on Twitter, they are aware that anyone on the In-                 see [10]). All views work on the same data model and show the
ternet can access the posting, which means privacy concerns are                   current analysis context and focus in a synchronized fashion.
not a major issue. Most importantly, however, Twitter offers an                      The interactive map is used as a display for several data overlays.
API to subscribe to a filtered stream of realtime status messages.                Here, the individual locations of messages, a heatmap of message
In addition to author, time stamp, and message text, these contain                densities, and the anomaly indicator presented in this paper can be
additional data fields such as other users mentioned, places, links,              enabled and disabled. All overlays adjust to the currently focused
and potentially the location of origin, either as geo coordinates or              time, which enables analysts to browse over a time range while
as a place name.                                                                  watching the change of overlays on the map. The map is also the
   According to Twitter, 230 million messages from 100 million                    basis of interactive tools that allow the selection of messages as well
active users are processed each day4 . Of these, we use only mes-                 as inspecting the details of messages through what we call ‘content
sages that come with exact geo coordinates for our analysis: While                lens’. The lens samples the most frequent words of the covered
place names allow for some sort of localization, they are much less               messages and displays them in a small tag cloud.This constitutes
precise than geo coordinates and might give the false impression                  a very powerful tool for gaining additional insight from an other-
of an amassment of anomalies near a city center. There is no way                  wise anonymous message cluster or for browsing over a distributed
to locate messages that include neither geo coordinates nor a place               collection of messages to see if they feature common words.
name except for a natural language analysis of the message text,
which would introduce considerable uncertainty into the localiza-                 4 A NOMALY D ETECTION AND V ISUALIZATION
tion. This restriction leaves a constant stream of about 1–2 million              In order to select an initial analysis context, as well as to widen an
messages per day. Our prototype uses the free Twitter4J5 imple-                   existing context, a technique is needed enabling users to explore the
                                                                                  base layer of all recorded messages in an aggregated form. The al-
    3 http://trendsmap.com/
    4 http://business.twitter.com/basics/what-is-twitter/
                                                                                  gorithm described in this paper transforms the stream of geolocated
                                                            (on 24th Sep. 2011)
    5 http://twitter4j.org                                                           6 http://lucene.apache.org
ing the clustering in realtime and allowing a permanent analysis
during an indefinite timespan would be infeasible using common
clustering approaches. Firstly, because they are usually not fast
enough to do the computation and secondly, because they do not
scale to datasets of arbitrary size. With our algorithm we are able to
discard old clusters at some point in time and store the location of
their representing centroids permanently. This ensures scalability
to continuous stream processing of almost arbitrary duration.
To achieve this goal, our clustering algorithm basically performs
one global and continuous relaxation step of the regular Lloyd
scheme, that is, the clusters are adapted as new messages arrive but
globally the relaxation is not done repeatedly until reaching an equi-
librium. Instead of using a predefined fixed number of centroids,
a splitting scheme is employed to detect new emerging anomalies
and also accommodate noise, i.e. term artifacts that do not belong
to any actual anomaly. These noise clusters are later discarded after
examining the final cluster properties. It is important to note that
the algorithm processes the messages on a ‘per-term’ basis. That is,
for each and every term encountered in the messages, a new cluster-
ing branch is initialized, which concerns only messages containing
this specific term.
Figure 2: Three activities to generate an overview of anomalies: The basic algorithm works as follows: We start with a list of
1) Message terms are extracted and transformed to term artifacts. empty sets of clusters. As soon as a message is evaluated and its
2) Microblog Quantization of term artifacts generates spatiotemporal terms extracted, a cluster for every term is generated and a term ar-
clusters. 3) Clusters selected by the decision strategy are considered tifact is assigned to each of them. The centroids of these clusters
as anomalies and represented as term map overlay for exploration. are initialized with the spatiotemporal location of the message. As
further messages arrive, we first check for every term whether clus-
ters for the term already exist and if so, we assign the term artifact
messages into a map of terms potentially corresponding to real-life to the nearest cluster. We then adjust the centroid of this cluster
events, which is interactively explorable in both time and space. by calculating the new mean location of the covered term artifacts.
The algorithm can be separated into three major activities depicted Secondly, for every term of the message not already covered by any
in Figure 2. In ScatterBlogs, two activities are carried out within cluster, we generate a new branch of clusters and initialize them
the Twitter monitoring component while the third one takes place with the corresponding term artifact. Finally, we check for all mod-
in the analysis workbench. ified clusters whether the average squared distortion of their ele-
The first activity is the extraction of terms from messages as they ments is below some predefined threshold k. If it is not, we split the
arrive through the Twitter input stream described in Section 3.1. cluster into two new clusters and distribute its elements between
Lucene tools are utilized for tokenizing, stopword removal and han- them using the k-means (in this case 2-means) cluster algorithm.
dling of special characters. In most cases 5 to 10 terms are extracted The following pseudocode for the procedure handleMsg(Tm )
per message. Because the remainder of our algorithm works only illustrates the basic algorithm while omitting the storing and noise
on individual terms and not their co-occurrence within a message, cancellation as well as some implementation specific details, which
the output of this activity is a stream of what we call term artifacts. will both be addressed in Section 4.1.1. In regards to the program
Each artifact consists of the term itself, the location and time where variables, let Tm be a set of term artifacts that have been extracted
it was stated, and the user ID. from a particular message m. A term artifact t is represented as a
The second activity continuously performs a cluster analysis of record consisting of a term t.term, a user ID t.user and a location
the extracted term artifacts as they arrive. We developed an en- in a unified spatiotemporal domain t.loc ∈ R3 . Furthermore let
hanced Lloyd scheme [13], which we adapted to detect spatiotem- C(t) be a hashmap that uses terms as keys and maps them to sets
poral clusters of term usage. This component aggregates aging data of clusters. Each cluster c in these sets is a record consisting of its
iteratively, thereby restricting the active amount of data to a size centroid location c.loc ∈ R3 and a set of associated term artifacts
that fits into working memory. The details of this Microblog Quan- c.reg called the cluster region.
tization can be found in Section 4.1. Its result is a set of term usage
anomalies. They consist of the term itself, the mean spatiotemporal The procedure is performed for each new message m arriv-
location of the detected cluster (centroid) and a temporal histogram ing from the input stream after the term artifacts have been
of the clusters elements. extracted
Based on this data, the third activity generates a graphical repre- 1 p r o c e d u r e handleMsg ( Tm )
sentation of the anomalies by placing labels on the map of the Scat- 2 Cluster : c, c1 , c2 ← new Cluster()
terBlogs workbench. The underlying visualization method tackles 3 begin
the problem of showing large numbers of the detected anomalies on 4 f o r t ∈ Tm l o o p
an interactive map in a way that the most important anomalies at a 5 i f C(t.term) = 0/ t h e n
given zoom-level are visible. This component will be discussed in 6 c.reg ← {t}
Section 4.2. 7 c.loc ← t.loc
8 C(t.term) ← {c}
4.1 Microblog Quantization 9 else
The Microblog Quantization has some similarities to the Linde- 10 c ← arg minĉ∈C(t.term) (kĉ.loc − t.lock2 )
Buzo-Gray algorithm outlined in [12] as well as the X-Means clus- 11 c.reg ← c.reg ∪ {t}
tering algorithm [19] but in contrast to these algorithms, it facili- 12 c.loc ← (1/ |c.reg|) ∗ ∑tˆ∈c.reg tˆ.loc
tates the scalable and continuous processing of input data. Perform- 13 i f D(c) > k t h e n14 c1 , c2 ← split(c) If the significance of a cluster is very low or if it fails to meet
15 C(t.term) ← (C(t.term) \ {c}) ∪ {c1 , c2 } other decision criteria, the cluster likely represents noise and we
16 end i f will discard it once it gets old. In contrast, clusters receiving a high
17 end i f significance rating and meeting all decision criteria are permanently
18 end l o o p stored and removed from the active computation.
19 end We implement the management of active clusters as well as the
discarding of old clusters using a very large FIFO queue of clusters.
The distortion D(c) of clusters is evaluated using a squared error
The cluster sets C(t) of the algorithm in Section 4.1 in fact store just
distortion measure
s pointers to these representations. Every time a cluster is updated
∑tˆ∈c.reg (c.loc − tˆ.loc)2 using the handleMsg(Tm ) method, the corresponding centroid is
D(c) = removed from its position in the queue and inserted again at the
|c.reg| ∗ 3 beginning. By simply using a very long queue one can expect that
only stale clusters arrive at the end of the queue and once a centroid
and the procedure split(c) simply distributes the term artifacts of c
reaches the end, it is evaluated and then either persistently stored or
between the new clusters c1 and c2 and adapts their centroids using
discarded.
a regular k-means algorithm as described in [13]. The threshold k
defines the maximum expected spatial and temporal extent of a nor- In addition to the centroid position, represented term and sig-
mal distribution in the unified spatiotemporal domain correspond- nificance score of each anomaly cluster, we found it useful to also
ing to what is considered an actual anomaly7 . include additional information that can be used to enhance the vi-
Once an anomaly emerges, established clusters should be at- sualization. So for each centroid we use the associated messages
tracted by the high density of keyword mentions and the closest c.reg to generate a temporal histogram of messages that is divided
cluster will absorb the new term artifacts with its centroid moving into equal bin intervals (e.g. hours). To achieve scalability in terms
towards the center of the anomaly. Eventually, the distortion crite- of storage space, we can then discard the regions c.reg of the clus-
rion is likely to be met and the attracted cluster is split into one clus- ters before transferring them to persistent storage.
ter covering the old data and one covering the new anomaly. Using To evaluate the performance of this implementation we con-
this strategy, we also accommodate and later detect term artifacts ducted several tests using a batch analysis of one month of Twitter
not belonging to any actual anomaly. Because this kind of ‘noise’ data. The results showed that on a regular personal computer (Intel
will also lead to clusters being split, this strategy prevents clusters Core i7 820QM@1.73GHz and 8 GB RAM) the handleMsg(Tm )
from moving too far away from the actual anomaly. The strategy method took in average 0.14 milliseconds to process a single mes-
how the noise clusters are detected and discarded is described in the sage while the overall processing of a message including term ar-
following subsection. tifact extraction took about 0.29 milliseconds. Therefore, with the
underlying test setup the system could process roughly about 290M
4.1.1 Aging of Centroids and Noise Cancellation messages per day.
Eventually, a cluster centroid will be so far away from the present
time that absorbing a new term artifact will inevitably lead to the 4.2 Scalable Representation by Term Clouds
cluster being split. When this happens, the resulting cluster cov- The output of the clustering component is a spatiotemporal map of
ering the old data turns ‘stale’, meaning that it has no chance of anomalies potentially representing actual events. Based on this rep-
receiving new term artifacts. resentation, an overview is generated that represents the anomalies
At this point, we can chose a strategy to decide whether the clus- as interactive term clouds on the world map of ScatterBlogs. The
ter represents an actual anomaly and store it in the database and label placement algorithm uses the significance and the temporal
letting it appear in the visualization or if it can just be discarded as message histogram computed during cluster analysis to decide on
noise. We therefore employ a formal definition of ‘anomaly’ com- the importance of individual anomalies. Based on these parameters
prised of features that can often be observed in real word events. a weight is computed that determines the label size logarithmically.
In this regard, the most important observation is that a cluster will Computing the weights and placing the labels comprises six steps:
most likely correspond to an actual event if it has both a relatively (i) Filter the anomalies spatiotemporally according to the current
low average distortion - i.e. densely packed term elements - and at viewport and selected time span, (ii) Calculate an initial weight for
the same time represents a relatively high number of elements. This each anomaly whose temporal histogram overlaps with the bound-
feature can be expressed with a significance function ary of the selected time span, (iii) Determine the desired location
and size of the labels based on the computed weights and the cen-
kc.loc − tˆ.lock2 troid locations of the anomalies, (iv) Aggregate the weights of over-
signi f icance(c) = ∑ 1 − min(1, )
tˆ∈c.reg
k lapping identical terms and remove the ones with low weights, (v)
Sort the labels by weight to guarantee that significant anomalies are
Here k has the same value as the threshold we check against D(c). placed first, (vi) Incrementally place all labels and try to find the
This means that the significance criterion is sensitive to normal dis- best available position for each.
tributions above a certain shape and diameter and ignores artifacts
that are outside of radius k. 4.2.1 Basic Term Cloud Layout
Another feature used in the decision strategy considers the num- In step (i) of the algorithm a filter is applied to reduce the set of rel-
ber of distinct users that have been contributing to a cluster and evant anomalies to those located within the chosen time frame and
relates it to the total number of contributions. This enables us to ex- visible map area. This reduction can also be used to display less
clude clusters which originated from a single user posting the same significant anomalies that would otherwise be dominated by more
terms repeatedly, which happens often with automated agents pro- important ones when selecting larger temporal or spatial frames.
viding weather informations or reporting songs currently played by However, by considering only the centroids lying precisely within
a radio station. the chosen time range, we would ignore anomalies extending into
7 For the sake of simplicity we use a single threshold regarding space this range from the outside. To avoid this, the temporal histogram
and time. Therefore the dates and geo coordinates of the original messages calculated during clustering is used to estimate the amount of mes-
have to be mapped to the unified spatiotemporal domain in a way that the sages lying in the intersection. Step (ii) then generates an initial
maximum extent of anomalies to be detected is covered by the threshold. weight for each anomaly by summing the portions of the histogramcovered by the intersection, leading to a value between 0 and 1, and ing the selected time frame can be properly reflected. The combina-
then multiplying this value with the significance of the anomaly. tion of both effects – multiple anomalies per event and aggregated
Based on the weights we have to assign a label, size, and posi- labels – works as a semantic zoom which aggregates anomalies in
tion to each anomaly while addressing the problem of overlapping zoomed out views and splits them to their individual locations when
labels. Especially in zoomed out map views, there is a high prob- zooming in.
ability that large numbers of cluster centroids are located in close
proximity, e.g. when different anomalies are co-located at the same 5 C ASE S TUDY
city or when people reporting a single event use several different Our approach is especially useful when complemented with means
terms, leading to the creation of separate clusters for each term. for interactive inspection and analysis of event candidates. The dis-
According to [14], circular tag cloud layouts are suitable to medi- cussed cases are solely based on actual geolocated Twitter messages
ate terms in descending order of importance, with the most impor- recorded during a time period from 08/08/2011 to 09/08/2011. In
tant label located at the center and the less important ones towards the following, we describe the exploration of three different events.
the boundary. In order to avoid occlusion and still convey more The first is the earthquake that hit the US east coast region in August
information than by only showing the most important anomaly, it 2011. The second scenario comprises the third and following days
seems reasonable to rearrange the less important terms using a nar- of the London riots. The last example focuses on hurricane Irene,
row circular term cloud centered above the target location. This is which differs from the previous two, in that the public was already
achieved in steps (iii), (v), and (vi). For the sake of simplicity, step informed about it through media and US governmental institutions.
(iv) is described in the next subsection. Due to the prominence of these events, they can be verified through
In step (iii) the initial label size is determined by normalizing the media cross-checks. Such post-event analysis is, of course, rela-
computed weight using a logarithmic function along with minimum tively straightforward. However, we can illustrate at which point in
and maximum size boundaries. After their font size and spatial time an analyst could have detected these incidents using online vi-
extent are fixed, we sort the labels according to their weight in step sual analysis, which would have been of interest at least in the first
(v). two cases. Adding monitoring facilities, as suggested in the future
Finally, in step (vi), we use a layout mechanism described in work section, could speed up event-recognition time for analysts
[15], which allows a high-performance labeling of dense point by guiding their attention through predefined classes of events. All
clouds while at the same time maximizing the utilization of avail- three events are interesting from an analyst’s perspective, who aims
able space: Starting with the most important anomaly, we try to at gaining situational awareness. Furthermore, they are interesting
place each label on its desired location. If the required space is al- since they produce very distinct signals but are still easily detectable
ready occupied by a previously placed – and thus more important – with our method.
label, we try to find a nearby vacant area by moving outwards in a
circular fashion with a predefined stepping angle and outwards ve- 5.1 Earthquake hitting US east coast
locity until a free spot is found or a maximum number of iterations
is reached. In the latter case, the label will not be placed, because On 23 August 2011 the US east coast was struck by an earthquake
the label position would lie inappropriately far from the location of with a magnitude of 5.88 . This event was very present in Twitter
the anomaly. messages, since earthquakes of this intensity are exceptional in the
region. Accordingly, our map view represents this event through
4.2.2 Label Aggregation and Semantic Zoom very prominent labels on different zoom levels. The inspection of
Twitter messages on 23 October 2011, either by clicking on one of
Since the clustering algorithm is designed as a best effort method, the earthquake labels or by searching for it using the search box,
an overfitting of data is likely to occur, at least for anomalies of a provides an overview of the places where people were tweeting
certain magnitude. The reason is that the maximum magnitude of about it. It is even possible to get a rough idea of the epicenter when
the Gaussian distributions we are looking for using threshold k is browsing through the beginning of the event using our time-slider
unlikely to match the one of each and every event. This would both tool (c.f. Figure 3) at a minute-by-minute resolution. Additionally,
have positive and negative effects. When zooming into the map the time-slider gives an impression of the number of posted tweets
view, the spatial extent of anomalies can be better represented by over time, showing the typical distribution of a sudden, unforesee-
multiple identical labels covering the affected area instead of one able event with a steep slope in the beginning and a long tail repre-
big label in the middle – e.g. when examining riots taking place in senting messages echoing the event. Looking at a time9 period of 6
several parts of a city we will see several ‘riot’ labels exactly cover- minutes, it can be seen that the signal gets particularly prominent in
ing the affected regions. But at the same time this leads to a prob- areas where the tweet density is higher than in others. We do not see
lem in zoomed out views. If a very important event is distributed this as a problem, since it is very likely that people tweeting about
over space and time, it is likely to be covered by many centroids it in the first minutes have experienced the tremor themselves and
having a relatively low significance value. Therefore, each of them are good sources for obtaining on-site information to gain better
could easily be dominated by a less important anomaly possessing situational awareness. By clicking on any of the earthquake labels,
a single centroid of relatively high significance score. all Twitter messages, including multiple messages from the same
We counteract this effect by adding an aggregation step to our person that contain the key term ‘earthquake’, posted during the set
layout algorithm. Step (iv) of the algorithm looks for overlapping time period are depicted as small red dots in the map view. To take
labels and allows identical labels to supplement each other by accu- a closer look at these messages, analysts can now use an interac-
mulating the initial weights, removing the less important one. This tive lens to browse over these messages while getting the gist of
way, spatially distributed anomalies have a good chance of consti- them through the display of the most frequent terms under the lens.
tuting a stronger label properly representing the importance of a Reading some of the messages gives the impression that people are
possible event. Of course, this principle not only applies to the spa- upset or shocked, but there seem to be no severe injuries or damage.
tial domain but also to any temporal overlap within a selected time Adding the search term ‘damage’ to the query and looking for mes-
frame. If there happens to be one long-lasting continuous event in sages containing the term ‘building’ makes this even more obvious
the same location, it is likely to be covered by multiple clusters dis- (c.f. Figure 3).
tributed over time. But since the corresponding labels would also
overlap each other in the spatial domain, they would be aggregated 8 http://earthquake.usgs.gov/earthquakes/eqinthenews/2011/se082311a/
inside the time frame; thus the importance of the anomaly concern- 9 All time and date references are given in UTC.Figure 3: From left to right: The first image shows the map overview showing the earthquake on 23 August 2011. Additionally, the temporal
distribution of the term ‘earthquake’ is depicted in our time-slider tool at a minute-by-minute resolution. The second view depicts all earthquake
tags shown within the first minute after the event is mentioned in Twitter. It gives a rough impression of the shock’s epicenter, which was actually
located 63 miles northwest of Richmond. The third image depicts the usage of our lens-tool while searching for reported damage at buildings.
5.2 London riots use our lens tool for a more detailed inspection. This shows that the
In this second use case, we take a look at the situation in London term ‘outage’ seems to be frequent, too, strengthening the assump-
during the riots10 on 8 August 2011. The overview shows that a tion that the power supply might have broken down in some areas.
considerable number of tweets refer to riots which is apparent from Several parts of the city northwest of Richmond’s city center seem
the very prominent label ‘londonriots’. Additionally, the names of to be affected by power outages between August 27th 7 pm to 28th
some London districts, such as Hackney, Peckham, and Clapham, 9 pm, which can be detected by browsing through the filtered mes-
appear very salient on this day. Again, we drill down by zoom- sages using the time slider. Determining when power was restored
ing into the region of London, by selecting the label ‘riots’ to pick is much more difficult, because far fewer users talk about it. The
our term of interest, and by restricting the time-slider to a range of general assessment of the situation, however, seems to be correct
high message frequency during the evening hours. During zoom- and can be confirmed with information published by the regional
ing, previously combined labels such as ‘riot’ are split as described power supplier12 .
and now depict hot spots where the term is mentioned frequently.
It is obvious that one of these hot spots indeed lies in the Hackney 6 D ISCUSSION AND C ONCLUSION
area. Selecting some of the messages, all sent between 5.30 pm and In this paper we presented a system that extracts anomalies from ge-
6.30 pm, with the lens indicates that the situation was escalating. olocated Twitter messages and visualizes them using term clouds on
Police forces seem present at the scene, but the area appears to be an interactive map. The particular strength of our approach lies in
an unsafe place at this time: the scalable way of detecting clusters incrementally, which accom-
5.32 pm: Great I,m stuck in the middle of the riots in hackney.. modates the dynamic stream of about 1–2M geolocated microblog
5.37 pm: Road looks to be all fucked up with people and police messages per day. The visualization of anomalies is adjusted to
at bethnal green. #London #riots. the detection mechanism in a way that scales with the number and
6.07 pm: Just leaving #bethnalgreen it’s mad here. Deffo STAY diversity of extracted anomalies.
OUT of the area. #riots #London [...] We are aware that usually there is no need to detect natural haz-
6.27 pm: Fuck riots in Bethnal green seen fire cabt get home ards like earthquakes and exceptional weather phenomena, because
Similar procedures can be applied to other regions of London, there are a variety of institutions using specialized detection equip-
where labels indicate riots and looting, in order to assess the sit- ment and forecast models for this purpose. However, we see two
uation there. In the described case, it is quite helpful to have the benefits from the analysis of microblogging messages in addition
district names as indicators for where to look for hot spots. Ac- to these secure and reliable sources of information. By analyz-
cordingly, we consider keeping such location labels in general but ing events using Twitter, naturally all events affecting people who
intend to integrate an option to suppress big city labels. are tweeting are integrated within the same approach. The second,
more important aspect in case of potentially disastrous events is the
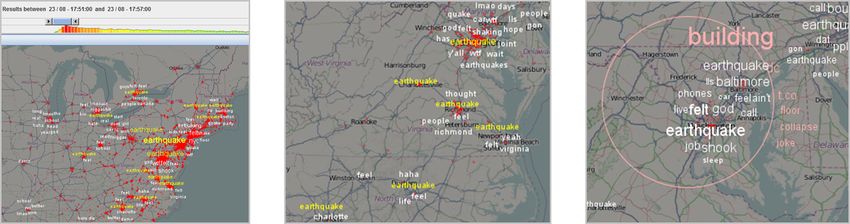
5.3 Hurricane Irene possibility to obtain a general impression of how severe the situ-
Hurricane Irene hit the US east coast in the morning of 27 August ation is for the people on site. In order to assess the situation, it
201111 . In preparation for the storm, some coastal areas were evac- is important to see where microbloggers are talking about the inci-
uated before it reached the mainland. However, it was unclear how dent, which in turn can be regarded as a form of event detection,
it would affect populated regions in terms of wind speed and rain- making up the motivation for ‘detecting’ events. We consider the
fall. The analysis is carried out analogous to the other cases. When involvement of human analysts mandatory to reflect and rate the in-
browsing the time span of interest, it can be seen that several re- formation transported by microblogging, since user statements can
gions are labeled with the term ‘power’. Since the term ‘power’ has be biased regarding over- or understating situations.
ambiguous meanings, it would be interesting to find out if people Automatic methods, such as our anomaly detection mechanism,
are referring to power outages and if so, whether these are rather always pose the risk of losing important information, e.g, ignoring
local or regional impacts of the storm. We take a closer look at small spatiotemporal events or overfitting large events. In order to
Richmond, Virgina having several ‘power’ labels around it. After address this issue, we use different strategies. We set the maximum
restricting the set of messages by clicking on one of the labels, we extent of anomalies for our detection mechanism to about the size
of a city district and a time period of half a day. This is clearly too
10 http://en.wikipedia.org/wiki/2011 England riots
11 http://en.wikipedia.org/wiki/Hurricane Irene %282011%29 12 http://www.dom.com/storm-center/dominion-electric-outage-map.jspsmall for large events and may be already too large for small ones. information retrieval, MIR ’06, pages 89–98, New York, NY, USA,
Hence to address overfitting, we choose a method for visualizing 2006. ACM.
labels that aggregates the displayed information when zoomed out. [10] S. Koch, H. Bosch, M. Giereth, and T. Ertl. Iterative integration of vi-
Because our clustering is term-based, it is very likely that small sual insights during scalable patent search and analysis. Visualization
events covering terms of generally moderate spatiotemporal dis- and Computer Graphics, IEEE Transactions on, 17(5):557 –569, may
tribution are captured by a cluster. Instead of setting an explicit 2011.
threshold for the number of term occurrences in such a case, the [11] B. Lee, N. Riche, A. Karlson, and S. Carpendale. Sparkclouds: Vi-
significance function implements a tradeoff between number and sualizing trends in tag clouds. Visualization and Computer Graphics,
density thereby boosting small events with high message density. IEEE Transactions on, 16(6):1182 –1189, nov.-dec. 2010.
[12] Y. Linde, A. Buzo, and R. Gray. An algorithm for vector quantizer
This results in the recognition of local hot spots, as has been de-
design. Communications, IEEE Transactions on, 28(1):84–95, 1980.
scribed in the analysis of the riots in London, but also enables us to [13] S. Lloyd. Least squares quantization in pcm. Information Theory,
discard noise resulting from broadly scattered messages. IEEE Transactions on, 28(2):129–137, 1982.
Normalizing term distributions to population densities is not a [14] S. Lohmann, J. Ziegler, and L. Tetzlaff. Comparison of tag cloud lay-
feasible option here, since it does not correlate well to the distribu- outs: Task-related performance and visual exploration. In T. Gross,
tion of tweets and the terms within them. Exploiting general term J. Gulliksen, P. Kotz, L. Oestreicher, P. Palanque, R. Prates, and
density in Twitter messages based on the evaluation of recorded M. Winckler, editors, Human-Computer Interaction INTERACT
data sets might be a solution that could overcome the discrepancy 2009, volume 5726 of Lecture Notes in Computer Science, pages 392–
of population density and Twitter usage. However, it is a very dif- 404. Springer Berlin / Heidelberg, 2009.
ficult task to achieve this taking into account the quick change and [15] M. Luboschik, H. Schumann, and H. Cords. Particle-based labeling:
development of Twitter usage worldwide along with seasonal devi- Fast point-feature labeling without obscuring other visual features.
ations. Moreover, this would require the exclusion of terms related IEEE Trans. Vis. Comput. Graph., 14(6):1237–1244, 2008.
to major events in order to reasonably compute a background noise [16] A. MacEachren, A. Jaiswal, A. C. Robinson, S. Pezanowski, A. Save-
level (e.g., if there have been a lot of severe earthquake events as lyev, P. Mitra, X. Zhang, and J. Blanford. Senseplace2: Geotwitter an-
has been the case in 2011), which in turn would be used for de- alytics support for situational awareness. Providence, RI, 2011. IEEE
tecting these events in the first place. Nevertheless, future work Conference on Visual Analytics Science and Technology.
will encompass building a general model for spatiotemporal term [17] M. Mendoza, B. Poblete, and C. Castillo. Twitter Under Crisis: Can
distribution and its influence on our detection approach regarding we trust what we RT? In Proceedings of the First Workshop on Social
Media Analytics, pages 71–79. ACM, 2010.
accuracy.
[18] L. Palen, S. Vieweg, S. Liu, and A. Hughes. Crisis in a networked
ACKNOWLEDGEMENTS world: features of computer-mediated communication in the april 16,
2007, virginia tech event. Social Science Computer Review, 2009.
This work was partially funded by the the German Federal Min- [19] D. Pelleg and A. Moore. X-means: Extending k-means with efficient
istry for Education and Research (BMBF), the German Science estimation of the number of clusters. In ICML ’00 Proceedings of the
Foundation (DFG), and the European Commission as part of the Seventeenth International Conference on Machine Learning, 2000.
VASA project, the SPP 1335 and the FP7-project PESCaDO (FP7- [20] T. Sakaki, M. Okazaki, and Y. Matsuo. Earthquake shakes twitter
248594). We would like to thank the reviewers for their valuable users: real-time event detection by social sensors. In Proceedings of
suggestions and comments, which helped to improve the presenta- the 19th international conference on world wide web, pages 851–860.
tion of this work. ACM, 2010.
[21] L. Shi, F. Wei, S. Liu, L. Tan, X. Lian, and M. Zhou. Understanding
R EFERENCES text corpora with multiple facets. In Visual Analytics Science and
[1] G. Andrienko, N. Andrienko, D. Keim, A. M. MacEachren, and Technology (VAST), 2010 IEEE Symposium on, pages 99 –106, oct.
S. Wrobel. Challenging problems of geospatial visual analytics. Jour- 2010.
nal of Visual Languages & Computing, 22(4):251 – 256, 2011. [22] K. Starbird and L. Palen. Pass it on?: Retweeting in mass emergency.
[2] H. Bosch, D. Thom, M. Wörner, S. Koch, E. Püttmann, D. Jäckle, and In Proceedings of the 7th International ISCRAM Conference, Seattle,
T. Ertl. Scatterblogs: Geo-spatial document analysis. In Visual An- WA, 2010.
alytics Science and Technology, 2011. VAST 2011. IEEE Conference [23] J. Sutton. Twittering tennessee: Distributed networks and collabo-
on, 2011. ration following a technological disaster. In Proceedings of the 7th
[3] C. Chew and G. Eysenbach. Pandemics in the age of Twitter: content International ISCRAM Conference–Seattle, volume 1, 2010.
analysis of Tweets during the 2009 H1N1 outbreak. PLoS One, 5(11), [24] B. Tomaszewski, A. Robinson, C. Weaver, M. Stryker, and
2010. A. MacEachren. Geovisual analytics and crisis management. In In
[4] C. Collins, F. Viegas, and M. Wattenberg. Parallel tag clouds to ex- Proc. 4th International Information Systems for Crisis Response and
plore and analyze faceted text corpora. In Visual Analytics Science Management (ISCRAM) Conference, Delft, the Netherlands, 2007.
and Technology, 2009. VAST 2009. IEEE Symposium on, pages 91 – [25] F. Viegas, M. Wattenberg, and J. Feinberg. Participatory visualization
98, oct. 2009. with wordle. Visualization and Computer Graphics, IEEE Transac-
[5] K. Field and J. O’Brien. Cartoblography: Experiments in using and tions on, 15(6):1137 –1144, nov.-dec. 2009.
organising the spatial context of micro-blogging. Transactions in GIS, [26] F. B. Viégas and M. Wattenberg. Timelines: Tag clouds and the case
14:5–23, 2010. for vernacular visualization. interactions, 15:49–52, July 2008.
[6] M. Goodchild. Citizens as sensors: the world of volunteered geogra- [27] J. J. D. White and R. E. Roth. Twitterhitter: Geovisual analytics for
phy. GeoJournal, 69(4):211–221, 2007. harvesting insight from volunteered geographic information. Zurich,
[7] T. Heverin and L. Zach. Microblogging for crisis communication: Ex- Switzerland, 14-17th September, 2010 2010. GIScience.
amination of twitter use in response to a 2009 violent crisis in seattle- [28] J. Wood, J. Dykes, A. Slingsby, and K. Clarke. Interactive visual ex-
tacoma, washington area. In Proceedings of the 7th International IS- ploration of a large spatio-temporal dataset: reflections on a geovisu-
CRAM Conference–Seattle, 2010. alization mashup. IEEE Transactions on Visualization and Computer
[8] A. Hughes and L. Palen. Twitter adoption and use in mass convergence Graphics, pages 1176–1183, 2007.
and emergency events. International Journal of Emergency Manage-
ment, 6(3):248–260, 2009.
[9] A. Jaffe, M. Naaman, T. Tassa, and M. Davis. Generating summaries
and visualization for large collections of geo-referenced photographs.
In Proceedings of the 8th ACM international workshop on MultimediaYou can also read