Activity of the Eta-Aquariid and Orionid meteor showers
←
→
Page content transcription
If your browser does not render page correctly, please read the page content below
Astronomy & Astrophysics manuscript no. Egal2020b                                                                                  ©ESO 2020
                                               June 16, 2020

                                                             Activity of the Eta-Aquariid and Orionid meteor showers
                                                                     A. Egal1, 2, 3,? , P. G. Brown1, 2 , J. Rendtel4 , M. Campbell-Brown1, 2 , and P. Wiegert1, 2

                                                      1
                                                          Department of Physics and Astronomy, The University of Western Ontario, London, Ontario N6A 3K7, Canada
                                                      2
                                                          Institute for Earth and Space Exploration (IESX), The University of Western Ontario, London, Ontario N6A 3K7, Canada
                                                      3
                                                          IMCCE, Observatoire de Paris, PSL Research University, CNRS, Sorbonne Universités, UPMC Univ. Paris 06, Univ. Lille, France
                                                      4
                                                          Leibniz-Institut f. Astrophysik Potsdam, An der Sternwarte 16, 14482 Potsdam, Germany, and International Meteor Organization,
                                                          Eschenweg 16, 14476 Potsdam, Germany
                                                     Received XYZ; accepted XYZ
arXiv:2006.08576v1 [astro-ph.EP] 15 Jun 2020

                                                                                                                 ABSTRACT

                                                     Aims. We present a multi-instrumental, multidecadal analysis of the activity of the Eta-Aquariid and Orionid meteor showers for the
                                                     purpose of constraining models of 1P/Halley’s meteoroid streams.
                                                     Methods. The interannual variability of the showers’ peak activity and period of duration is investigated through the compilation of
                                                     published visual and radar observations prior to 1985 and more recent measurements reported in the International Meteor Organization
                                                     (IMO) Visual Meteor DataBase, by the IMO Video Meteor Network and by the Canadian Meteor Orbit Radar (CMOR). These
                                                     techniques probe the range of meteoroid masses from submilligrams to grams. The η-Aquariids and Orionids activity duration, shape,
                                                     maximum zenithal hourly rates (ZHR) values, and the solar longitude of annual peaks since 1985 are analyzed. When available,
                                                     annual activity profiles recorded by each detection network were measured and are compared.
                                                     Results. Observations from the three detection methods show generally good agreement in the showers’ shape, activity levels, and
                                                     annual intensity variations. Both showers display several activity peaks of variable location and strength with time. The η-Aquariids
                                                     are usually two to three times stronger than the Orionids, but the two showers display occasional outbursts with peaks two to four
                                                     times their usual activity level. CMOR observations since 2002 seem to support the existence of an ∼12 year cycle in Orionids activity
                                                     variations; however, additional and longer term radar and optical observations of the shower are required to confirm such periodicity.
                                                     Key words. meteors, meteoroids – comets: individual: 1P/Halley

                                               1. Introduction                                                           periods of enhanced activity (Rendtel 2007; Sato and Watanabe
                                                                                                                         2007, 2014; Sekhar and Asher 2014).
                                               Comet 1P/Halley is known to produce two annual meteor show-                   The Orionids and η-Aquariids are of particular interest be-
                                               ers, the η-Aquariids in early May and the Orionids in late Oc-            cause of their connection to comet 1P/Halley. Meteor observa-
                                               tober. These two related showers are often collectively termed            tions can be used to constrain the nature of the meteoroid trails
                                               the Halleyids. Both showers exhibit a total duration of about 30°         that are ejected by the comet (meteoroids size, density variations
                                               in solar longitude (L ) and a complex fine structure character-           along the stream, etc.) and characterize its past activity. Con-
                                               ized by several subpeaks of variable location and intensity. The          straining meteoroid stream models using meteor observations
                                               average activity levels of the Orionids and the η-Aquariids are           could therefore provide insights into 1P/Halley’s past orbital
                                               similar. The activity of the showers is frequently characterized          evolution (Sekhar and Asher 2014; Kinsman and Asher 2017),
                                               by the zenithal hourly rate (ZHR), which represents the number            which is mostly unknown prior to 1000 BCE.
                                               of meteors an observer would observe per hour under standard                  The two showers are also of concern from a spacecraft safety
                                               reference conditions.                                                     perspective. The Orionids and especially the η-Aquariids are
                                                   The maximum activity of the Orionids usually varies be-               among the more significant impact hazards out of all the ma-
                                               tween 15 and 30 meteors per hour near 209° of solar longitude             jor showers throughout the year. This is a consequence of sev-
                                               (L , ecliptic J2000), while the η-Aquariids maximum rates are             eral characteristics of the showers including their long duration,
                                               two to three times higher, near 45.5° solar longitude. Both show-         comparatively high flux, the occurrence of occasional outbursts
                                               ers are frequently cited as being rich in small (masses ≈ 10−8 kg)        and their high velocity (∼66 km/s). In spite of their significance,
                                               particles (Jenniskens 2006; Campbell-Brown and Brown 2015;                few predictions of future Halleyid activity are currently available
                                               Schult et al. 2018).                                                      in the literature. Moreover, no comprehensive numerical models
                                                   Despite moderate average annual activity, the two showers             of the streams have been published which utilize the full suite
                                               are known to produce occasional outbursts. Recent examples in-            of modern observational data, in part because no compilation of
                                               clude the Orionids apparitions of 2006 and 2007, when the peak            such data have become available. This is a major goal of the cur-
                                               ZHR exceeded 60 (Rendtel 2007; Arlt et al. 2008), and the 2013            rent work.
                                               η-Aquariids outburst that reached an activity level of 135 mete-              Most of Halley’s meteoroid stream models were developed
                                               ors per hour (Cooper 2013). Mean motion resonances of Halley’s            in the 1980s, when the expected return of the comet in 1986 re-
                                               meteoroids with Jupiter were identified as responsible for these          newed the interest in the study of these showers. Several charac-
                                                                                                                         teristics of the Halleyids (similar duration and average intensity,
                                                ?
                                                    e-mail: aegal@uwo.ca                                                 complex structure) were successfully explained by the long-term
                                                                                                                                                                    Article number, page 1 of 25
A&A proofs: manuscript no. Egal2020b

evolution of meteoroids under the influence of planetary pertur-       1P/Halley (Yeomans and Kiang 1981; Hughes 1987b). The first
bations (mainly induced by Jupiter, see McIntosh and Hajduk            identified observations of 1P/Halley date back to 240 BCE in
1983 and McIntosh and Jones 1988).                                     Chinese records (Kiang 1972) and 164 BCE in Babylonian
    However, almost no modeling effort had been made to ex-            records (Stephenson et al. 1985). With some adjustments to the
plain the annual activity variations of the Orionids and η-            comet’s eccentricity around AD 837, Yeomans and Kiang (1981)
Aquariids noticed by Hajduk (1970) and Hajduk (1973), until            determined a reliable set of orbits for 1P/Halley until 1404 BCE.
the observation of the recent Orionids outbursts. By investigating     Because of a close encounter with Earth in 1404 BCE and the
the role of resonances highlighted in previous works, numerical        lack of older observational constraints on the comet’s motion,
simulations of Sekhar and Asher (2014) successfully reproduced         the orbital elements of 1P/Halley have not been precisely deter-
the apparition dates of recent and ancient Orionids outbursts, and     mined prior to this epoch (Yeomans and Kiang 1981).
predicted a future outburst of the shower in 2070. Unfortunately,          In March 1986, an international fleet of spacecraft called the
no similar analysis of the η-Aquariids has been conducted by           "Halley Armada" approached the comet to examine its nucleus.
those authors, in part because of the small number of reliable         The Armada was composed of five main probes, Giotto (Euro-
observations of this shower compared to the Orionids (Sekhar           pean Space Agency), Vega 1 and Vega 2 (Soviet Union) and Sui-
and Asher 2014).                                                       sei and Sakigake (Japan), supported by additional measurements
    In this work, we investigate the long-term activity of the Ori-    of the international ISEE-3 (ICE) spacecraft and NASA’s Pio-
onids and η-Aquariids as measured by visual, video and radar           neer 7 and Pioneer 12 probes. On the ground, observations of the
observations. Published and original observations of both show-        comet and its associated meteoroid streams were collected and
ers are compiled and analyzed to examine the structure, the du-        archived by the International Halley Watch (IHW) organization,
ration, and the annual variation of their activity profiles. Follow-   an international agency created to coordinate comet Halley’s ob-
ing the work of Campbell-Brown and Brown (2015) which fo-              servations. Reviews of the extensive research conducted during
cused solely on the η-Aquariids up to 2014, we provide recent          the comet 1986 apparition can be found for example in Whip-
measurements of the η-Aquariids and a complete set of Orionids         ple (1987) and Edberg et al. (1988). The next apparition of the
recorded by the Canadian Meteor Orbit Radar (CMOR) between             comet is expected in 2061.
2002 and 2019, which constitutes the longest consistent obser-
vational set of the Halleyids to date. Results from CMOR are
compared to the visual observations contained in the IMO Vi-           2.2. Halley’s meteoroid streams
sual Meteor Data Base (VMDB) and measurements of the Video             1P/Halley’s meteoroid streams are responsible for two observed
Meteor Network (VMN).                                                  meteor showers on Earth, the Orionids (cf. Section 3) and the
    The specific goal of this paper is to measure characteristics of   η-Aquariids (cf. Section 4). The η-Aquariids occur at the de-
the Halleyids including their long-term average ZHR-equivalent         scending node of the comet, while the Orionids are connected
profile, activity shapes of annual apparitions, maximum activity       to 1P/Halley’s ascending node.
levels each year, and the location of the peak using an integrated          The evolution of 1P/Halley’s nodes as a function of time is
multi-instrument analysis of the showers. In particular we wish        presented in Figure 1. The motion of the comet was integrated
to compare results across the different detection systems to better    from 1404 BCE to AD 2050 using a RADAU15 (Everhart 1985)
identify biases.                                                       integrator with an external time step of 1 day. Orbital solutions
    The structure of this paper is as follows: sections 2, 3 and       of Yeomans and Kiang (1981) were used as initial conditions
4 review the discovery circumstances, observational history and        for the comet apparitions before 1910, while the JPL J863/77
general characteristics of comet 1P/Halley and previously pub-         solution was used for the 1986 perihelion passage1 . Results are
lished analyses of the Orionids and the η-Aquariids meteor             presented in the barycentric frame (ecliptic J2000).
showers. Sections 5 and 6 present the methodology for selec-                As shown in Figure 1, the orbital precession of 1P/Halley
tion, processing and analysis of the showers’ visual, video. and       leads to considerable change in the location of its nodes since
radar observations since 2002. The conclusion of our analysis is       1404 BCE. In 1404 BCE, the comet’s descending node was lo-
presented in Section 7. To aid future modeling efforts, individ-       cated well outside the Earth’s orbit, while the ascending node
ual activity profiles per year including specific numerical mea-       was much closer to Earth’s orbit. Currently, the comet crosses
surements for peak activity and location found in this work are        the ecliptic plane at an ascending node far outside the Earth’s or-
available in Appendices A, B, C and D.                                 bit (1.8 AU), and descends below the ecliptic at about 0.85 AU.
                                                                       The current high ascending nodal distance of 1P/Halley from
                                                                       Earth’s orbit explains why the link between the Orionids shower
2. History of 1P/Halley and early observations of the
                                                                       and 1P/Halley was difficult to establish (cf. Section 3).
   Halleyids                                                                Explaining the similar activity levels of the η-Aquariids and
2.1. 1P/Halley                                                         Orionids (Lovell 1954; Hajduk 1970, 1973) with such different
                                                                       nodal distances has challenged researchers for many decades.
1P/Halley is a famous comet, evolving in a retrograde orbit with       If the showers were produced by a stream centered on the cur-
a period of about 76 years. The comet was named after Ed-              rent orbit of the comet, the η-Aquariids would be considerably
mond Halley, who recognized in 1705 the comets of August-              stronger than the Orionids and their durations significantly dif-
September 1682, October 1607 and August 1531 as being the              ferent.
same object. Halley estimated the orbital period of the comet and           Perhaps the most successful model of the Halleyids is that
anticipated a return in 1758. His eponymous comet was recov-           of the theoretical shell model of McIntosh and Hajduk (1983). It
ered in December 1758, a few years after Halley’s death, becom-        was later confirmed by McIntosh and Jones (1988)’s numerical
ing the first comet whose return close to the Sun was successfully     simulations and offers an explanation for many characteristics of
predicted (Hughes 1987b).                                              the showers. The model is based on the idea that particles ejected
    Since Edmond Halley’s discovery, several ancient obser-
                                                                       1
vations of comets have been linked to older apparitions of                 https://ssd.jpl.nasa.gov/sbdb.cgi

Article number, page 2 of 25
A. Egal et al.: Activity of the Eta-Aquariid and Orionid meteor showers

                                                                         Fig. 2. Time variations of the Minimum Orbit Intersection Distance
                                                                         (MOID) of comet 1P/Halley and Earth close to the comet’s ascending
                                                                         and descending node.

                                                                         and AD 401, 443, 466, 530, 839, 905, 927, 934 (Zhuang 1977;
Fig. 1. Ecliptic location of 1P/Halley’s ascending and descending node   Imoto and Hasegawa 1958). The comparison of the numerical
as a function of time, in the barycentric frame (ecliptic J2000). The    integration of the comet Halley meteoroid stream with Maya
Earth’s orbit is represented in blue.                                    hieroglyphic inscriptions seems to indicate that this civilization
                                                                         also kept track of observed η-Aquariids outbursts (Kinsman and
                                                                         Asher 2017). In that work, the existence of a strong outburst in
from the comet evolve at different rates, with some remaining            AD 461, observed but not classified as an η-Aquariid in Zhuang
on orbits where the comet was a long time ago and others pre-            (1977) or Imoto and Hasegawa (1958), was also discussed.
cessing more rapidly than the comet (and eventually reaching its             The Halleyids intensity and year-to-year variations cannot
future positions). Each meteoroid stream would therefore evolve          be rigorously estimated from these ancient observations. Indeed,
into a ribbon-like structure of uniform thickness, producing two         missing records for specific years and missing information about
meteor showers of similar duration and intensity at the Earth.           the observing conditions limits the interpretation of the showers
The superposition of several ribbon-shaped streams, separated            annual activity. However, the records are able to highlight the ex-
through small perturbation relative to the comet orbit, could            istence of years with particularly strong activity (e.g., "hundreds
be responsible for the observed filamentary structure of the η-          of meteors scattered in all directions" in AD 585, or "hundreds of
Aquariids and Orionids showers (cf. Sections 3 and 4).                   large and small meteors" in AD 1439, see Imoto and Hasegawa
    The time evolution of the Minimum Orbit Intersection Dis-            1958), with maximum dates falling a few days earlier than the
tance (MOID) between Earth and the comet around each node is             current shower peaks (Zhuang 1977).
provided in Figure 2. The Earth currently approaches the comet
orbit at a minimum distance of 0.154 AU at the time of the Orion-
ids and 0.065 AU at the time of the η-Aquariids. 1P/Halley’s de-         3. Orionids
scending node reached its closest distance to Earth’s orbit around
AD 500, and at about 800 BCE for its ascending node. The prox-           3.1. History
imity of the comet around AD 500 might explain the existence             Despite earlier observations of Orionids meteors, the discovery
of strong η-Aquariids outbursts reported in ancient Chinese ob-          of the meteor shower is independently attributed to E. C. Her-
servations.                                                              rick and Quetelet in 1839 (Lindblad and Porubcan 1999; Kronk
                                                                         2014). The first precise Orionid radiant was determined by A.
2.3. Ancient Chinese, Japanese, and Korean records                       Herschel in 1864 and 1865 (Denning 1899; Herschel 1865),
                                                                         and shortly after Falb (1868) proposed a connection between
The long-term (millennium timescale) variation of the strength           1P/Halley, the η-Aquariid, and the Orionid meteor showers. The
of the showers is recorded in ancient visual records, though             similarity of the Orionids with the η-Aquariids was noticed again
the biases and incompleteness of these sources imply that some           by Olivier in 1911.
strong returns may easily have been missed. The analysis of an-              However, despite the already established connection be-
cient records of meteor showers reveals that the Orionids and            tween the η-Aquariids and 1P/Halley, the link between the Ori-
the η-Aquariids were active a millennium or more ago (Ahn                onids and the comet was not immediately accepted because of
2003, 2004). Orionids outbursts were identified in Chinese and           the large orbital distance of 1P/Halley at the time of the shower.
Japanese observations in AD 585, 930, 1436, 1439, 1465, and              The relation between the Orionids and its parent comet was
1623 (Imoto and Hasegawa 1958). Possible strong displays in              finally accepted after decades of controversy (Obrubov 1993;
AD 288 and 1651 are also mentioned in Zhuang (1977).                     Zhuang 1977; Rendtel 2008).
    The first Korean record of an η-Aquariid outburst could be               The complexity of the Orionids activity structure was noticed
as old as 687 BCE (Ahn 2004). Chinese observations allowed               at the beginning of the 20th century. Considerable but variable
the identification of several η-Aquariids outbursts in 74 BCE,           rates have been reported in early analyses of visual observations
                                                                                                                Article number, page 3 of 25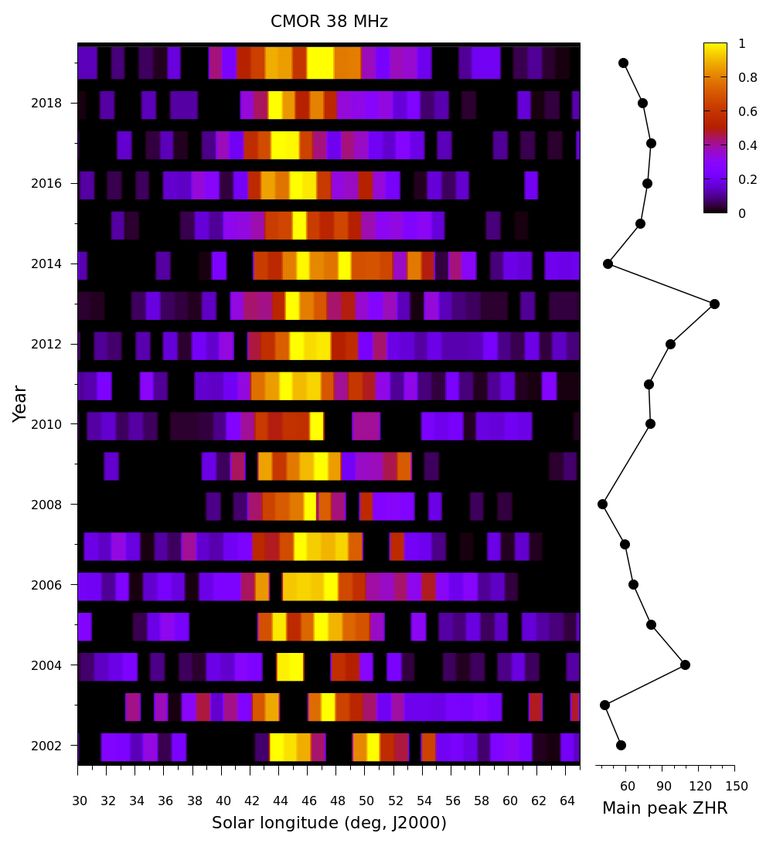
A&A proofs: manuscript no. Egal2020b

(e.g., Prentice 1931, 1933, 1936). In 1918, Denning emphasized        subpeaks of activity lasted for about 24h (Koschack and Rogge-
that the Orionids radiant appeared to be stationary during the en-    mans 1991).
tire duration of the shower. The stationary radiant hypothesis was         From the analysis of 60 photographic Orionids contained in
at the center of a great controversy for many years, until proof      the IAU Meteor Data Center, Lindblad and Porubcan (1999) de-
of a drift was presented by (among others) Olivier (e.g., Olivier     rived a slightly asymmetric activity profile of the shower, with
1923, 1925) and Prentice (e.g., Prentice 1939). The existence of      highest rates attained between L =208.7° and 210.7° and an es-
multiple subradiants within the stream, investigated by several       timated maximum around L =209.6°. Svoreň and Kaňuchová
observers around the same period, was not confirmed by further        (2017)’s recent analysis of a very similar data set identified
observations (Lindblad and Porubcan 1999).                            two maxima of photographic Orionid activity at L =208.5° and
     The first photographic Orionid was captured in 1922 at           L =210.5°, in good agreement with Stohl and Porubcan (1981)
the Harvard Observatory (King 1923 in Lindblad and Porub-             and Porubcan and Zvolankova (1984)’s results. A central dip was
can 1999), but only few double station observations of the            noticed close to the main peak of activity, as previously noted by
shower were obtained during the program (Lindblad and Porub-          McIntosh and Hajduk (1983) and Lindblad and Porubcan (1999)
can 1999). In the following decades, the shower was the subject       for the Orionids, and by Hajduk (1980) for the η-Aquariids.
of several visual (Stohl and Porubcan 1981), telescopic (Zno-              Radar observations carried out by the CMOR radar between
jil 1968; Porubčan 1973), and radar studies (e.g., Hajduk 1982;      2002 and 2008 highlighted an activity lasting from October 11 to
Jones 1983; Cevolani and Hajduk 1985).                                November 9 (from 198° to 227°, cf. Brown et al. 2010), slightly
     Most of the Orionid data gathered over the period 1900-1967      longer than the duration reported by Porubcan et al. (1991). The
was collected and analyzed by Hajduk (1970). This work com-           main maximum was identified around 208° of solar longitude.
piled and processed visual and photographic observations of the       The maximum Orionid rate recorded by the Middle Atmosphere
shower, as well as an extensive set of radar data from Canada         ALOMAR Radar System (MAARSY) between 2013 and 2015
and Czechoslovakia. Despite the heterogeneity of the observa-         was identified as being around L =210.5° (Schult et al. 2018).
tional methods and instruments used, Hajduk (1970) managed                 The long-term variability of the Orionids and the η-Aquariids
to estimate the peak meteor rate and solar longitude of the max-      was investigated by Dubietis (2003). Processing the standardized
imum activity over this time period. The derived visual meteor        observations of the IMO Visual Meteor Data Base (VMDB), the
rates typically ranged between 10 and 30 meteors per hour, with       author derived the population index and an average peak ZHR
increased rates during some individual returns.                       for every apparition of the Orionids between 1984 and 2001. No
                                                                      reproducible trend in the population index variations was iden-
     The shower showed several maxima between L =201° and
                                                                      tified. As in previous works, the peak ZHR was found to vary
L =216°, varying in location from apparition to apparition
                                                                      between 10 to 35 meteors per hour. Based on the annual varia-
(sometimes by more than 5°). No regular periodicity in the max-
                                                                      tion of the ZHR within these bounds, a 12 year periodicity was
ima locations or the annual activity was identified. The tempo-
                                                                      proposed (cf. Section 6.3.2).
ral variability of the shower peaks of activity, reflecting density
                                                                           A similar analysis was conducted by Rendtel (2008), who
variations along and across the stream, were interpreted as a
                                                                      processed visual observations dating back to 1944 along with the
sign of the strong filamentary nature of the stream. The exis-
                                                                      data contained in the VMDB since the 1980s. As expected, the
tence of density variations within the stream was identified in
                                                                      peak ZHR and the population index of the shower were found to
subsequent radar campaigns at Dushanbe and Ondrejov (e.g.,
                                                                      vary over time. An average maximum ZHR of the shower was
Babadzhanov et al. 1977, 1979; Hajduk and Cevolani 1981;
                                                                      estimated to be about 20 to 25 between L =207° and L =211°.
Jones 1983; Hajduk et al. 1984; Cevolani and Hajduk 1985; Ha-
                                                                           Examples of visual activity profiles of the Orionids between
jduk et al. 1987), as well in CMOR measurements between 2008
                                                                      1985 and 2001 are presented in Appendix A. The results of the
and 2010 (Blaauw et al. 2011).
                                                                      aforementioned studies were plotted along with the ZHR profiles
                                                                      available in the IMO VMDB website2 . The complex structure of
3.2. Activity                                                         the stream is not always discernible in each individual profile,
                                                                      when the low number of observations restricts the time resolu-
3.2.1. Average activity profile                                       tion of the activity profiles (Dubietis 2003). The variability in
                                                                      the number of peaks, in their intensity, and solar longitude from
Between 1944 and 1950, visual observations carried out at the         year to year is nonetheless clearly noticeable.
Skalnaté Pleso Observatory provided the first reliable activity            However, the quality and quantity of visual data in any given
profile of the shower. From this set of data, Stohl and Porubcan      year are heavily influenced by the lunar phase around the Orionid
(1981) and Porubcan and Zvolankova (1984) identified a main           maximum. These type of data are further complicated by the of-
peak of activity at L =208.5° (J2000) and a secondary maxima          ten poor weather at the end of October in the Northern Hemi-
at L =210.5°. At the occasion of the International Halley Watch,      sphere, where the bulk of Orionid observations are performed.
multiple visual observations were carried out by amateurs spread      As a result, interannual variability of the shower is very difficult
all over the world. However, because of the heterogeneity of the      to conclusively prove based on visual observations alone.
resulting data and the little information provided about the ob-
servers, the analysis of the observations collected was particu-
larly complex (Porubcan et al. 1991).                                 3.2.2. Orionid outbursts
     The average activity profile of the Orionids around the 1986     The Orionids are known to have produced strong outbursts over
apparition of the comet is presented in Appendix A. The shower        the past century, reaching two to four times the usual intensity of
displayed normal levels of activity, with a maximum ZHR of            the shower (Lovell 1954; Hajduk 1970). The analysis of visual
about 20 meteors per hour and a Full Half Width Maximum               and radio measurements of the shower revealed increased me-
(FWHM) of 7 to 8 days. Several subpeaks were detected dur-            teor rates around 1934-1936, 1946-1948, 1966-1968, and poten-
ing the period of activity (extending roughly between L =198°
and L =220°). The analysis of the 1990 Orionids revealed that         2
                                                                          https://www.imo.net/members/imo_live_shower

Article number, page 4 of 25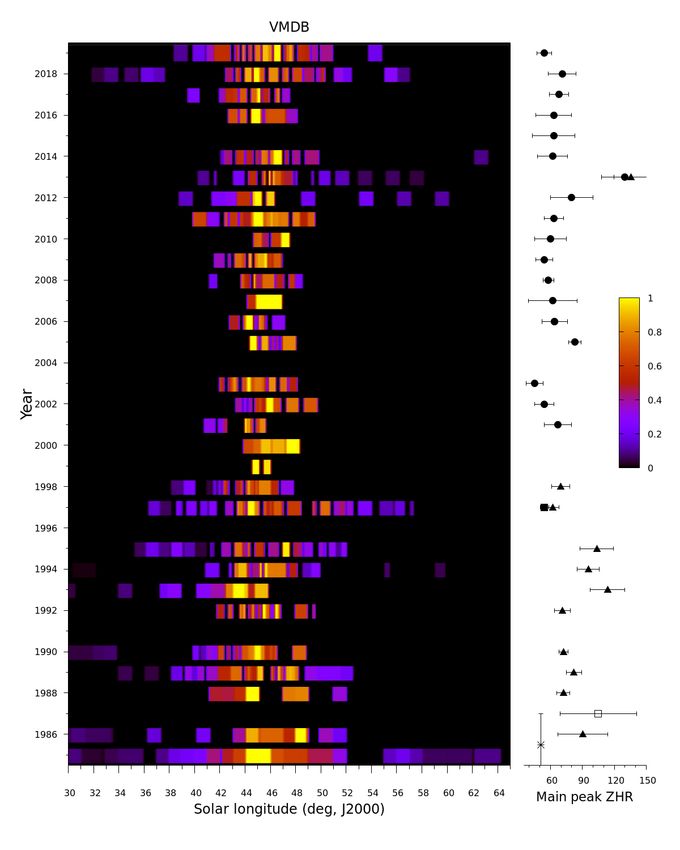
A. Egal et al.: Activity of the Eta-Aquariid and Orionid meteor showers

tially around 1927 as well (Hajduk 1970, Figure 1). A small Ori-       the 1:6 resonance. In addition, Sekhar and Asher (2014)’s model
onid outburst (ZHR > 30) was reported by European observers            also identified this resonance as causing the observed enhanced
in 1993 (Miskotte 1993; Rendtel and Betlem 1993; Jenniskens            activity of 2006, 2007, 2008 and 2009 (Kero et al. 2011). The
1995). The low population index at the time of the peak (r=1.8,        authors predicted that a future Orionid outburst in 2070 could be
see Rendtel and Betlem 1993) suggests that the Earth encoun-           produced by particles currently trapped in the 2:13 MMR with
tered a portion of the stream rich in large particles, a result con-   Jupiter.
sistent with the number of bright photographic meteors recorded
during the outburst. However, similar ZHR rates were reached in
1995 and 1997 (cf. Figure 2 of Rendtel 2008).                          3.3. Mass index
     The strongest activity reported in modern times was for the       3.3.1. Definition
2006 and 2007 apparitions of the shower (Rendtel 2007, 2008;
Trigo-Rodríguez et al. 2007; Spurný and Shrbený 2008; Arlt             It is typically assumed that the mass distribution of meteor show-
et al. 2008). In 2006, several peaks approached a ZHR of 60            ers follows a power law, that is,
(Rendtel 2007). The highest activity occurred when the pop-
ulation index of the shower was at its lowest value, revealing                                    dN ∝ M −s dM
a different meteoroid population from the shower background
(Rendtel 2007). The outburst was accompanied by an excep-              with dN the number of meteoroids of masses between M and
tional number of fireballs recorded by the European Fireball Net-      M + dM. The exponent s is called the differential mass index
work (Spurný and Shrbený 2008). The following year, a maxi-            and characterizes the proportion of big and small particles in a
mum ZHR of about 80 around L =208.45° was reported by Arlt             shower. Having s values strictly greater than 2 imply a stream
et al. (2008). Rendtel (2007) and Arlt et al. (2008) both sug-         mass concentrated in small particles, when values strictly lower
gested that enhanced activity of the Orionids can occur for a few      than 2 indicate the opposite. The mass index is related to the
consecutive years.                                                     population index r, the ratio of the number of meteors of magni-
                                                                       tude M+1 to those of magnitude M, using the modern empirical
                                                                       relation s ' 1 + 2.3 log r (Jenniskens 2006).
3.2.3. The role of resonances                                               Several estimates of the mass indices of the η-Aquariids and
The results of the International Halley Watch campaign demon-          Orionids are available in the literature. Mass indices deduced
strated that, as was the case for the 1910 apparition, the passage     from visual and radar observations between 1953 and 1980 were
of 1P/Halley through perihelion in 1986 yielded no rate enhance-       compiled by Hughes (1987a). Estimates ranged from 1.4 to 2 for
ment of the η-Aquariids or the Orionids (Spalding 1987; Porub-         the η-Aquariids (mass ranges of [10−3 , 10−2 ]g and [10−2 , 10−1 ]g
can et al. 1991). In addition, the 1993 Orionids outburst occurred     respectively) and 1.85 and 2.51 for the Orionids (masses in
when the comet was far from its perihelion position (Jenniskens        [10−3 , 1]g and [10−2 , 1]g respectively). Though the scatter in re-
2006). The existence of Halleyids outbursts is therefore not cor-      ported values for the same magnitude ranges makes firm conclu-
related with recent perihelion passages of the comet, a conclu-        sions difficult (Hughes 1987a), the data hints that the Orionids
sion that is easy to understand when we consider the significant       have a slightly higher s than the η-Aquariids.
orbital distance between 1P/Halley and the Earth.                           In-situ mass distribution indices measured by the Giotto,
     The influence of Jupiter on the stream evolution, particu-        Vega-1, and Vega-2 spacecrafts when approaching 1P/Halley’s
larly on the spatial density and the meteoroid size distribution,      nucleus are summarized in Hughes (1987a). Mass distribution
was first investigated by Hajduk (1970) and McIntosh and Haj-          indices of the dust changed with the distance between the space-
duk (1983). After the observation of a strong outburst in 2006,        crafts and the nucleus in an uncertain manner. Vega-1 and Vega-2
the hypothesis of enhanced Orionid activity caused by mete-            measurements led to s estimates between 1.54 and 1.92 (masses
oroids trapped in resonant orbits was investigated by several au-      between 10−6 and 10−12 g) with the SP-2 dust detector and be-
thors. Among the possible Mean Motion Resonances (MMR)                 tween 1.84 and 2.53 (masses between 10−10 and 10−13 g) with the
with Jupiter (Emel’Yanenko 2001), the 1:6 MMR was identified           DUCMA instrument. Giotto/DIDSY results spanned from 1.49
by Rendtel (2007) as the probable cause of the 2006 outburst           to 2.03 for masses between 10−6 and 10−9 g. Most of the in-situ
and suspected enhanced Orionid activity between 1933 and 1938          s estimates are lower than 2 (Hughes 1987a).
(Rendtel 2008). Consistent with that result, Sato and Watanabe              Confronting the meteoroids mass index measured close to
(2007) determined that the 2006 outburst was caused by 1:6 res-        the comet’s nucleus and deduced from meteor observations is
onant meteoroids ejected between 911 BCE and 1266 BCE. In              difficult for several reasons. The observed mass ranges barely
contrast, Spurný and Shrbený (2008) suggested the source of the        overlap, preventing the comparison of the s measured for me-
observed fireballs during this apparition was most likely the 1:5      teoroids of similar mass. In addition, the variability of in-situ s
MMR with Jupiter.                                                      estimates in function of the distance to the comet prevents a clear
     The resonant behavior of the Orionids was investigated by         estimate of the dust mass index close to the nucleus’ surface. In
Sekhar and Asher (2014). By performing numerical simulations,          consequence, we can only conclude that mass index estimates
the authors highlighted the influence of the 1:6 and 2:13 MMR          of 1P/Halley’s meteoroids of different masses and observed at
with Jupiter on recent and ancient Orionids outbursts. They iden-      different locations before 1986 range between 1.4 and 2.5.
tified the 2:13 MMR as being responsible for the observed 1993
outburst and of a possible older outburst in 1916.                     3.3.2. Orionids mass index
     Results of their simulations indicated several meteor out-
bursts due to particles trapped in the 1:6 resonance between AD        Subsequent meteor studies showed better agreement in the mass
1436 and 1440, when Orionid outbursts were reported in ancient         index measured for specific years, and highlighted the variability
Chinese records (see Section 2.3). Following a similar approach,       of s for both showers. From visual data, Dubietis (2003) mea-
Kinsman and Asher (2020)’s numerical simulations pointed to-           sured mass indices range from 1.83 to 2.11 for the Orionids be-
ward a strong Orionid outburst in AD 585 caused by the center of       tween 1984 and 2001, with an average of 1.87. A particularly
                                                                                                               Article number, page 5 of 25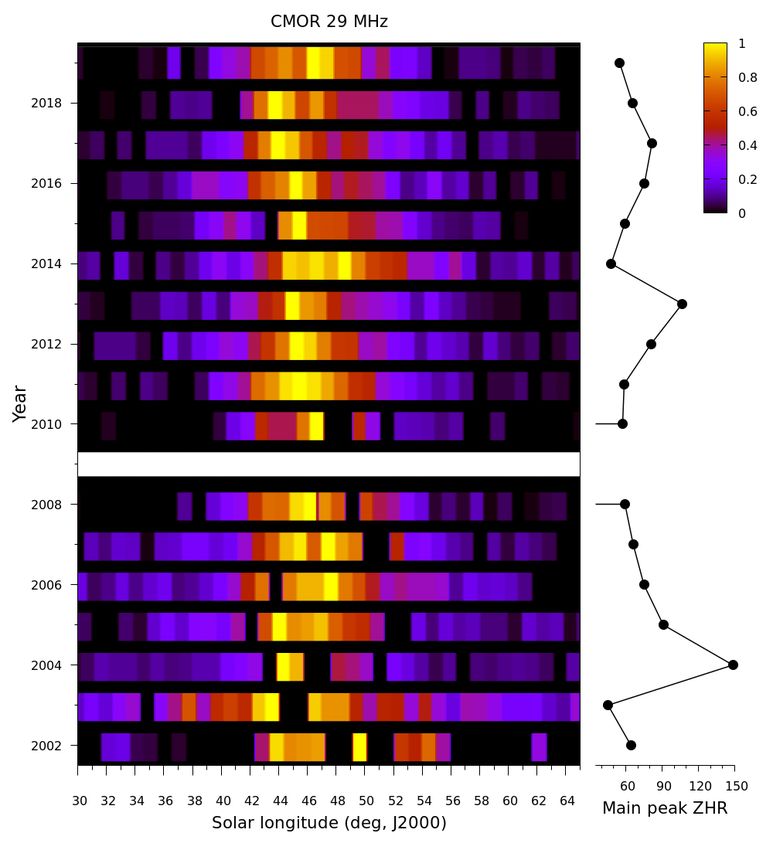
A&A proofs: manuscript no. Egal2020b

low value of 1.83 (r = 2.25) was estimated during the 1993 ap-        servations support the idea that the η-Aquariids are particularly
parition of the shower.                                               rich in small meteoroids (Jenniskens 2006; Campbell-Brown and
    Similarly, Rendtel (2008) measured s values close to the          Brown 2015), with masses below 10−8 kg (Schult et al. 2018).
peak of maximum activity varying between 1.46 and 1.96 be-
tween 1979 and 2006. The lowest mass index was found during
                                                                      4.2. Activity
the 2006 outburst, with an average of 1.69 and a peak value of
1.46 (Rendtel 2008) or less (Trigo-Rodríguez et al. 2007). As         Visual observations of the η-Aquariids during the 20th century
in Dubietis (2003), the mass index was found to present small         originate from a limited number of sources. As with the Ori-
variations around an average value of s = 1.87 (r = 2.4).             onids, Porubcan et al. (1991) processed observations gathered
    The computation of several meteor showers mass indices            during the International Halley Watch campaign to derive an av-
from the data of the Canadian Meteor Orbit Radar (CMOR) be-           erage activity profile of the shower between 1984 and 1987. The
tween 2007 and 2010 confirmed the time-variability of the η-          main peak of activity was identified as a sharp double maximum
Aquariids and Orionids s (Blaauw et al. 2011). Mass indices var-      at solar longitudes of 45.5° and 46.5°, with an average peak ZHR
ied between 1.93 and 1.65, reaching their minimum value around        of 50. The total period of activity exceeded one month, with a
the peak of maximum activity. The comparison of s around the          FWHM of 7 to 8 days. The existence of a small dip just after the
peak time between 2007 and 2009 also showed a variability of          maximum was also identified, with the presence of possible sec-
the mass index from year to year (varying from 1.65 to 1.77).         ondary maxima of activity. The profile is presented in Appendix
These results are consistent with Cevolani and Gabucci (1996),        A for reference.
who measured s > 1.8 from forward scatter radio data for both              An analysis of visual observations of the η-Aquariids from
showers.                                                              the Southern Hemisphere (South Africa) between 1986 and
    Kero et al. (2011) estimated a mass index slightly above 2.0      1995, and in 1997 and 1998 is presented in Cooper (1996, 1997,
from Orionids measurements of head echoes by the MU radar.            1998). The author estimated an average peak ZHR of 60-70 be-
Similarly, head echo measurements performed with the high             tween L =43.5° and L =44°, with a possible second maximum
power large aperture radar MAARSY between 2013 and 2016               around L =46-47°. A secondary maximum around L =48° was
resulted in s = 1.95, appropriate to meteoroid masses between         also noticed for the 1997 η-Aquariids by Rendtel (1997). En-
10−12 and 10−7 kg (Schult et al. 2018).                               hanced activity (ZHR higher than 100) was reported by Cooper
                                                                      (1996) for the 1993 and 1995 apparitions.
                                                                           The comparison of the activity profiles computed by north-
4. Eta-Aquariids                                                      ern and southern observers highlight the importance of the loca-
4.1. General features                                                 tion in the visual observation of the shower. On some occasions,
                                                                      both profiles show good agreement (like in 1993 or in 1997, cf.
The η-Aquariids were the first meteor shower to be linked to          Cooper 1997; Rendtel 1997). For the other apparitions, observers
comet 1P/Halley. In 1876, A. S. Herschel calculated the theo-         from the Southern Hemisphere were able to provide profiles of
retical radiant of meteors associated with several comets, and        higher temporal resolution and longer duration, permitting, for
estimated that 1P/Halley could be responsible for a shower in         example, the identification of enhanced activity in 1995 that was
early May (Kronk 2014). In 1910, the correlation between the η-       missed by northern observers. Cooper’s activity profiles are pre-
Aquariids and Halley was established by Olivier (Olivier 1912).       sented in Appendix A. In the Appendix, Cooper’s original ac-
     The η-Aquariids is the third strongest annual meteor shower      tivity profiles (computed with a population index r1 of 2.3 and a
observable at Earth, and one of the most active showers observ-       limiting magnitude LM=5.8) were rescaled to a population index
able from the Southern Hemisphere. Visual observations of the         r2 of 2.46 (see Section 5.2.1) with the relation:
η-Aquariids are strongly favored for Southern Hemisphere ob-
servers compared to those in the north, where a higher proportion                           !(6.5−LM)
of meteor observers are located. The radiant elongation (≤70°                         r2
from the Sun) restricts the observation window from the North-        ZHRr2 ' ZHRr1 ∗                   .                           (1)
                                                                                      r1
ern Hemisphere to a few hours before the Sun rises, and poor
weather conditions in early May frequently hamper visual ob-              Following their analysis of the Orionids, Hajduk (1973),
servations of the shower.                                             Hajduk and Cevolani (1981), Hajduk and Buhagiar (1982)
     The smaller number of reliable η-Aquariids records has lim-      and Hajduk and Vana (1985) analyzed the variations of the
ited the modeling of this shower (Sekhar and Asher 2014). For-        η-Aquariids activity in visual and radar data. Again, the maxi-
tunately, observational constraints for η-Aquariids modeling are      mum activity was detected as a sharp double maximum around
provided by radar measurements of the shower. In 1947, the η-         L =45° and L =47°, for an average location of about 45.5°.
Aquariids became one of the first streams to be detected using        Much as its twin shower, the η-Aquariids displayed considerable
specular backscattering radio techniques at the Jodrell Bank Ex-      variations in density along the orbit and a possible drift of the
perimental Station (Clegg et al. 1947). Subsequently, multiple        main peak’s solar longitude was observed (from 44.7° in 1971
specular radar observations of the shower were conducted be-          to 45° in 1975 and 47° in 1978).
tween the 1950s and 1990s (e.g., Hajduk and Cevolani 1981;
Hajduk and Buhagiar 1982; Hajduk and Vana 1985; Chebotarev                The long-term evolution of the η-Aquariids was also investi-
et al. 1988). The shower was also the first one to be clearly iden-   gated by Dubietis (2003). As with the Orionids, the author com-
tified in head echo measurements, in particular by the interfer-      puted the shower population index r and average peak ZHR from
ometric 49.92 MHz high-power large aperture radar at the Ji-          visual observations in the IMO VMDB between 1989 and 2001.
camarca Radio Observatory (Chau and Galindo 2008). In addi-           The population index of the η-Aquariids displayed a minimum
tion, the η-Aquariids is the strongest stream detected in spec-       in 1992-1994, when a particularly low r value was also recorded
ular backscatter by the Advanced Meteor Orbit Radar (Galli-           for the Orionids in 1993 (Rendtel and Betlem 1993). If the η-
gan 2000), which has a limiting sensitivity near +13. These ob-       Aquariids annual ZHR seemed to present some periodic trends,
Article number, page 6 of 25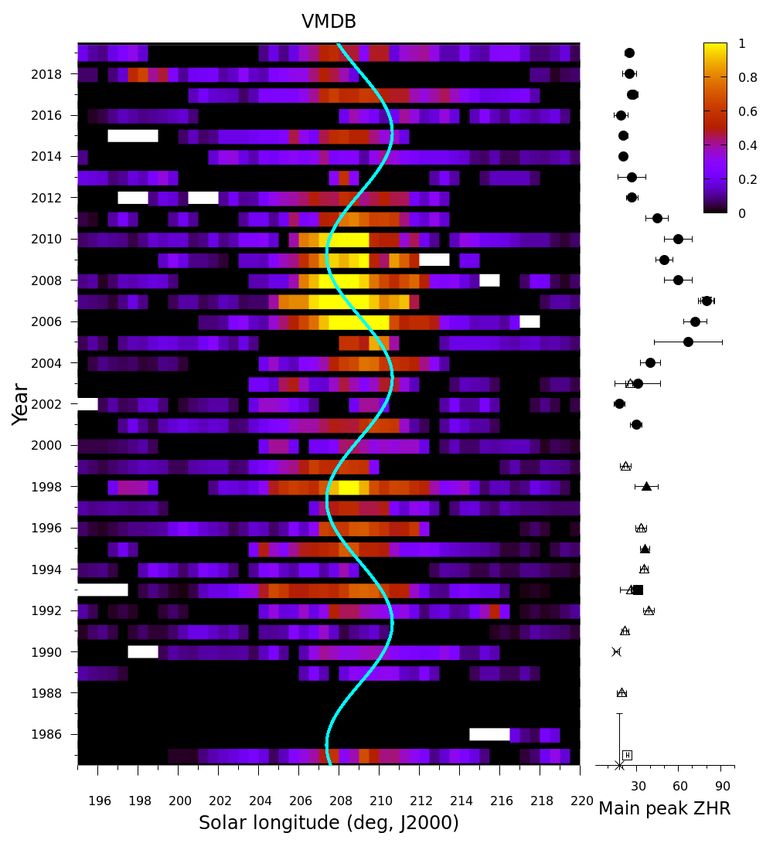
A. Egal et al.: Activity of the Eta-Aquariid and Orionid meteor showers

the reliability of these variations is reduced by the smaller num-      also in 1993, 1996, 2004 and 2015 when the main activity oc-
ber of available observations. No regular periodicity in the η-         curred close to the full Moon. Because Northern observers tend
Aquariids rates was clearly identified by Hajduk (1973) over the        to focus their attention on the estimated peak date, the total η-
period 1900-1967.                                                       Aquariids duration is hardly retrievable on the sole basis of these
     A detailed analysis of the shower observed by the Canadian         profiles. Exceptions are years 2012, 2013, 2018 and 2019 when
Meteor Orbit Radar (CMOR) between 2002 and 2014 is pre-                 complete activity profiles are available on the website.
sented in Campbell-Brown and Brown (2015). The variability of               Activity profiles of the Orionids are available in the VMDB
the activity profiles is an additional indication of the existence of   going back to 1985, and continuously since 1989. When allowed
fine structure within the stream, as already noted by Blaauw et al.     by the Moon phase, visual observations cover the full period of
(2011). The main peak was generally localized around L =45°,            activity of the shower (for example in 2006, 2008, 2010, 2012
with a secondary peak around L =48°. In some cases however,             or 2019). These visual profiles are particularly valuable when
a secondary peak supplemented the first one. The existence of a         comparing the results of different detection networks.
third peak around L =54° was observed in 2002 and 2006. The
analysis also revealed the existence of two strong outbursts, in
                                                                        5.1.2. IMO VMN
2004 and 2013. In 2004, the maximum activity occurred close
to the full moon and no visual observations can confirm or con-         The IMO Video Meteor Network (hereafter called VMN) is
tradict the existence of an outburst. To our knowledge, CMOR            comprised of about 130 cameras dedicated to meteor observa-
is the only source of η-Aquariids measurements during the 2004          tions. The network coverage extends mainly over Europe, with
apparition. The 2013 outburst, predicted by Sato and Watanabe           additional cameras located in the United States and Australia.
(2014), was successfully recorded by radio, visual, and video de-       The cameras are capable of recording meteors down to a limiting
tection networks (e.g., Molau et al. 2013; Cooper 2013; Steyaert        magnitude of about 3.0±0.8, and stars with a limiting magnitude
2014; Campbell-Brown and Brown 2015).                                   of 4.0±0.93 . The meteor detection is automatically performed
                                                                        by the MetRec software3 , which also provides flux estimates.
                                                                        Monthly reports of the VMN are regularly published in WGN,
4.3. Mass index
                                                                        the Journal of the IMO.
Dubietis (2003) estimated a mass index of 1.78 to 1.94 from vi-              A complementary web interface allows users to visualize and
sual observations of the shower between 1989 and 2001. The              analyze the flux profile of the showers recorded by the network
lowest value of 1.78 (r = 2.18) was reached in 1992. Like the           since 20114 . Several filters (choice of time bin, the cameras used,
Orionids, an average mass index of 1.87 was estimated for the           radiant location, limiting magnitude, single or multiyear analy-
η-Aquariids (Dubietis 2003). However, much lower values of s            sis, etc.) can be applied when computing the flux profile. A re-
were measured close to the maximum activity of the shower (for          cent modification of the software offers the opportunity to mod-
example a s of 1.72 in 1997, cf. Rendtel 1997).                         ify the population index of a shower, which is now applied in
    The η-Aquariids recorded by the CMOR radar in 2008 dis-             the flux density calculation (and not only in the transformation
play a mass index varying between 2 (at the beginning and end           of the flux density into a ZHR).
of the activity) to 1.85 around L =44.5° (Blaauw et al. 2011).
Campbell-Brown and Brown (2015) estimated a peak mass in-               5.1.3. CMOR
dex varying from 1.75 to 1.95 between 2012 and 2015. The mass
index was found to be below 1.9 at the peak and above these val-        The CMOR radar has been providing consistent single-station
ues far from the peak.                                                  and orbital, multifrequency observations of the Halleyids since
                                                                        2002. The equipment consists of three independent radar sys-
                                                                        tems running at frequencies of 17.45 MHz, 29.85 MHz, and
5. Halleyids observations between 2002 and 2019                         38.15 MHz. A detailed description of the instrument is presented
                                                                        in Brown et al. (2008, 2010). In this work, the flux computation
In the following sections, we analyze the long-term activity of         of the η-Aquariids and Orionids was performed using the 29.85
the η-Aquariids and the Orionids, focusing on the period of cov-        MHz and 38.15 MHz data, as 17.45 MHz suffers significant ter-
erage of the CMOR radar (since 2002). CMOR measurements                 restrial interference, particularly in the early years of operation.
are of particular importance between 2003 and 2010, when only           The data processing was performed as described in Campbell-
a few observations of the Orionids (and even fewer for the              Brown and Brown (2015).
η-Aquariids) were published in the literature. When available,              It is important to note that the hardware, experimental setup
CMOR results are compared with visual observations contained            (pulse repetition frequency, receiver bandwidth, pulse shape, and
in the IMO VMDB and measurements of the VMN network. In                 duration) as well as the software and detection algorithms used
this section, details about the available observations and our data     by the 38 MHz CMOR system were completely unchanged since
processing are provided. The analysis of the resulting activity         2002. The 29 MHz system underwent a transmitter power up-
profiles is presented in Section 6.                                     grade in the summer of 2009, but the receiver, antennas, and
                                                                        software detection algorithms plus experimental setup remained
5.1. Observations                                                       unchanged compared to the pre-2009 period.
                                                                            The main change in the systems over time due to hardware
5.1.1. IMO VMDB                                                         aging is the transmit power output which is directly measured
                                                                        and recorded for each system every 30 minutes or less and in-
Activity profiles of the η-Aquariids are available in the IMO Vi-       cluded as a correction in flux calculations. As a result, we expect
sual Meteor Data Base2 (VMDB) back to 1989. Because of the              that shower profiles over this time frame can be compared and
difficult observing conditions from the Northern Hemisphere,
several apparitions of the shower were missed or only partially         3
                                                                            http://www.imonet.org/imc13/meteoroids2013_poster.pdf
                                                                        4
recorded. Observations are in particular missing in 1991, and               https://meteorflux.org/

                                                                                                                Article number, page 7 of 25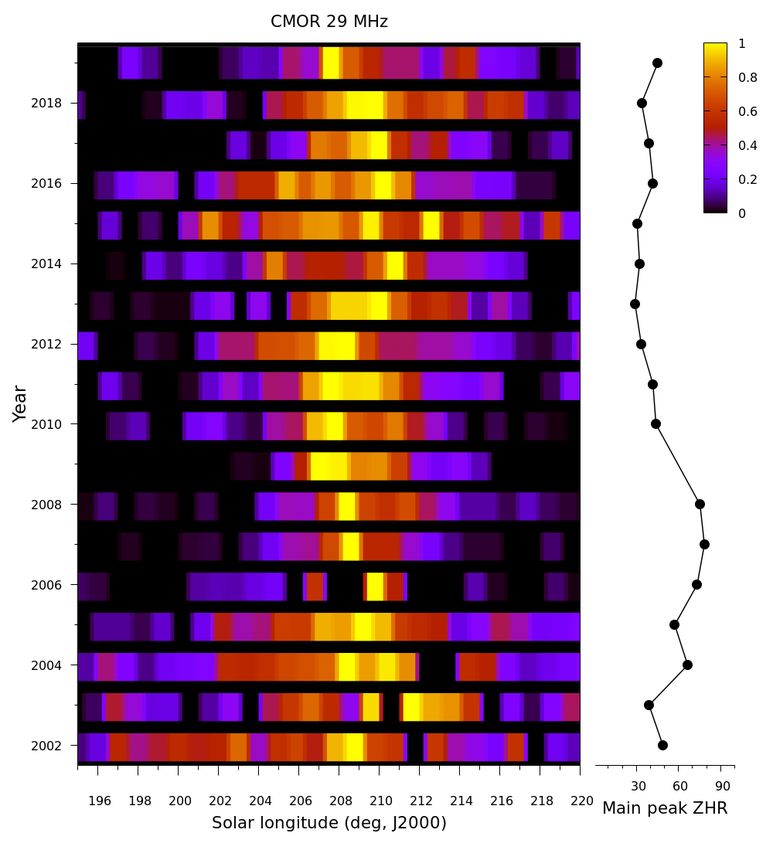
A&A proofs: manuscript no. Egal2020b

differences (particularly those showing up in both systems) con-     +43, the time resolution for CMOR profiles for this shower are
fidently associated with real flux variability.                      necessarily limited to half a day anyway.
                                                                         Much as is the case for the shower population index, the res-
                                                                     olution of the profiles available in the VMDB cannot be selected
5.2. Data processing
                                                                     directly by the user. A variable time bin (related to the quantity
The comparison of visual, video, and radar data is challenging.      and frequency of the reported observations) is usually applied to
Each observation method suffers its own biases, related to the       different portions of the profile to increase the reliability of the
observing conditions (atmospheric conditions, radiant elevation,     ZHR rates presented. In this work, no smoothing or interpolation
etc.), the meteoroids’ characteristics (mass, size, deceleration),   of the available visual profile as a function of solar longitude was
and instrumental constraints. In addition, the three systems con-    applied. The individual activity profiles were plotted against the
sidered here are not equally sensitive to the same mass range,       video and the radar data without further correction. As a result,
which could prevent a reliable comparison between the systems.       the analysis of the main peak time and intensity requires a cau-
Indeed, differences in the shower activity between systems could     tion as is described in later sections.
simply reflect different data processing assumptions, or the pres-
ence of different meteoroid size distributions.
                                                                     5.2.3. Normalization
     As a result, in this study, we focus on a comparison of the
global characteristics of the Halleyids activity profile (shape,     When we started comparing the original activity profiles derived
maximum ZHR, and approximate location of the maximum ac-             for each system, an initial divergence of the ZHR-equivalent lev-
tivity). When possible, activity profiles are determined using       els recorded was immediately evident. The main peak activity
a consistent population index and a consistent time resolution.      measured from CMOR (29 MHz) was systematically 1 to 1.5
Though the recomputation of the activity profiles with consistent    times higher than the VMN measurements, and 1 to 2.5 times
parameters may reduce our sensitivity to some activity variations    higher than the VMDB records. These differences were observed
(e.g., rebinning with a longer time interval could obscure short-    for both showers and each year considered. They are therefore
term variations), it is necessary for reliable comparison between    likely issues of the limiting sensitivity being systematically un-
the different data sets.                                             der or over estimated, calibration differences or observational
                                                                     biases, rather than caused by differences in the observed mete-
                                                                     oroids population with mass range which would produce more
5.2.1. Mass index
                                                                     random scatter.
Using radar measurements as our baseline, we assume for the               Since this work focuses on the relative long-term variabil-
rest of this work a constant mass index of 1.9 (r = 2.46) for        ity of the Orionids and η-Aquariids meteor showers, we decided
the η-Aquariids (Campbell-Brown and Brown 2015) and 1.95             to scale the activity levels measured by each system to obtain
(r = 2.59) for the Orionids (Schult et al. 2018). These values       similar ZHR rates over a long period of time (∼1985 to 2019).
were used for all flux computations and ZHR estimates derived        To ease comparison of recent measurements with older visual
from VMN and CMOR data; no additional correction was ap-             observations (published or contained in the VMDB), VMN and
plied to these observations, except an additional normalizing fac-   CMOR profiles were scaled to the VMDB activity curves. Nor-
tor described in Section 5.2.3.                                      malizing factors for each system were determined by adjusting
    In the VMDB, the choice of the population index and the          the maximum ZHR rates measured by the system and the VMDB
temporal resolution of the profile is not directly offered to the    over the observation period.
user. As a first approximation, we could attempt to rescale the           In this work, each VMN profile has been multiplied by 0.8
visual profiles to our selected population index values. However,    for the Orionids and by 0.6 for the η-Aquariids. These dif-
such a transformation requires knowledge of the limiting magni-      ferent correction factors for the two showers might be due to
tude (LM) of the observation, which is not accessible and varies     the reduced number of visual observations available for the η-
substantially with moonlight conditions. In addition, ZHR esti-      Aquariids. CMOR 29 MHz profiles were multiplied by 0.74 for
mates in the VMDB frequently result from an average of sev-          the Orionids and 0.45 for the η-Aquariids.
eral interval counts, each one processed with different corrective        As mentioned in Campbell-Brown and Brown (2015), the
factors. Applying a uniform correction (assuming for example a       flux calculated from the 38 MHz data is about two to three times
constant LM value) to the VMDB profiles, recorded in very dif-       lower than the flux determined from the 29 MHz system (proba-
ferent observing conditions, is therefore not realistic. However,    bly because of uncertainties in the mass index correction factors
population indices usually applied by the IMO to compute the         and/or initial radius bias). As a consequence, the Orionids pro-
activity profiles are r = 2.4 (s = 1.87) for the η-Aquariids and     files computed from the 38 MHz data needed to be increased by
r = 2.5 (s = 1.92) for the Orionids, which are close to our se-      a factor of 1.63, while no modification was required for the η-
lected values. Differences induced by use of these mass indices      Aquariids profiles. The normalizing factors for each system are
as opposed to our values, are lower than the usual uncertainty on    summarized in Table 1.
the ZHR computation.                                                      Each curve and ZHR estimates presented in Section 6 and
                                                                     Appendices B & C were scaled by the factors of Table 1, and
5.2.2. Time resolution                                               are noted ZHRv in the text. Therefore, results and figures of the
                                                                     following sections should not be interpreted to represent abso-
A constant bin of 1° in solar longitude was considered for the       lute ZHR estimates of the Halleyids meteor showers. Scaling the
activity profile computations of the VMN and CMOR data. The          video and radar profiles to visual observations results from an
selection of a rather large time bin was made to ease the com-       arbitrary choice to make the longer time base of visual data the
parison of our results with previous published works (Koschack       standard, and not from a conviction that visual records better
and Roggemans 1991; Dubietis 2003). Because of the limited           match the real activity of the showers. The purpose of this work
visibility of the η-Aquariids radiant from CMOR’s latitude of        is instead to provide consistent measurements of the activity pro-
Article number, page 8 of 25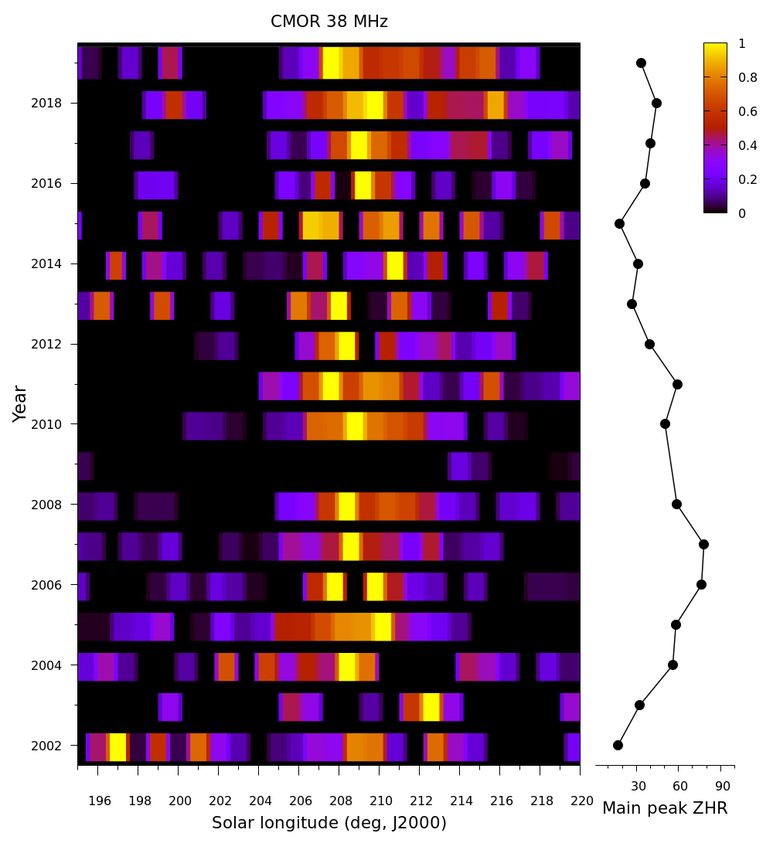
A. Egal et al.: Activity of the Eta-Aquariid and Orionid meteor showers
VMDB VMN CMOR 29 MHz CMOR 38 MHz
η-Aquariids 1 0.6 0.45 1
Orionids 1 0.8 0.74 1.63
Table 1. Normalization factors applied to the η-Aquariids and Orionids activity measured by the VMDB, VMN, and CMOR networks. Each ZHR
estimate presented in Section 6 results from the multiplication of the original ZHR measured by each system with the coefficients listed above.
files (duration, shape) and year-to-year variations in activity be- system which occurred in this time frame. As a result, only the
tween different detection networks. 38 MHz data is available to characterize this specific apparition.
6. Results and analysis 6.1.2. Orionids
CMOR activity profiles of the η-Aquariids and Orionids between In our data, the Orionids display noticeable activity between
2002 and 2019 are presented in Appendix B, Figures B.1 and L =195° and L =220°. The peak ZHRv rates vary between 20
B.2. Results of the 29 MHz (blue) and 38 MHz (green) sys- and 40 meteors per hour up to 2003 and after 2012, and be-
tems are plotted along with the VMDB profiles (in black) and tween 40 and 80 around the 2006 and 2007 resonant return years.
the VMN observations (beginning in 2011, in red). Years of enhanced activity tend to present a sharper and less scat-
tered profile than apparitions of moderate intensity. As noticed
by many observers (cf. Section 3), the Orionids present a broad
6.1. Individual activity profiles maximum between 206° and 211°, with several subpeaks of vari-
6.1.1. η-Aquariids able intensity and location. The main peak of activity is therefore
difficult to assess for several Orionids apparitions. On some oc-
The η-Aquariids are generally active between L =35° and casions, the highest ZHRv rates do not coincide with the center
L =60°, with highest rates recorded between L =40° and of the broad maximum (e.g., in 2018, 2019) or the presence of
L =55°. ZHRv estimates usually reach a maximum value of 60 multiple subpeaks prevents the identification of the main peak
to 80 meteors per hour, except for two years of enhanced activity: (e.g., in 2009 or 2017). In 2017 for example, the visual profile
the 2004 outburst recorded by CMOR and already reported by displays two maxima of equivalent strength, clearly separated by
Campbell-Brown and Brown (2015), and the 2013 outburst pre- a dip already observed in the past (see Section 3).
dicted by Sato and Watanabe (2014) and well covered by visual, For the Orionids, the observations by different detection
video, and radar observations. The location of the main peak methods are less consistent than for the η-Aquariids. This is in
varies between L =44° and 47°, with the existence of several part a consequence of the lower number statistics for the Orion-
peaks of lower intensity after the main maximum. Most of the ids compared to the η-Aquariids. From figure B.2, it is clear that
visual profiles peak around 45° to 45.75° (2001, 2005, second the shower does not show a stable activity profile from return
maxima in 2006, 2007, 2009-2014 and 2017), with some occur- to return. The overall duration and location of the broad max-
ring earlier than this time (2003, first maxima in 2006, 2015 and imum of activity are similar between the systems, but the fine
2016) and a few later (2002, 2008, 2018 and 2019). The chang- structure of the profiles differs. Clearly, the lower activity level
ing activity profiles of the shower from return to return suggests of this shower increases the apparent discrepancies between our
that there is structure in the stream, as such large changes in peak different data sets due to small number statistics.
times are not common among the major showers (cf. Rendtel and Relatively good agreement is found between the VMN and
Arlt 2008). VMDB profiles in 2014, 2017, and 2019, but not for earlier ap-
Good agreement in the duration and peak time in a given year paritions (e.g., 2011, 2012). Observations from the 38 MHz sys-
is found between the different techniques. VMN measurements tem appears to be particularly sensitive to the low-level activity
are comparable to the VMDB, at least when the visual obser- of the shower, leading to very broad profiles. CMOR activity
vations provide a complete activity profile with good resolution profiles are similar to visual observations in 2005, 2007, 2008,
(like from 2017 to 2019). In some years, the difference between and 2010. A lack of observations around the peak in 2006 does
the two networks is larger (e.g., in 2011 or 2014). CMOR pro- not allow us to clearly define the main peak location and inten-
files typically follow the shape defined by optical measurements, sity, but high ZHRv estimates (>70) were recorded at L =207°
but present more variations in the main peak location and sug- and L =209°. The overall shape of the CMOR and VMN pro-
gest the existence of subpeaks. files are consistent in 2011, 2012, and 2013, but differ for other
For example, the 2012, 2013, 2017 and 2019 apparitions are apparitions of the shower, especially in 2016 and 2018. In 2018,
very consistent between the networks, but the radar main peak an early peak of activity is noticeable in the VMDB data (ZHRv
location diverges from the optical data in 2005, 2015, 2016 and of 54±7 around L =198.54°) that might be detected by the 38
2018. Profiles obtained using the 38 MHz and 29 MHz data also MHz system too, but does not appear in the VMN activity curve.
differ slightly from one another, but there is no evidence that
one frequency better reproduces the optical observations for ev-
ery apparition of the shower. Sudden gaps in the radar profiles 6.2. Average activity
indicate periods for which the records are missing (because of 6.2.1. 2002-2019
instrumental issues or lack of reliable measurements).
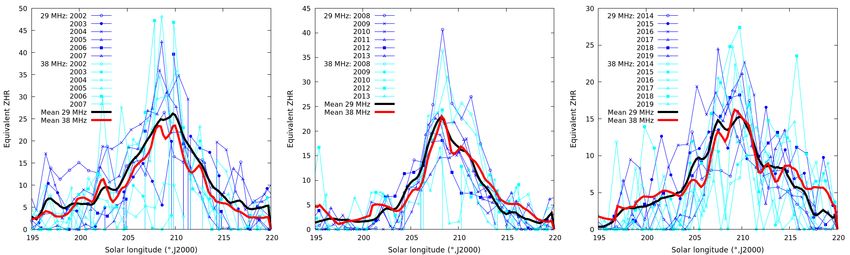
Unfortunately, radar observations were not available around Figure 3 presents the average activity profiles of the η-Aquariids
the estimated peak time in 2002, 2003, 2006 and potentially and Orionids recorded by CMOR over the periods 2002-2007,
2010. In addition, the 2009 radar profile largely diverges from 2008-2013, and 2014-2019. The average profiles display sig-
the VMDB observations around the peak time, in this instance nificant variations as a function of the period considered. Early
because of a large scale equipment change to the 29 MHz CMOR CMOR measurements match published estimates of η-Aquariids
Article number, page 9 of 25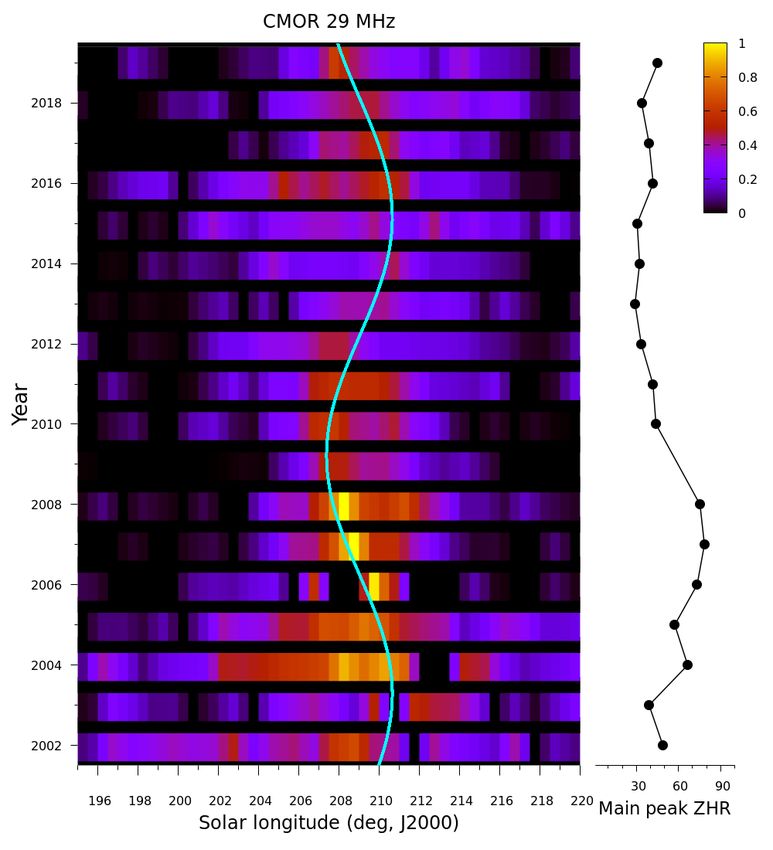
You can also read