Google Search by Voice: A case study
←
→
Page content transcription
If your browser does not render page correctly, please read the page content below
Google Search by Voice: A case study
 Johan Schalkwyk, Doug Beeferman, Françoise Beaufays, Bill Byrne,
    Ciprian Chelba, Mike Cohen, Maryam Garret, Brian Strope
                          Google, Inc.
                     1600 Amphiteatre Pkwy
                 Mountain View, CA 94043, USA

1    Introduction
Using our voice to access information has been part of science fiction ever
since the days of Captain Kirk talking to the Star Trek computer. Today,
with powerful smartphones and cloud based computing, science fiction is
becoming reality. In this chapter we give an overview of Google Search by
Voice and our efforts to make speech input on mobile devices truly ubiqui-
tous.
    The explosion in recent years of mobile devices, especially web-enabled
smartphones, has resulted in new user expectations and needs. Some of
these new expectations are about the nature of the services - e.g., new types
of up-to-the-minute information (”where’s the closest parking spot?”) or
communications (e.g., ”update my facebook status to ’seeking chocolate’”).
There is also the growing expectation of ubiquitous availability. Users in-
creasingly expect to have constant access to the information and services of
the web. Given the nature of delivery devices (e.g., fit in your pocket or in
your ear) and the increased range of usage scenarios (while driving, biking,
walking down the street), speech technology has taken on new importance
in accommodating user needs for ubiquitous mobile access - any time, any
place, any usage scenario, as part of any type of activity.
    A goal at Google is to make spoken access ubiquitously available. We
would like to let the user choose - they should be able to take it for granted
that spoken interaction is always an option. Achieving ubiquity requires two
things: availability (i.e., built into every possible interaction where speech
input or output can make sense), and performance (i.e., works so well that
the modality adds no friction to the interaction).
    This chapter is a case study of the development of Google Search by

                                      1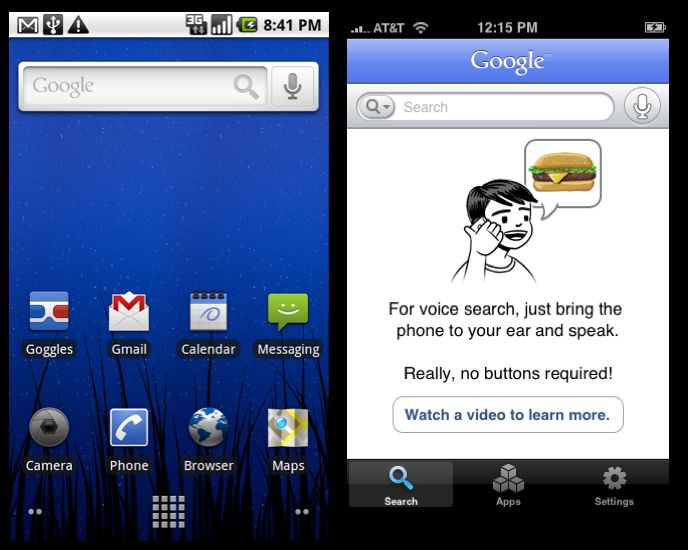
Voice - a step toward our long term vision of ubiquitous access. While the
integration of speech input into Google search is a significant step toward
more ubiquitous access, it posed many problems in terms of the performance
of core speech technologies and the design of effective user interfaces. Work
is ongoing - the problems are far from solved. However, we have, at least,
achieved a level of performance such that usage is growing rapidly, and many
users become repeat users.
    In this chapter we will present the research, development, and testing
of a number of aspects of speech technology and user interface approaches
that have helped improve performance and/or shed light on issues that will
guide future research. There are two themes which underlie much of the
technical approach we are taking: delivery from the cloud and operating at
large scale.
    Delivery from the cloud: Delivery of services from the cloud enables a
number of advantages when developing new services and new technologies.
In general, research and development at Google is conducted ”in-vivo” —
as part of actual services. This way, we benefit from an ongoing flow of real
usage data. That data is valuable for guiding our research in the directions
of most value to end-users, and supplying a steady flow of data for training
systems. Given the statistical nature of modern speech recognition systems,
this ongoing flow of data for training and testing is critical. Much of the
work described below, including core technology development, user interface
development, and user studies, depends critically on constant access to data
from real usage.
    Operating at scale: Mobile voice search is a challenging problem for
many reasons - for example, vocabularies are huge, input is unpredictable,
and noise conditions may vary tremendously due to the wide-ranging usage
scenarios while mobile. Additionally, well known issues from earlier deploy-
ments of speech technology, such as dealing with dialectal variations, are
compounded by the large scale nature of voice search.
    Our thesis in handling these issues is that we can take advantage of the
large amount of compute power, a rapidly growing volume of data, and the
infrastructure available at Google to process more data and model more con-
ditions than ever done before in the history of speech recognition. Therefore,
many of the techniques and research directions described below are focussed
on building models at scale - i.e., models that can take advantage of huge
amounts of data and the compute power to train and run them. Some of the
approaches discussed will be methods for exploiting large amounts of data
- for example with ”unsupervised learning”, i.e., the ability to train models
on all the data that comes in, without the need for human intervention for

                                      2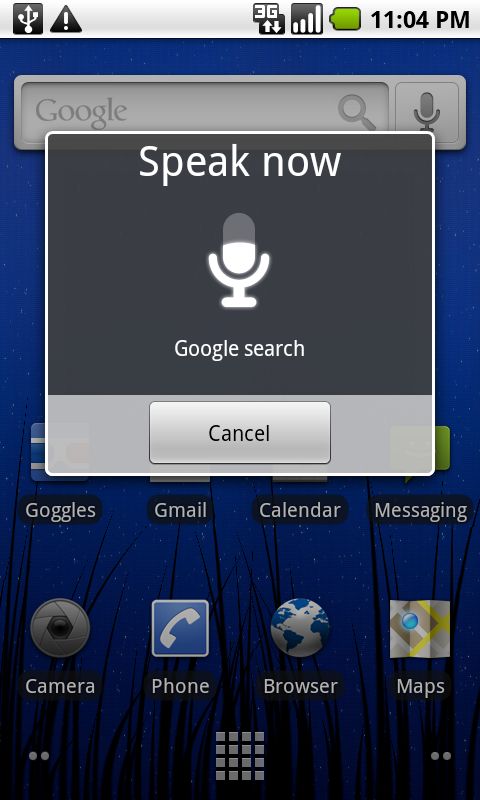
transcription or labeling. Another key set of issues involve the question of
how to ”grow” models as more data becomes available. In other words,
given much more data, we can train richer models that better capture the
complexities of speech. However, there remain many open questions about
the most effective ways to do so.
    In addition to taking advantage of the cloud and our ability to operate
at large scale, we also take advantage of other recent technology advances.
The maturing of powerful search engines provides a very effective way to
give users what they want if we can recognize the words of a query. The
recent emergence of widely-used multi-modal platforms (smartphones) pro-
vides both a powerful user interface capability and a delivery channel.
    This chapter presents the approaches we have taken to deliver and op-
timize the performance of spoken search, both from the point of view of
core technology and user interface design. In Section 2 we briefly describe
the history of search by voice efforts at Google. Section 3 provides an in
depth description of the technology employed at Google and the challenges
we faced to make search by voice a reality. In Section 4 we explore the
user interface design issues. Multi-modal interfaces, combining speech and
graphical elements, are very new, and there are many challenges to contend
with as well as opportunities to exploit. Finally, in Section 5 we describe
user studies based on our deployed applications.

2     History
2.1   GOOG-411
Searching for information by voice has been part of our every day lives since
long before the internet became prevalent. It was already the case thirty
years ago that, if you needed information for a local business, the common
approach was to dial directory assistance (411 in the US) and ask an operator
for the telephone number.
    800-GOOG-411 [2] is an automated system that uses speech recognition
and web search to help people find and call businesses. Initially this system
followed the well known model of first prompting the user for the “city and
state” followed by the desired business listing as depicted in Figure 1.
    This basic dialog has been ingrained in our minds since long before inter-
active voice response systems (IVR) replaced all or part of the live operator
interaction.
    Pre-IVR systems use ”store-and-forward” technology that records the
”city-and-state” the caller is requesting and then plays the city and state to

                                      3
GOOG411: Calls recorded... Google! What city and state?
Caller: Palo Alto, California
GOOG411: What listing?
Caller: Patxis Chicago Pizza
GOOG411: Patxis Chicago Pizza, on Emerson Street. I’ll connect you...
Figure 1: Early dialog for a GOOG-411 query.
the operator. This frees the operator from direct interaction with the user
and results in substantial savings of human labor. Additionally, it constrains
the search for businesses to the chosen city.
In 2008 we deployed a new version of GOOG-411 which allowed (and
encouraged) the user to state their need in a single utterance rather than
in sequential utterances that split apart the location and the business (Fig-
ure 2). This was motivated by our desire to accommodate faster interactions
as well as allow the user greater flexibility in how they describe their needs.
This approach introduces new speech recognition challenges, given that we
can no longer constrain the business listing language model to only those
businesses in or near the chosen city. In [10] we investigated the effect of
moving from a city conditional to nation wide language model that allows
recognition of the business listing as well as the location in a single user
response.
GOOG411: Calls recorded... Google! Say the business, and the city and state.
Caller: Patxis Chicago Pizza in Palo Alto.
GOOG411: Patxis Chicago Pizza, on Emerson Street. I’ll connect you...
Figure 2: Single shot dialog for a GOOG-411 query.
Moving from a two-step to a single-step dialog allowed for faster and
arguably more natural user interactions. This, however, came at the price of
increased recognition complexity, for the reasons described above. This was
our first step moving from traditional directory assistance to more complex
systems. The next step was to exploit new modalities.
2.2 Google Maps for Mobile (GMM)
Traditional directory assistance applications are limited to a single modality,
using voice as both input and output. With the advent of smartphones with
large screens and data connectivity, we could move to a multi-modal user
4interface with speech or text as the input modality, and maps with super-
imposed business listings as the output modality.
Figure 3: Google Maps for Mobile, with voice interface.
In March 2008 we introduced our first multi-modal speech application for
Google Maps for Mobile (GMM). Figure 3 depicts a multi-modal interface
for directory assistance that we built on top of GMM.
A multi-modal experience has some distinct advantages compared to the
IVR (voice-only) system. First, the output modality can be visual rather
than spoken, allowing much richer information flow. Google Maps for Mo-
bile can show the location of the business and other related information
directly on a map. The contact information, address, and any other meta
information about the business (such as ratings) can easily be displayed. A
second major advantage relates to the time it takes the user to both search
for and digest information. Due to the multi-modality of the search experi-
ence, the total time spent is significantly less than the single input/output
spoken modality of the IVR system. Finally, the cognitive load on the user
is greatly reduced - the ephemeral nature of speech places significant cogni-
tive demands on a user when the information communicated is lengthy or
complex. These advantages enable a substantial improvement in the qual-
ity of interaction and quality of information one can provide compared to
traditional IVR systems.
2.3 Google Search by Voice
Mobile web search is a rapidly growing area of interest. Internet-enabled
smartphones account for an increasing share of the mobile devices sold
throughout the world, and most models offer a web browsing experience
that rivals desktop computers in display quality. Users are increasingly
turning to their mobile devices when doing web searches, driving efforts to
enhance the usability of web search on these devices.
5Although mobile device usability has improved, typing search queries
can still be cumbersome, error-prone, and even dangerous in some usage
scenarios.
Figure 4: Google search by Voice for iPhone.
In November 2008 we introduced Google Mobile App (GMA) for iPhone
(Figure 4) that included a search by voice feature. GMA search by voice
extended the paradigm of multi-modal voice search from searching for busi-
nesses on maps to searching the entire world wide web. In the next few
sections we discuss the technology behind these efforts and some lessons we
have learned by analyzing data from our users.
3 Technology
The goal of Google search by Voice is to recognize any spoken search query.
Table 1 lists some example queries, hinting at the great diversity of inputs we
must accommodate. Unlike GOOG-411, which is very domain-dependent,
Google search by Voice must be capable of handling anything that Google
search can handle. This makes it a considerably more challenging recognition
problem, because the vocabulary and complexity of the queries is so large
(more on this later in the language modeling Section 3.4).
Figure 5 depicts the basic system architecture of the recognizer behind
6Example Query
images of the grand canyon
what’s the average weight of a rhinoceros
map of san francisco
what time is it in bangalore
weather scarsdale new york
bank of america dot com
A T and T
eighty one walker road
videos of obama state of the union address
genetics of color blindness
Table 1: Example queries to Google search by Voice.
Figure 5: Basic block diagram of a speech recognizer.
Google search by Voice. For each key area of acoustic modeling and language
modeling we will describe some of the challenges we faced as well as some
of the solutions we have developed to address those unique challenges.
In Section 3.1 we will review some of the common metrics we use to
evaluate the quality of the recognizer. In Sections 3.2, 3.3, 3.4, we describe
the algorithms and technologies used to build the recognizer for Google
search by Voice.
73.1 Metrics
Choosing appropriate metrics to track the quality of the system is critical to
success. The metrics drive our research directions as well as provide insight
and guidance for solving specific problems and tuning system performance.
We strive to find metrics that illuminate the end-user experience, to make
sure that we optimize the most important aspects and make effective trade-
offs. We also design metrics which can bring to light specific issues with the
underlying technology. The metrics we use include:
1. Word Error Rate (WER):
The word error rate measures misrecognitions at the word level: it
compares the words outputted by the recognizer to those the user re-
ally spoke. Every error (substitution, insertion or deletion) is counted
against the recognizer.
Number of Substitution + Insertions + Deletions
W ER =
Total number of words
2. Semantic Quality (WebScore):
For Google search by Voice, individual word errors do not necessarily
effect the final search results shown. For example, deleting function
words like ”in” or ”of” generally do not change the search results.
Similarly, misrecognition of the plural form of a word (missing ”s”)
would also not generally change the search results.
We therefore track the semantic quality of the recognizer (WebScore)
by measuring how many times the search result as queried by the
recognition hypothesis varies from the search result as queried by a
human transcription.
Number of correct search results
W ebScore =
Total number of spoken queries
A better recognizer has a higher WebScore. The WebScore gives us a
much clearer picture of what the user experiences when they search by
voice. In all our research we tend to focus on optimizing this metric,
rather than the more traditional WER metric defined above.
3. Perplexity (PPL):
8Perplexity is, crudely speaking, a measure of the size of the set of
words that can be recognized next, given the previously recognized
words in the query.
This gives us a rough measure of the quality of the language model.
The lower the perplexity, the better the model is at predicting the next
word.
PN 1
log2 q(xi )
PPL = 2 i=1 N
4. Out-of-Vocabulary (OOV) Rate:
The out-of-vocabulary rate tracks the percentage of words spoken by
the user that are not modeled by our language model. It is important
to keep this number as low as possible. Any word spoken by our users
that is not in our vocabulary will ultimately result in a recognition
error. Furthermore, these recognition errors may also cause errors
in surrounding words due to the subsequent poor predictions of the
language model and acoustic misalignments.
5. Latency:
Latency is defined as the total time (in seconds) it takes to complete a
search request by voice. More precisely, we define latency as the time
from when the user finishes speaking until the search results appear
on the screen. Many factors contribute to latency as perceived by the
user: (a) the time it takes the system to detect end-of-speech, (b) the
total time to recognize the spoken query, (c) the time to perform the
web query, (d) the time to return the web search results back to the
client over the network, and (e) the time it takes to render the search
results in the browser of the users phone. Each of these factors are
studied and optimized to provide a streamlined user experience.
3.2 Acoustic Modeling
Acoustic models provide an estimate for the likelihood of the observed fea-
tures in a frame of speech given a particular phonetic context. The features
are typically related to measurements of the spectral characteristics of a
time-slice of speech. While individual recipes for training acoustic models
vary in their structure and sequencing, the basic process involves aligning
transcribed speech to states within an existing acoustic model, accumu-
lating frames associated with each state, and re-estimating the probability
9distributions associated with the state, given the features observed in those
frames. The details of these systems are extensive, but improving models
typically includes getting training data that’s strongly matched to the par-
ticular task and growing the numbers of parameters in the models to better
characterize the observed distributions. Larger amounts of training data
allow more parameters to be reliably estimated.
There are two levels of bootstrapping required. Once a starting corpus
is collected, there are bootstrap training techniques to grow acoustic models
starting with very simple models (i.e., single-Gaussian context-independent
systems). But there is another bootstrapping problem at the level of the
application definition. In order to collect ’real data’ matched to users actu-
ally interacting with the system, we need an initial system with acoustic and
language models. For Google search by Voice, we used GOOG-411 acous-
tic models together with a language model estimated from web query data.
There is a balance to maintain in which the application needs to be com-
pelling enough to attract users, but not so challenging from a recognition
perspective that it makes too many errors and is no longer useful. Google
makes it easy to push the boundaries of what might be possible while engag-
ing as many users as possible - partly due to the fact that delivering services
from the cloud enables us to rapidly iterate and release improved versions
of systems.
Once we fielded the initial system, we started collecting data for training
and testing. For labeling we have two choices: supervised labeling where
we pay human transcribers to write what is heard in the utterances, and
unsupervised labeling where we rely on confidence metrics from the recog-
nizer and other parts of the system together with the actions of the user
to select utterances which we think the recognition result was likely to be
correct. We started with supervised learning, aggressively transcribing data
for training, and then migrated toward unsupervised learning as the traffic
increased.
3.2.1 Accuracy of an Evolving System
The basic form of the acoustic models used are common in the literature.
The experiments shown here all use 39-dimensional PLP-cepstral [5] coeffi-
cients together with online cepstral normalization, LDA (stacking 9 frames),
and STC [3]. The acoustic models are triphone systems grown from deci-
sion trees, and use GMMs with variable numbers of Gaussians per acoustic
state. We optimize ML, MMI, and ’boosted’-MMI [8] objective functions in
training.
10Figure 6 shows the accuracy of the system on an off-line test set across
various acoustic models developed in the first year of production. Each
point on the x-axis represents a different acoustic model. These evaluations
all use the same production language model (LM) estimated toward the end
of the first year of deployment, but change the underlying acoustic model.
The test set has 14K utterances and 46K words. The metric used here
is WebScore, described above, which provides a measure of sentence-level
semantic accuracy.
Figure 6: WebScore evolution over time.
The first point on the graph shows the baseline performance of the system
with mismatched GOOG-411 acoustic models. The second point, model 2,
largely shows the impact of matching the acoustic models to the task using
around 1K hours of transcribed data. For model 3, we doubled the training
data and changed our models to use a variable number of Gaussians for
each state. Model 4 includes boosted-MMI and adds around 5K hours of
unsupervised data. Model 5 includes more supervised and unsupervised
data, but this time sampled at 16KHz.
Potential bugs in experiments make learning from negative results sketchy
in speech recognition. When some technique doesn’t improve things there’s
always the question of whether the implementation was wrong. Despite
that, from our collection of positive and negative experiments we’ve seen
11a few general trends. The first is the expected result that adding more
data helps, especially if we can keep increasing the model size. This is the
basic engineering challenge in the field. We’re also seeing that most of the
wins come from optimizations close to the final training stages. Particularly,
once we moved to ’elastic models’ that use different numbers of Gaussians
for different acoustic states (based on the number of frames of data aligned
with the state), we saw very little change with wide-ranging differences in
decision tree structure. Similarly, with reasonably well-defined final models,
optimizations of LDA and CI modeling stages have not led to obvious wins
with the final models. Finally, our systems currently see a mix of 16 kHz
and 8 kHz data. While we’ve seen improvements from modeling 16 kHz data
directly (compared to modeling only the lower frequencies of the same 16
kHz data), so far we do better on both 16 kHz and 8 kHz tests by mixing all
of our data and only using spectra from the first 4 kHz of the 16 kHz data.
We expect this result to change as more traffic migrates to 16 kHz.
3.2.2 Next Challenges
The growing user base of voice search together with Google’s computational
infrastructure provides a great opportunity to scale our acoustic models. The
inter-related challenges include how and where to add acoustic parameters,
what objective functions to optimize during training, how to find the optimal
acoustic modeling size for a given amount of data, how to field a realtime
service with increasingly large acoustic models, and how to get reliable labels
for exponentially increasing amounts of data. Early experiments in these
directions suggest that the optimal model size is linked to the objective
function: the best MMI models may come from ML models that are smaller
than the best ML models; that MMI objective functions may scale well with
increasing unsupervised data; that speaker clustering techniques may show
promise for exploiting increasing amounts of data; and that combinations of
multi-core decoding, optimizations of Gaussian selection in acoustic scoring,
and multi-pass recognition provide suitable paths for increasing the scale of
acoustic models in realtime systems.
3.3 Text Normalization
We use written queries to google.com in order to bootstrap our language
model for Google search by Voice. The large pool of available queries allows
us to create rich models. However, we must transform written form into
spoken form prior to training. This section discusses our approach to text
12normalization, i.e., the approach by which we perform that transformation.
Written queries contain a fair number of cases which require special at-
tention to convert to spoken form. Analyzing the top million vocabulary
items before text normalization we see approximately 20% URLs and 20+%
numeric items in the query stream. Without careful attention to text nor-
malization the vocabulary of the system will grow substantially.
We adopt a finite state [1] approach to text normalization. Let T (written)
be an acceptor that represents the written query. Conceptually the spoken
form is computed as follows
T (spoken) = bestpath(T (written) ◦ N (spoken))
where N (spoken) represents the transduction from written to spoken
form. Note that composition with N (spoken) might introduce multiple al-
ternate spoken representations of the input text. For the purpose of comput-
ing n-grams for spoken language modeling of queries we use the ’bestpath’
operation to select a single most likely interpretation.
3.3.1 Text Normalization transducers
The text normalization is run in multiple phases. Figure 7 depicts the text
normalization process.
Figure 7: Category/Context specific text normalization.
In the first step we annotate the data. In this phase we classify parts
(sub strings) of queries into a set of known categories (e.g time, date, url,
13location).
Once the query is annotated, it is possible to perform context-aware
normalization on the substrings. Each category has a corresponding text
normalization transducer Ncat (spoken) that is used to normalize the sub-
string. Depending on the category we either use rule based approaches or a
statistical approach to construct the text normalization transducer.
For numeric categories like date, time, and numbers it is easy enough to
describe N (spoken) using context dependent rewrite rules.
The large number of URLs contained in web queries poses some challeng-
ing problems. There is an interesting intersection between text normaliza-
tion of URL queries and segmentation of text for languages like Japanese and
Mandarin Chinese. Both require segmenting the text into its corresponding
word constituents [9]. For example, one reads the URL cancercentersofamerica.
com as “cancer centers of america dot com”. For the URL normalizer
Nurl (spoken) we train a statistical word decompounder that segments the
string.
3.4 Large Scale Language Modeling
In recent years language modeling has witnessed a shift from advances in core
modeling techniques (in particular, various n-gram smoothing algorithms) to
a focus on scalability. The main driver behind this shift is the availability of
significantly larger amounts of training data that are relevant to automatic
speech recognition problems.
In the following section we describe a series of experiments primarily de-
signed to understand the properties of scale and how that relates to building
a language model for modeling spoken queries to google.com. A typical
Voice Search language model is trained on over 230 billion words. The size
of this data set presents unique challenges as well as new opportunities for
improved language modeling.
Ideally one would build a language model on spoken queries. As men-
tioned above, to bootstrap we start from written queries (typed) to google.
com. After text normalization we select the top 1 million words. This results
in an out-of-vocabulary (OOV) rate of 0.57%. Table 2 depicts the perfor-
mance of the language model on unseen query data (10K) when using Katz
smoothing [7].
The first language model (LM) which has approximately 15 million n-
grams is used for constructing the first pass recognition network. Note this
language model requires aggressive pruning (to about 0.1% of its unpruned
size). The perplexity hit taken by pruning the LM is significant - 50%
14Order no. n-grams pruning PPL n-gram hit-ratios
3 15M entropy (Stolcke) 190 47/93/100
3 7.7B none 132 97/99/100
5 12.7B cut-off (1-1-2-2-2) 108 77/88/97/99/100
Table 2: Typical Google Voicesearch LM, Katz smoothing: the LM is trained
on 230 billion words using a vocabulary of 1 million words, achieving out-
of-vocabulary rate of 0.57% on test data.
relative. Similarly, the 3-gram hit ratio is halved.
The question we wanted to ask is how does the size of the language model
effect the performance of the system. Are these huge numbers of n-grams
that we derive from the query data important?
Figure 8: Word Error (WER) and WebScore as a function of language model
size.
Figure 8 depicts the WER and WebScore for a series of language models
increasing in size from 15 million n-grams up to 2 billion n-grams. As the
size of the language model increases we see a substantial reduction in both
the word error rate and associated WebScore [4].
15Figure 9: Word Error Rate (WER) and Perplexity as a function of language
model size.
Figure 9 depicts the WER and the Perplexity for the same set of lan-
guage models. We find a strong correlation between the perplexity of the
language model and the word error rate. In general perplexity has been a
poor predictor of the corresponding word error, so this results was rather
surprising.
3.4.1 Locale Matters
We ran some experiments to examine the effect of locale on language model
quality. We built locale specific English language models using training data
from prior to September 2008 across 3 English locales: USA, Britain, and
Australia. The test data consisted of 10k queries for each locale sampled
randomly from Sept-Dec 2008.
Tables 3, 4 and 5 show the results. The dependence on locale is surpris-
ingly strong: using an LM on out-of-locale test data doubles the OOV rate
and perplexity.
We have also build a combined model by pooling all data, with the
results shown on the last row of Table 5.
Combining the data negatively impacts all locales. The farther the locale
16Training Test Locale
Locale USA GBR AUS
USA 0.7 1.3 1.6
GBR 1.3 0.7 1.3
AUS 1.3 1.1 0.7
Table 3: Out of Vocabulary Rate: locale specific vocabulary halves the OoV
rate
Training Test Locale
Locale USA GBR AUS
USA 132 234 251
GBR 260 110 224
AUS 276 210 124
Table 4: Perplexity of unpruned LM: locale specific LM halves the PPL of
the unpruned LM
from USA (as seen on the first line, GBR is closer to USA than AUS), the more
negative the impact of clumping all the data together, relative to using only
the data from that given locale.
Training Test Locale
Locale USA GBR AUS
USA 210 369 412
GBR 442 150 342
AUS 422 293 171
combined 227 210 271
Table 5: Perplexity of pruned LM: locale specific LM halves the PPL of the
unpruned LM. Pooling all data is suboptimal.
In summary, we find that locale-matched training data resulted in higher
quality language models for the three English locales tested.
174 User Interface
”Multi-modal” features, like Google Search by Voice, provide a highly flex-
ible and data-rich alternative to the voice-only telephone applications that
preceded them. After all, they take advantage of the best aspects of both
speech and graphical modalities. However, despite their benefits, multi-
modal applications represent largely uncharted territory in terms of user
interface design. Consequently, there are many aspects that will need re-
finement or redesign. The good news is that, as more user data is gathered,
we are gaining a much better understanding of the issues. What’s more, as
more designers and developers try their hand at this type of interface this
knowledge will grow even faster. In this section, we describe just a few of the
unique characteristics that make multi-modal applications both appealing
to users as well as challenging for designers. For some of these challenges, we
present viable solutions based on user data. For others, we describe ongoing
experimentation that will ultimately lead to a better user experience.
4.1 Advantages of Multi-Modal User Interfaces
4.1.1 Spoken Input vs. Output
While speech is both convenient and effective as an input method, especially
as an alternative to typing on tiny mobile keyboards, spoken output is very
limited given its sequential nature. Consider the following examples from
GOOG-411. The first involves a search for a specific restaurant named
”Patxi’s Chicago Pizza” while the second shows a search for a common
restaurant category, namely ”pizza”.
GOOG411: Calls recorded... Google! Say the business and the city and state.
Caller: Patxi’s Chicago Pizza in Palo Alto.
GOOG411: Patxi’s Chicago Pizza, on Emerson Street. I’ll connect you...
Figure 10: Specific business search with GOOG-411.
As shown in Figure 10, GOOG-411 handles specific name queries very
efficiently, quickly connecting the caller to the business usually in about 30
seconds. However, when a caller specifies the business category as opposed
to a specific name, as in Figure 11, it takes more than a minute just to
hear the first set of choices. If the caller chooses to further ”browse” the
list and perhaps listen to the details of one or two choices, the call time will
be doubled. If it goes this far, however, there is a good chance the user
18GOOG411: Calls recorded... Google! Say the business and the city and state.
Caller: Pizza in Palo Alto.
GOOG411: Pizza in Palo Alto... Top eight results:
Number 1: Patxi’s Chicago Pizza, on Emerson Street
To select number one, press 1 or say ”number one”.
Number 2: Pizza My Heart, on University Avenue.
Number 3: Pizza Chicago, on El Camino Real.
[...]
Number 8: Spot a Pizza Place: Alma-Hamilton, on Hamilton Avenue
Figure 11: Business category search with GOOG-411.
will hang up without making a selection. It takes a great deal of time and
concentration to process spoken information, and most user’s pain threshold
is fairly low. While not conclusive, the GOOG-411 data supports this, as
specific business name queries outnumber category searches more than five
to one.
4.1.2 A Picture Paints a Thousand Words
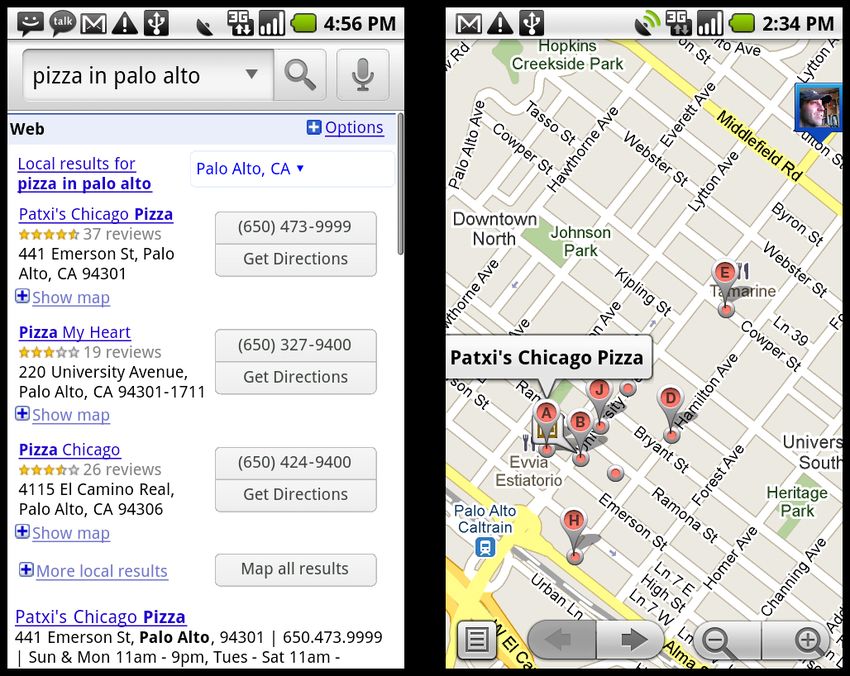
Now consider the screens in Figure 12 which show the results displayed for
the same ”Pizza in Palo Alto” query using Google’s voice search feature on
Android. Not only does the user receive more information, but the graphical
display allows much of it to be processed in parallel, saving a great deal of
time.
The screen on the left shows the initial page displayed after recognition is
complete, which includes the recognition result (pizza in palo alto) as well as
the ”n-best alternatives” (additional hypotheses from the recognizer) which
are viewable by tapping on the phrase to display a drop-down list (note the
down arrow on the right-hand side of the text field). The user can initiate
a new search by voice or by typing. As shown, the first three results are
displayed in the browser, but tapping on ”Map all results” delivers the full
set of results in Google Maps, as shown on the right. The maps interface
shows the relative location of each listing as well as the user’s contacts (note
the blue box in the upper right-hand corner). Tapping the business name
above the map pin provides more details.
19Figure 12: Category search using Google search by Voice.
4.1.3 Flexibility and User Control
Another general advantage of mobile voice search is the flexibility and con-
trol it affords users.
Unlike with voice-only applications, which prompt users for what to say
and how to say it, mobile voice search is completely user-initiated. That
is, the user decides what to say, when to say it and how to say it. There’s
no penalty for starting over or modifying a search. There’s no chance of an
accidental ”hang-up” due to subsequent recognition errors or timeouts. In
other words, it’s a far cry from the predetermined dialog flows of voice-only
applications.
As we discussed earlier, spoken output can be hard to process, but given
their flexibility, multi-modal applications can still provide spoken output
when it’s convenient. Consider queries like ”Weather in Palo Alto Cali-
fornia”, ”Flight status of United Airlines 900”, ”Local time in Bangalore”,
”Fifty pounds in US dollars”. These types of queries have short answers,
exactly the kind suited for spoken output, especially in eyes-busy contexts.
Still, the flexibility associated with multi-modal applications turns out
to be a double-edged sword. More user control and choices also leads to
more potential distractions. The application must still make it clear what
20the user can say in terms of available features. For example, in addition
to web search, Google’s Android platform also includes speech shortcuts for
its maps navigation feature, e.g., ”Navigate to the Golden Gate Bridge”, as
well as voice dialing shortcuts such as ”Call Tim Jones.” More fundamental
is making sure users know how to use the speech recognition feature in the
first place given all the features available. Designers are faced with a series
of hard questions: How should voice search be triggered? Should it be a
button? A gesture? Both? What kind of button? Should it be held and
released? Tapped once? Tapped twice? What kind of feedback should be
displayed? Should it include audio? We address these and other questions
in the subsections that follow.
4.2 Challenges in Multi-Modal Interface Design
4.2.1 Capturing the Utterance: Buttons, Actions and Feedback
Capturing clear and complete user utterances is of paramount importance
to any speech application. However, even if everything is done to ensure
that the signal is clean and the microphone is working properly, there are
factors in the user interface itself which will affect the interaction.
On the face of it, pressing a button to initiate speech seems pretty simple.
But once you consider the types of buttons available on mobile devices as
well as the actions possible for each type of button, and further the size of
the button and where it’s placed on the screen, things become more complex.
Google uses different strategies depending on the device.
Devices running Android have the microphone button on the right-hand
side of the search box typically located at the top of the home touch screen.
This is similar to the button on Google Mobile App (GMA) for the iPhone,
which also uses a touch screen. Both are shown in Figure 13.
As shown above, both microphone buttons are relatively small, which
raises the obvious question as to whether a bigger button would make it
easier for users to trigger voice search or perhaps users would more easily
discover the feature in the first place. Alternatively, the button could remain
the same size but with a larger target area to trigger the action. This is
currently the case in the GMA interface, shown on the right. So far, there
is no evidence that the larger target area is making it any easier to trigger
as compared to the Android button.
Then there’s the placement of the button. In the examples shown above,
the upper right-hand corner location may not be a factor when the user holds
the phone with one hand and presses the button with the other. However,
21Figure 13: Android Nexus One and Google Mobile App (GMA) on iPhone.
some users prefer to initiate speech with one hand. In this case, it may make
a difference whether the user is right or left handed. Other such ergonomics-
based suggestions have been proposed such as locating a larger button across
the bottom of the screen so that users can hold the phone in one hand and
more easily press the button with their thumb.
It should also be pointed out that there is a physical ”search” key on
all Android phones. A regular press (one tap) simply brings up the search
widget from any context (i.e., no matter which app the users has open).
However, long-pressing this button (holding it down for a second or so)
brings up voice search. The long press is a common feature for Android as
it is used in many contexts, that is, not just on physical buttons but on the
touch screen itself. Note that this is not the same as the hold-and-speak,
walkie-talkie action which is used for the BlackBerry and S60 versions of
GMA, which we discuss later.
4.2.2 Button Actions
While most mobile speech apps require the user to press a button to initiate
recording, only some require the user to manually stop the recording after
speaking by pressing it again, or pressing another button. In the examples
22discussed in Figure 2 above, both applications make use of an ”endpointer”,
which is software that automatically determines when the speaker’s utter-
ance is complete (i.e., it finds the ”end point”). This is the same strategy
used in most speech-based telephone applications. While endpointers may
be convenient for mobile speech, they seem to be better suited for appli-
cations like web search or voice commands in which the input is shorter,
generally one phrase. This is because silence is a primary factor used to de-
termine the end point of the utterance. In this way, applications that must
tolerate longer periods of silence between phrases as in dictation or singing
often require the user to tap the button once to begin and then a second
time to manually end recording.
Another way to manually endpoint is to press and hold the button while
speaking. This is based on the ”walkie talkie” model. GMA employs this
strategy on platforms with physical buttons, namely the BlackBerry as well
as S60 platform phones. While the press-and-hold strategy seems intuitive
and certainly has its fans, a common problem is the tendency to release the
button before finishing the utterance. This premature endpointing in turn
causes the utterance to be truncated, usually resulting in misrecognition.
4.2.3 Gesture-Based Speech Triggers
Putting buttons aside for the moment, gesture-based triggers for initiating
speech are another strategy which has been implemented in the iPhone
version of GMA, as shown on the right-hand screen in Figure 13 above.
As the home screen hint says, voice search will trigger without a button
press when the user simply raises the phone to his or her ear as this type of
movement is detected by tapping into the phone’s accelerometer. While it
turns out that many users like this feature (fully one third of voice searches
on GMA for iPhone are triggered by this gesture), others still don’t realize it
exists despite the rather explicit hint shown on the splash screen. A Google
internal study also showed that some users, while aware of the feature, prefer
to keep their eyes on the screen at all times, something that’s not possible
when using this gesture.
4.2.4 Feedback
Even when users understand how to initiate speech, subsequent user inter-
face feedback plays an important role. For example, in an early pre-launch
design of voice search for GMA for iPhone, the word ”listening” was used
on the screen that appeared after the user pressed the microphone button.
23The designers assumed users would understand that ”listening” clearly in-
dicated that it was time for the user to speak. However, in several cases, the
participants intently watched the ”listening” screen but said nothing. When
asked what the application might be doing, the users responded that device
was ”listening” to somehow calibrate the ambient noise–making sure noise
levels were right. As a result, the application took a more direct approach.
As shown in Fig 14, all of Google’s mobile voice features begin with ”Speak
now”. In addition, they give clear feedback on the level of the speaker’s
voice indicated in the Android case below by the microphone filling up as
the level increases.
Figure 14: Feedback during speech input.
Making sure the recognizer at least starts with a clean and complete
recording of what the user actually said is key for any speech application.
As we’ve seen, this is far from automatic and many strategies are currently
in use. It may be that some are equally effective and address different user
preferences. However, we are also likely to discover that some are simply
more effective.
244.3 Correction: Displaying Alternative Recognition Hypothe-
ses
4.3.1 The N-Best List
Speech recognition isn’t perfect and designing speech-based applications re-
quires paying special attention to these inevitable errors. One important
design puzzle involves making what is referred to as the ”n-best list” more
accessible and visible to users. This is a list of alternative recognition hy-
potheses returned by the recognizer. For example, suppose the user says
”Holy day in South America”. The recognizer may return ”holiday inn
south america” as the top hypothesis but include what the user actually
said in the list. It may also be the case that what the user said isn’t in the
list but there are alternatives that are sufficiently related. In these scenarios,
making sure the n-best is easily accessible saves the user the frustration of
having to re-speak the utterance and fosters a more positive impression of
the application in general.
4.3.2 Design Strategies
Figure 15 below shows how Android displays the n-best list. A similar
strategy is used in GMA for iPhone as well as for the BlackBerry and S60
platform.
As shown on the left, only the top hypothesis is displayed on the results
screen. The down-arrow indicator is used to bring attention to the n-best
list which is displayed if the user taps anywhere inside the text field. The
right-hand screen shows the list displayed. As it turns out, this design isn’t
effective as we’d like as only a small percentage of users are tapping on the
phrase to reveal the list even when it would be helpful (i.e., when it contains
the correct alternative or a related phrase).
4.3.3 Possible Solutions
There are several reasons for this. It may be that the drop down list isn’t
obvious and we need a more prominent hint. Or it may be that users are
aware of the drop down but are not sure what the list is for. That is, it could
be that users don’t realize that tapping on the alternative would initiate a
new search. It could also be that users don’t find it’s worth the trouble to
tap the list just to see if the alternative is there and decide they might as
well just re-speak the phrase.
25Figure 15: Displaying n-best on Android.
Possible solutions will only emerge as we experiment with alternative
designs. One idea is to make the n-best list more prominent by displaying a
pop-up hint or even flashing the list for a second or two as the results load.
However, we must also make sure not to burden users when the list is irrele-
vant either because the correct alternative isn’t there or the top hypothesis
is already correct. In general speed is king for mobile user interfaces and
we try to do as little as possible to get in the way of displaying the results.
This problem of relevance might be solved by taking advantage of the confi-
dence score returned with the results. That is, the recognizer returns a score
roughly indicating ”how sure” it is the phrases it returns are what the user
said. In this way, the design could more aggressively draw attention to the
list when the confidence is lower and leave it as is otherwise. This experi-
ment is in fact underway now but we’ll have to wait and see if it addresses
all the user interface factors at play.
The problem of correction becomes even more complex when designing
for dictation interfaces, where the correction of one phrase might affect the
compatibility of preceding or subsequent phrases, for example. But dictation
goes beyond the scope of this discussion.
264.4 Beyond Search
4.4.1 Non-Search Voice Commands
Subsequent releases of the Android platform included new voice shortcuts
using the same interface they’d used for search (i.e., the same mic button
and initial dialog screens). For example ”Navigate to the Golden Gate
Bridge” jumps straight to the Google Maps navigation feature and begins
giving directions as though the user had tapped through and entered the
destination by hand. Other commands like ”Call John Smith at home” or
”Map of Chelsea, Manhattan” likewise provide quick and easy ways to access
embedded application functions just by speaking a phrase.
4.4.2 Challenges and Possible Solutions
This new functionality comes with a price, however. To quickly launch the
features, particular phrases like ”navigate to”, ”map of”, ”directions to”,
”call”, etc. were mapped to each shortcut. However, it’s well known that
users tend to paraphrase when faced with formulating the command on the
fly especially of the targeted phrase is something unfamiliar or that doesn’t
match their own language patterns. For example, just because I once learned
that the phrase ”navigate to” will trigger the Google Maps feature in one
step doesn’t mean I will remember that exact phrase when I need it. In fact,
I am likely to substitute the phrase with a synonymous phrase like ”Take
me to” or ”Drive to”.
There are short-term and longer terms solutions for this. First, similar
to the n-best list situation, contextually significant and visually prominent
hints can help a great deal to remind users what the working phrases are.
Subsequent designs for these features on Android will in fact include them.
However, does this go far enough?
4.4.3 Predicting User Intent
Rather than requiring users to memorize specific phrases, a better solution
would be for users to choose there own shortcut phrases. That is, they could
say what they wanted and it would ”just work”. Of course, this is easier
said than done. The linguistic possibilities are endless and semantic parsing
capabilities would be required to even begin to return reasonable candidates
for what the user might have said. What’s more, unlike search, in this case
you would be combining possible results for very different actions. ”Call of
the Wild” is a search while or ”Call Owen Wilde” is a contact dialing action,
27yet the two sound very similar. At the very least the application would need
to display disambiguation lists much more often than it currently does so
that the user could choose the option that he or she intended (if it’s there)
and reinforce the feedback loop for better results. However this would add
an extra step before results could be displayed or the action could be carried
out.
Automatically knowing what users mean based on speech input is clearly
a longer term project. However, from a user’s perspective it isn’t likely to
be thought of as very different from what is currently offered in mobile apps.
Think of Google Search by Voice: Users already say whatever phrase they
want and are given a list of choices, often with the one they wanted listed
right at the top.
5 User Studies
What are people looking for when they are mobile? What factors influence
them to choose to search by voice or type? What factors contribute to user
happiness? How do we maintain and grow our user base? How can speech
make information access easier? In this section we explore these questions
based on analysis of live data. We discuss the behavior of our users and how
these impact our decisions about technology and user interfaces.
5.1 What do Users Choose to Speak?
In this section, we discuss the search patterns of voice search users. We
investigate the use cases for search by voice, and how they differ from other
methods of communicating a query to a search engine. We address these
questions empirically, by looking at the server logs across various search
platforms and input modalities.
Our data set consists of the search logs for all users of GMA on all mobile
platforms in the United States who issued queries during a 4-week (28-day)
period during the summer of 2009. For a baseline, we also analyze search
queries to the “desktop” (i.e., non-mobile) version of google.com.
In general we find the distribution of voice search queries to be surpris-
ingly similar to the distributions for both mobile web search and desktop
queries, but there are a number of interesting differences.
285.1.1 By Topic
We aggregated a recent month of our search server logs by the broad topic of
the query using an automatic classification scheme described in Kamvar and
Baluja [6]. The chart below illustrates the relative difference between spoken
and typed queries for eight popular categories. Each bar is normalized so
that 1.0 represents the frequency of that category for desktop websearch.
Figure 16: Category of query.
Queries in the ”Local” category are those whose results have a regional
emphasis. They include queries for business listings (e.g., “Starbucks”) but
can also include places (e.g., “Lake George”) or properties relating to a place
(“weather Holmdel NJ”, “best gas prices”). Food & Drink queries are self-
descriptive and are often queries for major food chains (e.g., “Starbucks”),
or genres of food & drink (e.g., “tuna fish”, “Mexican food”). Both of these
query types likely relate to a user’s location, even if there is no location
specified in the query (this facilitated by the My Location feature which
will automatically generate local results for a query). Shopping and Travel
queries are likely to relate either to a user’s situational context (their primary
activity at the time of querying), or to their location. Example Shopping
queries include “Rapids water park coupons” which may indicate the user
is about to enter a water park, and “black Converse shoes” which may
indicate she would like to compare shoe prices. Queries such as “Costco”
and “Walmart” also fall in the Shopping category, but likely relate to a user’s
location, as the My Location feature automatically generates local results for
these queries. Likewise, Travel queries such as “Metro North train schedule”
and “flight tracker” may relate to a user’s situational context, and queries
29such as “Las Vegas tourism” may relate to their location.
In summary, an examination of the category distribution by input method
of the query shows the following salient differences:
• Voice searches are more likely to be about an ”on-the-go”
topic: Mobile queries, and voice searches in particular, have a much
greater emphasis on categories such as food and drink and local busi-
nesses.
• Voice searches are less likely to be about a potentially sen-
sitive subject: Categories that consist of sensitive content (adult
themes, social networking, and health) are avoided by voice search
users, relatively speaking. This may be because they wish to preserve
their privacy in a public setting.
• Voice searches are less likely to be for a website that requires
significant interaction: Voice searches are relatively rarely about
the sorts of topics that require significant interaction following the
search, such as games and social networking.
5.1.2 By Other Attributes
We built straightforward classifiers to detect whether a query contains a
geographical location, whether a query is a natural language question (such
as ”Who is the President of the United States?”), and whether the query is
simply for a URL such as ”amazon.com”. The results for the same sample
of query data used above is illustrated in the following chart:
Queries that include a location term such as ”Mountain View” are more
popular in voice search than in typed mobile search, reinforcing the result
above about the broad category of local services being more popular.
Question queries, defined simply as queries that begin with a ”wh” ques-
tion word or ”how”, are far more popular in the voice context. This may
reflect the tendency of the speech user to feel more like they’re in a dialog
than issuing a search engine query. Another explanation is questions of this
sort arise more frequently in an on-the-go context (such as ”settling a bet”
with friends about a factual matter).
Queries for URLs such as ”amazon.com” or ”times.com” are rare relative
to desktop search, and rarer still relative to typed mobile queries. This
reflects the fact that users tend to want information directly from their
voice search experience; they are far less likely to be in a position to interact
with a web site.
30Figure 17: Attribute of query.
Reinforcing this, we have found that users are less likely to click on links
returned from voice search queries than they are to click on links returned
from desktop search queries, even accounting for recognition errors. This
appears to be primarily because users more often pose queries that can be
answered on the results page itself. Also, given current mobile network
speeds, users may be reluctant to wait for an additional web page to load.
Finally, voice search users are more likely to be in a context in which it’s
difficult to click at all.
Finally, we find that short queries, in particular 1 and 2 word queries,
are relatively more frequent in voice searches than in typed searches, and
longer queries (¿ 5 words) are far rarer. As a result, the average query
length is significantly shorter for spoken queries: 2.5 words, as compared
with 2.9 words for typed mobile search and 3.1 words for typed desktop
search. This result may seem counterintuitive, given that longer queries
should be relatively easier to convey by voice. There are numerous possible
explanations for this that we have not fully explored. For example, users may
avoid longer queries because they are harder to “buffer” prior to speaking;
or, the popular queries within the topics favored by voice search users may
themselves be shorter.
31You can also read