TOWARDS 5G: SCENARIO-BASED ASSESSMENT OF THE FUTURE DEMAND FOR MOBILE TELECOMMUNICATIONS INFRASTRUCTURE - Edward Oughton, Zoraida Frias, Tom ...
←
→
Page content transcription
If your browser does not render page correctly, please read the page content below
Cambridge Judge Business School

Working Paper No. 04/2017 (revised)

TOWARDS 5G: SCENARIO-
BASED ASSESSMENT OF THE
FUTURE DEMAND FOR
MOBILE
TELECOMMUNICATIONS
INFRASTRUCTURE
Edward Oughton, Zoraida Frias, Tom Russell,
Douglas Sicker, David D Cleevely
Cambridge Judge Business School Working Papers

These papers are produced by Cambridge Judge Business School, University of Cambridge.
They are circulated for discussion purposes only. Their contents should be considered
preliminary and are not to be reproduced without the authors' permission.

Cambridge Judge Business School author contact details are as follows:
Dr Edward Oughton
Cambridge Judge Business School
University of Cambridge
Trumpington Street, Cambridge CB2 1AG
Email: e.oughton@jbs.cam.ac.uk

Please address enquiries about the series to:
Research Manager
Cambridge Judge Business School
University of Cambridge
Trumpington Street, Cambridge CB2 1AG
Email: research-support@jbs.cam.ac.uk
Tel: 01223 760546
Confidential Manuscript Submitted to Technological Forecasting and Social Change

 Towards 5G: Scenario-based Assessment of the Future Supply and
 Demand for Mobile Telecommunications Infrastructure
 Edward Oughton1*, Zoraida Frias2, Tom Russell3, Douglas Sicker4, David D. Cleevely5
 1
 Cambridge Judge Business School, University of Cambridge, Cambridge, UK, 2Information
 Processing and Telecommunications Center, Universidad Politécnica de Madrid, Madrid, Spain,
3
 Environmental Change Institute, University of Oxford, Oxford, UK, 4 School of Computer Science,
 Carnegie Mellon University, Pittsburgh, USA, 5Raspberry Pi Foundation, Cambridge, UK.

* Corresponding author: e.oughton@jbs.cam.ac.uk at Cambridge Judge Business School, University of Cambridge, Trumpington Street,
 Cambridge, UK, CB2 1AG

 1

Confidential Manuscript Submitted to Technological Forecasting and Social Change

Acknowledgements

Edward Oughton, Zoraida Frias, Tom Russell and David Cleevely would like to express their gratitude
to the UK Engineering and Physical Science Research Council for funding via grant EP/N017064/1:
Multi-scale InfraSTRucture systems AnaLytics (Mistral). Zoraida Frias would like to thank the
Universidad Politécnica de Madrid for their support through the mobility program scholarship.
Additionally, we would like to recognise the contribution of all participants at the EPSRC Mistral
workshop on The Future of Digital Communications at St. Catharine’s College, Cambridge, on 1st
February 2017. The authors have no competing interests.

 2
Confidential Manuscript Submitted to Technological Forecasting and Social Change

Abstract
Moving from 4G LTE to 5G is an archetypal example of technological change. Mobile Network
Operators (MNOs) who fail to adapt will likely lose market share. Hitherto, qualitative frameworks
have been put forward to aid with business model adaptation for MNOs facing on the one hand
increasing traffic growth, while on the other declining revenues. In this analysis, we provide a
complementary scenario-based assessment of 5G infrastructure strategies in relation to mobile traffic
growth. Developing and applying an open-source modelling framework, we quantify the uncertainty
associated with future demand and supply for a hypothetical MNO, using Britain as a case study
example. We find that over 90% of baseline data growth between 2016 and 2030 is driven by
technological change, rather than demographics. To meet this demand, spectrum strategies require the
least amount of capital expenditure and can meet baseline growth until approximately 2025, after which
new spectrum bands will be required. Alternatively, small cell deployments provide significant capacity
but at considerable cost, and hence are likely only in the densest locations, unless MNOs can boost
revenues by capturing value from the Internet of Things (IoT), Smart Cities or other technological
developments dependent on digital connectivity.
Key words
5G; Mobile telecommunication; Scenario; Decision support; Rollout; Cost modelling; Strategic
management

 3
Confidential Manuscript Submitted to Technological Forecasting and Social Change

1 Introduction
The mobile telecommunications industry has a dynamic competitive environment due to widespread
and sustained technological change (Curwen and Whalley, 2004; Han and Sohn, 2016). We experience
generational upgrades on at least a decadal basis, requiring Mobile Network Operators (MNOs) and
other market actors to have an understanding of future digital evolution. Even market leaders with
significant advantages in the telecommunications industry can fall behind if they are unable to keep
abreast of new developments and actively adapt existing market strategies for new conditions
(Asimakopoulos and Whalley, 2017). Indeed, the digital ecosystem is experiencing significant
disruption from new digital platforms and services (Ruutu et al. 2017; Wang et al. 2016), with
substantial ramifications for MNOs as revenues have been either static or declining (Chen and Cheng,
2010), and these conditions exist alongside the increasing operational costs of serving ever increasing
mobile data traffic. Hence, in wireless telecoms, MNOs must be aware of both opportunities and threats
arising from technological change, particularly when moving from one generation to the next (du Preez
and Pistorius, 2002; Salmenkaita and Salo, 2004).
Telecommunications are essential for modern economic activities, as well as for a fully functioning
society. These technologies can enable economic growth through new content, services and applications
(Hong, 2017; Krafft, 2010), while also enabling productivity improvements throughout the economy
by lowering costs. The ability of Information Communication Technologies (ICT) to interchange data
via telecommunications networks is essential for the economic development of the digital economy
(Wymbs, 2004; Cheng et al. 2005; Kim, 2006), and the range of industrial sectors it comprises. New
cross-sectoral advances have also emerged, such as the Internet of Things (IoT) and Smart Cities (Yang
et al. 2013; Hong et al. 2016; Bresciani et al. 2017; Almobaideen et al. 2017), which rely on the
availability of digital connectivity for smartphones, sensors and other communications devices. Hence
the signal quality of mobile telecommunications infrastructure is an ever more important factor,
requiring operators to focus on both network reliability and capacity expansion techniques to meet
consumer and industrial requirements (Shieh et al. 2014). This is challenging however, given the weak
revenue growth currently experienced, leaving only a modest appetite for infrastructure investment.
Scenario planning is a foresight tool that can be applied to understand how changes in the external
environment may affect current or potential market strategies (Ramirez et al. 2015). On the one hand,
this approach can be used to foster learning and the adaptive skills of an organisation (Favato and
Vecchiato, 2016), while on the other, it supports high-level strategic decision-making (O’Brien and
Meadows, 2013; Parker et al. 2015). Quantified approaches allow one to measure the impact of external
drivers using systems modelling. Importantly, the choice of how much infrastructure is required, when,
and where, is seen to be a problem of decision-making under uncertainty (Otto et al. 2016).
The aim of this paper is to quantify the uncertainty associated with the future demand for mobile
telecommunications infrastructure, to test how different strategies perform over the long term. We focus
specifically on capacity expansion via 5G mobile telecommunications infrastructure. In undertaking
this task, the research questions which we endeavour to answer are as follows:
 1. How will the combination of growing data usage and demographic change affect the demand
 for mobile telecommunications infrastructure?
 2. How do different supply-side infrastructure options perform when tested against future demand
 scenarios?
 3. What are the ramifications of the results, and how do they relate to the wider technological
 change literature, particularly in mobile telecommunications?
As the ‘5G’ standard is still to be determined, the approach taken in this paper is to extrapolate LTE
and LTE-Advanced characteristics, and to include those identified frequency bands that may be used
for 5G rollout over the next decade, in relation to changing demand. Hence, a spectrum-based strategy

 4
Confidential Manuscript Submitted to Technological Forecasting and Social Change

includes integrating 700 and 3500 MHz on existing brownfield macrocellular sites, as these will be the
newly available frequency bands to MNOs in Europe. Importantly, we also test the impact of increasing
network densification using a small cell deployment strategy, as this is a key technological enabler for
delivering expected 5G performance.
In the next section, a literature review will be undertaken in relation to the future demand for
telecommunications services, as well as the current state-of-the-art of telecommunications
infrastructure assessment. In Section 3 the methodology will be outlined, and the results reported in
Section 4. The findings will be discussed in Section 5, and finally conclusions will be stated in Section
6.
2 Literature Review
Although the full specification of ‘5G’ is yet to be determined, it is likely that the technical requirements
will include delivering peak rates of 20 Gbps per user in low mobility scenarios, user experienced data
rates of 100 Mbps, radio latency of less than 1 ms, significantly higher area traffic capacity (1000 times
LTE), and a massive number of devices (ITU, 2015; Shafi et al. 2017). This will provide enhanced
mobile broadband, massive machine type communications, and ultra-reliable low latency
communications. While new generations of mobile technology can be dominated by marketing spin
(Shin et al. 2011), there is consensus that network densification via smaller cells will be a key technique
for 5G networks (Andrews et al. 2014). As the research questions outlined in this paper require a focus
on technological forecasting, the relevant literature will now be reviewed, before the techno-economic
literature on next generation mobile networks is evaluated.
Technological Forecasting in Telecommunications
Modelling and simulation methods are frequently combined with scenario planning approaches to test
potential telecommunication strategies. As well as for strategic purposes, MNOs also often rely on
demand forecasts methods to justify internally and externally the considerable investments required to
move into new markets (see Fildes, 2002; 2003). This is often related to generational upgrades of
technologies, where forecasts can help to understand, for example, how different factors affect the
demand for future mobile wireless communications services (Frank, 2004). Commonly used methods
include time-series econometric approaches (Lee, 1988), innovation diffusion modelling (Jun et al.
2002; Venkatesan and Kumar, 2002; Meade and Islam, 2006; Michalakelis et al. 2008; Chu and Pan,
2008) and technological forecasting (Meade and Islam, 2015). Systems dynamics approaches have also
been applied to model the underlying dynamics of mobile telecommunications diffusion (Mir and
Dangerfield, 2013).
Generational changes in mobile wireless technology also provide opportunities for new market niches
(Nam et al. 2008), but this can often lead to failure (Park et al. 2015). Shin et al. (2011) focus on the
socio-technical dynamics of moving from 3G to 4G LTE telecommunications, and study how 4G
strategies have been formed, shaped and enhanced. Importantly, the transition between different
generations of mobile technologies requires executives to adapt to a dynamically evolving industrial
landscape as technology and regulation both change.
Ghezzi et al. (2015) highlight the rapid transformation taking place in the telecommunications industry
due to technological change and develop a framework to support MNOs operating in highly competitive
markets. Using structured interviews with top- and middle-managers from four Italian MNOs, the
authors identify the key drivers of disruptive change and the implications for their current business
models. Increasing data traffic and decreasing voice revenues are the key drivers of disruptive change.
Indeed, the emergence of Voice-over-IP (VoIP) services is one key driver of decreasing voice-related
revenues, as users substitute paid voice services via an MNO for free VoIP access over the Internet (e.g.
via Skype), leading the infrastructure owner to lose revenue (Kwak and Lee, 2011). MNOs have
addressed this by bundling voice and SMS with data (Stork et al. 2017).

 5
Confidential Manuscript Submitted to Technological Forecasting and Social Change

The analysis of digital adoption and the diffusion forecasting of mobile telephony has received
significant attention in the technological change literature (Islam et al. 2002; Vicente and Gil-de-
Bernabé, 2010; Kim et al. 2010; James, 2012; Kyriakidou et al. 2013; Mayer et al. 2015; Pick and
Nishida, 2015; Park et al. 2015; Islam and Meade, 2015; Sultanov et al. 2016; Sadowski, 2017), but
relatively little focus has been placed on how this may affect mobile traffic growth, operator cost and
competitiveness. However, in the rapidly growing ICT market, the forecasting of new technologies is a
difficult yet necessary endeavour for operators and not something that should be purely left for the
engineering domain as it has important commercial strategy ramifications.
In one such study, Lee et al. (2016) forecast mobile broadband traffic demand in Korea, using a device-
based approach and a three-round Delphi expert elicitation process. Scenario analysis was applied to
reflect uncertainty in the future dynamics of the sector, with ‘optimistic’, ‘neutral’ and ‘pessimistic’
scenarios being developed. Unsurprisingly, the conclusion was that mobile traffic will continue to
increase, but the authors quantify by how much, and Korea is expected to see an increase to
approximately 286 Petabytes per month by 2020, which is six times greater than 2012. This is
approximately 6 GB of monthly mobile traffic per user.
Velickovic et al. (2016) develop and apply a forecasting model for the deployment of fixed Fibre-To-
The-Home (FTTH) telecommunication infrastructure, where demand forecasting is used to enable the
dimensioning of necessary network resources. This is essential for operators to understand which
investments are required, spatially and temporarily, to meet evolving demand. The network economics
of telecommunications networks make it extremely challenging to service low demand areas, as there
are inevitably large fixed capital costs in deployment which need to be shared across many users. Hence,
demand stimulation is an activity that needs to take place simultaneously when there is poor take-up, to
encourage more favourable scale economies (Yoo and Moon, 2006).
There has been relatively little emphasis on how infrastructure, a key mediator in the global economy,
affects firm strategy. Often those studies that have addressed this important topic have focused on expert
elicitation, Delphi approaches to scenario development or case studies (Schuckmann et al. 2012; Raven,
2014; Bolton and Foxon, 2015; Roelich et al. 2015; Labaka et al. 2016), which are valuable in
generating understanding, but can be complemented by modelling, simulation and the testing of ‘what
if’ scenarios (Huétink et al. 2010; Zani et al. 2017).
Techno-economic assessments of next generation mobile networks
Undertaking analysis for the UK telecommunication regulator Ofcom, Real Wireless (2012) examine
the impact of the 700 MHz band in meeting growing demand for wireless broadband capacity. Different
traffic demand scenarios were developed and tested, focusing on variations in mobile traffic by device
penetration and type. Demographic change over time was not included in this analysis for the period
2012-2030 (such as fertility, mortality and migration), despite it potentially having a multiplier effect,
as large increases in the population will affect device growth and traffic demand. Ultimately, the cost
of 5G systems will be determined by the large number of new components required to operate enhanced
network infrastructure, including basestation units and backhaul transmission, as well as the associated
cost of site installation, site operation, network optimisation and maintenance, and edge cache
placement (Yan et al. 2017).
With the rapid growth of data and additional required network capacity, the solution to this is not merely
an engineering domain issue, but also increasingly a techno-economic problem (Zander, 2017). While
some of the underlying difficulties are highly technical, including dealing with interference and noise,
escalating energy consumption, and using available bandwidth more efficiently, many of them are
economic, including the cost of a dense small cell layer. Hence, there is a growing need for disruptive
business model innovation to provide technically scalable solutions for enhanced wide-area capacity,
while remaining within certain energy consumption and cost constraints.

 6
Confidential Manuscript Submitted to Technological Forecasting and Social Change

Breuer et al. (2016) undertook a techno-economic analysis of 5G fronthaul and backhaul, focusing on
the convergence benefits with fixed access (ranging from FTTH to Fibre-To-The-Cabinet). Different
‘massive 5G’ small cell deployments are explored as a broadband data layer coexisting with a macro
basestation network. Moreover, economic analysis of ‘5G superfluid networks’ by Chiaraviglio et al.
(2017) assessed capex, opex, Net Present Value (NPV) and Internal Rate of Return (IRR) for two case
study areas, where operators were migrating from legacy 4G networks, in Bologna, Italy and San
Francisco, USA. The analysis found that the cost of deploying dedicated hardware was higher than the
cost of deploying commodity hardware running virtual resources. In a profit analysis, the authors also
found that the monthly subscription fee could be kept sufficiently low, while still generating profit
overall.
An engineering-economic analysis of China’s Shanghai region by Smail and Weijia (2017) used cost-
benefit modelling to assess the deployment of 5G technologies in relation to legacy 4G mobile
networks. Comparison analysis was performed of price, cost, coverage and capacity for different
scenarios using heterogeneous basestation types. This included the development of a pricing model.
Key findings include the most cost-effective solution being macro cells with improved carrier
aggregation, and the use of existing sites being critical to keep down costs. Having reviewed the
literature on the modelling of mobile wireless infrastructure, we will now focus on Britain as a case
study.
Britain as a Case Study Example
In 2016, the then Chancellor George Osborne tasked the National Infrastructure Commission with
advising ‘the Government on what it needs to do to become a world leader in 5G infrastructure
deployment, and to ensure that the UK can take early advantage of the potential applications of 5G
services’ (Osborne, 2016:1). Consequently, the UK’s 5G strategy was released in 2017, entitled ‘Next
Generation Mobile Technologies: A 5G Strategy for the UK’ (DCMS and HM Treasury, 2017),
containing content on the economic case, regulation, governance, coverage and capacity, security,
spectrum and technology. The UK is also embarking on its first comprehensive National Infrastructure
Assessment, which will include the supply and demand of mobile telecommunications (National
Infrastructure Commission, 2017).
Both the 5G Strategy and National Infrastructure Assessment are important market drivers reflecting
that some consumers are unhappy with the current state of telecommunications in the UK. For example,
the British Infrastructure Group (2016), consisting of over 90 cross-party Members of Parliament, have
supported calls for reform to the sector in a recent mobile coverage campaign, based on the elimination
of areas of no coverage (known as ‘not-spots’). In terms of existing provision, recent analysis by the
regulator Ofcom (2016) found that 4G coverage by all four operators now reaches 72% of premises
indoors and only 4% of the premises are not covered by 4G signal from any operator. However, only
40% of the geographic area is covered by every operator. Indeed, some feel the experience differs from
the reported voice and data coverage statistics leading to disgruntled users, with this therefore becoming
a hot topic in the media. OpenSignal’s (2017) State of LTE report shows that the UK ranks 43rd globally
in terms of 4G availability and 39th in terms of speed (subject to the usual speed test caveats).
The concern is that not enough digital access infrastructure is being deployed, potentially leading to
businesses and consumers being dissatisfied. In some cases, demand could exceed supply, which may
have potential economic impacts as telecommunications underpin economic activities with bottlenecks
leading to productivity issues. Both the National Infrastructure Assessment and the UK’s 5G Strategy
aim to eliminate or reduce connectivity problems, but there are still a limited range of metrics to help
support future decision making in both industry and government, which we aim to address in this
analysis.
3 Methodology

 7
Confidential Manuscript Submitted to Technological Forecasting and Social Change

There is a lack of open-source modelling frameworks for assessing the supply and demand of
telecommunications. In this paper, we apply the Cambridge Communications Assessment Model testing
it annually up to 2030, based on the methodology illustrated in Figure 1. The approach allows us to
assess mobile against future demand scenarios, including (i) required per user traffic and (ii) fertility,
mortality and migration. We utilise Object Oriented Programming (OOP) principles to deliver the
flexibility required for the multi-level modelling of assets, networks and whole systems. The OOP
approach has previously been utilised for technological forecasting by applying it to the UK mobile
telecommunications industry to support management decisions (Christodoulou et al. 1999).
Transparency and reproducibility are central tenets of the research and therefore we have provided
open-source access to the model code (https://github.com/nismod/digital_comms).

 Exogenous Demand Demand Module Geotypes
 Disaggregated
 Scenarios
 Coverage Statistics
 - Total required - Urban
 - Required user data capacity (Mbps km2) - Suburban
 - User density (km2) - Rural - Asset-level 4G LTE
 - Fertility, mortality coverage
 and migration - Offloading
 - Market share - Number of networks

 Radio Access Network Dimensioning Technical Inputs I

 - Propagation
 SINR Probability Density Function - Building penetration
 Technical Inputs II Loss
 - Shadow fading
 - Spectrum bandwidth Maximum Inter-Site Distance =
 - Sectorisation min(ISDcoverage, ISDcapacity, ISDspeed)
 - Frequency reuse

 Cell density

 Infrastructure Intervention Options

 - Minimum intervention
 - Spectrum-based strategy
 - Small cell-based strategy
 Deployment Inputs - Hybrid approach

 - Decommission rate Infrastructure Deployment Algorithm
 - Annual capex
 constraint
 - Rollout strategy
 Total Cost of
 System State Ownership

 - Total assets by technology type - Capex
 - Opex

 Capacity-Demand Assessment

Figure 1 Methodological sequence

The process of producing the exogenous demographic scenarios is articulated in Thoung et al. (2016)
with the projections considering fertility, mortality and migration. A baseline was developed by
calibrating the microsimulation model with UK population data between 2001 and 2011. The data are

 8
Confidential Manuscript Submitted to Technological Forecasting and Social Change

very high resolution using the Local Authority District as the statistical unit of projection. We then
disaggregate these projections annually between 2016 and 2030 to approximately 9000 postcode
sectors, using a population weighting from the last UK census (ONS, 2013).
Although there has been exponential traffic growth over the last decade, future data demand is unknown.
In the UK, according to the data reported by Ofcom (2012c; 2013; 2014; 2015a; 2016), the average data
consumption was 110 MB per month in March 2011. This demand more than doubled in one year, to
240 MB in 2012. In 2016, average monthly data consumption per user reached 1.3 GB. Figure 2 shows
the historical series for the UK in light blue. The reasons behind this large increase in data demand are
mainly related to the rollout of 4G LTE, allowing for higher mobile broadband speeds, driving data
consumption, particularly from video and ‘data-hungry’ applications.
Latest data from Cisco (2017) report that video accounts for 63% of all mobile traffic in the UK and
that it will grow seven-fold by 2021, meaning that by then video would be 81% of the UK mobile data
traffic. The same report forecasts a Compound Annual Growth Rate (CAGR) of 38% for mobile traffic
in the UK over the next five years, as shown in orange in Figure 2.
As the proportion of video in mobile traffic reaches saturation levels, CAGRs for per-user data demand
tend to slow (Cisco, 2011; 2012; 2013; 2014; 2015; 2016, 2017). As 4G reaches maturity, future data
demand growth is more uncertain, as this will depend on potential 5G use cases and services. Hence, in
this paper we explore three different scenarios regarding data demand for connectivity services once
5G technologies start to be commercially deployed from 2020:
 1. High demand, with sustained exponential growth at 25% CAGR over 2021-2030.
 2. Baseline demand, where data demand follows a linear increase over the long-term.
 3. Low demand, modelled by a logistic curve (as stated in equation 1), which represents the
 ‘worst’ scenario for 5G adoption, where there is no new ‘killer app’, causing demand to
 plateau.

 45
 Per-user data consumption (GB/month)

 40
 35
 30
 25
 20
 15
 10
 5
 0

 Ofcom historical VNI Cisco Logistic Exponential Linear

Figure 2 Data growth per user by scenario

 9
Confidential Manuscript Submitted to Technological Forecasting and Social Change

Equation (1) represents the logistic curve to model the low demand scenario, where k is 1.764 and D 12
GB. Within the Demand Module, the monthly data demand in a specific year ( ) is then converted to
the number of Mbps required per user ( ) in time .

 ( ) = (1)
 1+ − ( − 0 )

We dimension the network across 30 user activity days per month ( ), based on 15% of traffic taking
place in the busiest hour ( ℎ ) (Holma & Toskala, 2009). We illustrate this in equation (2):

 1 ℎ 1
 = × 1024 × 8 ×
 × 100
 × 3600
 (Mbps/user) (2)

where is the data demand at any given time over the study period, as illustrated in Figure 2.
The user density ( ) of area at time is calculated annually based on the local population ( ), a
smartphone take-up rate of 80% ( = 0.8) based on the Ofcom (2017) technology tracker, a market
share parameter for a hypothetical operator assumed to be 30% ( = 0.3), and the geographical area
( ) of the postcode sector, as outlined in equation (3):

 ( × × )
 =
 (users/km2) (3)

The Total Demand per km2 ( ) of area at time is calculated in equation (3) using the bit rate
required per user ( ) in time and the user density ( ).

 = ( × ) (Mbps/km2) (4)

As high-resolution, purely bottom-up modelling is a challenging task, we instead adopt a geotyping
approach that groups areas based on similar characteristics, such as population density, to define the
type of clutter environment. This is undertaken for England, Scotland and Wales (with Northern Ireland
being excluded due to data discrepancies), using polygon data from Ordnance Survey Codepoint (2015).
We use the annual Ofcom (2016) Connected Nations data of 4G geographic coverage by Local
Authority District to disaggregate coverage to postcode sectors. This disaggregation is carried out by
taking the aggregate percentage of area covered by 4G LTE, and allocating it to the most densely
populated postcode sectors first. All sites within areas with LTE coverage are considered to have LTE
assets. This is a method for taking the site information from Sitefinder (Ofcom, 2012d), and updating
the technologies present, considering the basestations belonging to the four major operators (EE,
Vodafone, O2 and Three; EE’s data were obtained by combining T-Mobile and Orange). Currently,
there are two macrocellular networks with sites shared between firstly O2/Telefonica and Vodafone,
and secondly EE and Hutchinson Three. Hence, to obtain a single network, we split the total number of
sites in two in each local area.

We reuse the geotypes outlined in a report for the Broadband Stakeholder Group by Analysys Mason
(2010), which have been applied elsewhere in the literature as they align with the 90th percentile of
population coverage (see Oughton and Frias, 2016; Oughton and Frias, 2017). Seven geotype
segmentations are used based on the minimum number of persons per km2, which include Urban
(>7,959 persons per km2), Suburban 1 (>3,119 persons per km2), Suburban 2 (>782 persons per km2),
Rural 1 (>112 persons per km2), Rural 2 (>47 persons per km2), Rural 3 (>25 persons per km2) and

 10
Confidential Manuscript Submitted to Technological Forecasting and Social Change

Rural 4 (>0 persons per km2). The population density bands are held static, while postcode sectors can
transition between bands based on demographic change over the study period. The population density
is hence a proxy for building density and is used in the network dimensioning based on three clutter
types (urban, suburban and rural). In the dimensioning of the Radio Access Network (RAN), LTE and
LTE-Advanced characteristics are extrapolated. For each geotype, networks are dimensioned using a
model to calculate the minimum number of basestations required to meet different levels of demand,
allowing a set of network performance curves to be generated for Inter-Site Distance (ISD) system-
level simulations (Frias et al. 2017). The performance of the network is evaluated based on the average
per user throughput for different spectrum bands, guaranteeing desired Quality of Experience, 90% of
the time. Using the performance curves, a set of lookup tables are developed for reference when
simulating the performance of different capacity expansion strategies.
As defined in equation (5), the probability density function of the Signal-to-Noise-plus-Interference
Ratio (SINR) is developed for each cell size, allowing the calculation of an average spectral efficiency
based on the technology, following Mogensen (2007). The average spectral efficiency of a cell (in

bps/Hz) for a particular spectrum band and Inter-Site-Distance is defined by .

 = � ( ) ( ) (5)

Based on the available bandwidth in the defined carrier frequency for a three-sector cell, the average
throughput (Mbps) is calculated, as defined in equation (6).

 ℎ ℎ = 3 ∑ (6)

Options involving small cells focus on deploying them at 3700 MHz using Time Division Duplexing
(TDD). Here, LTE-like spectral efficiency is assumed (1.5 bps/Hz) for estimating the number required,
along with 100 MHz available bandwidth, a maximum coverage of 200m and a 75% download-to-
upload ratio. Parameter values are outlined in Table 1.

 Parameter Value
 Macrocell RAN architecture Three-sector cells
 Frequency reuse factor 1
 4.2 + 1.3 10 � ( )� ;
 Shadow fading log-normal distribution = �
 3.5 + 1.3 10 � ( )� ; ℎ
 Building penetration loss log-normal distribution (µ, σ) = (12 dB, 6.5 dB)
 Propagation model SEAMCAT (2010)
 % indoor users 50% urban and suburban, 0% rural
 Bandwidth Dependent on frequency band

Table 1 Key network dimensioning parameters
We follow the 3GPP technical recommendations for defining transmitted power, antenna height and
propagation (3GPP, 2010). Using the SEAMCAT (2010) ‘Hata Extended’ propagation model, log-
normal distributions are utilised for signal loss due to (i) slow fading or shadow fading (due to clutter),
and (ii) building penetration loss.

 11
Confidential Manuscript Submitted to Technological Forecasting and Social Change

We test a set of strategy options (Table 2) that include minimum intervention, spectrum integration,
small cell deployment and a hybrid approach of spectrum and small cells. Capital expenditure is
constrained across the telecommunications industry to £2 billion per year as this is approximately in
line with historical capex rates (Real Wireless, 2015). The hypothetical operator takes a proportion of
this spending based on its market share.

 Strategy Strategy
 Description
 Type Name
 Minimum Minimum
 Operate and maintain existing network
 intervention Intervention
 Spectrum Upgrade to LTE if not available (800 and 2600 MHz). Integrate all
 Capacity
 Integration other spectrum on the brownfield macrocellular network (700, 3500
 expansion
 Strategy MHz)
 Capacity Small Cell Upgrade to LTE if not available (800 and 2600 MHz). Deploy a
 expansion Strategy greenfield small cell layer operating in TDD at 3700MHz
 Upgrade to LTE if not available (800 and 2600 MHz). Integrate all
 Capacity Hybrid other spectrum on the brownfield macrocellular network (700, 3500
 expansion Strategy MHz). Deploy a greenfield small cell layer operating in TDD at
 3700MHz

Table 2 Strategy descriptions
We program the model to reflect that MNOs must meet specific coverage obligations. Recent variations
to the UK’s 3G licences (for 900 and 1800 MHz bands) require holders to deliver 768 Kbps to 90% of
the population (Ofcom, 2012a). For 4G LTE (800 and 2600 MHz bands), licence holders are required
to deliver 2 Mbps coverage to 98% of the population by 2017 (with no less than 95% in each of England,
Wales, Scotland and Northern Ireland) (Ofcom, 2012b). Hence, we assume 5G is likely to require a 5
Mbps coverage obligation and that the operator must meet this level of service.
Infrastructure is deployed to postcode sectors by the hypothetical operator based on different investment
decisions. We assume operators would first deploy LTE if this technology was not already present
(integrating 800 and 2600 MHz) on a site. Then, sites with LTE in operation may have 700 MHz and
3500 MHz integrated. Finally, a small cell layer is deployed (to increasing densities of small cell sites)
within each postcode sector operating in TDD at 3700 MHz.
At each modelled time-step, postcode sectors are considered in order of high to low population density.
Each area's capacity and demand are compared using a capacity margin metric, and upgrades are applied
based on the options available until either the demand is met or the annual budget is exhausted. The
capacity margin ( ) for area at time is calculated by subtracting from
 as illustrated in equation (7):

 = − (7)

Within the Cost Module we calculate the costs of infrastructure upgrades over the course of the study
period, according to the Total Cost of Ownership (TCO) of new assets. We exclude the costs of
operating legacy network assets. We use costs sourced from the Ofcom Mobile Call Termination (MCT)
Model (2015b), as well as from 5G NORMA (2016). Costs are calculated by finding the NPV of the
TCO for each infrastructure asset over a 20-year period, based on the methodology dictated by Ofcom
for the cost of extending coverage for the 4G LTE auction (Real Wireless, 2012). This includes a 20-
year NPV calculation with no account for price trends, and a 3.5% social discount rate. We assume a
10-year equipment lifetime for macrosites and 5-year equipment lifetime for small cells, with civil
works not being repeated. There is no residual value at the end of the period.

 12
Confidential Manuscript Submitted to Technological Forecasting and Social Change

The cost structure of assets is affected by the fact that we take a brownfield approach for spectrum
integration using the existing macrocellular network and a greenfield approach for small cell
deployment. Small cells are deployed on local authority owned street furniture for no cost. Detailed
asset costs are outlined in Table 3, including references to their sources. We assume a 10% mark-up on
all costs for upgrades in the core network. The results will now be reported in Section 4.

 LTE Capex Opex
 Strategy Cost type Source
 availability (GBP) (GBP)

 Site with 4G Additional carrier on
 15,000 1,800 Ofcom (2015a)
 LTE current BS
 Spectrum Deploying a
 40,900 3,898 Ofcom (2015a)
 integration on multicarrier BS
 the macrocelluar Site with no
 network 4G LTE Civil works 18,000 - 5G NORMA (2016)

 Fibre backhaul 20,000 - Assumption

 Small cell equipment 2,500 350 5G NORMA (2016)

 Network densification through
 Small cell civil works 13,300 0 5G NORMA (2016)
 small cells

 Small cell backhaul - 1,000 5G NORMA (2016)

 10% mark-
 Core upgrade cost on all strategies - Assumption
 up

Table 3 Infrastructure deployment costs

 13
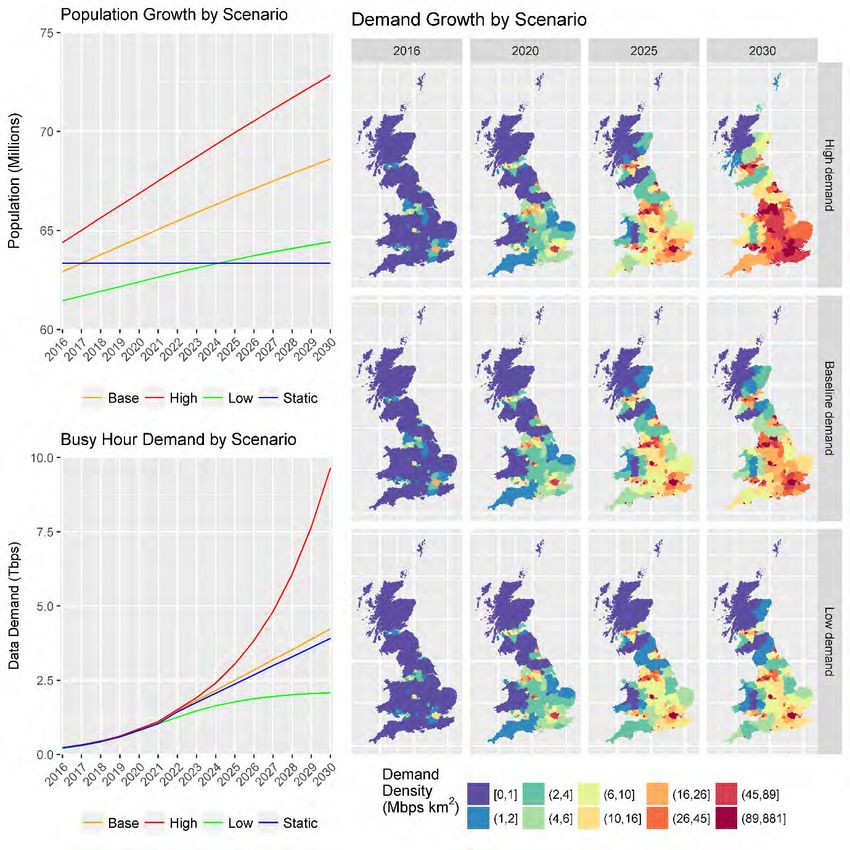
Confidential Manuscript Submitted to Technological Forecasting and Social Change

4 Results
We start by reporting the results by scenario for long-term demand, before progressing to the
performance of different supply-side infrastructure strategies. A discussion is then undertaken on the
ramifications of these findings in Section 5.
4.1 Demand results
In the demographic scenarios tested, the baseline population grew by 5.3 million, to 68.6 million. This
contrasts with the high growth scenario where there was an additional 7.8 million people (reaching 72.8
million in 2030), and the low growth scenario which saw much smaller growth of 2.7 million people
(reaching 64.4 million in 2030). The baseline population density grew from 274 persons per km2, and
finished at 297 persons per km2 (an increase of 23 persons per km2). Figure 3 illustrates population
growth graphically by scenario. Population forecasts have minor differences in starting points as the
most recently available data are from 2015.

Figure 3 Demand growth metrics by scenario

 14
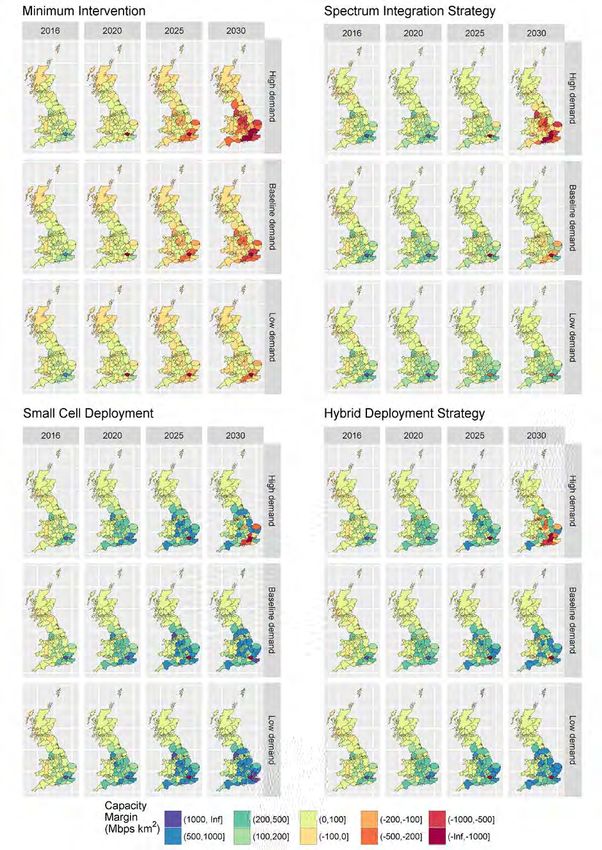
Confidential Manuscript Submitted to Technological Forecasting and Social Change

In terms of the aggregate area demand, there was an increase in the baseline from approximately 0.2
Tbps in 2016 to 4.23 Tbps in 2030. The low growth scenario grew from 0.2 Tbps in 2016 to 2.08 Tbps
in 2030, whereas the high growth scenario grew from 0.2 Tbps in 2016 to 9.7 Tbps. As this represents
a hypothetical MNO with only 30% market share, the total national demand would be significantly
higher. Where this demand takes place spatially, is of vital importance to MNOs. Figure 4 also illustrates
the demand evolution across Britain over time, reflecting the underlying demographic characteristics of
local areas. Across all scenarios, there is a lower demand in northern and western regions of Britain,
particularly in Scotland and Wales, as the population is either static or declining. In the low scenario,
demand is mostly concentrated within major cities such as London, Birmingham, Manchester,
Newcastle and Glasgow, as one would expect. However, under baseline or high growth there is
considerable demand in lower population density suburban and rural areas too, particularly in the South
East and Midland areas of England, which would prove a considerable challenge to meet in a cost-
efficient way.
The ‘Static’ scenario specifically considers no demographic change from 2016 onwards, only focusing
on baseline data demand growth. This allows the impact of the population and data exogenous drivers
to be isolated and compared. The key finding is that in the ‘Static’ scenario, the aggregate demand was
quite similar to the baseline in 2030 at 3.9 Tbps, whereas the baseline reached 4.23 Tbps. This indicates
that population growth in the baseline scenario led to an additional required 0.3 Tbps of capacity at the
end of the study period. To summarise for the baseline scenario, only 8% of the growth for 2016 to
2030 results from demographic change, whereas 92% is from per user data demand. Therefore, this
means technological progress accounts for more than 90% of the growth in total data demand.
4.2 Supply-side strategy results
We tested four different options, including (i) minimum intervention, (ii) spectrum integration, (iii)
small cell deployment and (iv) a hybrid approach using both spectrum and small cells. Figure 4
illustrates the performance of all strategy options across each exogenous demand scenario.
In the case of the minimum intervention strategy, we found that the current system is not sufficient in
meeting long-term demand. The capacity deficit grew considerably between 2017 and 2030 depending
on the scenario, with this metric being smallest under low growth and largest under high growth as one
would logically expect. This ‘do nothing’ scenario provides an important comparison for the
effectiveness of other strategies.
The performance of the spectrum strategy had mixed results based on different demand scenarios. For
example, there was only a minor capacity deficit in the baseline when compared to the high growth
scenario. Fortunately, in the low growth scenario system capacity narrowly managed to meet long-term
demand, avoiding a capacity deficit in all areas except the London region. Yet, these results indicate
that a purely spectrum-based approach would not be a robust strategy to meet long-term demand.
However, it is promising that this strategy could meet demand in many locations outside of the major
urban conurbations.
The small cell deployment option performed well across all scenarios, with aggregate system capacity
being positive in all cases, avoiding the capacity deficit that often arose in other options. Small cells
provide very high capacity in localised areas (due to small coverage radii per cell), but such a large
system capacity surplus may lead to overprovisioning, which could be economically inefficient. More
cost efficient wide-area coverage solutions are likely to be needed.
In the hybrid strategy, we see a very similar outcome to the previous small cell strategy. This is because
the additional spectrum (specifically in urban areas), is not sufficient to meet required demand, therefore
the decision layer in the model results to small cell deployment. In certain scenarios, a capacity deficit
arose in London and the South East. Moreover, in the high demand scenario there was a capacity deficit
in many other English regions, particularly around the main conurbations in the Midlands and North

 15
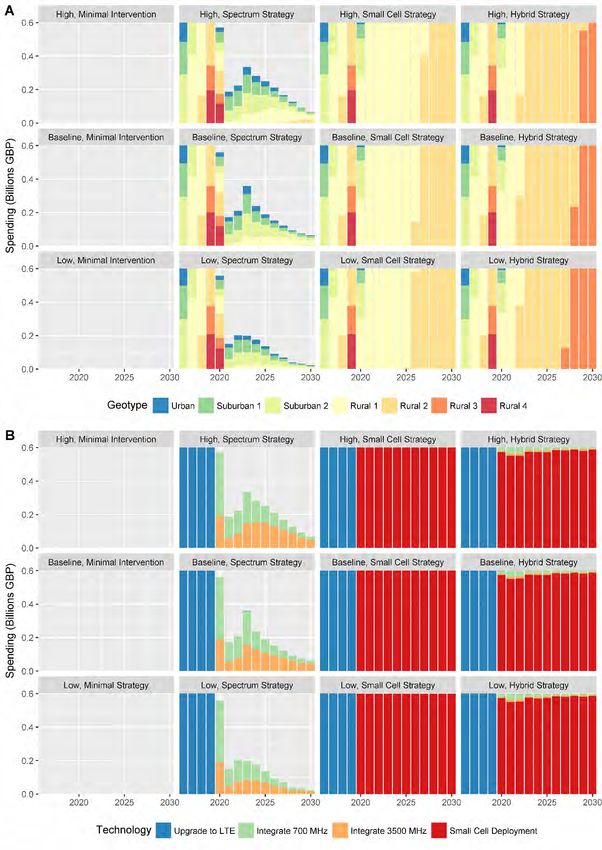
Confidential Manuscript Submitted to Technological Forecasting and Social Change

West. Appendix A contains detailed results for the five areas with the largest capacity margin deficits,
broken down by scenario and year, for the baseline scenario.

Figure 5 Strategy performance over time

 16
Confidential Manuscript Submitted to Technological Forecasting and Social Change

To understand the commercial ramifications of these results, each demand scenario and deployment
strategy must be evaluated in relation to cost. Moreover, it is particularly helpful to quantify how capital
expenditure takes place across urban, suburban and rural areas. Consequently, Figure 5 visualises the
results for the rollout of infrastructure over the study period of 2016-2030.
As the UK has incomplete LTE coverage, in all expansion options, this commonly took place in the
early years of the study period, up until 2020 when the 5G spectrum bands became available. Spending
on LTE was generally high because it requires a whole new basestation as opposed to simply integrating
additional carriers for 700 or 3500 MHz on an existing site. Spending on urban areas made up a small
proportion of the overall capital expenditure, with suburban and the densest rural areas absorbing
considerable resources particularly later in the study period from 2021 to 2030.
During the LTE upgrade in the first three years of the study period, resources were pushed out to some
of the lowest population density areas in remote Britain. In the spectrum strategy, this option runs out
of new bands to integrate leading to a decrease in total capex spending annually over the study period.
However, the shape of this decline indicates that not all areas have a negative capacity margin when the
bands come online, with spending taking place in two phases. Firstly, in 2020 a range of urban, suburban
and rural areas with a capacity deficit receive new spectrum, with this spending tailing off in 2021,
before rising again by 2023. In the strategies containing small cells, the limited radii of these assets
cause spending to ramp up to the maximum annually allowed. Small cells dominate the spending profile
from 2020 onwards with a small proportion in early years spent on integrating 700 MHz, and an even
smaller proportion spent on 3500 MHz.
Having reported both the demand and infrastructure performance results, we will now discuss what this
means for future decision making.

 17
Confidential Manuscript Submitted to Technological Forecasting and Social Change

Figure 6 (A) Annual spending by geotype, and (B) Annual spending by technology

 18
Confidential Manuscript Submitted to Technological Forecasting and Social Change

5 Discussion
Estimating the future demand for mobile telecommunications infrastructure is a challenging task, as
there is a very high degree of uncertainty. The aim here was to quantify the impact of the industry
standard forecast by Cisco up until 2021, and then use high (exponential), baseline (linear) and low
(logistic) growth scenarios to explore future mobile traffic demand up to 2030. Population projections
were also integrated. We find that data demand is by far the largest driver of mobile traffic (constituting
92% of baseline growth), with demographic change including fertility, mortality and migration having
only a marginal impact on future demand (8% in the baseline). This is an important finding because it
encourages technological forecasters in industry and government to focus on refining future data
demand forecasts, rather than population projections, contrasting strongly with energy or transport
systems where demographic growth is often the major driver.
The results show within the methodology applied here, that per user monthly mobile traffic demand is
estimated to be 4.7 GB in 2020 for the UK. This estimate is comparative to the results of Lee et al.
(2016) who developed forecasts of mobile broadband traffic using a combination of scenario analysis
and the Delphi method, finding that South Korea would have a monthly user demand of approximately
6 GB by 2020. Although the demand scenarios used here for the UK were lower, the difference in
adoption and access capacity between each country provides an explanation. As carried out in Lee et
al. (2016), further research should put a larger emphasis on modelling devices and their impact on data
demand, and using these scenarios to drive the existing modelling framework.
Additionally, although this paper included annual migratory trends (predominantly towards urban
areas), daily commuting and travel patterns were excluded. This is however important, and a further
incremental development would be to better reflect mobility in the busy hour estimation, particularly in
cities, as this is where the mobile network can easily become overloaded. Indeed, user mobility can
make it a challenge to report mobile statistics; hence one approach is to anchor data usage to the
population or premises (as used by Ofcom, 2016). Although the method used here is a simplification,
the results still provide useful comparative insight across scenarios. The growth of computational
power, combined with new crowd-sourced data, may help in overcoming this issue as user mobility can
be tracked through time and space.
To evaluate how options performed against future demand scenarios, the second research question
focused on assessing interactions between supply and demand during a mobile telecommunications
generational upgrade. Different infrastructure strategies could be assessed against the minimum
intervention option. The results found that the spectrum strategy performed well in the baseline and low
demand scenarios up until 2025, demonstrating that this will play an important role in meeting mid-
term demand. However, spectrum-based options were more sensitive to demand uncertainty than small
cell deployment, which was more capable of dealing with higher demand growth, although this was at
the expense of increased cost. The small cell and hybrid strategies provide huge capacity in some areas,
but still fail to meet demand in others. This is due to limited coverage per cell in combination with
constrained capital expenditure.
Importantly, if there is a desire for the large per user speeds mooted by 5G, which cannot be achieved
by spectrum strategies alone in non-urban areas, new revenue streams consequently need to be found
to boost infrastructure investment. Therefore, the obvious prospect is to capture some of the potential
value created from the new market opportunities and productivity gains associated with IoT, Smart
Cities and other digitally connected systems, as has been identified in the technological change literature
(Yang et al. 2013; Sadowski, 2017). Of course, in this analysis we tested a relatively narrow range of
supply-side strategies, therefore further research must focus on defining strategies of emerging 5G
technologies including higher order MIMO and millimetre wave small cells to enhance supply capacity.

 19
Confidential Manuscript Submitted to Technological Forecasting and Social Change

In answering the final research question, we explore the ramifications of the results. Firstly, the
quantified future scenarios used in this paper, in combination with the performance of different supply-
side options, are a useful tool for understanding the economic costs of increasing mobile demand.
Ghezzi et al. (2015) provide a decision framework for MNOs to identify the key drivers of potentially
disruptive change to their operations, market strategy and different business models. Importantly,
increasing data traffic is treated as one of the key drivers. Hence, the scenario-based analysis produced
here provides complementary quantitative information for MNOs to anticipate how changing demand
may affect the value proposition, value creation, value delivery and value appropriation of their business
model.
Moreover, while this information may be readily available within some organisations, particularly
MNOs or telecommunication regulators, the findings can also be valuable elsewhere, perhaps where
they are not so readily available. For example, it is vital information for small and medium-sized (SME)
digital economy firms, as well as for governmental institutions which sit outside of the
telecommunication regulator and hence might not be able to access commercially sensitive data. Indeed,
Shin et al. (2011) under take an analysis of the socio-technical dynamics of moving from 3G to 4G LTE
in Korea, determining that moving to a new generation of mobile technology cannot be driven by a
single organisation as it requires a tremendous number of partnerships between private and public
organisations. Hence, the scenario analysis undertaken here can help in this endeavour by providing
transparent assessment of the supply and demand of mobile telecommunications for MNOs, SME
digital economy firms and government institutions.
Indeed, plentiful spectrum resources play an important short- to mid-term capacity enhancing option,
as illustrated in this analysis. Therefore, the UK Government’s timely delivery of the bands outlined in
the Public Sector Spectrum Release programme (750 MHz of sub-10 GHz spectrum by 2022, with 500
MHz being available by 2020) will be highly important specifically for rural areas where small cell
rollout will be unviable (UK Government Investments, 2016). On the other hand, in urban areas with
high data demand, small cell deployments are a cost-efficient strategy for MNOs, therefore government
must ensure these assets can be efficiently and cheaply installed. Often, stringent local planning
regulations combined with historical protections for older buildings can prevent timely deployment,
requiring innovative private and public solutions to overcoming these barriers.
In both the spectrum integration and small cell strategy options, backhaul capacity and its consequential
cost is a significant potential issue. Options should be explored that can focus on enhancing fibre access
in areas with little backhaul capacity, as this could lower deployment costs. Ultimately in 5G we will
see increased convergence within the telecommunications industry, as MNOs who also own a fixed
network may allow low-cost access for backhaul to provide a competitive cost advantage.

 20
Confidential Manuscript Submitted to Technological Forecasting and Social Change

6 Conclusion
Rapid technological innovation in mobile telecommunications affects our ability to accurately forecast
long-term capacity and demand, making it essential that rigorous examination of this uncertainty is both
quantified and visualised to support decision-making. The analysis presented here can help MNOs,
SME digital economy firms and government institutions understand the implications of increasing
demand (particularly the economic implications) resulting from change in both per user traffic and
demographics. Additionally, quantified assessment of the performance of different 5G supply-side
strategies were presented as ways for MNOs to cope with dynamic mobile traffic growth.
We find that increasing per user traffic resulting from technological change has a major impact on future
demand, whereas demographic change (fertility, mortality and migration) has only a minor effect. For
example, in the baseline scenario only 8% of the growth in data for 2016 to 2030 resulted from
demographic change, whereas 92% was from per user data demand. Hence, technological progress
accounts for more than 90% of the growth in total data demand. Consequently, technological forecasters
should be encouraged to focus on refining per user data demand, rather than devoting time to developing
population projections, contrasting strongly with energy or transport systems.
The modelled results indicate that spectrum strategies could perform well in most scenarios up until
2025, and hence will play an important role in meeting mid-term demand. However, if demand growth
was very high, spectrum failed to meet demand. This contrasts with small cell deployment, which
provided huge increases in capacity, but at the expense of much higher capital expenditure due to limited
coverage per cell. Unless new revenue can be obtained from the value created by IoT, Smart Cities, or
other new technological developments, the investment appetite for rolling out small cells anywhere
other than urban areas will be low. In any case, telecommunications capacity needs to be balanced with
demand, which will mean MNOs avoid overprovisioning. 5G small cell deployments are highly likely
in urban and suburban locations, but more cost-efficient wide-area coverage solutions are required to
meet lower population density areas.
Qualitative frameworks have been put forward in the technical change literature to aid with business
model adaptation for MNOs facing on the one hand increasing traffic growth, while on the other
declining revenues. The contribution of this paper is to provide a scenario-based assessment of
telecommunications supply and demand as we move towards 5G, to serve as complementary evidence
for high-level decision-makers to develop successful market strategies that are robust to different
futures.

 21
Confidential Manuscript Submitted to Technological Forecasting and Social Change

7 References

3GPP, 2010. TR 36.814 - Further advancements for E-UTRA: physical layer aspects [WWW
 Document]. URL http://www.3gpp.org/ftp/Specs/archive/36_series/36.814/. (accessed
 10.31.16).
5G NORMA, 2016. Deliverable D2.1: Use cases, scenarios and requirements. 5G PPP.
Almobaideen, W., Krayshan, R., Allan, M., Saadeh, M., 2017. Internet of Things:
 Geographical Routing based on healthcare centers vicinity for mobile smart tourism
 destination. Technological Forecasting and Social Change 123, 342–350.
 doi:10.1016/j.techfore.2017.04.016
Analysys Mason, 2010. The costs and capabilities of wireless and satellite technologies -
 2016 snapshot. Analysys Mason, London.
Andrews, J.G., Buzzi, S., Choi, W., Hanly, S.V., Lozano, A., Soong, A.C., Zhang, J.C., 2014.
 What will 5G be? IEEE Journal on Selected Areas in Communications 32, 1065–1082.
Asimakopoulos, G., Whalley, J., 2017. Market leadership, technological progress and relative
 performance in the mobile telecommunications industry. Technological Forecasting and
 Social Change 123, 57–67. doi:10.1016/j.techfore.2017.06.021
Bolton, R., Foxon, T.J., 2015. Infrastructure transformation as a socio-technical process —
 Implications for the governance of energy distribution networks in the UK.
 Technological Forecasting and Social Change 90, 538–550.
 doi:10.1016/j.techfore.2014.02.017
Bresciani, S., Ferraris, A., Del Giudice, M., 2017. The management of organizational
 ambidexterity through alliances in a new context of analysis: Internet of Things (IoT)
 smart city projects. Technological Forecasting and Social Change.
 doi:10.1016/j.techfore.2017.03.002
Breuer, D., Weis, E., Grobe, K., Krauss, S., Musumeci, F., Gijon, J.T., Skubic, B., 2016. 5G
 Transport in Future Access Networks, in: ECOC 2016; 42nd European Conference on
 Optical Communication. Presented at the ECOC 2016; 42nd European Conference on
 Optical Communication, pp. 1–3.
British Infrastructure Group, 2016. Mobile Coverage: A good call for Britain? British
 Infrastructure Group, London.
Chen, P.-T., Cheng, J.Z., 2010. Unlocking the promise of mobile value-added services by
 applying new collaborative business models. Technological Forecasting and Social
 Change 77, 678–693. doi:10.1016/j.techfore.2009.11.007
Cheng, J.Z., Yu, H.-C., Sincoskie, W.D., 2005. Meeting the broadband access infrastructure
 demands: The promise of Gigabit Ethernet. Technological Forecasting and Social
 Change 72, 1–10. doi:10.1016/j.techfore.2003.11.006
Chiaraviglio, L., Blefari-Melazzi, N., Chiasserini, C.F., Iatco, B., Malandrino, F., Salsano, S.,
 2017. An economic analysis of 5G Superfluid networks, in: 2017 IEEE 18th
 International Conference on High Performance Switching and Routing (HPSR).
 Presented at the 2017 IEEE 18th International Conference on High Performance
 Switching and Routing (HPSR), pp. 1–7. doi:10.1109/HPSR.2017.7968690
Christodoulou, K., Jensen, K., Vlahos, K., 1999. Using Object-Oriented Simulation to
 Explore Substitution Between Technologies: An Application to the UK Mobile
 Telecommunications Industry. Technological Forecasting and Social Change 62, 203–
 217. doi:10.1016/S0040-1625(99)00044-X
Chu, C.-P., Pan, J.-G., 2008. The forecasting of the mobile Internet in Taiwan by diffusion
 model. Technological Forecasting and Social Change 75, 1054–1067.
 doi:10.1016/j.techfore.2007.11.012
Cisco, 2017. Cisco Visual Networking Index: Global Mobile Data Traffic Forecast Update,
 2016–2021. Cisco American Headquarters, San Jose, CA.

 22
You can also read