Mail.ru Group - Quarterly presentation (Q2 2020)
←
→
Page content transcription
If your browser does not render page correctly, please read the page content below

Mail.ru Group

Quarterly presentation (Q2 2020)
Exposed to multiple verticals stimulated by lockdowns
• MRG is exposed to segments like online games, ecommerce, food delivery (including e-grocery), online education, cloud
  digital payments, which saw a boost in engagement, revenues and margins during the peak of the pandemic
• Albeit the ongoing post-lockdown normalization, COVID-19 has likely served as a trigger for structurally higher long-
  term penetration level and faster adoption across multiple verticals
                                                                             Likely structural positive
                                                                                       impact                                          Online groceries
                                                                                                                                                          Both short term and long
                               Ride-hailing                      Digital                                    Online           eCommerce                    term positive impacts are
 Steep decline in usage but                                                                  Telehealth    education                                      possible
                                         Micro-mobility        advertising    eSports                                                  Food delivery &
 with chances for a V-shaped                                                                           Streaming
 recovery as lockdowns end       Car sharing                                                                              Gaming          meal kits
                                                                              White collar            Video/music
                                                  Classifieds                 Freelance                                                     Cloud
                                                                                                Mental health
                                                                                                                    Digital payments
                                                On-demand                                                                              Online fitness
                                                                 Lending                                Nutrition
                                                office space
                               Car sales                                                                               Health insurance
  Likely only short-term                                                                        Home
                                                                                             improvement
                                                                                                                                                          Likely mainly short-term
    negative impact                                                                                                                                           positive impact
                                                                       Restaurants
                                  Offline fitness
                                                    Office space
                                                                    Offline retail           • We managed to avoid having exposure to verticals, which
        Potential for a more
                                              Hotels                                           might have been structurally adversely impacted by
        prolonged negative                             Air travel                              COVID-19 and could be at highest risk from potential
        impact                 Offline events                                                  second wave shocks, which makes us relatively
                                                    Business travel
                                     Сruises                                                   comfortable in our outlook despite still limited visibility

                                                                               Potentially prolonged
 Source: internal data                                                          negative impact                                                                                       2
Most major markets were largely offline – this will change
• Below markets account for ~90% of consumer spending and all of them are seeing digital disruption, following the
  COVID-19 outbreak and related lockdowns
• The pandemic will fuel further digitalization across markets and industries, which will mean larger TAM for Internet cos
      Market segment                                    Consumer spending
                                                                                             Digital status                            Examples of global digital disruptors
                                                        Europe   Global
                                                                                            Commonly researched online but
      Housing
                                                                                            transacted mainly offline. New models
      Rent & mortgage 65%, Interior &                   $3.1T                         $8.2T like iBuying and fractional ownership
      maintenance 16%, Energy 18%
                                                                                            are appearing

      Health                                                                                 Highly offline, but COVID-19 acted as a
      Govt funded 64%, Insurance                        $1.9T                        $7.8T   major stimulus for telemedicine, online
      premiums 22%, out-of-pocket 14%                                                        medicine delivery etc

                                                                                             egrocery is now among the most rapidly
      Food
                                                                                             growing ecommerce categories
      Groceries 53%, Alcohol & tobacco                  $2.4T                $6.0T           globally, with restaurant delivery also
      30%, Restaurants 17%
                                                                                             seeing a net positive impact

      Mobility                                                                               Consumers still spend 90% on car
      Car purchase 34%, Fuel &                          $1.2T             $5.0T              ownership. The remaining 10% of
      maintenance 56%, Public 10%                                                            mobility is mostly booked online

      Education                                                                              Was 90%+ offline pre-COVID but
      Govt funded 87%                                   $1.0T             $5.0T              lockdown has likely triggered a rapid
      Out-of-pocket 13%                                                                      systemic change

      Travel                                                                                 Online penetration was ~50% pre-
      Flights 33%, Packaged                             $0.6T     $3.0T                      COVID, so is among more penetrated
      travel 33%, Hotel 33%                                                                  verticals

                                                                                             Online penetration stood at ~1/3 in the
      Fashion                                           $0.6T   $2.2T                        most penetrated markets, with
                                                                                             lockdowns forcing all business online
                                                                                                                                                                               3
Source: Dealroom, Eurostat, World Bank, Internal data
COVID-19 impacts across the key revenue lines in Q2 & QTD
Adverse impacts, which started in mid-March, have carried into Q2, with April being most impacted month
Gradual improvement started in mid-April, stimulated by the removal of lockdowns and ongoing reopening of businesses
Impacts continue to vary by sector. Verticals, which saw a sharp adverse impact initially but have since seen an
improvement include: jewelry, finance, gifts and souvenirs. Verticals, which have been resilient throughout Q2 include
FMCG, household goods, health and medicine, telcos and games. Some of the сurrently worst performing verticals are
travel, real estate, transport, sport and fitness. Our largest verticals are FMCG and eCommerce
Online Advertising SMEs (< 25% of our advertising revenue) have held up relatively well
(31% of Q2 revenues) Direct response advertisers have been returning to spend faster than brand advertisers with the depth of decline also
more shallow
CPMs/CPCs have seen a rebound off April lows, but with sizeable discrepancies between performance (~70% of our ad
revenues) vs brand ad units. Programmatic pricing has recovered most
We continued to expand advertiser base through Q2, including across SMEs
The slope of forward recovery remains uncertain & dependent on consumer behavior, lagging verticals and broader macro
and virus-related developments
Being a purely online business, gaming has been among the key beneficiaries from COVID-19 related lockdowns
Traditional home platforms like PC and Console saw the biggest spike in engagement, with solid performance across mobile
MMO Games
Peak in DAU/CCU and monetization was seen in April during the peak of lockdowns globally and has been moderating
(40% of Q2 revenues)
since. Q2 also showed an unusually low CAC given ad market weakness, especially in April
Discretionary nature of gaming could adversely impact but our focus on F2P & mobile makes us relatively well-positioned
Community IVAS Stay-at-home behavior resulted in elevated online engagement, including around exchange of stickers, gifts and social
(18% of Q2 revenues) games. Trends have been normalizing since the peak of lockdowns, with performance now in line with typical seasonality
Edtech: business saw elevated engagement during lockdowns. Platforms saw moderation in activity in June with the share of
active students back to March levels, although the total number of active and paying users still up significantly YoY basis
Other B2B incl Cloud: enhanced digitalization of industries and move to remote work should result in higher demand
(11% of Q2 revenues) Classifieds*: Following an adverse impact on engagement during the peak of lockdowns in March and early April, MAU has
since recovered and returned to growth, at ~27m (+6% YoY), with new listings and contacts growing at 23% and 15%
respectively in June. General classifieds is the largest vertical and it tends to be more resilient in a weak macro environment
* Also booked in advertising revenues 4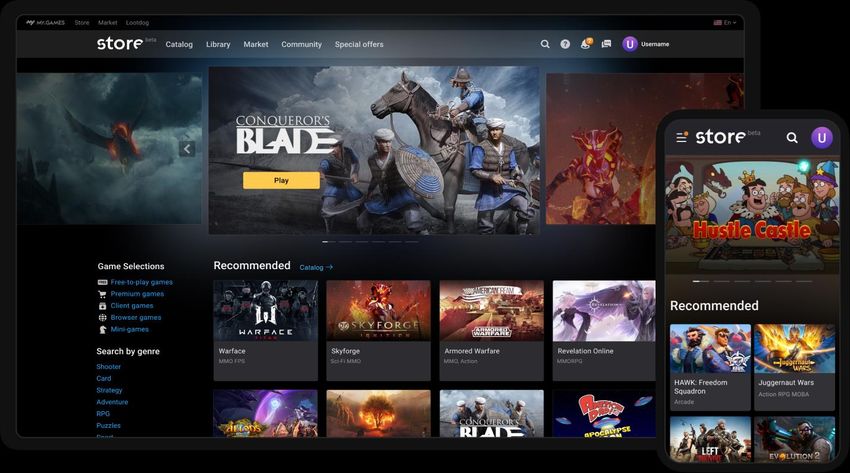
Ongoing ad market recovery, but pace is subject to macro
• Advertising market has bottomed in April (assuming no further shocks) and the depth of the decline was more shallow than we
  envisioned
• At the same time, Russian economy is expected to decline by 4%+ in 2020 (CBR: 4-6%, Ministry of Economic Development: 4.8%,
  Fitch: 5.8%, IMF: 6.6%), with a range of ultimate outcomes remaining rather broad
• Being a function of GDP, this suggests a range of outcomes for the local advertising market, including digital, with a number of
  market participants suggesting that a negative outcome remains a possibility (current consensus: -1%)
• However, consensus remains that digital will outperform other ad channels in 2020 and should deliver strong growth in 2021, given the
  expected 3-4%+ economic recovery
• Our goal remains to continue to gain advertising market share over the medium term and hence our ongoing adtech investments, which
  already resulted in a likely broader market outperformance during the most challenging macro quarter

                               Advertising market projections for 2020 (overall, digital), % YoY
                                           Bank 1   Bank 2   Bank 3   Bank 4   Bank 5   Bank 6    Bank 7   Bank 8   Bank 9 Bank 10 Bank 11 Bank 12 Bank 13
                                     10%

                                      5%
                                                                                                                                                             Current consensus:
                                      0%
                                                                                                                                                             GDP growth: -4.4%
                                     -5%                                                                                                                     Overall advertising: -10%
                                                                                                                                                             Digital advertising: -1%
                                    -10%

                                    -15%

                                    -20%
                                                                                        Overall     Digital

Source: Internal data. JP Morgan, Citibank, Morgan Stanley, VTB Capital, Sberbank, Goldman Sachs, UBS, Bank of America Merrill Lynch, Wood & Co, Alfa Bank, Gazprombank, Veles
Capital, Aton, Sova Capital                                                                                                                                                              5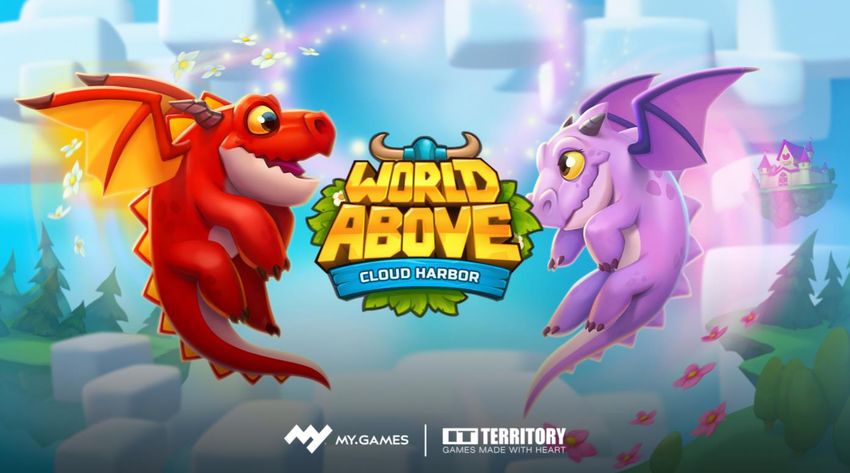
Adtech initiatives & SMB: an ecosystem of simple and efficient tools
• Dynamic product ads launched using a few clicks in VK
owing to algorithms, which:
Select ecommerce products to advertise given their
SMB advertising revenues
expected performance 2019 2020
Determine the right audience to show ads to
+41% +16%
Use embedded dynamic remarketing mechanics to
stimulate completion of a purchase
• Highly efficient targeting with easy setup:
“Interested audience” determined by an algorithm
>3x higher CTR in comparison with manual setup
• Mini App ads for developers promoting their Mini App
instead of community + raise awareness of VK Mini Apps
platform Q1 Q2 Q3 Q4
• Expansion of CRM features, accelerating communication
with potential customers
Sources: Internal data 6
Adtech & performance advertising: efficiency in focus
• Developments in targeting tools:
In-app actions in look-alike targeting: 80% of
advertisers continue using the product after trial
run* Growth in share of key ad products
(as % of total ad revenues)**
To expand reach of contextual targeting, setup
2Q'19 2Q'20
simplified with keyword synonyms: 60% of new
targeting lists created using this tool +190%
Unique targeting on the basis of musical
preferences
• Improvements in attribution tools:
+70% +4%
Conversions additionally tracked by a day of ad
impression
• New statistics for ad campaigns:
ROMI (Return on Marketing Investment) and Contextual Dynamic oCPM
share of ad spend targeting remarketing
Calculated for each ad campaign target or for a
campaign as a whole
Notes: * on the basis of preliminary tests across sample of advertisers; ** based on auction spending across myTarget and VK
Sources: Internal data
7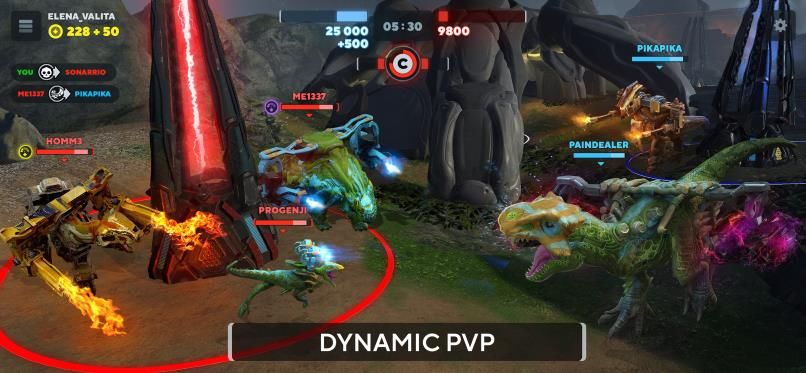
VK: the leading communication and entertainment platform in
   Russia/CIS
        • VK maintains its leadership among domestic social networks, with 73mn MAU (+4.8% YoY) in Russia, including
          67mn on mobile (+7.4% YoY) as of June
        • We continue to focus on time spent and stickiness, with time spent at the peak of lockdowns up 14% YoY to
          40 minutes, including 20.5% growth on mobile, and sticky factor at 57%, highest among peers*

         2006                   2007                       2008                     2009                    2010-11               2012-13          2014-15
         VK Launch             Audio & Video              Apps Platform,            Ads Platform,           Blogging Platform,    Ad Exchange,     Stickers,
                               Platforms                  Gifts                     Games Platform,         News Feed,            Communities      Marketplace
                                                                                    International Version   Mobile App            Platform         in Communities

         2016                                 2017                               2018                         2019                      YTD
         Smart Feed with Ads,                 VK Music,                          Voice & Video Calls,       QR Code Platform,           New Services Section
         Stories, VK Live,                    Discover                           VK Pay, VK Mini Apps       Mobile App Redesign,        (2nd Tab), Ecommerce
         Money Transfers                      Section,                           Platform                   AliExpress Integration,     Platform, VK Clips, VK
                                              Ads Network                                                   Advertising Account         Donut,
                                                                                                            Redesign                    Voice Message Speech
                                                                                                                                        Recognition, VK Taxi, VK
                                                                                                                                        Food                        8
Source: Internal data * Source: Mediascope, April 2020, Russia (all cities, age 12+), Desktop & Mobile
VK: product enhancements stimulate further growth
   • Despite all the COVID-related challenges, VK have
     successfully reorganized its processes and managed to                                                                          Some Q2 highlights:
     carry out ~60 major updates during Q2 alone while

                                                                                                                             ~60                          +17%
     working remotely
   • As a result of our efforts, during the lockdown we were
     able to offer users products and services that could help
     them with essential tasks related to working from home,                                                                 Major updates               Messages sent YoY
     distance learning, leisure and communication. For
     example, our rapidly growing Mini Apps platform could be
     used for booking taxis and ordering food. Hence, the use
     of VK products was especially high at the peak of the
                                                                                                                            +45%                          +41%
     lockdown (April)                                                                                                        Daily calls YoY              Video views YoY
   • VK’s audience and engagement continued to grow after

                                                                                         (April in comparison to March)
     the ease of lockdowns, with daily audience in Russia up                                                              +20%   Number of daily calls

                                                                 Peak engagement stats
     by 7% YoY in June, which means healthy retention
   • This, combined with our ongoing improvements in                                                                      +13%   Daily messages sent
     advertising technologies as a whole and special
     products for SMBs in particular, resulted in 8%+ YoY
     revenue growth for VK in Q2                                                                                          +50%   Live stream views

                                  +8% VK revenue                                                                                 Game platform DAU
                                                                                                                          +12%
                                  YoY growth in Q2                                                                                                                           9
Source: Internal data
VK: Key content consumption results
  • VK remains highly competitive across the key content consumption formats
  • We are actively investing in our Stories and Video products, among others, in 2020 in order to continue to grow
    engagement and time spent following the lockdown removal in Russia

                          Story Views (bn)                                          Video Views (bn)
                                ~4x                                                           >2x
                                                            20.2                                                      80.6

    5.4                                                            31.1

        Q3               Q2             Q2                  Q2       Q3            Q2                  Q2               Q2
       2017             2018           2019                2020     2017          2018                2019             2020

Source: Internal data                                                                                                         10
VK Mini Apps: rapid expansion continues
Active Mini Apps
19.7K
• For the past two years, we have been making 15K
13.3K
improvements to the Mini Apps technology,
developing our own Mini Apps (e.g. VK Food and
VK Taxi) and working on establishing 4.2K
relationships with 3P developers
0.1K
• All these investments are starting to pay off, with:
Mini Apps DAU up by 30% QoQ in Q2 Jan-2019 Jun-2019 Dec-2019 Mar-2020 Jun-2020
MAU hitting a new record of 36mn (in April),
having moderated at 30mn in June, which is VK Mini Apps – 30M
27M
above the pre-covid 27mn MAU seen in March MAU dynamics 23M
Тhe platform can now address even more user
needs as the number of active services 17M
increased to 19,700, which drives further usage 10M
growth 7M
1M
Jan-2019 Mar-2019 Jun-2019 Sep-2019 Dec-2019 Mar-2020 Jun-2020
Source: Internal data 11VK Mini Apps: internally developed app example of VK Taxi
• VK Taxi, based on Citymobil, is being further integrated
into the VK App
• A widget for booking taxis is now available, with users
having no need to even need launch the Mini App to
book a taxi as this feature is available from the main
screen of the VK App in just a few taps
• Taxis can now be booked from community pages as
well. That way, users can go directly to a store, beauty
salon or bank by booking a taxi right on the organization’s
VK page
• Thanks to these and other updates, the number of VK Taxi
booked monthly rides exceeded 700,000 in June, which
is up ~2x vs April and is looking to reach 1m+ in July
12
Source: Internal dataVK Connect: Group’s unified ID is being actively rolled out
• VK Connect, the single sign-on platform for all Mail.ru Group
products formed on the basis of VK, was officially rolled out
in June
• After logging into any service with VK Connect, users can
access any other MRG product in just one tap without having to
enter login credentials
• The VK Connect account page is available on VK and has
already been rolled out for Marusia (April) virtual voice assistant
and Delivery Club (May) apps and is in the process of being
rolled out for Youla
• Share of VK Connect sign-ins in Marusia is already at 58%, with
a 68% conversion rate for DC
• VK Connect will soon become available for Citymobil and other
Mail.ru Group’s projects
• In the future, the single ID will also allow users to connect to
third-party services as well
Source: Internal data 13Combo loyalty program: broader integration with the VK Platform
• The goal of Combo is to improve user acquisition and retention as well as boost usage across the Group’s ecosystem
projects by covering a wide range of customer needs with the best offers on the market
• Doctis telemedicine service has been provided as a
special offer for Combo subscribers soon, with Samokat
Current product offer coming soon
• Capsule smart speaker is now available at a discount
for Combo subscribers
Mail.ru Group External partners • Full integration with the VK Mini Apps platform was
launched in May
• VK Connect integration is coming soon
Key initial results
GMV uplift for Increase in the number of
included services used MRG services
Source: Internal data 14VK Clips: major new launch in the short video format
• Clips is an important new VK product aimed at increasing user engagement on mobile platforms
• Clips is an endless feed of short vertical videos, with themes
ranging from entertainment to education and duration of up a 1
minute
• With the service’s features, any user can create content on a near-
professional level without needing specialized skills or expensive
equipment. One key feature of VK Clips is that users are able to
control the recording of a clip using AR mechanics. Users can show
special gestures to start shooting a clip or enable effects
• Aside from VK content creators, several hundred celebrities have
already become clip creators
• During the first month since launch >44mn unique users watched
clips, with the total number of watched clips exceeding 3bn
• On average, Clips gain 6.5mn likes and 108k comments daily, with
the latest record of 200+mn in daily views
VK Clips – results of the first month
3.1B 44M 116M 1.7M
Source: Internal data 15VK Donut: new product for content monetization
• In cooperation with our internal Boosty.to
service, we launched VK Donut: a platform for
community content monetization
• Users can now buy paid subscriptions to
support their favorite communities on a regular
basis
• This provides content creators with a new way to
earn money, and subscribers receive exclusive
content, early access to new material, the ability
to leave comments or participate in private
contests, special offers or meetups
• Money is transferred to a VK Pay account or a
payment card, with the platform fee set to 5%
Source: Internal data 16VK: major enhancement to Group’s ecommerce offer
• Users and SMBs use VK community features to sell and
promote their products
• We are now actively developing internal tools for stores
on VK and, through them, plan to bring a significant portion
of the rising ecommerce turnover to the VK platform
• We became the first social network in Russia to launch
product delivery through CDEK and Boxberry. With this
new feature, making purchases in VK communities is more
convenient, which means that selling products on VK will be
even more lucrative
• Payment offer has also been enhanced with customers
able to make purchases using credit cards as well as VK
Pay account balance
• VK has since partnered with VEB in supporting businesses
in the Far East to shift their businesses online using VK and
its enhanced ecommerce offers
• We continue to see social commerce as one of the largest
growth opportunities for VK looking ahead and will continue
to invest into related prodct development in H2
17
Source: Internal dataNew music recommendations
• We are actively working on our music recommendations
and the related technology. Group’s music offer is
becoming increasingly personalized, with increasing value
for >3.5mn active paying subscribers within our music
ecosystem (VK, OK, Boom)
VK introduced a new format of music recommendations, which
has moved to the separate “For You” tab. In this tab, users can
find the “Artists for you” block and two playlists. Song and
artist recommendations are formed taking into account users’
interests, preferred genres and track history
There are two 100-track playlists: “Today”, which is updated every
day and a weekly updated list
In the “Artists for you” block, users can find artists that they are
certain to like and tracks that they have recently listened to
Upcoming concert announcements of users’ favorite groups or
artists will be added soon
Source: Internal data 18OK: unique social and entertainment platform
• Russia MAU is stable at 42 mn in Q2, with mobile MAU up by
Mobile MAU, Russia, Q2
6.3% YoY, having hit a new milestone of 35 mn in Q2
• The lockdown regime in Russia peaked in April, which resulted in a
spike in user activity. For example, the number of video views in
April has grown YoY by 27% with a new record of 1 bn+ in daily
views at peak 2020
• Overall, OK users sent >14bn virtual gifts in Q2, which marked a 2019
44.7% YoY increase
• OK Live app MAU increased by 76% YoY and number of live
videos created was up 29% QoQ April May June
• In order to retain users post the pandemic OK continues to enhance
its communication services, including the ability to extend video
calls to non-OK registered users using a link Presents sent on OK, Q2
• OK users can also now upload their own sticker sets on the
messaging platform: during the first week users uploaded 5x more
sticker sets than were already on OK platform
14 bn 1 bn 230+ mn 2020
2019
virtual gifts in daily video views audio and video
sent in Q2 at peak in Q2 calls in Q2
April May June
Source: Internal data 19OK & its unique monetization model
• Thanks to engagement growth due to the lockdown
regime IVAS was the main driver of OK revenue in Q2 SMB ads revenue, Q2
• At the same time, a gradual exit from lockdown regime
also led to a positive trend in OK’s Q2 ad revenue within
certain segments in Q2. For example, outstream video
ad revenue grew by >7% QoQ and the “carousel” 2020
2019
ecommerce ad format also had positive dynamics,
with related revenue +15% MoM in June
• OK is also seeing a gradual recovery of the advertising
market and the return of major advertisers which led to an April May June
avg CPM growth of 9% MoM in June and +21% versus
April
• In the meantime, OK continues to develop business
platform for SMEs, with revenue from internal ads
manager having tripled YoY in Q2. As of now, over 1mn
users run business through their OK pages, which we see
as a major future monetization opportunity ~1mn
SMB pages on OK, 2Q20
Source: Internal data 20OK: lockdown-supported mobile gaming platform growth in Q2
• OK’s gaming platform has been among key
contributors to IVAS revenue growth for the Group
in Q2
• COVID-19 triggered a spike in mobile games time
spent, up 40% YoY in May Payouts to mobile game developers,
• In total, during the main lockdown months of April and (5M20)
May users spent over the 51 000 years on mobile
games within OK
• Mobile game MAU was 31% in Russia YoY in May,
with mobile game downloads up 58.8% YoY
• OK paid RUB360mn to mobile game app developers
as of 5M20, up 80% YoY
• Moreover, developers’ advertising revenues were up
87% YoY despite the pandemic
2018 2019 2020
21
Source: Internal dataOK as a symbol of rising synergies within the Group
• As a sign of increasing cross-selling and integration
within the Group, OK technology and neural
networks were used to launch Videocalls Mail.ru, a
free video calling service supporting up to 100
participants. No MRG registration is required to
connect to the call
• The new service is already integrated with Mail.ru
email and Calendar services, with ability to create a
conf call link, send an invite, set up a reminder. They
are also accessible from the main page of Mail.ru
Group’s portal service
• In early Q3 OK also launched business platform
called “Robby” for moderation and content
classification for different types of business. The
technology is unique on the Russian market and based
on neural networks and crowdsource service,
capable of processing up to 600 mn units of content
per day
• As an internal product Robby was integrated into
multiple Mail.ru Group’s projects such as OK, Youla,
Citymobil, myTarget, ICQ, MY.Games and is now also
available for external clients
Source: Internal data
22Marusia voice assistant and Capsule smart speaker update
• Marusia has been the first Group’s app to adopt VK Connect authorization flow, while platform for
developers has been launched on VK Developers site allowing to create third-party skills for Marusia
• Marusia is now integrated with Delivery Club, with users able to do repeat orders by voice
• Marusia has been integrated in Mail.ru Android app, while its web version has been integrated and is
now available to ~10% of portal’s Main page users
• Marusia controls devices from 7 different Smarthome Platform Vendors – Rostelecom, Redmond,
Elari, Aquara, Hiper IOT, DIGMA, MiMiSmart
Capsule smart speaker powered by Marusia was released on April 22nd
• Product is sold through Mail.ru own online store Capsula.mail.ru and is available across the major
retail chains (e.g. Mvideo/, DNS, OZON, Wildberries, Aliexpress, Samokat, Svyaznoy, Megafon,
Citylink, Technopark, Redmond)
• We have also partnered with Rostelecom and Capsule is promoted by the Operator across its 13.2mn
broadband subscriber base. Capsule also enables voice control of Rostelecom’s WINK video OTT
service
Source: Internal data
23More than just email – in the center of users’ daily life
Our e-mail service remains the largest in Russia/CIS and top-5 globally
Major strategic focus areas remain unchanged, with many
new features introduced during Q2:
• Smart
New Settings interface was rolled out to 100% of web
users
“Email to Self” feature was enabled by 6% of DAU mn mn
Search quality increased by 12% by adding instant email
search and interface changes, which are being rolled out
to users
49.9 MAU*
31.6
Mobile MAU*
• Useful
Saw a 34% increase in processed payments in Q2
Launched Apple Pay and Google Pay for payment % %
• Secure
notifications and QR-code supported payments
New anti-phishing alerts for suspicious emails went live
52
Total monthly
+19
Mobile MAU,
New promo to check that coverage* YoY**
the user still owns his phone number generates 1mn
profile updates daily
Source: *Mediascope, Web Index, Russia 0+, 12+, April 2020, **Mediascope, Web Index, Russia 100+, 12-64, April 2020 24MY.GAMES: COVID-enhanced performance in Q2
• MY.GAMES revenue rose by 46% YoY in Q2 (to RUB11 018mn), with significant acceleration versus 13.4% YoY
in Q1
• Share of international revenues rose to 74% (up from 70% in Q2 2019), on track towards our goal of 80%+ in
2022
• The share of mobile revenue is also increasing, at 67% in Q2, also nearing our 80% target
Major growth acceleration in Q2 was driven
by:
Unusually strong engagement across the
68% 69% 70% 74%
Share of International portfolio, especially during the peak of lockdowns in
Revenue 11 018 April and especially across PC and console –
46% traditional stay-at-home platforms
13.4% 7 896 Multiple new launches in March – May (World Above:
7 545
6 960 67% Cloud Harbor, Warface Breakout, Dino Squad)
Benefit from consolidation of BeIngame in Q1 with
66% 66%
65% contribution from their Zero City mobile title
Temporary RUB weakness
33%
35% 34% 34% • April 2020 marked the peak in MMO Games revenue
growth (>60%)
Q1 19 Q1 20 Q2 19 Q2 20 • This started to moderate in May, with further
PC/Consoles Revenues Mobiles Revenues normalization in June, moving our growth rates to
the usual Q2-Q3 trends, with the traditional seasonal
Source: Internal data decrease in audience activity 25MY.GAMES is the driver of international revenues for the Group
• MRG was among the top-3 European mobile app publishers in terms of revenues in 2019, being the only Co
headquartered in Russia among the top-10. This progress was driven largely by the games segment,
• International gaming revenue share stood at 74% and accounted for >30% of the Group revenue
• International gaming revenues showed a $400mn run rate in Q2, supported by lockdowns
• Related revenue streams support the Group during the period of RUB weakness, which occurred during Q2,
for example
MMO Games revenue split, $mn 37
43
32
39 32 33
32
38 37 32 31
30
33 103
41
38 80 83
68 74 74
66
31 25 25 51 53 54 57
32 30 27 25 45
34
23 27
6 10 12 11 13 13
6
Q1 Q2 Q3 Q4 Q1 Q2 Q3 Q4 Q1 Q2 Q3 Q4 Q1 Q2 Q3 Q4 Q1 Q2 Q3 Q4 Q1 Q2
2015 2015 2015 2015 2016 2016 2016 2016 2017 2017 2017 2017 2018 2018 2018 2018 2019 2019 2019 2019 2020 2020
International Local revenue
Source: Internal data 26MY.GAMES: MAU growing, albeit normalizing towards pre-COVID level
MAU continues to grow, with normalization towards typical seasonal trends following a lockdown-lead spike in Q2
• The number of global registered users in MY.GAMES games rose by 26.4% YoY to ~700mn in Q2
• Traditionally, there is a seasonal decrease in the active audience in games in Q2. Yet, given the lockdowns
globally happening in Q2 we saw a 10.3% increase in MAU QoQ (+11.1% YoY)
• Peak month for active audience was April, which coincided with the peak in lockdowns globally (ex China)
• MAU growth was driven by attraction of new players as well as increased engagement of our core audience
MAU trends, mn
10.3% • MAU trends have since normalized towards
-2.5% March level as lockdowns have been taken down
globally
-1.2%
• Ignoring the temporary COVID-related MAU spike,
our focus international markets have seen a
record 57% growth since Jan 2019, which is what
will continue to drive our revenue growth, looking
ahead*
Q1 2018 Q2 2018 Q3 2018 Q4 2018 Q1 2019 Q2 2019 Q3 2019 Q4 2019 Q1 2020 Q2 2020
Source: Internal data * US, GR, GB, IT, FR, CH, JP, KR 27MY.GAMES & COVID effect on installations and CPM in Q2
• MY.GAMES saw strong lockdown-driven effects on both revenue as well as costs in Q2
• Platform saw a sharp increase in engagement and monetization, with a spike in new installations, which
benefited from reduced pricing across the main advertising platforms following the initial COVID-19 shocks
across digital advertising markets globally in March and April. This resulted in attractive CAC opportunities
• Since the second half of May advertisers began to gradually return to the advertising market, contributing to the
return of prices to their usual seasonal values, which has carried into July
• Given the COVID effect, profitability peak of 2020 in Games might be skewed towards Q2
New Installations CPM (FB / US / Hustle Castle)
Jan Feb Mar Apr May Jun Jan Feb Mar Apr May Jun
2019 2020 2019 2020
Source: Internal data
28MY.GAMES: Key current portfolio developments
• Our legacy and new titles have been performing well. Our focus remains on mobile and the top-5 revenue-
generating mobile games in Q2 were War Robots, Hustle Castle, Left to Survive, Love Sick: Interactive
Stories, and Zero City
War Robots (M) - Top-3 Left to Survive (M):
Reached a milestone of 169mn in reached 25mn downloads and hit a
downloads with a new record in monthly monthly revenue record of
revenue (~RUB1bn) and EBITDA RUB184mn in June
(~RUB0.5bn) achieved in May
Hustle Castle (M) - Top-3 Warface: GO (M)
saw a 53.5% increase in registrations in F2P mobile title launched
April and has 64m in downloads. In light of in January, has 9m downloads
COVID, it reached another monthly revenue
record of ~RUB800mn, while remaining
among our highest EBITDA contributors
Conqueror’s Blade (PC):
Love Sick (M) - Top-10
2.7mn registered users in Q2 - in March
increased installs by 5.6x QoQ in Q2 ,
(+70% MoM) and April (+63% MoM). May
with ~18mn downloads since its launch
saw revenues grow 16% vs April, and 150%
last Feb and a daily peak of ~RUB6.7mn
vs Jan-Feb
in revenues seen in April
Source: Internal data 29MY.GAMES: Key franchise development progress - Warface
• Being in its ninth year of operation, Warface is the most diversified franchise of MY.GAMES, available across 5
platforms on PC, console and mobile. It also demonstrates our ability to deliver consistent revenue growth despite
maturity and high base, with Warface also being a top-3 revenue generator for MY.GAMES
• In May we launched Warface: Breakout, a premium P2P tactical first-person shooter on Xbox One and PlayStation
4, latest addition to the Warface franchise family. Breakout was developed by Allods, an internal studio which has
already successfully transferred the original Warface to PlayStation 4, Xbox One and Nintendo Switch
MAU
• Warface’s Switch audience reached 2m since its launch on Feb 18
Revenue
• We will continue to invest into further scaling of Warface
Forecast*
H1 2020
Actual
1 2 3 4 5 6 7 8 9
2012 2013 2014 2015 2016 2017 2018 2019 2020
Warface CIS + Warface WW +Warface +WF: Mobile +WF: Breakout
PC PC PS / Xbox +WF Nintendo
Source: Internal data. * Forecast represents revenue estimate for FY 2020. MAU in 2020 is actual as of H1 2020
30MY.GAMES: Key franchise development progress - Hustle Castle
• Нustle Сastle (HC) remains among the most successful in-house developed gaming projects, with its game
mechanics used in new products (Zero City, American Dad) to form a strong franchise and boost our expertise in
RPG strategies
• Operating all 3 products in one Studio Nord studio hub allows not only to optimize expenses, but also to get
maximum benefits from new content and monetisation updates
MAU
Revenue
Forecast*
2017 2018 2019 2020
Hustle Castle + American Dad +Zero City
iOS, Android iOS, Android iOS, Android
31
Source: Internal data. *Forecasted revenue represents our estimate for FY 2020. MAU in 2020 is actual as of H1 2020MY.GAMES: recent launches and pipeline
• Our key launches tend to be concentrated in H1 due to favorable competitive environment and ad pricing
• Given the explosive user activity in Q2 we increased frequency and depth of in-game events across all our mobile
titles, refined tutorials to simplify entry for new users and increase engagement, improved marketing
performance through A/B test extension and more tailored offers. We tried to deliver a vast variety of content while
facing the challenge of meeting publishing commitments while working remotely
• We managed to deliver 3 new products on time in Q2, along with successfully integrating BeIngame studio
consolidation and its Zero City title. Our focus on mobile and fully online distribution made us relatively well
positioned and therefore allowed to fully benefit from the period of elevated user engagement
We have 15 games in development across PC/consoles & mobile, with
6 suitable for release in the next 6-9 months
WF: Breakout PS/Xbox
WF Nintendo World Above The decision on launches will be made on the basis of post-lockdown
market and user conditions. Our goal is to continue to meet budget
2020 WF GO Dino
expectations, with consistent growth and attractive margins
Q1 Q2 Q3 Q4
2019
Space Justice Bombastic Brothers Zero City
Love Sick Conqueror's Blade Lost Ark
Tacticool
Source: Internal data 32MY.GAMES: latest releases
• Warface: Breakout (May, PS4 and Xbox One) – 1st person tactical competitive
shooter with buy-to-play (B2P) monetization, targeting mostly to NA&EU players
• June - Dec 2020 – launch of 3 seasons with content updates and gameplay
improvements and potential for a PC version launch
• World Above: Cloud Harbor (April): F2P casual mobile game developed by ITT
Studio, developers of Hawk, Juggernaut Wars, Evolution 1 & 2 mobile games
• Key gameplay – merging objects and collecting dragons in the world with unique
weather mechanics and terrain transformation, great 3D art, exciting story related to
Vikings epos. >1m installs and was among top-10 revenue generators in June
• Dino Squad (April, OBT launch) – dynamic mobile PvP shooter by
Pixonic Studio, author of the world’s mobile hit War Robots
• Key gameplay – collection and upgrade of various armored dinosaurs
and compete vs other players in multiplayer battles
33
Source: Internal dataMY.GAMES STORE development continues
• MY.GAMES Store is the central part of MY.GAMES gaming ecosystem, which aggregates the entire gaming
audience of the company on a PC platform. It also broadens our B2B access and helps build related relationships
• The beta version of MY.GAMES Store was launched in Dec to empower internal and 3P developers with a broad
range of technical and analytical tools, so they can take control of their publishing experience, maximize the
effectiveness of their ad campaigns, scale their game, and boost their own revenue and audience
• MY.GAMES Store in June offered a new additional developer-friendly revenue share option entitling developers to
90% of the revenues on traffic they bring in themselves, with the traditional 70% share remaining for traffic generated
by the platform
From To
Play alone Group play
Buy software In-game monetization
Buy hardware Rent access
Non-spectator Spectator
Software made Software for all devices
for hardware
MY.GAMES Store MAU – 13M
Source: Internal data 34Youla: ongoing recovery after April’s COVID-related decline
New listings Deals
23% 12%
YoY YoY
Jan'20 Feb'20 Mar'20 Apr'20 May'20 Jun'20 Jan'20 Feb'20 Mar'20 Apr'20 May'20 Jun'20
Source: Internal data 35Youla: positioned for growth in a weak macro and longer term
Total revenues
RUBbn Revenues • Target for 2020: RUB 2.7-3bn
2.7-3.0
• Strong pipeline of Group’s ecosystem integrations, as well as B2B
2.1 focused developments to drive growth
Generals & Services:
• The largest by share in revenues and less cyclical
1.1
• Both have been the least impacted by COVID-19
1H Real estate:
actual • Growing penetration in regions and with initiatives in B2B stream to support growth
• Revenues have recovered to pre-COVID level
2017 2018 2019 2020e
Jobs:
• Focus on blue-collars, which may show solid performance even in weak macro
fueled by further migration to online (as was seen in 2015)
Verticals revenue split • Strong recovery following lockdown cancelations (# of vacancies in June exceeded
that of pre-COVID level)
EBITDA • Target for 2020: proportionate loss at or below 2019 level
Generals & Services • Flexibility in cost saving in response to revenue growth slowdown (with
Real estate Q2 being an example of that)
Jobs • Marketing cost savings are subject to revenue performance
Cars • Continued investments in product & tech to execute on strategic roadmap
• R&D cost savings through deployment of Group’s tech expertise
• Access to internal sources of traffic by integrations with MRG ecosystem
Source: Internal data 36Youla & Worki: Recent product developments
Storefront for shops and pro-sellers
• Store information with ratings
• Option to subscribe for new product notifications
• Product catalogs searchable using category filters or search
bar, filters by price or publication date
Video interviews on Worki
• Remote interviews without
leaving the platform
• Deploys MRG tech expertise
Video in Stories on Youla
• New promotion feature for sellers
• Diverse listing related content for buyers
• Direct video upload with no need to use 3rd party
video platforms like on other classifieds
• Deploys OK tech expertise
37Worki: deepening integration with the Group
Cross-posting of vacancies
• 14x more views from access to
combined reach of 2 platforms
Subscription for vacancies directly
from email service
• Personalized job compilations and
notifications
• Access to 30m+ MAU
Mini App for recruiters in VK
• Convenient tool for sourcing
candidates in both HR communities in
VK attracting millions of subscribers
and Worki database from one window
Source: Internal data 38Heavy presence in digital professions vertical in edtech
• Following consolidation of Skillbox in Q4 2019, we acquired a minority stake in SkillFactory (18.31%) in Q1, with an
option to further increase our stake. Our edtech ecosystem now includes Skillbox and Geekbrains, where we hold
control, as well as minority stakes in Algoritmika and SkillFactory
• Our online education products generated a combined ~RUB 1bn in revenues in Q2, growing by 265% YoY YoY
• Albeit growth is expected to moderate as the COVID-19 demand spike normalized post lockdowns, online education
market in Russia is expected to expand by 50% in 2020 and we aim to outperform the broader market
• Our platforms are seen as capturing >40% market share within digital professions online segment
Other
6
School
Corporate learning
learning 17 K-12
7
RUB50bn
market size in
Digital 2019,
professions growth over
5 50% in 2020
(dominated by
Mail.ru Group)
15
Language
learning
39
Sources: company data, SkyEng market research, Netology market research, Interfax data for 2019Our edtech assets provide training products for almost all types of
digital professions
Data Science
Business model Programming Marketing Design Management Games/Video
and Analysis
Geekbrains • Access to educational
(control) ecosystem ✓ ✓ ✓ ✓ ✓ ✓
• Scheduled regular Main focus Main focus Main focus
webinars with experts
• Access to content and
Skillbox
(control)
tasks after webinar
✓ ✓ ✓ ✓ ✓ ✓
Main focus Main focus Main focus
• Access to educational
ecosystem
Skillfactory • Access to content-bank ✓ ✓
(minority stake) of pre-recorded video
• Webinars used mostly for Main focus
Q&A and as a marketing
tool
Source: Internal data 40Focus on diversity across educational mechanics
• With a goal to achieve high student engagement and strong retention
Educational process Outcome
Pre-recorded video Self-study and Mentor Final big project Employment
lessons / Webinars homework task
• Unlimited access • Every study block • Live- • Final big project task • New skills make job search
to educational is accompanied chat/consultation allows to apply new easier for students
materials / Access with homework with mentors – any skill to solve • Companies are establishing
to online classes tasks questions and/or business problems own career centers to help
(webinar) with • Homeworks are experience • Some tasks come students find a job
teachers reviewed by a exchange from real large
teacher/mentor businesses
(partners)
Source: Internal data 41B2B updates from Mail.ru Digital Technologies
Mail.ru Cloud Solutions (MCS) – new releases:
• Kubernetes federation with Amazon Web Services
• Arenadata DB (is a distributed DB based on using
massively parallel processing principle)
Key projects:
• Completed the 1st phase of the State Unified Cloud Tarantool – new releases:
Platform • Tarantool Cartridge v. 2.0.0 – our framework for distributed
• Private Cloud for X5 Retail Group applications development
• Cloud Migration of the Enterprise Infrastructure in Philip • Tarantool Data Grid, our product for fast and simple
Morris International development of data processing microservices went live with
version 1.6.3.
• Start of cooperation with Transneft
• Tarantool Training program has started in Q2, with 100+
• Higher School of Economics migration (TOP1 University in engineers and architects participating
Russian Federation by Forbes 2020) project around
distance learning New projects:
Major new customers: • Customer Information Profile (CIP) project in X5
• Auchan • Customer Profiles project with VTB
• Sollers (leading Russian automotive company)
• Magnit (№4 «200 largest private companies in Russia
2019» by Forbes Russia)
Sources: Internal data
42Solid M&A track record across verticals
• No M&A has taken place in Q2, although it is part of ongoing operations, especially for MY.GAMES through MRGV
• We report using pro-forma, with ~30% revenue CAGR for the Group for the past 10yrs on organic basis
Revenue growth since the acquisition
VK (w/o Music) Music GeekBrains SkillBox
Q3 14 Q2 20 Q1 19 Q2 20 Q3 16 Q2 20 Q4 19 Q2 20
Pixonic Bit Games Panzerdog SwagMasha
Q3 16 Q2 20 Q1 18 Q2 20 Q2 19 Q2 20 Q3 19 Q2 20
Source: Internal data 43DC is the food delivery market leader in terms of users…
• Following the ease of lockdowns starting in May there was slight moderation in usage, a bit more aligned with
typical seasonality (Q2-Q3 being the low season)
4,5
Monthly active users, mobile apps, mn
4,0
Delivery-club Yandex.Eda
3,5
3,0
2,5
2,0
1,5
1,0
0,5
0,0
Jul.19 Aug.19 Sep.19 Oct.19 Nov.19 Dec.19 Jan.20 Feb.20 Mar.20 Apr.20 May.20
Source: Mediascope, Russia, mobile apps only, cities 100k+, age 12-64. 44…and downloads
Downloads, iOS and Android combined, ths
1200
1100
Delivery club Yandex.Eda
1000
900
800
700
600
500
400
300
200
100
0
2018 2018 2018 2018 2018 2018 2018 2018 2018 2018 2018 2018 2019 2019 2019 2019 2019 2019 2019 2019 2019 2019 2019 2019 2020 2020 2020 2020 2020 2020
-01 -02 -03 -04 -05 -06 -07 -08 -09 -10 -11 -12 -01 -02 -03 -04 -05 -06 -07 -08 -09 -10 -11 -12 -01 -02 -03 -04 -05 -06
Source: AppAnnie 45Q1 2017
Q2 2017
1P orders
Source: Internal data
Q3 2017
Q4 2017
Q1 2018
Q2 2018
Q3 2018
Q4 2018
Q1 2019
Q2 2019
Q3 2019
Q4 2019
3.9x
balance between 3P and 1P
Q1 2020
Q2 2020
Q1 2017
Q2 2017
Q3 2017
Q4 2017
1P/3P orders split
Q1 2018
Q2 2018
Q3 2018
Q4 2018
Q1 2019
Q2 2019
New benchmark of 16mn orders reached in Q2, with a
Q3 2019
Q4 2019
Q1 2020
Q2 2020
1P
3P
46Continued growth of all the key metrics
Geographic expansion Active users
Cities of presence, 1P Overall geographic coverage 1, DC active users3, mln
3P+1P
YoY
Q2 2019 18* 132 Q2 2019 1,8
x 2.5
Q2 2020 82* 208 Q2 2020 4,3
Restaurants Revenue
Number of restaurants2, ths RUB mn
2,5
1,8
Q2 2019 11,0 1,5
1,2
0,9 0,9
0,4 0,4 0,4 0,6
Q2 2020 24,6
Q3 2019
Q1 2018
Q2 2018
Q3 2018
Q4 2018
Q1 2019
Q2 2019
Q4 2019
Q1 2020
Q2 2020
1 – Including city-like districts
2 – Restaurants capable of taking orders during the last month of reporting period
3 – Users with at least 1 order during the period 47
* If calculated as cities and 149, if calculated as localities, including city-like districts (vs 50 as of Q2 2019), which is the basis for calculation of overall geographic reachSamokat: egrocery business surge
• O2O JV completed acquisition of 75.6% stake in Samokat express delivery platform present in Moscow and St Petersburg
and consolidated financial statements of Samokat since May 2020
• Samokat reached 3.6mn orders in Q2 (+42x YoY) approaching 45,000 in daily orders, operating in Moscow, Saint-
Petersburg and related regions
• Samokat revenue was up 3.5x QoQ and 70.9x YoY in Q2 to >RUB 2bn and the number of dark stores now exceeds 230
• Samokat increased delivery zones in partnership with YouDrive. Integration with Citymobil and AliExpress is ongoing
Orders, ths Number of dark stores
42x 2.1x
1Q19 2Q19 3Q19 4Q19 1Q20 2Q20 Jan Feb Mar Apr May Jun
Source: Internal data 48Despite the COVID outbreak in Q2 CM continued to gain
share while improving unit economics
CM grew its share in Moscow And significantly progressed
as well as in the market as a whole on its path towards positive unit economics
[Moscow] Share by major players, April 2020 vs. April 20191 Contribution per trip, 2019-2020 Drivers of unit economics improvement
Citymobil Q4 2019 Q1 2020 Q2 2020
19%
29%
Citymobil share uplift:
Optimizations in driver
68%
13% Other
63% 8%
+10 pp YoY and client subsidies
YT+Uber
Introduction of a new
Apr 2019 Apr 2020 dispatch system
[Russia] Share in taxi apps downloads, May YTD 2020 vs. 20192
Increasing client bills
14% due to more aggressive
24%
surge and higher tariffs
44% Citymobil share uplift:
49%
37%
+10 pp YoY
32%
-49%
2019 2020 YtD
49
Source: 1 – Moscow Department of Transport; 2 – UBSCM: back to pre-COVID level
CM has not only outperformed pre-COVID levels,
but also reached a new peak in terms of orders Initiatives in main app and
new sources of growth
Weekly orders, March-June 2020 +6% boosted rides in Q2
vs. pre-COVID
Start of self- #vsedomoy
isolation period A federal promotion campaign which
stimulated demand in the period when
business was hit the most
New record in
weekly orders Delivery
Launched in early April
New launches
Tyumen (population of >500k) and several
smaller launches in Moscow and Spb
region in June expanded reach and
brought new clients and rides
March April May June
50
Source: Internal dataCM growth support from outside of the main app
Delivery became an important value driver VK Taxi gained strong momentum
both B2B and C2C thanks to consistent collaboration with VK Team
Delivery monthly rides, 2020 VK Taxi monthly rides, 2020
x 1.7 >66K
x 5.7
orders in peak
days Start of active
promotion,
rebranding,
Branded VK Taxi further product
cars were improvements
launched in July
Apr 2020 May 2020 June 2020
[Launch]
Major product
modifications,
Selected partners: Pilot launch no promotion
Q4 ‘19 Q1 ‘20 Q2 ‘20
51
Source: Internal dataCM in 2020: growth, efficiency & O2O JV synergies
Business Path to Synergies
priorities
Scale
profitability
Key goals for • Expanding market share • Increasingly focusing on • New marketing & product
2020 in existing cities and further improvement in synergies with both
launches in select new unit economics across ecosystems
geographies all markets • Leveraging R&D
• Targeting solid #2 • Targeting positive unit capabilities of both
position in Russia economics (>50% GMV ecosystems (2GIS geo
positive by the end of platform, AI, computer
• Finding growth outside
2020) vision)
of the main app (incl. VK
Taxi, Delivery, Delivery • Rolling out a new fleet
Club, YouDrive product in collaboration
integrations etc.) with SberLeasing
52
Source: Internal dataAER JV – cross-border and local business expansion
• Platform’s DAU: 8.8mn in June (+17% YoY)
• Registered users: >130mn (+10% YTD)
• GMV: 30%+ MoM and up 60% versus April in June, with a goal to reach $10bn in overall GMV in 2022-23 with ~50mn
in annual customers
• Local GMV share: ~20% (>14,000 sellers, 2mn SKUs) vs ~10% in Oct 2019 and a target of ~50% in 2022-23
• Average check: +38% in June
• Ongoing logistics/customer experience improvements:
+3 direct flights from China to Moscow with a goal to offer 10-day
avg delivery from China vs typical 50-60 day delivery 3x in 12M 80%
~450 programmers joining by FY21 to fully localize customer
60%
support functions
AliExpress LIVE: with >110mn views since March and RUB125mn 40%
in related purchases during the first month
20%
Ongoing social integrations with Mail.ru Group.
0%
Oct 2019 June 2020 2022-23
Cross-border Domestic
Source: Internal data 53Q2 & H1 2020 revenue and profitability update
• Revenue growth accelerated in 2Q, mainly driven by MMO Games, which grew by 47.7% (to RUB10.1bn,
supported by lockdowns. In the meantime, online advertising declined by 5.2% YoY given the adverse
COVID effects on the broader local economy and business outlook
• EBITDA margin stood at 29.5% in 2Q, supported by Games, despite the ongoing investments into the core
Q2 and H1 2020 Revenue and profitability review
RUB MN Q2 2019 Q2 2020 Y-o-Y H1 2019 H1 2020 Y-o-Y
actual Actual growth, % actual actual growth, %
Revenue 20,210 25,373 25.5% 39,755 47,703 20.0%
Online advertising 8,417 7,983 -5.2% 16,244 16,536 1.8%
MMO games 6,859 10,132 47.7% 13,290 17,305 30.2%
Community IVAS 3,898 4,550 16.7% 8,099 9,196 13.5%
Other revenue 1,036 2,708 161.4% 2,122 4,666 120.1%
EBITDA 7,194 7,475 3.9% 12,698 13,204 4.0%
EBITDA margin, % 35.6% 29.5% 31.9% 27.7%
Net profit 3,193 3,455 8.2% 6,026 5,659 -6.1%
Net profit margin, % 15.8% 13.6% 15.2% 11.9%
Capex -1,586 -2,035 28.3% -3,079 -4,133 34.3%
% of revenue -7.8% -8.0% -7.7% -8.7%
Source: Internal data
Note 1: Net profit includes the impairment of Skyforge in the amount of RUB 630m in Q2 2019 54Q2 2020: performance across operating segments
Q2 2020 operating segments performance
Communications
RUB MM Games New initiatives Eliminations Group
and Social
Total segment revenue 11,737 11,018 2,686 (68) 25,373
Y-o-Y growth 0.7% 46.0% 138.5% -40.0% 25.5%
Total operating expenses* 6,016 8,656 3,294 (69) 17,897
Segment EBITDA 5,721 2,362 (608) 1 7,475
EBITDA margin 48.7% 21.4% -22.6% 29.5%
Net profit 3,455
Net profitability 13.6%
Source: Internal data
*Total operating expenses include Group corporate expenses allocated to the respective segment. 55H1 2020: performance across operating segments
H1 2020 operating segments performance
Communications
RUB MM Games New initiatives Eliminations Group
and Social
Total segment revenue 24,263 18,914 4,667 (141) 47,703
Y-o-Y growth 4.7% 30.4% 109.5% -1.6% 20.0%
Total operating expenses* 11,846 16,032 6,762 (141) 34,499
Segment EBITDA 12,417 2,882 (2,095) 0 13,204
EBITDA margin 51.2% 15.2% -44.9% 27.7%
Net profit 5,659
Net profitability 11.9%
Source: Internal data
*Total operating expenses include Group corporate expenses allocated to the respective segment.
56Headcount evolution
• Despite the recent COVID-19 and related macro shock, we have not changed our approach to hiring
across the core units, with headcount up ~16% YTD
• Group’s headcount reached ~7.4k as of Q2 2020 given organic expansion of the Group, with no M&A
activity during the quarter. Some of the business units most actively growing their headcount included VK,
B2B, Voice technology as well as online education team and select games studios
• Headcount does not include as ESForce, which remains as asset held for sale
Total headcount, eop
7344
5567 6217 6753
4 419
Dec-17 Dec-18 Dec-19 Mar-20 Jun-20
Mail.ru Group
Source: Internal data 57MRG is backed by the leading global internet companies
• ~50% of Mail.ru Group’s GDRs are
listed on LSE, with trading of GDRs 27.6%
now also available on the Moscow
Exchange in RUB through a local
listing since July
• Blue-chip shareholder base includes
Prosus (since 2006, initially through
48.6%
Naspers), Tencent (since 2010) and
most recently Alibaba (since 3Q19) as
well as Sberbank (as of 4Q19)
7.4%
10.0%
5.2%
Naspers Tencent Alibaba MF Technologies Free float (LSE)
58
Source: Public data. Free-float number includes 1.2% held by Mail.ru Employee Benefit Trustees LimitedMRG shareholder structure details
MFT Freefloat
Economic 27.6% 10.0% 7.4% 5.2% 49.8%
Voting 12.3% 4.4% 3.3% 58.3%* 21.7%
Source: Public data as of March 31, 2020, calculated on fully diluted basis, accounting for DRs sitting in employee benefit trust (non-voting)
Naspers holding is done through Prosus since 3Q19
* USM/MegaFon votes (~54%) within MFT have been delegated to the CEO of Mail.ru Group (Russia) – Boris Dobrodeev since October 2018
MFT shareholder structure: MegaFon (45%), Sberbank (36%), Rostec (10%), USM (9%)
59For further information please contact: Tatiana Volochkovich Mail.ru Group, Director of Investor Relations Office: +7-495-7250-6357 x 3434 Mobile: +7 905 594 6604 E-mail: ir@corp.mail.ru / t.volochkovich@corp.mail.ru
Disclaimer
This presentation has been prepared by Mail.ru Group Limited (the “Company”) and comprises the written materials for a presentation to syndicate research analysts or certain institutional investors.
Matters discussed in this presentation may constitute forward-looking statements. Forward-looking statements include statements concerning plans, objectives, goals, strategies, future events or performance, and underlying assumptions and other
statements, which are other than statements of historical facts. The words “believe”, “expect”, “anticipate”, “intend”, “estimate”, “forecast”, “project”, “will”, “may”, “should” and similar expressions identify forward-looking statements but are not the
exclusive means of identifying such statements. Forward-looking statements appear in a number of places in this presentation and may include statements regarding: strategies, outlook and growth prospects; future plans, expectations, projections
and potential for future growth; plans or intentions relating to acquisitions; future revenues and performance; liquidity, capital resources and capital expenditures; economic outlook and industry trends; the impact of regulatory initiatives; competitive
strengths and weaknesses; and the strengths of competitors. The forward-looking statements in this presentation are based upon various assumptions, many of which are based, in turn, upon further assumptions, including, without limitation,
management’s examination of historical operating trends, data contained in Company records and other data available from third parties. Although the Company believes that these assumptions were reasonable when made, these assumptions
are inherently subject to significant known and unknown risks, uncertainties, contingencies and other important factors which are difficult or impossible to predict and are beyond its control. Such risks, uncertainties, contingencies and other
important factors could cause the actual results of the Company or the industry to differ materially from those results expressed or implied in this presentation by such forward-looking statements. No representation is made that any of these
forward-looking statements or forecasts will come to pass or that any forecast result will be achieved and you are cautioned not to place any undue influence on any forward-looking statement. No one undertakes to publicly update or revise any
such forward-looking statement.
Investment in the GDRs may involve substantial risk. References to future returns are not promises or even estimates of actual returns an investor may achieve. The forecasts contained herein are for illustrative purposes only and are not to be
relied upon as advice or interpreted as a recommendation. The information herein reflects the Company’s judgement of the prevailing conditions as of this date, all of which are subject to change. Past performance or experience does not
necessarily give a guide for the future. Neither the delivery of this presentation nor any further discussions with any recipient shall, under any circumstances, create any implication that there has been no change in the affairs of the Company since
such date.
This presentation does not constitute or form a part of, and should not be construed as, an offer or invitation to subscribe for or purchase any securities of the Company and neither this presentation nor anything contained herein shall form the
basis of, or be relied on in connection with, any offer or commitment whatsoever.
The Company's shares and GDRs have not been and will not be registered under the U.S. Securities Act of 1933, as amended. Securities may not be offered or sold in the United States absent registration under that Act or an available exemption
from it, and the Company does not intend to make a public offer of any securities in the United States
Within the member states of the European Economic Area (the “EEA”) this presentation is only addressed to and directed at persons who are “qualified investors” (“Qualified Investors”) within the meaning of Article 2(1)(e) of the Prospectus
Directive (Directive 2003/71/EC) (including any relevant implementing measure in each relevant member state of the EEA). In addition, in the United Kingdom, this presentation is being distributed only to, and is directed only at (i) Qualified
Investors who have professional experience in matters relating to investments falling within Article 19(5) of the Financial Services and Markets Act 2000 (Financial Promotion) Order 2005, as amended (the “Order”) or high net worth entities falling
within Article 49(2)(a) to (d) of the Order, or (ii) persons to whom it may otherwise lawfully be communicated (all such persons in this paragraph collectively being referred to as “Relevant Persons”). This presentation must not be acted on or relied
on (i) in the United Kingdom, by persons who are not Relevant Persons, and (ii) in any member state of the European Economic Area other than the United Kingdom, by persons who are not Qualified Investors. Any investment or investment
activity to which this presentation relates is available only to Relevant Persons or will be engaged in only with Relevant Persons.
The information and opinions contained in this presentation are for background purposes only and do not purport to be full or complete. No reliance may be placed for any purpose on the information or opinions contained in this presentation or
their accuracy or completeness. No representation, warranty or undertaking, express or implied, is given as to the accuracy or completeness of the information or opinions contained in this presentation by the Company and no liability is accepted
by us for the accuracy or completeness of any such information or opinions.
The information in this presentation is being circulated on a confidential basis, and is neither to be disclosed to any other person, nor copied or reproduced, in any form, in whole or in part without the Company’s prior consent.
By accepting delivery of this presentation you agree to be bound by the foregoing terms and acknowledge that you will be solely responsible for your own assessment of the market, the market position of the Company and the GDRs and that you
will conduct your own analysis and be solely responsible for forming your own view of the potential future performance of the Company’s business
.
You can also read