ICES WORKING GROUP ON SURVEYS ON ICHTHYOPLANKTON IN THE NORTH SEA
←
→
Page content transcription
If your browser does not render page correctly, please read the page content below
ICES WORKING GROUP ON SURVEYS ON
ICHTHYOPLANKTON IN THE NORTH SEA AND
ADJACENT SEAS (WGSINS; outputs from 2019
meeting)
VOLUME 2 | ISSUE 17
ICES SCIENTIFIC REPORTS

RAPPORTS
SCIENTIFIQUES DU CIEM

                          ICES    INTERNATIONAL COUNCIL FOR THE EXPLORATION OF THE SEA
                           CIEM    CONSEIL INTERNATIONAL POUR L’EXPLORATION DE LA MER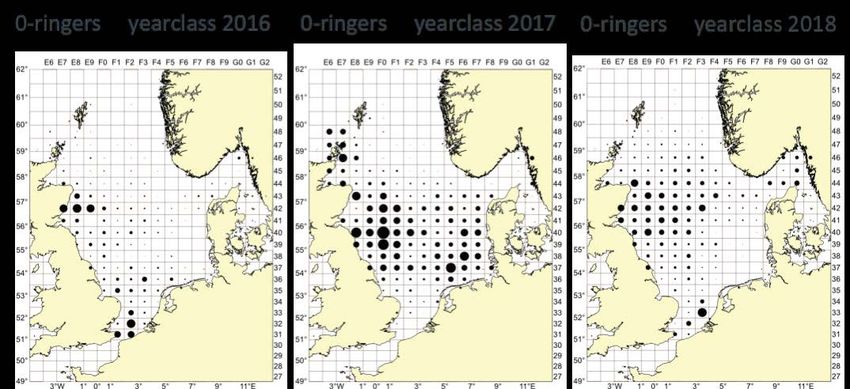
International Council for the Exploration of the Sea
Conseil International pour l’Exploration de la Mer
H.C. Andersens Boulevard 44-46
DK-1553 Copenhagen V
Denmark
Telephone (+45) 33 38 67 00
Telefax (+45) 33 93 42 15
www.ices.dk
info@ices.dk

The material in this report may be reused for non-commercial purposes using the recommended cita-
tion. ICES may only grant usage rights of information, data, images, graphs, etc. of which it has owner-
ship. For other third-party material cited in this report, you must contact the original copyright holder
for permission. For citation of datasets or use of data to be included in other databases, please refer to
the latest ICES data policy on ICES website. All extracts must be acknowledged. For other reproduction
requests please contact the General Secretary.

This document is the product of an expert group under the auspices of the International Council for the
Exploration of the Sea and does not necessarily represent the view of the Council.

ISSN number: 2618-1371 I © 2020 International Council for the Exploration of the Sea
ICES Scientific Reports

Volume 2 | Issue 17

ICES WORKING GROUP ON SURVEYS ON ICHTHYOPLANKTON IN THE
NORTH SEA AND ADJACENT SEAS (WGSINS; outputs from 2019 meeting)

Recommended format for purpose of citation:
ICES. 2020. ICES Working Group on Surveys on Ichthyoplankton in the North Sea and adjacent Seas
(WGSINS; outputs from 2019 meeting).
ICES Scientific Reports. 2:17. 33 pp. http://doi.org/10.17895/ices.pub.5969

Editors
Norbert Rohlf

Authors
Steven Beggs • Cindy van Damme • Carolina Giraldo • Hanna Holah • Bastian Huwer • Matthias
Kloppmann • Christophe Loots • Patrick Polte • Norbert Rohlf • Malin Werner
ICES   |   WGSINS 2019                                                                                                                                                |   I

           Contents
           i      Executive summary ....................................................................................................................... ii
           ii     Expert group information ..............................................................................................................iii
           1      Survey reviews............................................................................................................................... 1
                  1.1      The International Herring Larvae Surveys in the North Sea (IHLS) .................................. 1
                  The IHLS in 2019 ............................................................................................................................ 1
                  Planning for the 2020 IHLS surveys ............................................................................................... 4
                  1.2      The Downs Recruitment Survey....................................................................................... 4
                  The Downs Recruitment Survey in 2019 ....................................................................................... 4
                  Planning for the 2020 Downs Recruitment survey ........................................................................ 6
                  1.3      The MIK sampling during the International Bottom Trawl Survey (IBTS-Q1) .................. 6
                  MIK Results of the 2019 survey ..................................................................................................... 6
                  Herring larvae distribution and abundance................................................................................... 8
                  Sardine larvae ................................................................................................................................ 9
                  Coordination of the 2020 MIK sampling during Q1 IBTS ............................................................. 10
                  Simulations of effort reduction in MIK sampling during the Q1 IBTS.......................................... 10
                  The MIKeyM net sampling........................................................................................................... 12
                  Planning for the 2020 survey....................................................................................................... 13
                  1.4      The Western Baltic Rügen Herring Larvae Survey (RHLS) .............................................. 14
                  The RHLS surveys in 2018 ............................................................................................................ 14
                  N20 index in 2018 ........................................................................................................................ 14
                  Relation between N20 and GERAS 1-wr herring ......................................................................... 16
                  1.5      The Northern Irish Herring Larvae Survey (NINEL) ........................................................ 17
                  Survey Results in 2018 ................................................................................................................. 17
                  1.6      The UK (Northern Irish) MIK Survey (NIMIK) ................................................................. 18
                  1.7      A pilot survey on the feasibility of establishing a sprat recruitment index based
                           on larval sampling during Q3 IBTS surveys .................................................................... 20
                  Background.................................................................................................................................. 20
                  Survey description ....................................................................................................................... 20
                  Preliminary results and outlook .................................................................................................. 21
                  1.8      Marine Litter sampling during the Q1 MIK-IBTS and other MIK surveys ....................... 22
           2      Data handling .............................................................................................................................. 23
                  2.1      ICES eggs and larvae database ....................................................................................... 23
                  2.2      Additional Data products ............................................................................................... 24
                  2.3      Species identification ..................................................................................................... 25
           3      References ................................................................................................................................... 26
           Annex 1:        List of participants.......................................................................................................... 27
           Annex 2:        Resolutions .................................................................................................................... 28
           Annex 3:        Survey Summary Sheets................................................................................................. 30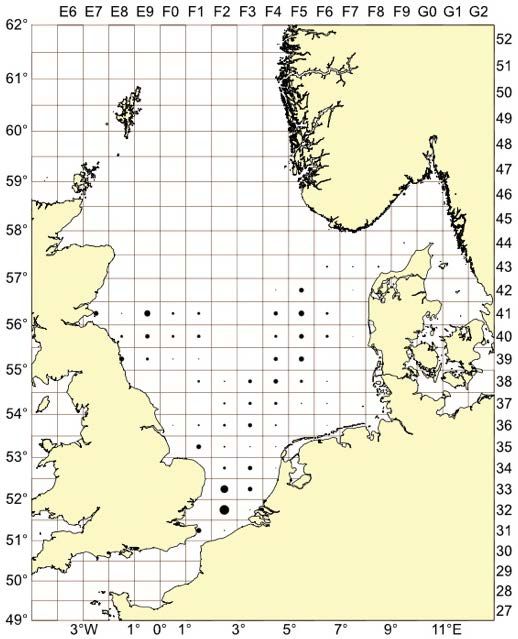
II   |   ICES SCIENTIFIC REPORTS 2:17                                                                           |   ICES

     i Executive summary

         The objectives of the Working group on Surveys on Ichthyoplankton in the North Sea and adja-
         cent Seas (WGSINS) were to review Ichthyoplankton surveys undertaken for assessment pur-
         poses, coordinate the surveys in 2020, prepare data for archiving, provide quality assurance on
         species identification and identify additional objectives that can be achieved within the existing
         survey designs.
         The international herring larvae surveys in the North Sea (IHLS) were in autumn 2018 and early
         2019 affected by severe technical problems of one of the research vessels. As a consequence, spa-
         tial information on larvae abundance around the Orkney/Shetlands and in the English Channel
         was too limited to be included in the herring assessment 2019. Only abundance data of the
         Buchan and Banks components were used.
         The MIK net (Midwater Ring Net) sampling during the first quarter international bottom trawl
         survey in 2019 (Q1 IBTS) reported foraging herring larvae in higher quantities in the western
         part of the North Sea, the Southern Bight and in the Skagerrak. In the eastern part of the North
         Sea, the potential nurseries, abundance of larger larvae was very low, and virtually no larvae
         occurred in the German Bight. Simulations on sampling effort reduction showed the MIK index
         to be relatively stable, even when sampling is reduced by 50%, but such a reduction could be
         disadvantageous for representative sampling of less abundant species.
         As an addition to the conventional MIK sampling, a sampling programme on herring larvae
         recruiting from the Downs stock component has been carried out during 2018 and 2019. The
         Downs recruitment survey (DRS) revealed larger quantities of foraging larvae, which are so far
         not integrated in the recruitment index of North Sea autumn spawning herring.
         The Rügen herring larvae survey (RHLS) considers the major spawning areas of western Baltic
         spring spawning herring. There is no substantial herring recruitment in the area.
         Several studies tried to utilize surveys to gather additional information. The Northern Irish MIK
         survey (NIMIK) usually provides recruitment information on gadoids, but also collect infor-
         mation on the wider ecosystem. As one example, a two decade long time-series of gelatinous
         zooplankton abundance and distribution in the Irish Sea has been built on survey catches.
         A pilot study tried to use samples from the Q3 IBTS to establish a sprat recruitment index. Results
         from 2018 and 2019 indicate very promising potential, but wider area coverage would be bene-
         ficial. Thus participating countries are welcome to contribute to the ongoing study.
         Analyses of three years of litter sampling during MIK surveys revealed sources of litter in the
         water column, and uses the MIK net flowmeters to quantify the amount. The samples may also
         provide insights into possible pathways of drifted material.
         While progressing with the original survey objectives, WGSINS will continue to invest efforts in
         using herring larval surveys to provide additional information. WGSINS will summarize infor-
         mation on co-occurring fish larvae, and establish time-series to form the basis for further analyses
         of species distribution, abundance and, if possible, trends in recruitment.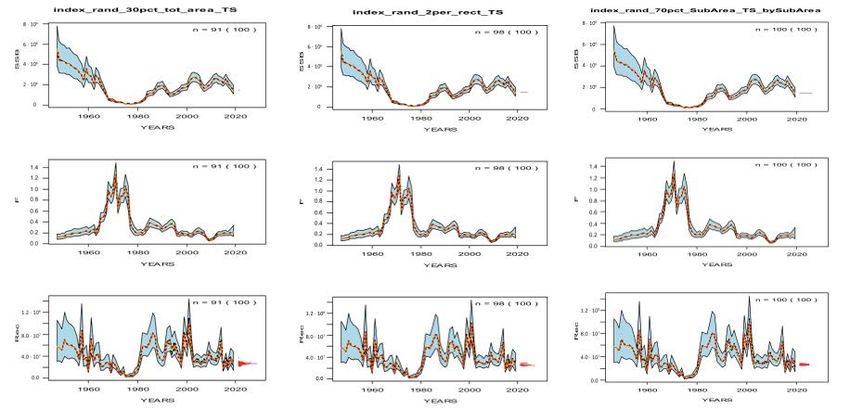
ICES   |   WGSINS 2019                                                                                                   |   III

       ii Expert group information

           Expert group name            Working Group on Surveys on Ichthyoplankton in the North Sea and adjacent Seas
                                        (WGSINS)

           Expert group cycle           Multiannual

           Year cycle started           2019

           Reporting year in cycle      1/3

           Chair                        Norbert Rohlf, Germany

           Meeting venue(s) and dates   22-25 October 2019, Bremerhaven, Germany (10 participants)
ICES | WGSINS 2019 | 1
1 Survey reviews
1.1 The International Herring Larvae Surveys in the North
Sea (IHLS)
The IHLS in 2019
Four survey areas were covered within the framework of the International Herring Larval Sur-
veys in the North Sea during the sampling period 2018/2019. They monitored the abundance and
distribution of newly hatched herring larvae in the Orkney/Shetlands area, in the Buchan area
and the central North Sea (CNS) in the second half of September and in the southern North Sea
(SNS) in the second half of December 2018 (figure 1.1). The German survey contribution around
the Orkneys started as scheduled, but after one day of sampling the research vessel had to face
severe technical problems. There was no opportunity to conduct a safe journey any further, thus
the survey had to be stopped after 28 plankton hauls. The vessel steamed back to Bremerhaven,
where it is still in repair at the time of HAWG 2019. No charter vessel was available for the survey
planned in early January 2019. As a consequence, the estimate for the Orkney/Shetland area is
very low and biased due to the low area coverage, and no estimate for the Downs components
is available in January 2019.
The survey contribution of The Netherlands in September 2018 were as planned and covered the
Buchan and the central North Sea. The December survey in the Southern North Sea was con-
ducted on board a smaller vessel, which turned out to be sensitive to more unfavourable weather
conditions. Thus the area coverage is limited; no information about larvae abundance in the
western part of the area under investigation is available.
No survey was planned for the second half of January 2019. Instead, an additional MIK sampling
was undertaken in March/April in the German Bight and Skagerrak/Kattegat area. This sampling
was established to shade light on the foraging and recruitment of herring larvae originating from
the Downs stock component. The outcome is reported in section 1.2.
During the most recent benchmark of the North Sea herring assessment (ICES, WKPELA 2018),
it was decided to use the Larvae Abundance Index (LAI) as direct input into the assessment
model and to resolve spatial stock dynamics inside the model. However, only the estimates from
the Buchan and central North Sea were included in the assessment. The biased estimates of the
Orkney/Shetlands and the southern North Sea were excluded and not used as data input to the
assessment at HAWG 2019.
At time of the WGSINS meeting, the 2019/2020 campaign is still running. The surveys in Septem-
ber were conducted as scheduled, but no results are available yet. Plankton sorting and larvae
length measurements are ongoing.2 | ICES SCIENTIFIC REPORTS 2:17 | ICES
Table 1.1: Herring Larvae Abundance Time-Series (LAI) of larvaeICES | WGSINS 2019 | 3
Figure 1.1.1: North Sea herring - Abundance of larvae < 10 mm (n/m²) in the Orkney/Shetland, Buchan, Central and
Southern North Sea as obtained from the International Herring Larvae Surveys in autumn and winter 2018/2019 (maxi-
mum circle size = 3 500 n/m²). The survey around the Orkneys had to be stopped after 28 hauls due to technical problems
of the research vessel.4 | ICES SCIENTIFIC REPORTS 2:17 | ICES
Planning for the 2020 IHLS surveys
The IHLS surveys give information about herring larvae hatching success and larvae abundance
on the main spawning grounds of North Sea autumn spawning herring. They also inform about
the relative contribution of the different spawning components to the whole figure. In general,
on four different spawning areas two (Orkney/Shetlands and Buchan) to three (Banks and
Downs) sampling periods are needed monitoring the full spawning activity. This condition
hasn’t been met since the mid of the 1990s, when several participants left the larvae surveys and
continued with acoustic surveys thereafter. Nowadays, only the Netherlands and Germany par-
ticipate in the IHLS and it is only possible to cover some sets out of the 10.
Instead of the survey in the southern North Sea in the 2nd half of January, an additional MIK-
Survey, following foraging downs herring larvae, was introduced and conducted since 2018.
This additional survey shades lights into the recruitment of the Downs stock component and is
also scheduled to take place in spring 2020 (see Section 1.2 below).
The plan of the upcoming campaign is given below.
Table 1.1.1: Areas and periods to be covered during the 2020/21 IHLS surveys
A REA / P ERIOD 01.-15.09. 16.-30.09. 01.-15.10.
Orkney/Shetlands None FRG
Buchan None NL
Central None NL None
A REA /P ERIOD 16.-31.12. 01.-15.01. 16.-31.01.
Southern North Sea NL FRG None
1.2 The Downs Recruitment Survey
The Downs Recruitment Survey in 2019
In 2019 the Downs Recruitment Survey (DRS) was carried out following the IBTS-MIK protocol
as much as possible, but the sampling was carried out both day and night, instead of only at
night. Both Netherlands and Norway participated in the survey. Because of the day sampling a
blue midwater ring trawl is used.
In total 75 stations were sampled, Norway samples 13 stations and Netherlands 62 (Figure 1.2.1).
One haul of the Netherlands was invalid because the ring trawl hit the bottom. When later ana-
lysing the sample the larvae were too damaged. It was not possible to resample the station. Neth-
erlands sampled from 15 - 19 April, Norway sampled 25 - 27 April.
Of all stations sampled 32 did not contain herring larvae (Figure 1.2.2). The stations on the two
most northern transects did not contain herring larvae. So the northern border of the herring
larvae distribution was found. Highest numbers of herring larvae were found in the southern
stations. Herring larvae distribution was different in 2019 compared to 2018, and also total num-
bers found were lower.
The length distribution of the herring larvae in the DRS was the same in 2019 compared to 2018
(Figure 1.2.3).ICES | WGSINS 2019 | 5
The index calculation still needs to be decided upon, but using the standard MIK calculation and
full MIK areas, the DRS index is 50.1. Only using the actual area sampled gives an index of 39.0.
Figure 1.2.1: Sampled stations by country during the 2019 DRS (X Netherlands; □ Norway).
Figure 1.2.2: Herring larvae distribution by haul from the 2019 DRS.6 | ICES SCIENTIFIC REPORTS 2:17 | ICES
Herring larvae DRS 2019
1000
900
800
700
600
500
N
400
300
200
100
0
15 16 17 18 19 20 21 22 23 24 25 26 27 28 29 30 31 32 33 34 35 36 37 38 39 40 41
Length (mm)
Figure 1.2.3: Herring larvae length distribution from the 2019 DRS.
Planning for the 2020 Downs Recruitment survey
Netherlands will carry out a Downs Recruitment survey from 20 - 24 April 2020. It is unclear at
this stage if Norway will be able to participate in the 2020 DRS. The Danish fishing industry has
applied for funding to also participate in the 2020 survey. But at the time of the meeting it was
not known if the budget would be granted.
Netherlands is planning to carry out an experiment prior to the DRS to investigate the effect of
day versus night sampling and the use of a blue net on the catchability of herring larvae.
1.3 The MIK sampling during the International Bottom
Trawl Survey (IBTS-Q1)
MIK Results of the 2019 survey
Besides providing the time series of 1-ringer herring abundance indices in the North Sea from
GOV catches carried out during day-time, the International Bottom Trawl Survey (IBTS) also
provides abundance estimates for large herring larvae (0-ringers) of the autumn spawning stock
components. The estimates come from night time catches with a 2 m midwater ring-net trawl
(MIK, ICES 2017). The total abundance of 0-ringers in the survey area is used as a recruitment
index for the North Sea herring stock.
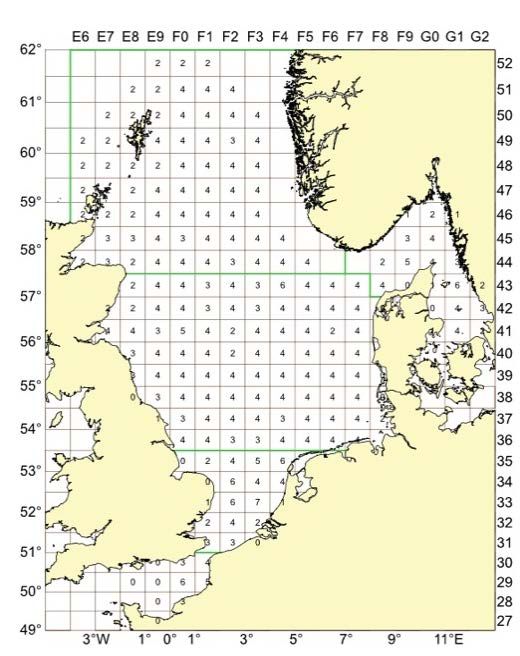
This year, 637 depth-integrated hauls were completed with the MIK-net. With 85% of all possible
MIK stations fished (Table 1.3.1), the coverage of the survey area was good with at least 2 hauls
in most of the ICES rectangles in the Greater North Sea including Kattegat and Skagerrak (Figure
1.3.1).ICES | WGSINS 2019 | 7
Table 1.3.1: Summary table of the MIK stations sampled during the North Sea IBTS Q1 in 2019
C OUNTRY T OWS PLANNED V ALID % STATIONS FISHED
DE 138 88 64
DK 88 87 99
FR 106 93 107
NL 114 122 105
NO 84 88 85
SW 60 60 100
UK-SCO 116 99 85
sum 706 637 85
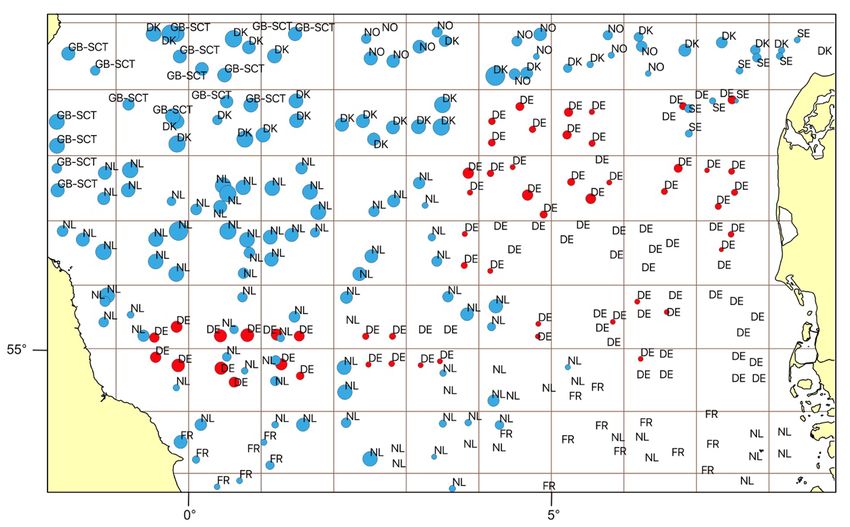
Figure 1.3.1: MIK sampling during IBTW Q1 2019 – numbers of MIK samples per each ICES rectangle.
The German vessel Walther Herwig III was unavailable this year due to necessary repairs. As a
replacement Germany had to charter the Danish RV Dana, which was only available for 20 days
instead of the planned 33 days, which would have been on hand under normal conditions. Due
to the shorter available ship time and the shorter daylight duration in early January, Germany
and Denmark had swapped their sampling area, and a priori reduced a number of hauls. Most
of these hauls were covered by other countries.
Also, Germany had to conduct its survey 3 weeks earlier than when the area would normally be
covered. While this early coverage may have consequences for the perception of herring larvae
distribution, the abundance estimate (i.e. the MIK index) shouldn’t be affected. Due to the low
temperatures and low food abundance in the winter months, growth should be negligible to
have any effect on the length-based selection for the index calculation. Mapping of herring larvae8 | ICES SCIENTIFIC REPORTS 2:17 | ICES
abundances by station also didn’t reveal any suspicious results with regard to any conspicuous
changes in distribution and abundance (Figure 1.3.2).
Figure 1.3.2: Abundance of herring larvae by station. Areas of filled circles illustrate densities in no m-2, the area of the
largest circle represents a density of 1.09 m-2. All circles are scaled to the same order of magnitude of the square root
transformed densities. Red dots correspond to German stations, which were samples about 3 weeks earlier than the rest
of the stations.
Herring larvae distribution and abundance
Herring larvae measured between 5 and 36 mm standard length (SL). Again, and as in most
years, the smallest larvae 18 mm SL were rarer
and were caught in lower densities than in 2018 (Figure 1.3.3). The smallest larvae were chiefly
caught in 7.d and in the Southern Bight. The large larvae appeared in moderate to high quantities
only in the western part of the North Sea, in 3 rectangles of the Southern Bight and in the Skag-
errak. In the eastern part of the North Sea, the potential nurseries, abundance of large herring
larvae was very low, and virtually no larvae occurred in the German Bight (Figure 1.3.4).
The 2019 MIK-index, calculated as described in detail in MIK manual (ICES 2017), is 51.6.ICES | WGSINS 2019 | 9
Figure 1.3.3: North Sea herring. Length distribution of all herring larvae caught during the 2019 Q1 IBTS.
Figure 1.3.4: North Sea herring. Distribution of 0-ringer herring, year classes 2015 – 2017. Density estimates of 0-ringers
within each statistical rectangle are based on MIK catches during IBTS in January/February 2016 -2018. Areas of filled
circles illustrate densities in no m-2, the area of the largest circle represents a density of 1.83 m-2. All circles are scaled
to the same order of magnitude of the square root transformed densities.
Sardine larvae
A puzzling result of the MIK survey was the occurrence of large sardine larvae in the samples.
Sardine larvae occurred predominantly in the southern, the central eastern and the central west-
ern North Sea, particularly in areas where high abundances of herring larvae would be expected.
In some stations, sardine larvae were the only clupeid larvae (Figure 1.3.5).10 | ICES SCIENTIFIC REPORTS 2:17 | ICES
Figure 1.3.5: Distribution of sardine larvae by rectangle from MIK sampling during the Q1 IBTS 2019. Areas of filled circles
illustrate densities in no m-2, the area of the largest circle represents a density of 0.30 m-2. All circles are scaled to the
same order of magnitude of the square root transformed densities.
Coordination of the 2020 MIK sampling during Q1 IBTS
MIK sampling will be carried out during the night time of the 2020 Q1 IBTS. Germany will again
have to carry out its IBTS participation on Danish RV Dana about 3 weeks earlier than normally.
The IBTS Q1 survey coordinator will circulate the survey plan by end of November 2019. MIK
participants are now requested to submit their data directly to the ICES fish egg and larvae da-
tabase in due time (i.e. 7 – 10 days) before the HAWG meeting.
Simulations of effort reduction in MIK sampling during the Q1 IBTS
In the discussion on moving to integrated ecosystem assessment, the survey design of the IBTS
is currently being reviewed by IBTSWG in cooperation with WGISDAA and WGISUR. It may
become desirable for IBTSWG to adopt random stratified sampling instead of the current sys-
tematic sampling by ICES-rectangle. A supporting Workshop on Impacts of Planned Changes in
the North Sea IBTS (WKNSIMP), was held in June to discuss those issues (ICES 2019).
The announcement of moving to stratified random sampling for the Q1 IBTS raised concerns
among members of WGEGGS2/WGSINS, that these changes could negatively impact the night
time MIK sampling. In order to investigate possible impacts, the following reductions in sam-
pling effort on the results of the MIK survey were tested:
1. Effort reduction by rectangle
2. Overall reduction of sampling over the entire North Sea, irrespective of sub-area or rec-
tangle
3. Overall reduction of sampling per each sub-area, irrespective of rectangleICES | WGSINS 2019 | 11
Reduction was done by randomly selecting a subset of the stations per year from the currently
available time series of MIK herring larvae data from 1992 to 2019. For each setup, 100 runs of
calculating the index time series were done, and the mean, minimum and maximum values per
each year were plotted for the resulting time series. Subsetting by rectangle and calculation of
the index was done by either selecting 1 or 2 hauls, or by an overall reduction to 50 % of the
available hauls.
Overall reduction of sampling by either the entire area or by subarea was done by randomly
selecting 30, 50 or 70 % of all available hauls in those regions per year. For those setups, also two
different methods of index calculation were selected: either by first aggregating the hauls by
rectangle and then by sub-area, according to the MIK manual (ICES 2017), or by aggregating by
sub-area only before raising the herring larvae abundance to the entire survey area.
Apart from the early years, 1992 – 1998, where the number of available stations was the lowest
(230 – 400 hauls), a reduction of survey effort down to 50 % didn’t appear to change the percep-
tion of the trends in the MIK index. MIK index trends appear to be relatively robust to effort
reduction, irrespective of whether samples come from a systematic, stratified or non-stratified
design, and how data are aggregated for index calculation. Furthermore, systematic sampling by
rectangle didn‘t appear to have advantages over stratified sampling with regard to reduction in
total variability (Figure 1.3.5).
Figure 1.3.5: MIK index by randomly selecting 50 % hauls per subarea (left) and by randomly selecting 50 % hauls per
rectangle (right), aggregated by subarea only; blue line minimum, red line maximum and black line the mean. The mean
value also corresponds to the valid index time series.
As the MIK herring larvae abundance is used only as a relative index, the results on the assess-
ment for North Sea herring are negligibly small, as trial runs using the results from the MIK
index simulations showed (Figure 1.3.6).12 | ICES SCIENTIFIC REPORTS 2:17 | ICES
Figure 1.3.6: Three results of trial runs of SAM North Sea herring assessment using the results of the simulations with
effort reduction in the MIK sampling. Examples show the results of randomly selecting 30 % of the samples from the total
area, selecting 2 hauls per rectangle and selecting 70 % of the samples from each sub-area. The first 2 rows show the
results for SSB and F, the bottom row the results for recruitment.
Those results clearly show that the effort in MIK sampling could be reduced if survey time is
needed for other purposes, such as sampling for other ecosystem indicators during the IBTS,
without risking impairing the time series. WKNSIMP therefore recommended to consider reduc-
tion of plankton sampling in order to enable participants to fully work up the ichthyoplankton
or other plankters from the samples thereby producing additional valuable ecological infor-
mation, and/or allow for the analysis of the accompanying MIKeyM-net sampling (ICES 2018).
WGSINS was also requested to evaluate and redefine the objectives of the MIK and MIKeyM net
sampling.
WGSINS concluded that indeed the objectives of both, the MIK and MIKeyM-net sampling,
could be added. For future surveys it should be investigated if meaningful abundance indices
could be produced for other clupeid larvae, chiefly sardine and sprat, for large larvae of sandeel
and lemon sole from the MIK and for small sandeel larvae from the MIKeyM net. In liaison with
the respective assessment working groups, HAWG and WGNSSK, it shall be investigated
whether such index time series are useful for the assessment. However, WGSINS also concluded
that the sampling effort shouldn’t be reduced. The simulations on effort reduction were only
tested for herring larvae, which are much more abundant in any year than most other fish larvae.
Effort reduction could be disadvantageous for representative sampling of less abundant species.
The effect of such a reduction need first to be tested before a final conclusion could be drawn.
The MIKeyM net sampling
Since 2012, eggs are collected along with the MIK sampling using the MIKeyM net (ICES, 2018).
In 2019, MIKeyM (MM) samples were obtained by six of the countries participating in the 1st
Quarter IBTS. MM samples were taken with every MIK samples when possible (see Fig. 1.3.7).
The extent of sample analyses completed thus far varied between institutes ranging from fish
eggs identified where possible, staged and measured to the samples still need to be sorted for
fish eggs and larvae.ICES | WGSINS 2019 | 13
Fig 1.3.7 Location of MIKeyM samples for 2019 during the Q1 IBTS MIK survey.
Planning for the 2020 survey
As in previous years, MIKeyM net sampling is planned to be carried out along-side MIK sam-
pling during the first quarter IBTS in the North Sea. For 2020, all institutes are asked to carry out
at least 2 MIKeyM net hauls (1 with every MIK haul) in each ICES statistical rectangle. However,
there is no requirement for these samples to be worked up this year. The intention is to retain a
reservoir of samples that can be used if interesting questions arise concerning egg and larvae
distributions in the North Sea and Skagerrak in 2020 or there is a need for an uninterrupted time
series of egg or larvae data. These samples should be stored at the respective institutes. Those
institutes with sufficient resources will work up their samples and inform the rest of the group
as to what they have done. The intention, as in previous years is that every other haul per rec-
tangle should be worked up according to the MIKeyM manual. The remaining plankton can then
be discarded. As with the above, all samples that are not sorted for fish eggs and larvae shall be
stored at the respective institutes. In addition, the WG will consider a suitable time frame for
retaining these samples for future analyses.
Sweden will be requested to undertake MIKeyM sampling so as to provide coverage of the Skag-
errak area.14 | ICES SCIENTIFIC REPORTS 2:17 | ICES
1.4 The Western Baltic Rügen Herring Larvae Survey (RHLS)
The RHLS surveys in 2018
The waters of Greifswald Bay (ICES area 24) are considered a major spawning area of Western
Baltic spring spawning (WBSS) herring. The German Thünen Institute of Baltic Sea Fisheries
(Thünen-OF), Rostock, and its predecessor monitors the density of herring larvae as a vector of
recruitment success since 1977 within the framework of the Rügen Herring Larvae Survey
(RHLS). It delivers a unique high-resolution dataset on the herring larvae ecology in the Western
Baltic, both temporally and spatially. Onboard the research vessel “FRV Clupea,“ a sampling
grid including 35 stations is sampled weekly using Ichthyoplankton gear (Bongo-net, mesh sizes
335 μm) during the main reproduction period from March to June. The weekly assessment of the
entire sampling area is conducted within two days (detailed description of the survey design can
be found in Polte 2013, ICES WD08). The collected data provide an important baseline for de-
tailed investigations of spawning and recruitment ecology of WBSS herring spawning compo-
nents. As a fishery-independent indicator of stock development, the recruitment index is incor-
porated into the assessment of the ICES Herring Assessment Working Group for the Area South
of 62ºN (HAWG).
The N20 recruitment index is calculated every year based on data obtained from the RHLS. This
is done by estimating weekly growth of larvae for seasonal temperature change and taking the
sum of larvae reaching 20 mm by every survey week until the end of the investigation period.
On the spatial scale, the 35 sampling stations are assigned to 5 strata and mean values of stations
for each stratum are extrapolated to the strata area (for details see Oeberst et. al 2009). The sum
of N20 larvae caught over the investigation period in the entire area results in the N20 recruit-
ment index for those herring that enter the fishery as adults two to three years later.
Calculation procedures have been reviewed and re-established in 2007 and the recalculated in-
dex for the time series from 1992 onwards is used by HAWG since 2008 as 0-group recruitment
index for the assessment of Western Baltic Spring Spawning herring.
The rationale for the N20 recruitment index is based on regular and strong correlations between
the amount of larvae reaching a length of 20 mm (TL) in Greifswald Bay and abundance data of
juveniles (1wr fish) as determined by the German autumn acoustic survey (GERAS) in the south-
ern Baltic area (ICES subdivisions 21-24).
The correlation of both time series (N20/GERAS, 1-wr; 1992-2018 R²=0.74) support the underlying
hypotheses that i) major variability of the natural mortality occurs at early life stages before lar-
vae reach a total length of 20 mm and ii) larval herring production in Greifswald Bay is an ade-
quate proxy for annual recruitment strength of the WBSS herring stock.
N20 index in 2018
With an estimated product of 1563 million larvae, the 2018 N20 recruitment index is close to the
index value of the previous year and more than double as high as the record low of 2016 (Table
1.4.1, Figure 1.4.1). However, still the value is only in the range of about 1/5 of the time series
mean therefore not countering the decreasing trend of larval production observed in the system
during the past two decades.
The course of the winter/spring spawning season in 2018 is a particular example for potential
effect of the preceding winter regime on reproductive success:
Sea surface temperatures (SST) in the bays, lagoons and estuaries of the WBS remained well
above 4°C (considered spawning threshold, Klinkhardt 1996, Moll 2018) for most of the winter.
Test-gillnet sampling on the early February control survey of the RHLS resulted in the presence
of spawning herring in the system. In mid-February the temperatures dropped below 4°C andICES | WGSINS 2019 | 15
remained in the range 1-2°C until late April (!). During this period the fish interrupted the spawn-
ing process in the Bay and remained in spawning aggregations at the entrance to the spawning
ground in the Pomeranian Bay. This is where the trawl net fishery had a successful season (fish-
ers pers. comm.) while the gill net fishery on the spawning ground was postponed. Due to the
unfavourable spawning conditions in the shallow water, herring either spawned on the exposed
outer coast (images of shore litter with attached eggs sent by some fishermen) or developed se-
vere atresia due to the extended starving period (greater than average portion of atresia reported
by fishermen). If the eggs survived the cold water conditions (ca. 2°C) at the outer coast is unclear
(threshold for successful egg development ca. 3°C, Peck et al. 2012). However, some minor larvae
quantities were found during the RHLS during the cold water period in March.
When the temperatures finally allowed the continuation of the spawning process in Greifswald
Bay, the seasonal temperatures increased so rapidly that 20°C water temperatures were reached
in mid-May (!). Therefore, later hatching cohorts might have suffered by heat stress (Moyano et
al. under review).
Altogether, the mild winter conditions with a late winter onset and steep spring temperature
gradient might have limited reproductive success in 2018.
Additionally, on two dates in February and November control surveys were conducted testing
for winter and autumn larvae respectively.
Both control surveys resulted in limited larvae abundance in Greifswald Bay. However, during
February, regularly large (> 30mmTL), advanced stages are encountered. A case study including
daily increment reads and otolith chemistry of those larvae indicate that early larval stages found
in November and those advanced stages are originating from the same spawning cohort (Janke
2019). Validation of the findings by genetic analysis is in process.
Figure 1.4.1: Validated RHLS time series with N20 index data presented as cumulative value of weekly mean abundance
of 20 mm larvae in millions.16 | ICES SCIENTIFIC REPORTS 2:17 | ICES
Table 1.4.1: N20 larval herring index for spring spawning herring of the Western Baltic Sea (WBSS), generated by RHLS
data.
Year N20 Year N20
1992 1060 2006 3774
1993 3044 2007 1829
1994 12515 2008 1622
1995 7930 2009 6464
1996 21012 2010 7037
1997 4872 2011 4444
1998 16743 2012 1140
1999 20364 2013 3021
2000 3026 2014 539
2001 4845 2015 2478
2002 11324 2016 442
2003 5507 2017 1247
2004 5640 2018 1563
2005 3887
Relation between N20 and GERAS 1-wr herring
After the record low N20 in 2016 the relation with the 1-group juveniles as monitored by the
GERAS after the one-year growth phase was re-evaluated to see if the N20 in 2017 produces an
outlier in this time series. The results indicate an even stronger correlation between N20 (2017)
and GERAS 1-wr juveniles (2018). The low N20 years resulted in correspondingly low GERAS
indices for the 1-wr juveniles (Fig. 2).
2.500
2.000 y = 0,0653x + 462,06
GERAS Age 1 (millions)
R² = 0,7375
1.500
1.000
500 2018
2016
2015/2017
0
0 5.000 10.000 15.000 20.000 25.000
N20 Age 0 year-1 (millions)
Figure 1.4.2: Correlation of 1-wr herring from GERAS (1993-2018) with the N20 larvae index (1992-2017). Note: The one-
year lag phase between indices. E.g. the exceptionally low N20 year 2016 is represented by the GERAS 1-wr index 2017.ICES | WGSINS 2019 | 17
1.5 The Northern Irish Herring Larvae Survey (NINEL)
Herring larvae surveys of the northern Irish Sea (ICES area VIIaN) have been carried out by the
Agri-Food and Biosciences Institute (AFBI), formerly the Department of Agriculture and Rural
Development for Northern Ireland (DARD), in November each year since 1993. The surveys are
carried on on-board the RV “Corystes” since 2005 and prior to that on the smaller RV “Lough
Foyle”. Sampling is carried out on a systematic grid of stations covering the spawning grounds
and surrounding regions throughout the north Irish Sea (Figure 1.5.1). Larvae are sampled using
a Gulf-VII high-speed plankton sampler with 280μm net and on-board Valeport Midas+ CTD.
Mean catch-rates (nos.m-2) are calculated over stations and strata to give area specific indices of
abundance. Larval production rates and birth-date distributions are computed based on the
mean density of larvae by length class. A growth rate of 0.35 mm day-1 and instantaneous mor-
tality of 0.14 day-1 are assumed based on estimates made in 1993–1997. The index has been his-
torically used as an indicator of spawning-stock biomass (SSB) in the assessment of Irish Sea
herring by the ICES Herring Assessment Working Group (HAWG). The assessment of this stock
was benchmarked in 2012 and issues concerning the survey raised. Subsequently the use of the
survey in the stock assessment has ceased.
Figure 1.5.1: Station positions for north Irish Sea herring larvae survey (NINEL).
Survey Results in 2018
The survey was completed successfully with a total of 64 stations sampled. 1176 herring larvae
were identified and measured providing information on spawning areas, growth rates and abun-
dance. Depth profiles of salinity and temperature were collected at all stations, and plankton
samples preserved. The survey was delayed by approximately 2 weeks compared to previous
years due to essential maintenance of the vessel. While this late departure resulted in the capture
of fewer dense patches of newly hatched larvae stages, later stages of herring larvae were prev-
alent throughout the area. This pattern of larval spatial distribution and length frequency sug-
gests that the main hatching period had probably occurred earlier. In previous years there is
evidence that hatching is more intense during the beginning of November, with a high preva-
lence of smaller, yolk sac larvae. As in previous years the vast majority of herring18 | ICES SCIENTIFIC REPORTS 2:17 | ICES
larvae were captured in the eastern Irish Sea in the vicinity of the Douglas bank spawning
ground and to the north of the island, albeit with lower peak numbers and more extensive drift
eastwards (Figure 1.5.2). As in previous years lower numbers of larvae were detected on the
Mourne ground, despite evidence of extensive spawning activity in the region 3 weeks earlier
Figure 1.5.2: Distribution of herring larvae captured during 2018 north Irish Sea herring larvae survey (NINEL). Maximum
density 31.5 no.m-2.
1.6 The UK (Northern Irish) MIK Survey (NIMIK)
An overview of the UK (Northern Ireland) MIK survey (previously Methot–Isaacs–Kidd Survey).
The survey previously used a Methot–Isaacs–Kidd frame trawl to target pelagic juvenile gadoids
(whiting, cod, haddock) in the Irish Sea between 1993 -2018. The Methot_Isaacs_Kidd frame was
replaced with a midwater ring net in 2019 (ICES, 2013). The survey is a stratified design and
takes place in May and June during the period prior to settlement of gadoid juveniles (for station
grid see Figure 1.6.1). Indices are calculated as the arithmetic mean of the numbers per unit sea
area (nos.m-2). The MIK net is deployed during the hours of darkness (max. 30mins± hr sunset).
During daylight hours a Gulf-VII high speed plankton sampler with on-board Valeport Midas+
CTD is deployed. Density and distribution data on larval fish, zooplankton and water structure
properties (SST, salinity, chlorophyll a) are recorded. See Figure 1.6.2 for the station grid. While
the main objective of the survey is to provide recruitment information on gadoids the survey
provides the opportunity and tools to collect valuable information on the wider ecosystem. For
example, data collected on the survey has provided the basis for the development of a 20+year
time-series of gelatinous zooplankton abundance in the Irish Sea. Since 2018 a standard WP2
frame with side floats for neuston sampling (333µm mesh) has been deployed for the study of
marine micro plastics at a number of the Gulf stations.ICES | WGSINS 2019 | 19
Figure 1.6.1: Station positions for deployment of MIK net during NIMIK Survey.
Figure 1.6.2: Station positions for deployment of Gulf-VII high speed plankton sampler during the NIMIK Survey.20 | ICES SCIENTIFIC REPORTS 2:17 | ICES
1.7 A pilot survey on the feasibility of establishing a sprat
recruitment index based on larval sampling during Q3
IBTS surveys
Background
Sprat is a short-lived species, and the sprat stock in the North Sea is dominated by young fish.
Thus, the size of the stock is driven to a large degree by the recruiting year class, and catches are
mainly composed by 1-year old fish (up to ~80%). Sprat is an important forage fish and repre-
sents a major food source for many other fish species as well as sea birds and mammals. It is
therefore a highly relevant species in multispecies approaches to fisheries management. An an-
alytical assessment of sprat was established some years ago, however, the availability and qual-
ity of data for the assessment are relatively poor and the assessment of and advice for the North
Sea sprat stock need to be improved. There is presently no information available on young-of-
the-year (0-group) sprat for possible use in short-term forecasts or for use in the stock assessment
model. However, such information could potentially be very useful, in particular because sprat
is a short-lived species that matures early.
With the aim of improving our knowledge on 0-group sprat in the North Sea, two pilot surveys
targeting sprat larvae were conducted by DTU Aqua, Denmark, in the framework of the project
“BEBRIS - Maintaining a sustainable sprat fishery in the North Sea”, funded by the European
Maritime and Fisheries Foundation and the Ministry of Environment and Food of Denmark
(grant ID: 33113-B-17-091). Sampling was conducted during nighttime in August 2018 and 2019
on the Danish Q3 IBTS onboard RV DANA. The overall goal of these surveys was to evaluate
the feasibility of establishing a sprat recruitment index based on larval sampling on the Q3 IBTS
surveys. Thus, the basic idea is to follow similar procedures as the MIK herring larvae surveys
during the Q1 IBTS. These surveys are targeting relatively large larvae (~ 2 to 3cm) and the abun-
dance of these has shown to relate to later recruitment to the stock, thus providing a recruitment
index for autumn spawning herring in the North Sea.
The specific aims of the sprat larvae pilot surveys were to investigate whether:
- sprat larvae can be caught in appropriate numbers with a MIK net during nighttime on
the Q3 IBTS
- the MIK sampling can effectively be incorporated into the standard routines during Q3
IBTS
- the sampling can cover the relevant areas of major sprat larvae occurrence
- main spawning activity of sprat is finished well before the time of the survey
- there are significant differences in catchability during daylight vs. nighttime hours
- sampled larvae can be expected representative for the entire year-class
- sampled larvae are of sizes for which the following mortality is relatively constant and
that abundances thus provide a reliable recruitment index
Survey description
The gear in use during the two pilot surveys in August 2018 and 2019 was a MIK net with a ring
of 2 meter diameter. During the first hauls in the 2018 survey, a net with a mesh size of 1.6 mm
was used. However, as there were many relatively small larvae in the first samples, the mesh
size was changed to 1.0 mm during the remainder of the 2018 survey and the same 1.0 mm mesh
size was also used during the 2019 survey. In addition, a small MIKeyM net (20 cm Ø, 500 µm
mesh size) was attached to the MIK ring in order to test if there still are eggs and/or very smallICES | WGSINS 2019 | 21
larvae in the area during the time of the Q3 IBTS surveys, which would indicate that the seasonal
spawning activity has not finished yet.
The gear was equipped with a depth sensor and was deployed in a double-oblique haul from
the surface to 5 meter above the sea-floor (measured from the lower end of the MIK ring). Fishing
speed was 3 knots through the water, and the wire was paid out at a speed of 25 metres per
minute (= 0.4 ms-1) and retrieved at 15 metres per minute (= 0.25 ms-1). Both the MIK and the
MIKeyM were equipped with flowmeters to record the volume of filtered water.
Preliminary results and outlook
In 2018, a total of 66 valid MIK hauls were conducted for larval abundance estimation while 14
additional hauls were used for tests of catchability between day and night or between different
mesh sizes. For these tests hauls were conducted at the same position. Clupeid larvae were ob-
served in all hauls except for two stations north of Jutland. The catch of clupeid larvae per station
reached several hundred larvae and more, with 11 stations yielding more than 1000 larvae, two
of which contained 2200 and 4700 larvae. In total, more than 30000 clupeid larvae were caught.
Concerning the size of clupeid larvae, a broad size range from approx. 6 mm to juvenile fish of
4-5 cm was caught.
In 2019, a total of 66 valid MIK hauls were conducted. Detailed laboratory analyses of the sample
material are still ongoing (status November 2019). However, first estimates indicate that the
number of clupeid larvae was somewhat lower than in 2018. Laboratory analyses have further
shown that in both years the clupeid larvae not only contained sprat but also sardine larvae in
high abundances, with sprat larvae mainly occurring in the northern part of the study area while
sardine larvae were most abundant in the south. This shows that careful identification proce-
dures to species level are mandatory.
The samples of the MIKeyM nets await further, detailed analysis in the laboratory, but prelimi-
nary checks during the surveys did not suggest any catches of sprat eggs. This indicates that
sprat spawning activity had been finished well before the time of the survey, that all larvae have
hatched and that the surveys are thus covering the total larval production. However, on some
stations high numbers of relatively small larvae were caught, in particular in 2018 along the Dan-
ish coast. For such small larvae one could still expect high between-year variability in subsequent
mortality, i.e. a linkage to recruitment may not yet be established for these size ranges. Therefore,
analyses of size-frequencies and modelling of size related mortalities would be necessary to eval-
uate the potential of the surveys for providing a suitable recruitment index for sprat.
Catchability tests between day and night hauls showed significant differences, with considerably
lower numbers of clupeid larvae caught during daylight hours than during darkness. Thus, for
a potential regular sprat larvae survey during the Q3 IBTS, larval sampling will have to be re-
stricted to the period of complete darkness.
In summary, our experience from the 2018 and 2019 pilot surveys illustrates that this kind of
larvae survey during nighttime of the Q3 IBTS has the potential to provide larval abundance
estimates and potentially a recruitment index for North Sea sprat. However, additional surveys
will be necessary to provide further yearly observations and more data for modelling recruit-
ment patterns. DTU Aqua will continue the pilot surveys in 2020 and 2021 in a follow-up project.
However, a better area coverage than obtainable by the Dana survey alone would be advisable,
and other nations participating in the Q3 IBTS are encouraged to contribute to these planned
pilot surveys in 2020 and 2021. During WGSINS 2019, both Germany and Sweden have indicated
that they will investigate possibilities to contribute to the pilot surveys in 2020 and 2021.
It is noteworthy that in addition to sprat and sardine, a number of larvae of other fish species
were caught in the MIK. The more abundant species were mackerel, horse mackerel, sandeel,22 | ICES SCIENTIFIC REPORTS 2:17 | ICES
gurnards and lemon sole, scaldfish & several other flatfish, as well as several other, non-com-
mercial species, e.g. gobies, crystal goby, rocklings, pipefish, dragonets and greater weaver. In
addition, a limited number of larger gadoid larvae and/or pelagic juveniles were caught. Con-
cerning mackerel larvae, there was a tendency of higher catches in the northern part of the
sampling area, whereas horse mackerel dominated in the southern part. These other species are
presently being analyzed in the framework of a master thesis at DTU Aqua, with results ex-
pected to become available in the near beginning of 2020.
1.8 Marine Litter sampling during the Q1 MIK-IBTS and
other MIK surveys
DTU Aqua (Denmark) has been collecting data of marine litter from standard MIK samples col-
lected during the Q1 IBTS from 2014-2016, and first results were presented at the 2016 WGEGGS2
meeting in Hamburg, Germany. Given the information on spatial distribution and composition
of different litter types that may be obtained from these litter samples, the group agreed that this
additional sampling was worthwhile, and from 2017 it was possible to convince all nations par-
ticipating in the Q1 IBTS to contribute to this effort. For this purpose and in order to standardize
methodology, a manual and a MIK litter protocol sheet were developed and distributed to the
MIK survey participants prior to the 2017 IBTS. As all nations are participating, the spatial cov-
erage is basically identical with the MIK coverage. Marine litter was sorted from the MIK sam-
ples, classified in different categories and the litter items were collected in plastic bags by station
and taken ashore for more detailed analyses. Preliminary results of the 2017 MIK litter sampling
were presented at the 2017 WGEGGS2 in Boulogne-sur-Mer and the 2018 WGEGGS2 in
Ijmuiden. Further in-depth sample and data analyses were initially hampered by a lack of fund-
ing. However, in summer 2018 DTU Aqua was able to obtain funding for detailed analyses by
the Danish VELUX Foundation in the project MARLINS (Marine Litter in the water column of
the North Sea). This new project and updated preliminary results were presented at WGSINS
2019.
MARLINS will be running from fall 2018 to fall 2020, and will allow to analyze all existing Q1
MIK-IBTS litter samples from 2014-2018 as well as newly incoming samples from 2019 and 2020.
In addition to these, also samples collected during the recently implemented Dutch MIK Downs
recruitment survey and the Danish MIK pilot surveys for sprat larvae during the Q3 IBTS will
be analyzed, which may provide some valuable information about seasonal patterns in marine
litter occurrence, abundance and composition.
Until WGSINS 2019, the Q1 MIK-IBTS samples from 2017, 2018 and partly 2019 were analyzed.
The individual litter items were classified into different categories and their color and if available
any print or label was noted, as this can give important information about the source of the litter.
Furthermore, the items were weighed and their size was measured, depending on the category
either with a ruler (e.g. monofilaments, rope etc.) or by scanning the items and determining their
size/area with an image analysis system (e.g. foils). In addition, for selected categories, also the
thickness of the items was measured with a micrometer screw.
Plastic was by far the most frequent type of litter, comprising e.g. 92% of all items in 2017. The
most frequently occurring litter items were plastic monofilaments and plastic foils, followed by
plastic pieces, synthetic rope and a variety of less frequent categories, including plastic fibres,
fishing line, polystyrene, paint, metal, paper, natural rope and wood. Stations containing litter
were mainly located in the south and the east of the survey area, whereas only very few stations
in the northwest contained litter. Also the amount of litter (number of items per station) in 2017
showed a distinct spatial distribution pattern, with hotspots in the English Channel, along theICES | WGSINS 2019 | 23
west coast of Denmark and in Skagerrak. This pattern was particularly evident for monofila-
ments, plastic foils and plastic pieces, whereas synthetic rope was more evenly distributed over
the entire southern North Sea. Data for 2018 and 2019 are not yet analyzed in detail, but prelim-
inary results indicate a similar composition and distribution pattern as in 2017. Based on the
distinct spatial distribution of monofilaments, the prevailing circulation in the area, as well as
available literature on Danish beach surveys and on the spatial intensity of beam trawling, the
use of so called “dolly ropes” seems to be one of the main sources of this litter type. Additionally,
the color of the plastic filaments points to this source as well, as dolly ropes are usually orange
or blue, and ca. 35% of all plastic filaments in the samples in 2017 were also either orange or blue.
Other dominant colors of monofilaments were green (28%), white (12%), black (8%) and clear
(8%). The majority of monofilaments had a length of 1-5 cm, but also filaments of 5-20 cm length
were frequently observed, as well as some even larger ones from 30 to 70 and one of 118 cm.
In contrast to many other studies on marine litter which are usually based on either beach sur-
veys, bottom trawling or sampling in surface waters, the MIK net is sampling the entire water
column, filtering large volumes of water. The sampling of marine litter from MIK samples does
not require any additional vessel time, and the sorting and registration of litter items requires
relatively little additional effort as many samples in offshore areas contain no or only few items.
Furthermore, the amount of litter can be quantified as flowmeter data are available anyhow,
whereas many other marine litter studies are qualitative or semi-quantitative, and the MIK sur-
vey covers a large area. Thus, the MIK survey has a high potential to provide a holistic view of
the occurrence, distribution and abundance, as well as potential sources and transport pathways,
of free-floating marine litter in the entire North Sea area. Given the preliminary results presented
at WGSINS, the group agreed that it is worthwhile to continue the MIK litter sampling in the
future.
2 Data handling
2.1 ICES eggs and larvae database
For most of the surveys routinely dealt with in WGSINS, the ICES egg and larvae database is
already the tool for Ichthyoplankton and station data storage. The Northern Irish survey data
have to be included as well as the historic MIK data prior to 2008.
In a web-conference during the WGSINS meeting together with the ICES datacenter, some as-
pects on data storage were discussed and clarified.
Upload of annual survey results is either in the responsibility of the national data submitter
(NIRLS, NIMIK, RHLS) or the survey coordinator (IHLS, MIK). Quality checks should be imple-
mented by each contributor prior to data upload. However, there is already some code imple-
mented checking for spatial and temporal integrity of the data (e.g., points on land, consistency
in date and time) and logic in the data sets (e.g., water and sampler depth, volume filtered, haul
duration and distance etc.). These checks will be run before the data are integrated into the eggs
and larvae database. The data portal provides a file template as well as specifications of the file
format of the haul meta-information and the eggs and larvae measurements.
There was consensus in using a Github system for communication and code sharing. The link is
https://github.com/ices-tools-dev/EggsAndLarvae. Any issues or suggestions for developmentYou can also read