Market Demand Review October 2016 - Knowsley Council
←
→
Page content transcription
If your browser does not render page correctly, please read the page content below
Halsnead Masterplan SPD

Market Demand Review

October 2016

                          PaPage 1 of 74
Halsnead Masterplan SPD – Market Demand Review

Contents
1.     Introduction                                                                              1

2.     Residential Market Context                                                                4

3.     Local Residential Market Analysis                                                         8

4.     Commercial Market Context                                                               30

5.     Local Commercial Market Analysis                                                        34

6.     Conclusions                                                                             48

Appendix 1: New Build Residential Development Analysis                                         50

Contacts:
Matt Spilsbury MRICS MRTPI
Director
Economics – Development Advisory
matthew.spilsbury@turley.co.uk

Fiona Elton MRTPI
Analyst
Economics – Development Advisory
fiona.elton@turley.co.uk

October 2016

                                                                                       October 2016
Halsnead Masterplan SPD – Market Demand Review

1. Introduction
      Purpose of Report

1.1   Mott MacDonald and Turley have been commissioned by Knowsley Metropolitan
      Borough Council to produce a Masterplan Supplementary Planning Document (SPD) for
      a Sustainable Urban Extension (SUE) site located to the south of Whiston (‘the
      masterplan site’). The site was removed from the Green belt and allocated for
      development in Knowsley’s Local Plan (adopted January 2016).

1.2   This report has been compiled by Turley to provide a baseline residential and
      commercial (B8 uses) market analysis to inform the development of the masterplan.

      Site Context

1.3   The masterplan site comprises two parcels of land (Land South of Whiston and Land
      South of the M62) which until recently was designated as Green Belt land. The
      masterplan site now comprises land allocated for an SUE as identified in Knowsley
      Council’s January 2016 adopted Local Plan Core Strategy.

1.4   The northern parcel of land, known as Land South of Whiston, is bound to the south by
      the M62, to the west by Windy Arbor Road and existing residential development, to the
      north by Lickers Lane and existing residential development and to the east by Fox’s
      Bank Lane. Land South of Whiston currently accommodates existing uses, including a
      caravan park, a demolished former garden centre, a cemetery, playing fields, a fishing
      pond and a small number of dwellings. This parcel of land is currently in multiple
      ownerships.

1.5   The southern parcel of land, known as Land South of the M62, is bound to the north by
      the M62, to the south by Cronton Road (A5080) and to the east by Fox’s Bank Lane.
      Land South of the M62 comprises the former Cronton Colliery site which is owned by
      The Land Trust and land running parallel to the M62, which is in multiple ownerships.

1.6   The site’s strategic location at the junction of the M62, M57, major roads and Whiston
      train station makes it a highly accessible site, as demonstrated in the following figure.

1.7   For the purposes of the Masterplan SPD, which this baseline analysis informs, the
      masterplan site is now referred to as Halsnead.

                                                                                           October 2016
                                                                                            Page 1 of 74
Halsnead Masterplan SPD – Market Demand Review

          Figure 1.1: Site Location Plan

           Not to scale. Crown Copyright Knowsley MBC 100017655, 2016

          Source: Knowsley Council, 2016

          Proposed Development

1.8       Based on evidence from Knowsley Council’s Local Plan Core Strategy, the masterplan
          site has capacity to deliver more than 1,500 new homes (potentially circa 1,700 homes)
          and a primary school on Land South of Whiston. A minimum of 22.5 hectares of
          employment land and a new country park is proposed for Land South of the M62.

          Content

1.9       This report has been informed by a review of published market intelligence, a review of
          housing market and transactional data, and also draws upon a market engagement
          exercise with active local agents and developers currently marketing comparable new
          residential schemes in the local area.

1.10      This report does not constitute a valuation, and cannot be regarded, or relied upon as a
          valuation as it falls outside of the RICS Valuation – Professional Standards (Red Book
                1
          2014) . It is to be used as market guidance only.

1
    RICS Valuation – Professional Standards January 2014 (Red Book 2014)

                                                                                                          October 2016
                                                                                                           Page 2 of 74
Halsnead Masterplan SPD – Market Demand Review

1.11   Some of the data incorporated in this report has been supplied by third party sources,
       the accuracy of which cannot be assured. Turley shall not be liable for any special,
       indirect or consequential damages, including loss of profit.

       Structure

1.12   The remainder of the report is structured as follows:

       •     Section 2 provides an overview of the national and regional housing market and
             reflects on economic and political influences

       •     Section 3 presents an analysis of the local housing market in Knowsley, and
             specific to Whiston and surrounds

       •     Section 4 provides an overview of the national and regional market for logistics,
             storage and distribution uses (Use Class B8)

       •     Section 5 provides an analysis of take-up trends, current and future supply and
             the investment market for logistics, storage and distribution uses in the M62
             Corridor

       •     Section 6 summarises the conclusions of the report

                                                                                             October 2016
                                                                                              Page 3 of 74
Halsnead Masterplan SPD – Market Demand Review

2. Residential Market Context
        National Market Overview
                                                              2
2.1     CBRE’s summer 2016 Regional Residential Report reflects on the strong UK residential
        market performance in the first quarter of 2016 and indicates that despite some short-
        term turmoil following the EU referendum, strong market fundamentals remain.

2.2     CBRE state that current house price growth of 5.1% across the UK is encouraging and
        forecast growth remains relatively unchanged following Brexit, despite the market
        uncertainty posing risks. CBRE maintain that builder and buyer sentiment is likely to
        remain cautious until economic fundamentals are more fully understood and the political
        climate calms. This is reinforced by the July 2016 RICS Residential Market Survey,
        which suggests that while near term market expectations remain negative, the 12 month
        outlook is more optimistic, with 23% of survey respondents expecting prices to increase
        over the year ahead, rising from 0% in June.

                               3
2.3     Savills’ Brexit Briefing predicts that the UK vote to leave the EU may result in reduced
        housing delivery placing downward pressure on pricing within the agricultural and
        residential land markets. It is expected that market activity will decline with the number
        of residential transactions falling, following the post-credit crunch high of 1.3 million over
        the past year. This is already being demonstrated to some extent by a reported drop in
        market demand highlighted by RICS, with new buyer enquiries declining during July -
        the fourth consecutive month of falling demand. Concurrently, tenant demand in the
        residential lettings market increased in the three months to July.

2.4     According to Savills, prior to the EU referendum, there were steady levels of activity in
        the land market with growth in urban development land values (4.1%) increasing at a
        faster rate than greenfield values (2.2%) over the year to Q2 2016. Evidence from
                       4
        Knight Frank however suggests slightly different trends with urban brownfield
        residential land values increasing by 9.1% over the 12 months to Q2 2016, despite
        declining by 1.1% in the last quarter, and greenfield values declining by 3.8% since Q2
        2015 and by 2.3% in the last quarter.

2.5     Uncertainty in the land market appears to have subdued sentiment and slowed land
        buying activities, with some national housebuilders now increasing margins and hurdle
        rates on greenfield site acquisitions in order to hedge against perceptions of increased
        market risk, although good offers are still being made for competitive sites. Savills state
        that ‘many house builders have a strong pipeline of land at present and can afford to
        wait for a few months to establish where the market is heading.’

2.6     Savills also anticipate that the depreciation of the pound arising from the EU referendum
        decision will impact on the cost of importing construction materials and the cost and
        availability of construction labour from within the EU.

2
  CBRE (2016) Regional Residential Report - Post-Brexit
3
  Savills (July 2016) The Impact on Residential Development – Brexit Briefing
4
  Knight Frank (2016) Residential Development Land Index – Key Facts Q2 2016

                                                                                                October 2016
                                                                                                 Page 4 of 74
Halsnead Masterplan SPD – Market Demand Review

2.7    Whilst much uncertainty prevails following the EU referendum, too little time has passed
       to draw firm conclusions on the full extent of the impact on the residential market. Much
       will depend on the economic implications of leaving the EU, which may take several
       years to become clear. In the interim mortgage lenders are expected to take a more
       cautious approach and limit riskier deals at higher Loan-to-Value (LTV). The greatest
       impact would be felt by 1st time buyers in local markets where affordability is stretched.

       PLC Housebuilder Performance - Post-Brexit
2.8    Research has been undertaken in to the performance of the key PLC housebuilders
       following the EU referendum drawing on recently published financial statements and
       trading updates.

2.9    Generally, PLC housebuilders suggests that, whilst it is too early to determine the extent
       to which the EU referendum may have an effect on housebuilding, the outlook remains
       positive based on the current market fundamentals, need and demand for new homes,
       strong government support and accessibility of mortgage finance. More specific trends
       in market performance and outlook have been identified below for the key PLC
       housebuilders.

       Barratt/ David Wilson Homes
2.10   Following the EU referendum, Barratt Developments are mindful of the greater
       uncertainty now facing the UK economy and as a result have taken appropriate
       measures to reduce risk by reassessing land approvals and continuing to monitor the
                                                                      5
       market. Barratt Developments’ latest Trading Update (July 2016) suggests that:

       “With a strong balance sheet and forward order book, and industry leading quality and
       customer service, we remain confident in the positive fundamentals of both the housing
       sector and our business.”

       Bellway
                                                       6
2.11   Bellway’s latest Trading Update (August 2016) suggests that customer confidence and
       trading conditions have remained strong throughout the year, despite the wider
       economic uncertainty in the weeks preceding and following the EU referendum.

2.12   Since the result of the EU referendum, there has been some modest caution from a
       small number of visitors to our developments at the higher value end of the London
       market where Bellway has only limited exposure. Overall, visitor numbers are still strong
       and the cancellation rate remains at a historic low. Bellway is proceeding cautiously with
       a number of site acquisitions pending the outcome of the autumn selling season.

       Bovis Homes
                                                           7
2.13   Bovis Homes published the Half Year Results in August 2016, which highlights that
       there has been a resilient level of interest shown by potential home buyers following
       Brexit, with reservation rates improving after a short term slowdown in July.

5
  Barratt Developments PLC (13 July 2016) Trading Update
6
  Bellway PLC (5 August 2016) Trading Update
7
  Bovis Homes Group PLC (15 August 2016) Half Year Results 2016

                                                                                                 October 2016
                                                                                                  Page 5 of 74
Halsnead Masterplan SPD – Market Demand Review

2.14    Bovis Homes is closely monitoring market conditions to assess any impact of the EU
        referendum and has reviewed and accelerated its marketing programme to seek to
        boost sales activity.

2.15    Bovis Homes maintains that it has remained disciplined in undertaking land investment
        since the EU referendum and will look to take advantage of competitive land acquisition
        opportunities in the market, where it presently considers that there remains a good
        supply of consented land. Investment hurdle rates have been increased - in terms of
        both the required profit margin and return on capital employed (ROCE) - to ensure that
        the commercial returns are adjusted to reflect the current market uncertainty.

2.16    Overall, Bovis Homes anticipates a lower level of land investment than previously
        planned during the year as they continue to assess the housing market's longer term
        prospects.

        Redrow
                                                                 th              8
2.17    Redrow published its latest Trading Statement on 28 June 2016 . Whilst based on data
        prior to the EU referendum, it states that there was no impact on house sales or visitor
        levels in the lead up to the EU referendum. Directly following the Brexit vote,
        development sites remained busy, reservations continued to be taken and high levels of
        interest and strong reservation rates were witnessed at new sites launched.

        Taylor Wimpey
                                               9
2.18    Taylor Wimpey stated in July 2016 that trading remained in line with normal seasonal
        patterns with high customer interest and a good level of visitors to developments. Taylor
        Wimpey is monitoring customer confidence closely across a number of metrics. Whilst
        the average cancellation rate increased immediately following the EU referendum, this
        has since stabilised back to a pre-EU referendum rate.

        Regional Market Overview
                                                   10
2.19    CBRE’s Regional Residential Report states that Q2 of 2016 continued to show modest
        house price growth across the North West of England in line with the trend seen over
        the past 2 years. There has been a continued growth in sales rates resulting in
        increases in land values.

2.20    Housebuilder appetite for land following the EU referendum has shifted to a more
        cautionary position with new home sales being watched very closely, although there
        doesn’t appear to be a discernible slow down. Some developers and builders appear to
        be stopping incentivised offers and moving some offers from unconditional to
        conditional, whilst others are progressing as usual. CBRE stated that:

        “Currently Barratt, Bellway and Morris are all reporting no downturn in the North West
        and we are unaware of any developers who have stated a specific downturn.”

8
  Redrow PLC (28 June 2016) Trading Statements
9
  Taylor Wimpey PLC (27 July 2016) Half year results for the period ended 3 July 2016
10
   CBRE (2016) Regional Residential Report - Post-Brexit

                                                                                                  October 2016
                                                                                                   Page 6 of 74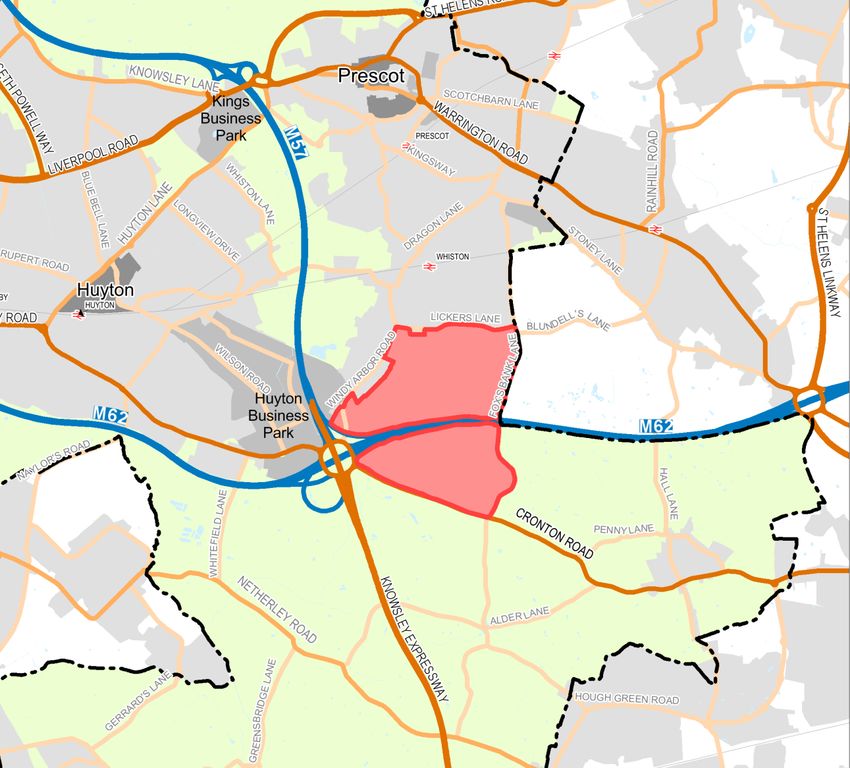
Halsnead Masterplan SPD – Market Demand Review

2.21      Despite the EU referendum, leading industry commentators remain upbeat regarding
          demand and price growth in the region. CBRE forecasts North West residential home
          values to increase from 2% per annum in 2016 to 4% in 2018, with the anticipated
          growth over the period from 2016 – 2020 of 18% slightly lower than the UK average
          (19%).

                        11
2.22      Knight Frank forecast residential market sales to increase by 20.0% nationally from
          2016-2020, with the North West expected to achieve the lowest level of growth of all the
          regions (alongside Scotland) with forecast growth of 12.6% from 2016-2020, based on
          forecasts from March 2016.

                                         12
2.23      Evidence from Knight Frank indicated that the market for residential development
          finance is expanding with some 71% of survey respondents stating that balance sheet
          allocation for residential schemes rose over the last year (to Q3 2015) and 77% expect it
          to rise in the year to Q3 2016. The focus of residential development funding over
          2016/17 is expected to be rebalanced away from London with more lending likely to be
          provided for developments in the regional markets. Based on Knight Frank’s survey,
          44% of respondents stated that they would consider providing funding for developments
          in the North of England, up from 16% of respondents who arranged development
          finance in the North of England over the year to Q3 2015.

11
     Knight Frank (August 2016) UK Residential Market Forecast
12
     Knight Frank (2015) Residential Development Finance Report 2015/2016

                                                                                                 October 2016
                                                                                                  Page 7 of 74
Halsnead Masterplan SPD – Market Demand Review

3. Local Residential Market Analysis
3.1    This section firstly presents a baseline analysis of the existing housing supply and
       establishes demand trends in the residential market local to the masterplan site. It
       subsequently provides a focused assessment of comparable new build residential
       development schemes, complemented by a locally derived commercial perspective
       generated by market consultation.

       Market Supply & Demand

3.2    Analysis in this section is drawn from a range of sources and presented across a variety
       of spatial scales:

       •      Evidence gathered from the 2011 Census is presented at the Whiston level which
                                                                      13
              comprises twelve lower super output areas (LSOAs) . Statistics are also
              presented for Knowsley, Liverpool City Region, the North West and England for
              comparison.

       •      Local information collected from Rightmove.co.uk and Home.co.uk reflects the
              postcode area of L35 only, which covers an area that expands slightly beyond the
              Whiston settlement. L35 is the lowest level of data available.

       •      Evidence collected from Land Registry covers a large proportion of the Whiston
              settlement and is based on data for the four postcode areas of L35 2, L35 3, L35
              5 and L35 7.

3.3    The various local levels identified above are presented graphically in the following
       Figure.

13
  The twelve LSOAs that make up the local area include: Knowsley 007A; Knowsley 007B; Knowsley
009A; Knowsley 009C; Knowsley 009D; Knowsley 009E; Knowsley 013A; Knowsley 013B; Knowsley
013C; Knowsley 013D; Knowsley 013E; and Knowsley 017C.

                                                                                                        8
Halsnead Masterplan SPD – Market Demand Review
Figure 3.1: Whiston Spatial Scales
Contains OS data © Crown copyright and database right (2016)
Source: Turley, 2016
9Halsnead Masterplan SPD – Market Demand Review
Current Housing Supply
3.4 The 2011 Census provides the latest up-to-date profile of the housing stock and
estimates that in 2011 there were approximately 7,267 households in Whiston. Over the
period from 2001 – 2011, the number of households in Whiston remained relatively
stable - declining by just 0.3%, or 20 households. The housing stock in Knowsley grew
by 1.3% over the same period, which demonstrates a low level of household formation,
and new development to accommodate growth, when compared to 7.0% regionally and
7.9% nationally.
3.5 In 2011, 64.8% of the housing stock was privately owned, with 36.9% of stock being
owned by residents with a mortgage or loan, which is higher than the wider comparator
areas. The social rented stock in Whiston accounts for almost 1 in 4 households
(24.5%) which is high when compared to Liverpool City Region (21.6%), the North West
(18.3%) and England (17.7%), yet lower than the Knowsley average (26.6%).
3.6 Private rented households in Whiston account for just 9.3% of the housing stock, which
is slightly in excess of the Knowsley average (7.8%), yet somewhat lower than Liverpool
City Region, the North West and England, where private rented households account for
15.4% - 16.8% of stock. This is demonstrated in the following figure.
Figure 3.2: Housing Stock by Tenure
40.0%
35.0%
30.0%
25.0%
20.0%
15.0%
10.0%
5.0%
0.0%
Owned Owned with Shared Social rented Private Living rent
outright a mortgage ownership rented free
or loan
Whiston Knowsley Liverpool City Region North West England
Source: Census, 2011
3.7 The proportion of semi-detached housing in Whiston is higher than the comparator
areas, at 43.3%, whilst the proportion of detached stock (12.3%) and flats (10.8%) is
comparatively low in Whiston.
10Halsnead Masterplan SPD – Market Demand Review
Figure 3.3: Housing Stock by Type
50.0%
45.0%
40.0%
35.0%
30.0%
25.0%
20.0%
15.0%
10.0%
5.0%
0.0%
Detached Semi-detached Terraced Flat, maisonette Caravan or
or apartment other mobile or
temporary
structure
Whiston Knowsley Liverpool City Region North West England
Source: Census, 2011
3.8 Evidence from the 2011 Census indicates that the housing stock in Whiston
predominantly comprises 3 bedroom homes, at 58.6%, which is marginally higher than
Knowsley (58.0%), and notably higher than the proportion of 3 bed homes nationally
41.2%. The proportion of larger homes (4+ beds) in Whiston (11.3%) is lower than the
wider averages, where the proportion of larger homes ranges from 14.3% in Knowsley
to 19.0% nationally.
Table 3.1: Number of Bedrooms
0 bed 1 bed 2 bed 3 bed 4 bed 5+ bed
Whiston 0.1% 5.8% 24.1% 58.6% 10.1% 1.2%
Knowsley 0.2% 6.6% 20.9% 58.0% 12.7% 1.6%
Liverpool City Region 0.2% 9.4% 23.9% 50.4% 12.6% 3.5%
North West 0.2% 9.5% 28.5% 45.0% 13.1% 3.7%
England 0.2% 11.8% 27.9% 41.2% 14.4% 4.6%
Source: Census, 2011
3.9 Rightmove provides more recent evidence on household size by setting out the size of
properties marketed (for sale or rent) each month, by bedroom. Over the past 6 months,
from February 2016 - July 2016, the proportion of 3 bed properties available in the
postcode area L35 was particularly high, at 52.4% on average.
3.10 There were fewer larger properties (4+ beds) being marketed within L35, equating to an
average of 21.3% of properties, which is similar to the proportion of available 2 bed
properties (23.8%). These trends broadly reflect the size of household stock in Whiston
11Halsnead Masterplan SPD – Market Demand Review
identified in 2011, whilst the increased availability of larger homes suggests that the
provision of larger stock may have expanded over the period from 2011 - 2016.
Table 3.2: Size of Properties Marketed in L35 (February 2016 – July 2016)
Feb-16 Mar-16 Apr-16 May-16 Jun-16 Jul-16
1 bed 12 10 10 10 10 9
2 bed 94 95 92 97 99 88
3 bed 225 223 205 196 198 198
4 bed 71 82 69 62 53 53
5+ bed 19 20 17 18 21 22
Total 421 430 393 383 381 370
Source: Rightmove 2016
3.11 When considering the number of residents per household, the household size in
Whiston is relatively high, recorded at 2.44 people per household in 2011. This
compares to 2.36 at the Knowsley and national levels, 2.26 across Liverpool City
Region and 2.30 across the North West.
Figure 3.4: Household Size
2.50
2.45
2.40
2.35
2.30
2.25
2.20
2.15
Whiston Knowsley Liverpool City North West England
Region
Source: Census, 2011
Sales Volume
3.12 Land Registry records transactional data, including the price paid, for different types of
properties by postcode, which facilitates analysis of the local housing market. Sales
recorded over the past 5 years from June 2011 – June 2016 are analysed in this
section, with the latter date reflecting the latest available data.
12Halsnead Masterplan SPD – Market Demand Review
3.13 A total of 712 sales were recorded by Land Registry within Whiston over the past 5
years, of which just 54 (7.6%) were new build sales. Figure 3.5 demonstrates that the
greatest number of transactions took place in the year to June 2016, with a total of 183
sales recorded, although only 2 sales comprised new build homes.
Figure 3.5: Residential Sales by Type and Year (Year to June 2012 – 2016)
200
180
160
140
120
100
80
60
40
20
0
2012 2013 2014 2015 2016
Year to June
Resale Sales New Build Sales
Source: Land Registry, 2016; Turley, 2016
3.14 Of the 712 total sales recorded in Whiston from June 2011 – June 2016, 50.6%
comprised semi-detached properties, 28.1% terraced properties, 16.6% detached
homes and 4.8% flats.
3.15 Whilst the greatest proportion of new build sales were also for semi-detached homes
(48.1%), almost 1 in 3 new build sales comprised detached properties (31.5%). A higher
proportion of new build flats were also sold (11.1%), yet a lower proportion of terraced
homes were transacted, accounting for 9.3% of new build sales.
Table 3.3: Recorded Property Sales by Type (June 2011 – June 2016)
Detached Semi- Terraced Flat Total
Detached
All Sales 118 360 200 34 712
Total % 16.6% 50.6% 28.1% 4.8% 100%
New Build Sales 17 26 5 6 54
Total % 31.5% 48.1% 9.3% 11.1% 100%
Source: Land Registry, 2016; Turley, 2016
13Halsnead Masterplan SPD – Market Demand Review
Sales Values
14
3.16 Analysis of average (mean) house prices in Whiston , Knowsley, Liverpool City Region,
the North West and England are set out for comparison in Figure 3.6. This demonstrates
that the average house price in Whiston in Q4 2015 was £116,220.
3.17 Mean house prices in Whiston have historically remained lower than the Liverpool City
Region, regional and national average house prices and broadly in line with the
Knowsley average, until Q3 2014 when the Whiston average dropped consistently lower
than Knowsley.
3.18 Over recent years, house prices in Whiston have remained relatively stable, increasing
at a rate of just 2.1% over the past 3 years from Q4 2012 – Q4 2015. This is somewhat
lower than the average house price growth across Knowsley (11.0%), Liverpool City
Region (10.2%), the North West (10.9%) and England (14.3%) over the same period.
Figure 3.6: Change in Mean House Price (Q4 1995 - Q4 2015)
£300,000
£250,000
£200,000
£150,000
£100,000
£50,000
£0
Q4-2008
Q4-1995
Q4-1996
Q4-1997
Q4-1998
Q4-1999
Q4-2000
Q4-2001
Q4-2002
Q4-2003
Q4-2004
Q4-2005
Q4-2006
Q4-2007
Q4-2009
Q4-2010
Q4-2011
Q4-2012
Q4-2013
Q4-2014
Q4-2015
England North West Liverpool City Region
Knowsley Whiston
Source: ONS House price statistics for small areas, 2016
3.19 Land Registry provides recent evidence on the achieved sales value of properties in
Whiston compared to the surrounding settlements. Residential values for transactions
over the 2 year period to June 2016 are presented in the following figure.
14
Values for Whiston are based on an average of the two middle super output areas (MSOAs) of
Knowsley 009 and Knowsley 013, as data is not available at the LSAO level. This is based on a best fit
analysis of the settlement of Whiston.
14Halsnead Masterplan SPD – Market Demand Review
Figure 3.7: Average sales Values (June 2014 - June 2016)
Contains OS data © Crown copyright and database right (2016)
Source: Turley, 2016
15Halsnead Masterplan SPD – Market Demand Review
3.20 Figure 3.7 demonstrates that the achieved residential values to the north of the
masterplan site in Whiston are of lower values, with a high proportion of sales being
under £100,000. To the north east of the site in Rainhill and along the eastern edge of
Prescot, values appear to be higher with a significant number of sales over £200,000.
To the west of the masterplan site and the M57 lies the settlement of Huyton, which
appears to achieve lower values to the north and east and higher values to the south
west of Huyton. Land to the south of the masterplan site is more rural and properties
achieve higher values than homes in Whiston.
3.21 Evidence on house prices obtained from Zoopla reflects the above trends,
demonstrating that Whiston is a relatively low value area compared to some of the
surrounding areas. Zoopla highlights that detached properties in Whiston achieve an
average of £152 per square foot (sq ft), semi-detached homes achieve £131 per sq ft
and terraced properties a lower per sq ft of £102. These values are lower than the £/sq
ft values achieved in the neighbouring settlements, as demonstrated in the following
table.
Table 3.4: Average £/Square Foot by Settlement and House Type
Whiston Rainhill Prescot Huyton
Detached £152 £199 £180 £181
Semi-detached £131 £151 £147 £146
Terraced £102 £135 £113 £112
Flats - £282 £143 £144
Source: Zoopla, 2016
3.22 Nevertheless, new build sales in Whiston have generated higher values than resale
properties. On average over the 5 years June 2016, new build terraced properties
generated a price premium of circa 110.4%, with new build flats and semi-detached
properties also generating significantly higher values than resale, equivalent to 86.1%
and 72.9%, respectively.
3.23 New build detached homes also generated a price premium of almost £100,000 on
average compared to resale detached homes. Whilst these price premiums are greater
for terraced properties and flats, this evidence is based on a smaller sample size of new
build sales and may be reflective of the quality of the resale stock compared to the high
quality of new build provision.
3.24 Nevertheless, this indicates that there is a demand for high quality, new build properties
of all accommodation types locally in Whiston.
16Halsnead Masterplan SPD – Market Demand Review
Table 3.5: Recorded Property Values by Type (June 2011 – June 2016)
Semi-
Detached Terraced Flat Total
Detached
Average for All Sales £179,164 £116,996 £89,058 £71,838 £117,295
Average for New Build £276,329 £202,337 £187,360 £133,667 £216,614
New Build Price Premium 54.2% 72.9% 110.4% 86.1% 84.7%
Source: Land Registry, 2016; Turley, 2016
Time on the Market (ToM)
15
3.25 Evidence from home.co.uk suggests that in August 2016 unsold properties on the
16
market in postcode area L35 had spent an average of 232 days on the market , based
on a sample size of 311 properties.
3.26 Higher value properties with pricing ranging from £400,000 - £500,000 spent the longest
time on the market (323 days) with properties ranging from £200,000 to £300,000
spending the least amount of time on the market (201 days).
3.27 Home.co.uk also provides the average ToM for properties in L35 by type and size.
Evidence suggests that semi-detached homes spent the least ToM (204 days) whilst
flats spent the most ToM (316 days). When considering the size of properties, 1 bed
properties spent the most ToM (524 days) and 3 bed homes spent the least ToM (207
days).
3.28 The following table ranks the value, type and size of properties in L35 by the length of
time spent on the market in August 2016. This suggesting that there is higher demand
for 2 and 3 bed, semi-detached and detached properties within the value range of
£100,000 to £300,000.
15
Note that the data presented on the time on the market represents evidence at one point in time
(18/08/2016).
16
Home.co.uk specifies that the time on the market is the number of days a property has been listed for
sale or rent and that readers should note that a property may be withdrawn from the market for reasons
other than a successful sale or letting.
17Halsnead Masterplan SPD – Market Demand Review
Table 3.6: ToM Ranking for Available Properties in L35 by Value, Type and Size
ToM Ranking Residential Value Type Size
17
1 Over £1,000,000 (34) Semi-detached (204) 3 bed (207)
2 £200,000 to £300,000 (201) Detached (247) 2 bed (226)
3 £100,000 to £200,000 (209) Terraced (249) 5 bed (241)
4 £300,000 to £400,000 (239) Flat (316) 4 bed (251)
18
5 Under £100,000 (271) - 1 bed (524)
6 £500,000 to £1,000,000 (283) - -
7 £400,000 to £500,000 (323) - -
Source: home.co.uk, 2016
Local New Build Development Market
3.29 A review of new build residential development schemes within a 5km radius of the
masterplan site, and discussions with on-site sales offices and independent local sales
agents, has been undertaken. The analysis includes an assessment of developments in
the neighbouring settlements of Rainhill immediately to the north east of the masterplan
site, Lea Green further to the north east, Widnes to the south east, Huyton and Roby to
the west of the M57 and finally the settlement of Eccleston to the north (albeit the latter
is slightly outside the 5km radius). The location of the new build developments assessed
in relation to the masterplan site is presented in Figure 3.8.
3.30 This section includes a summary of the analysis undertaken. Appendix 1 sets out the
site plan and details of the site accommodation schedule, currently available homes and
achieved sales on each of the developments.
17
Small sample size – 1 property
18
Small sample size – 8 properties
18Halsnead Masterplan SPD – Market Demand Review
Figure 3.8: New Location of New Build Developments
Contains OS data © Crown copyright and database right (2016)
Source: Turley, 2016
19Halsnead Masterplan SPD – Market Demand Review
Stevenson Grove, Rainhill – Countryside Properties
3.31 The Stevenson Grove development by Countryside Properties is the nearest new build
19
development to the site, located circa 1.9km north east of the masterplan site in
Rainhill. The development is bound to the north east by Warrington Road (A57), to the
south east and north west by existing residential development and to the south west by
Hemmingsway.
3.32 The Stevenson Grove development comprises 79 units and provides a mix of 2, 3 and 4
bed homes. The majority of the dwellings are 2 storeys, with the Dunham house type
increasing to 2.5 storeys (13no. 5 bed homes).
3.33 Currently there is a range of 3 bed semi-detached and detached homes and one 4 bed
detached home of 4 different house types available on the Stevenson Grove
development. These units are currently being marketed for between £192,500 and
£289,950, or around £235 per sq ft, or £223 per sq ft if an illustrative 5% discount is
applied to allow for anticipated sale incentives.
3.34 Land Registry provides data on 36 recorded sales on the Stevenson Grove
development over the period from January 2015 to March 2016. This suggests that the
new homes have sold at a rate of circa 2.4 units per month. Sales evidence suggests
that units sold at an average value of around £223 per sq ft, with this ranging from £186
to £234 per sq ft. This is consistent with the assumed discounting for incentives as set
out above.
Waterside Village, Lea Green – Morris Homes
3.35 The Waterside Village development by Morris Homes is located circa 4.0km north east
20
of the masterplan site in Lea Green. The development currently being marketed
comprises a smaller phase of a larger development for 364 homes in total. This phase
of the development contains 33 units.
3.36 Overall, the Waterside Village development provides a full range of 1, 2, 3, 4 and 5 bed
homes and a significant number of various house types. The majority of the dwellings
are 2 storeys, with 2 house types (14 units) increasing to 2.5 storeys and 4 house types
(43 units) increasing to 3 storeys.
3.37 Currently there is a range of 1 bed apartments and 3, 4 and 5 bed mews and detached
homes of 10 different house types available on the Waterside Village development.
These units are currently being marketed for between £96,750 and £397,750, or around
£195 per sq ft. When a 5% discount is applied to allow for anticipated sale incentives,
the net sales value decreases to £185 per sq ft.
3.38 Discussions with the sales agent on the site suggested that Waterside Village is a
strong selling site achieving circa 6 units sales per month. Generally 3 bed semi-
detached and 4 bed detached homes are selling well with limited need for incentives to
be offered. The sales agent suggested that incentives such as flooring or carpets are
offered on around 50% of sales to encourage buyers to reserve units. Purchaser
demand on the development has predominantly arisen from family households, yet
19
Note that this is a straight line distance.
20
Note that this is a straight line distance.
20Halsnead Masterplan SPD – Market Demand Review
approximately 25% of buyers have been first-time buyers (FTB). According to the sales
agent, the EU referendum has not affected buyer interest or sales on the development
and it is expected that interest will increase going forward as a result of decreasing
mortgage interest rates.
3.39 Land Registry provides data on 54 sales on the Waterside Village development over the
period from January 2015 to March 2016. This suggests that the new homes have sold
at an average rate of circa 3.6 units per month. Based on the sales evidence and
21
information collected from the accommodation schedule and the EPC Register , the
units sold at an average value of circa £177 per sq ft, with this ranging from £154 - £209
per sq ft.
Norlands Green, Widnes – Taylor Wimpey
3.40 The Norlands Green development by Taylor Wimpey is located circa 3.4km south east
22
of the masterplan site in Widnes. The development is bound to the south west by
Norland’s Lane, to the north west and north east by open pasture land and to the south
east by existing/recently developed residential development. The Norlands Green
development comprises 77 units and provides a mix of 3, 4 and 5 bed semi-detached
and detached 2 storey homes.
3.41 Currently there are two 3 bed semi-detached homes and three 4 bed detached homes
available on the Norlands Green development. These units are currently being marketed
for between £234,995 and £394,995, or around £231 per sq ft. When a 5% discount is
applied to allow for anticipated sale incentives, the value per sq ft decreases to £219 per
sq ft. There is currently no evidence of achieved sales on the Norlands Green
development.
3.42 The sales agent at the Norlands Green development stated that 18 units have sold on
site since marketing began in September 2015, equating to an average sales rate of 1.5
units per month. A mix of 3, 4 and 5 bed units have sold on the development to a range
of buyers, including 1st time and 2nd time buyers and buyers that are downsizing.
Although the agent highlighted that the majority of buyers are 1st time buyers that are
drawn in by the Help to Buy scheme. Incentives are regularly offered on the available
homes at Norlands Green with most sales including an incentive of some scale. When
asked to comment on the effect of Brexit on enquiries and reservations at the
development the agent stated that there has been no impact so far or any comments
from buyers regarding the EU referendum. The agent considered the local residential
market to be stable with little expectation of market decline going forward.
The Orchards, Roby – Barratt Homes
3.43 The Orchards development by Barratt Homes is located circa 3.8km west/north west of
23
the masterplan site in Roby, west of Huyton. The site comprises the former Knowsley
Community College playing field and is bound by existing residential development and
by a railway line to the south. The Orchards development comprises 129 units and
provides a mix of 2, 3 and 4 bed mews, semi-detached and detached homes.
21
https://www.epcregister.com/
22
Note that this is a straight line distance.
23
Ibid
21Halsnead Masterplan SPD – Market Demand Review
3.44 Currently there are three homes available for sale on the Orchards development. The
available units are 4 bed semi-detached and detached homes with asking values of
£183,995 and £238,995, or around £202 per sq ft. When a 5% discount is applied to
allow for anticipated sale incentives, the value per sq ft decreases to or £192 per sq ft.
3.45 Land Registry provides data on 28 sales on the Orchards development over the period
from August 2015 to May 2016. This suggests that the new homes have sold at a rate of
circa 2.6 units per month. Sales evidence suggests that units sold at an average value
of around £189 per sq ft, with this ranging from £163 to £223 per sq ft.
Rosebank, North Huyton – Gleeson Homes
3.46 The Rosebank development by Gleeson Homes located circa 4.6km north west of the
24
masterplan site in North Huyton. The development is surrounded by existing
residential development and comprises part of the wider regeneration of North Huyton,
promoted through the New Deal for Communities (NDC) programme. This phase of the
regeneration development (phase 2c) comprises 179 units and provides a mix of 2, 3
and 4 bed semi-detached and detached homes.
3.47 Currently there is a range of 2, 3 and 4 bed semi-detached and detached homes of 6
different house types available on the Rosebank development. These units are currently
being marketed for between £97,995 and £155,995, or around £151 per sq ft, or £144
when a 5% discount is applied to allow for anticipated sale incentives. There is currently
no evidence of achieved sales on the Rosebank development.
3.48 The sales agent at the Rosebank development suggested that this phase of the
development has been marketed since early 2016 and is achieving an average sales
rate of 1 – 2 units per week. All unit types are considered to be selling well with
st
particular demand arising from 1 time buyers, accounting for more than half of the
development’s buyers. The Help to Buy scheme is a particularly popular offer that the
development provides and utilised on around 50% of sales. Sales incentives are not
generally offered on properties other than the 1 featured house per month. The agent
commented that Gleeson Homes are a regeneration builder with affordable house prices
and so incentives are rarely required. The EU referendum has not been recognised to
have an impact on the development at present, although there is an awareness that the
impact on the residential market may surface over the next couple of years.
Lancaster Place, Widnes – Redrow Homes
3.49 The Lancaster Place development by Redrow Homes is located circa 4.6km to the south
east of the masterplan site on the northern fringe of Widnes. The development is bound
to the South by Lunts Heath Road and existing residential development, to the west by
Wilmere Lane and existing residential development, to the east by Cranshaw Lane and
to the north by a tree line beyond which lies open greenfield agricultural land.
3.50 The Lancaster Place development comprises 126 units and provides a mix of 3, 4 and 5
bed semi-detached and detached homes. The majority of the dwellings are detached
homes. A review of the development in October 2016 found that all of the new homes
the Lancaster Place site had sold and resultantly Redrow no longer maintains an on-site
sales and marketing presence.
24
Ibid
22Halsnead Masterplan SPD – Market Demand Review
3.51 Land Registry provides data on 58 recorded sales on the Lancaster Place development
over the period from January 2014 to December 2015. This suggests that the new
homes have sold at a rate of circa 2.4 units per month. Sales evidence suggests that
units sold at an average value of around £231 per sq ft, with this ranging from £217 to
£247 per sq ft.
Jubilee Gardens, North Huyton - Keepmoat Homes
3.52 The Jubilee Gardens development by Keepmoat Homes is located circa 5.0km north
25
west of the masterplan site in North Huyton. The development is bound to the south
west by Princess Drive and to the south east by Knowsley Community College. To the
north and north west of the site lies existing residential development. As with the
Rosebank site, the Jubilee Gardens site comprises part of the regeneration of North
Huyton, promoted through the NDC programme.
3.53 This phase of the regeneration development (phase 3) is part of a larger Keepmoat
Homes development and comprises 151 units, providing a mix of 2, 3 and 4 bed homes.
Discussions with the sales agent on site indicated that Jubilee Gardens is achieving 5-6
sales per month and typically incentives such as carpet and flooring are offered on
approximately 25% of sales. The 3 bed semi-detached 3 storey units on the
development are recognised to be attracting the greatest levels of interest and a high
st
proportion of buyers are 1 time buyers and of a younger demographic, to whom the
Help to Buy scheme is attractive. According to the sales agent, the EU referendum has
not affected the number of visitors or sales on the Jubilee Gardens development and it
is expected that market interest will remain positive over the coming year.
3.54 Currently there is a range of 2, 3 and 4 bed semi-detached and detached homes of 7
different house types available on the Jubilee Gardens development. These units are
currently being marketed for between £105,995 and £174,995, or around £150 per sq ft,
or £142 when a 5% discount is applied to allow for anticipated sale incentives. There is
currently no available evidence of achieved sales on the Jubilee Gardens development.
Eccleston Grange, Eccleston – Jones Homes
3.55 The Eccleston Grange development by Jones Homes is located circa 5.5km north of the
26
masterplan site in Eccleston, St Helens. Although the development exceeds the 5 km
radius for the study, the scale of the development and mix of uses proposed provide a
useful context for comparison.
3.56 The Eccleston Grange site is bound to the north by a road named Millfields and to the
east by Holme Road. Further phases of development are proposed to the south and
east of the development site, beyond which lies existing residential development,
Eccleston Top Dam and a wooded area.
3.57 The Eccleston Grange development comprises over 260 residential dwellings with a full
range of homes from 1 bed apartments to 5 bed detached properties, in addition to 3
retail/commercial (A1, D2 or vets) units a medical centre and pharmacy and office (B1)
units with apartments above.
25
Ibid
26
Ibid
23Halsnead Masterplan SPD – Market Demand Review
3.58 Currently there is a range of 3, 4 and 5 bed mews, semi-detached and detached homes
of various house types and heights available on the Eccleston Grange development.
These units are currently being marketed for between £195,950 and £414,950.
Soft Market Testing
Local Estate Agents
3.59 Turley engaged with residential property agents based in the local area in order to gain
a local perspective on the supply and demand trends, residential market drivers,
purchaser sentiment, purchaser demographics and any market gaps in the Whiston
property market. Turley engaged with the following property agents:
• Andrew Louis, Prescot
• Brooks Estate and Letting Agents Ltd, Prescot
• Cameron Mackenzie, Rainhill
• Your Move, Prescot
3.60 Agents confirmed that Whiston maintains reasonable levels of market demand, yet the
surrounding areas of Prescot, Rainhill and some areas of Huyton are more sought after
than Whiston. Within the settlement of Whiston the demand for homes varies with some
areas being less desirable than others, such as areas dominated by ex-council housing
stock and rental properties that are not kept well.
3.61 The demand for homes in Whiston is focussed on 2 and 3 bed, end terrace, mews and
st
semi-detached homes. Agents stated that the majority of buyers are 1 time buyers,
although there is a market for second movers and families purchasing in the area and
older residents looking to downsize. Engagement established that there is high demand
in the rental market in Whiston with many investors looking to purchase, refurbish and
let out properties in the area.
3.62 The agents suggested that the average sales values locally in Whiston are generally
between £100,000 and £120,000, which is reflective of the demand for smaller stock,
with larger 4 bed detached homes and properties of over £250,000 are more difficult to
sell.
3.63 Evidence has suggested that the Whiston market accommodates local people moving
within the area, yet also attracts residents from further afield with evidence of residents
relocating in Whiston. The location of the settlement in relation to key transport links,
including the M62, the M57 and Whiston train station, and the accessibility of Whiston to
key employment areas, such as Liverpool and Manchester, is considered to be
beneficial to the local market. Evidence also suggests that Whiston Hospital attracts
residents to the area through the provision of employment opportunities.
3.64 Some agents indicated that following the EU referendum, interest in the residential
market declined briefly, although enquiries and sales have since picked up and are in
line with, if not greater than, usual trends. Other agents stated that they have not
experienced any change in activity following the announcement of Brexit in June. Going
24Halsnead Masterplan SPD – Market Demand Review
forward agents expect that there may still be caution in the market and a potential delay
in the impact of Brexit, although do not envisage that the market will decline.
Nevertheless, agents highlighted that separate to the EU referendum were the changes
to Stamp Duty Land Tax (SDLT) implemented in April 2016, which appear to have
slightly slowed down the investor market given the increase in tax liability on purchasers
owning multiple properties.
3.65 Agents commented that currently there is competition on the surrounding new build sites
and that the provision of new homes in Whiston would generate high demand,
particularly from the 1st time buyer market due to the Government incentives that are
available on new build homes - such as Help to Buy- and shared ownership would be
expected to be attractive.
Housebuilders
3.66 Turley engaged with active national housebuilders operating in the region to gauge
industry perspective upon the attractiveness of Whiston, and the masterplan site, in the
current market as well as to get an insight into the health and dynamics of the local
market for residential land.
3.67 Turley engaged with the following in September and October 2016:
• Land Manager, Barratt Homes
• Associate Planning Director, Countryside Properties
• Senior Land Manager, David Wilson Homes
• Land Director, Miller Homes
• Senior Land Manager, Redrow Homes
• Strategic Land Manager, Story Homes
3.68 Further conversations are pending with Taylor Wimpey and Bellway.
3.69 A summary of each of the conversations held is set out as follows:
Barratt Homes
3.70 Barratt Homes is aware of the South of Whiston site and has held discussions with land
owners.
3.71 Whilst there is no evidence of recent or current market activity directly in Whiston, due to
a lack of sites, the South of Whiston site is considered to have good workable volume
and is located in a wider area of relatively good demand achieving stable and relatively
strong values.
3.72 Barratt Homes confirmed their recent activity and interest in the area, having previously
developed a site at Larch Road, Roby, and having missed out on acquiring a site at
Rupert Road, Roby recently to a competitor.
25Halsnead Masterplan SPD – Market Demand Review
3.73 Barratt Homes stated a view that the South of Whiston site is suitable for a similar mix to
that developed at their Larch Road, Roby, site and would be attractive to both first time
buyers and ‘second stepper’ households. It was suggested that the largest properties
would be 4-beds at 1,300 sq ft. It was considered that sales values would be slightly
lower (5-7.5%) than those achieved at Larch Road.
3.74 Barratt recommended that phasing of the site commences with delivery from access
points off Windy Arbour Road or Lickers Lane.
3.75 Sales rates are expected to be up to 30 units per annum (2.5 per calendar month)
excluding affordable housing, albeit this would be diluted to 25 units per annum if
multiple outlets are delivering simultaneously.
3.76 Greenfield land values are expected to be at £650,000 - £700,000 per net developable
acre (before deductions for abnormal costs), although this could fluctuate if large tracts
are released to market simultaneously.
Countryside Properties
3.77 Countryside confirmed that they see the South of Whiston site as in a sustainable,
attractive and accessible location, which is of interest to them.
3.78 They highlighted that there is no housing market activity at present in Whiston due to
limited opportunities for development. They pointed to some activity nearby in Prescot at
Scotch Barn Lane.
3.79 Countryside indicated that the site is in a good location for commuters into both
Liverpool and Manchester and could attract both local interest, which would justify
inclusion of smaller units, as well as larger units for commuting households and families.
3.80 With respect to development phasing, it was recommended that Windy Arbour Road
represents a rational starting point for development due to the good accessibility.
3.81 Land fronting Foxes Bank Lane was highlighted as the most desirable area of the site
for residential development, with the northern boundary considered the least attractive
due to outlook and the interrelationship with existing properties. Countryside highlighted
that the delivery of larger units would be inappropriate along the northern boundary as a
result.
3.82 Some concern was stated regarding the achievable values for development in the south
of the site due to noise levels and the general presence / proximity to the M62.
David Wilson Homes
3.83 David Wilson Homes (DWH) has already been holding discussions with respect to the
site with agents representing landowners and DWH is certainly interested.
3.84 They currently have several land interests in the Prescot market to the north –
Whitakers Garden Centre (J2 M57); Carr Lane - South of Prescot; and Scotch Barn
Lane, which DWH consider to represent a more attractive market location than Whiston.
26Halsnead Masterplan SPD – Market Demand Review
3.85 Although Whiston is reasonably well regarded, DWH would see it as necessary to for
the site to represent a differential product and ‘place’ from the existing Whiston
settlement.
3.86 DWH would be keen to acquire parcels to develop up to circa 500 dwellings, although
this could raise further if developing alongside Barratt using the dual brand offer they are
seeking to establish.
3.87 DWH highlight that the western part of the site has a restricted frontage, with more
limited visibility from Windy Arbour Road, but that it represents a reasonable market
location. The southern area of the site is less desirable and will attract lower prices due
to proximity to the M62. The eastern side of the site, with access off Foxes Bank Lane
has good access, is considered more attractive and would achieve the highest values.
3.88 However, concern was raised about the ability of the site to attract purchasers from
outside of Knowsley, and to really capture commuter interest. As a result, they would
consider ‘pitching’ the scheme with 3 bed mews and smaller 4 bed houses ranging up to
circa 1,100 sq ft.
3.89 Pricing is expected to be in the range of £190-195 per sq ft for the majority of the site,
but could increase up as far as £250 per sq ft for 4-bed units on the most desirable
areas of the site.
3.90 DWH noted that, should the caravan park remain, it could have a negative impact on the
values achievable in this part of the site, and influence the dwelling types provided.
3.91 With respect to the land market, DWH anticipate greenfield residential values (before
abnormal deductions) to be in the range of £700,000 - £750,000 per net acre.
Housebuilders would seek to acquire parcels on the basis of the site having an extant
outline planning permission.
Miller Homes
3.92 Miller Homes view the South of Whiston site as being in an excellent site location due to
highways connections to M62/M57 and the direct rail link to Liverpool/Manchester.
3.93 They have had limited direct market activity in Whiston due to their being no recent
marketed sites. They have bid for Land at Rupert Road, Roby, but understand that they
came a close second. They would be interested in the South of Whiston site.
3.94 Whiston has a weaker market reputation and perception than neighbouring Huyton /
Roby and Rainhill. Nevertheless, the South of Whiston site has the potential to generate
a ‘new market’.
3.95 Miller Homes advocated an approach to open up the site via Windy Arbour Road, with
expected sales prices in the region of £200 per sq ft and unit sizes topping out at 1,200
sq ft for a 4-bed detached or townhouse unit. A capital value off £250,000 was
considered the upper threshold before breaching the market in this location.
3.96 It was considered that higher values would be achievable on land off Foxes Bank Lane
due to the rural outlook, but that this shouldn’t be released too early if there is a desire
27Halsnead Masterplan SPD – Market Demand Review
to maximise unit values and land receipts. It was recommended that developer
confidence should be built via positive purchaser sentiment and sales prices / volumes
on the early phases off Windy Arbour Road first.
3.97 Miller Homes considered that the northern part of the site accessed off, and fronting
onto, Lickers Lane as being the most challenging to bring forward. It was advocated that
early delivery should be avoided in order to set a market precedent on this (both in
terms of unit mix/product and sales values) and de-value later phases. The land would
appeal to a low-end market developer due to its frontage onto existing Council-owned
and low value properties. The South of Whiston site should be well established before
bringing this area forward for delivery.
Story Homes
3.98 Story Homes confirmed that they have not yet acquired sites in Knowsley, but have got
a site in Windle, St.Helens and would be keen to move into the Knowsley market if the
right opportunity arose. They would be targeting £200 per sq ft.
3.99 They considered that the site is large enough to establish a new market, distinct from
existing pricing and perceptions of Whiston. It was confirmed that Windy Arbour Road is
the most logical starting point for development due to its proximity and relationship to
the existing settlement, although the rural aspect on the eastern side of the site off
Foxes Bank Lane is more attractive to the market.
3.100 Story Homes recommended smaller units of 2-3 beds positioned in the north of the site
closest to Lickers Lane, with a size range of 650 sq ft to 900 sq ft. It was suggested that
there is greater scope across the remainder of the site to include larger properties up to
a maximum of 4-beds with a size of 1,200 sq ft. It would be considered that a sales rate
of 2.5 units per calendar month would be achievable due to the location close to the
motorway as well as competitive pricing.
Redrow Homes
3.101 Redrow confirmed that they are aware of the South of Whiston site and have maintained
an interest throughout its promotion through the Local Plan process. They are actively
looking at the site and are interested in acquiring up to 30 ha (gross) to the east of the
site off Foxes Bank Lane.
3.102 Redrow’s intention is to develop their own masterplan for this area, which will look to
establish a new location distinct from the Whiston Market, which offers 3 and 4 bed
detached homes. Their preference would be to develop the eastern side of the site first
to set the precedent for the rest of the development and create something different from
Whiston as it currently exists.
3.103 Redrow confirmed that there is little market appetite for sites in Whiston, albeit they
noted there are currently opportunities in Prescot (Whitakers Garden Centre and
Prescot town centre) that they are interested in.
3.104 It was confirmed that land values in Whiston are low at circa £500,000 per net acre
(greenfield before abnormal costs), but that they expect the South of Whiston site to
achieve higher receipts.
28You can also read