CAPITALAND LIMITED Macquarie ASEAN Conference 2021 24 August 2021 - CapitaLand Limited ...
←
→
Page content transcription
If your browser does not render page correctly, please read the page content below
CAPITALAND LIMITED Macquarie ASEAN Conference 2021 24 August 2021
Disclaimer
This presentation may contain forward-looking statements. Actual future performance, outcomes and results may differ materially from those expressed in
forward-looking statements as a result of a number of risks, uncertainties and assumptions. Representative examples of these factors include (without limitation)
general industry and economic conditions, interest rate trends, cost of capital and capital availability, availability of real estate properties, competition from
other developments or companies, shifts in customer demands, shifts in expected levels of occupancy rate, property rental income, charge out collections,
changes in operating expenses (including employee wages, benefits and training, property operating expenses), governmental and public policy changes
and the continued availability of financing in the amounts and the terms necessary to support future business.

You are cautioned not to place undue reliance on these forward-looking statements, which are based on the current view of management regarding future
events. No representation or warranty express or implied is made as to, and no reliance should be placed on, the fairness, accuracy, completeness or
correctness of the information or opinions contained in this presentation. Neither CapitaLand Limited (“CapitaLand” or the “Company”) nor any of its affiliates,
advisers or representatives shall have any liability whatsoever (in negligence or otherwise) for any loss howsoever arising, whether directly or indirectly, from
any use of, reliance on or distribution of this presentation or its contents or otherwise arising in connection with this presentation.

The past performance of CapitaLand or any of the listed funds managed by CapitaLand Group (“CL Listed Funds”) is not indicative of future performance.
The listing of the shares in CapitaLand (“Shares”) or the units in the CL Listed Funds (“Units”) on the Singapore Exchange Securities Trading Limited (“SGX-ST”)
does not guarantee a liquid market for the Shares or Units.

This presentation is for information only and does not constitute an invitation or offer to acquire, purchase or subscribe for the Shares, Units or shares of
CapitaLand Investment Limited ("CLI") (formerly known as CapitaLand Financial Limited and CapitaLand Investment Management Limited)(1). No offering of
Shares, Units or shares of CLI is being made in connection with the matters discussed herein in Singapore or otherwise.

The directors of the Company (including any who may have delegated detailed supervision of the preparation of this presentation) have taken all reasonable
care to ensure that the facts stated and all opinions expressed in this presentation in each case which relate to the Company, CLI and CapitaLand Integrated
Commercial Trust (“CICT”) (excluding information relating to CLA Real Estate Holdings Pte. Ltd. ("CLA" or the "Offeror") or any opinion expressed by the Offeror)
are fair and accurate and that, where appropriate, no material facts which relate to the Company, CLI and CICT have been omitted from this presentation,
and the directors of the Company jointly and severally accept responsibility accordingly. Where any information which relates to the Company, CLI and CICT
has been extracted or reproduced from published or otherwise publicly available sources or obtained from the Offeror, the sole responsibility of the directors
of the Company has been to ensure that, through reasonable enquiries, such information is accurately extracted from such sources or, as the case may be,
reflected or reproduced in this presentation. The directors of the Company do not accept any responsibility for any information relating to the Offeror or any
opinion expressed by the Offeror.
Notes:
(1) CLI effected a change of name from CapitaLand Financial Limited to CapitaLand Investment Management Limited on 22 Mar 2021 and subsequently from CapitaLand Investment Management Limited to CapitaLand
    Investment Limited on 18 Jun 2021
                                                                                                                                                                                                              2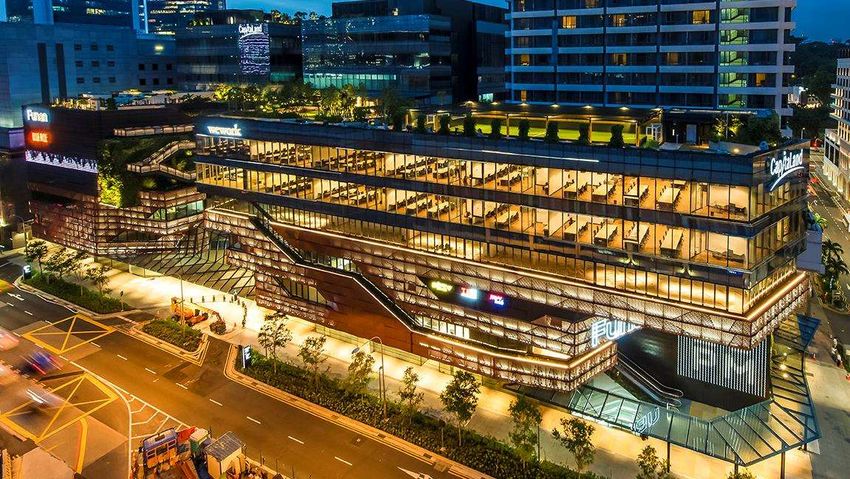
Contents
Section 1
Overview

Section 2
1H 2021 Financial Highlights

Section 3
1H 2021 Strategy Execution

Section 4
1H 2021 Operational Highlights

Section 5
Supplementary Information

                                 Capital Tower, Singapore
Section 1
Overview

            Raffles City The Bund, Shanghai, China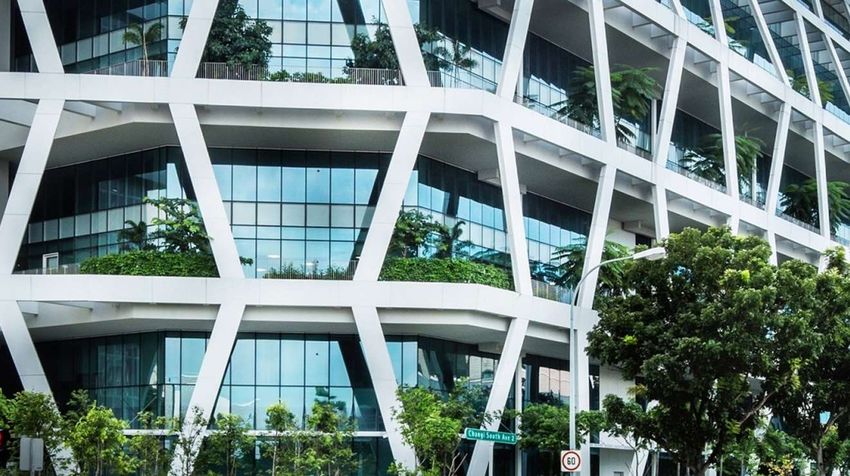
Section 1: 1H 2021 Overview

CapitaLand’s Final Report Card

1. Back in Black                                                                                      2. Focused Strategy Execution
•     Reversed FY 2020’s loss: PATMI of S$922.2M                                                      •    Pivot towards new economy continues (>80% of total
      generated in 1H 2021                                                                                 Group investments of c.S$3.6B in 1H 2021; >S$1.8B in
                                                                                                           data centres
•     Credible Operating PATMI (S$433.6M):
                                                                                                      •    Capital recycling of more than S$11.2B1 YTD
      Improvement of 66% YoY
                                                                                                           compensates for slower activity in FY 2020
•     Prudent capital management through lower                                                        •    Growing FUM → YTD2 FUM grew c.7% to S$83B
      gearing and resilient operating cash flow
                                                                                                      •    Acceleration in private funds growth → 3 new funds;
                                                                                                           More than S$6.4B of new committed capital2

                                                                                                      •    ~S$600M invested through expanded longer-stay
                                                                                                           lodging asset classes; >8,300 new units signed brings
    Committed to achieving                                                                                 total units under management to 128,500

    Sustainable Returns above
    Cost of Equity
    Notes:
    1. Gross divestments on a 100% basis as of 12 August 2021
    2. As of 30 June 2021                                                                                                                                          5
    3. Includes S$5.9B new equity from Ping An Life Insurance for partial stakes in six Raffles City developments in China as announced on 28 June 2021
Section 1: 1H 2021 Overview

CapitaLand’s Final Report Card (Cont’d)
3. Beyond the Numbers                                  Inaugural CapitaLand
                                                     Sustainability X Challenge:
                                                      270 Entries, 25 Countries,
•   Committed to supporting our tenants and             12 Months, 6 Finalists,
                                                            2 Top Winners
    the community through ongoing
    challenges
❑ >S$50M of rental rebates and marketing
  support committed in 1H 2021
❑ >S$9M donated for COVID-19 community                                                                                 (Above) INOVUES, Inc. (USA),
  response efforts globally since January 2020                                                                         Adaptive Glazing Shield,
                                                                                                                       revitalizing windows for
•   Extending Sustainability Leadership            Climatec Corp Pte Ltd (Singapore), ClimaControl Quantum Resonance   enhanced energy efficiency
                                                   Water, revolution in cooling tower water treatment
❑ Held CapitaLand’s inaugural Sustainability
                                                 CapitaLand Ranked 10th in General Category                     FTSE4Good Index Series
  X Challenge                                    of Singapore Governance and Transparency
                                                                                                              • CapitaLand listed for the 8th
                                                                Index 2021
❑ Launch of S$50M CapitaLand Innovation                                                                         consecutive year since 2014
  Fund                                           CapitaLand REITs Took Half of the Top 10 Spots in            • CICT listed. (Previously CCT
                                                      REITs and Business Trusts Category                        and CMT were listed)
❑ Biggest Winner in Singapore Governance
  and Transparency Index 2021
❑ Listed for 8th consecutive year on
  FTSE4Good Index Series

                                                                                                                                                      6
Section 1: 1H 2021 Overview

A New Beginning
CapitaLand’s proposed strategic restructuring to privatise the development business and list the
investment management business received resounding Shareholder approval

    99.59%
    of votes cast voted “For” the Capital Reduction and
    Distribution In Specie at the EGM

    99.80% and 97.58%
    of votes cast of number of shareholders present
                                 and voting
   voted “For” Scheme of Arrangement at the Scheme Meeting
                                                                          (From L-R) Mr Lee Chee Koon, Group CEO, Mr Miguel Ko, Chairman, Mr Chaly
                                                                          Mah, Independent Director and Mr Andrew Lim, Group CFO

                    Subject to the satisfaction of other Scheme Conditions, which include, the
                     Court’s approval of the Capital Reduction and Distribution in specie and
                       sanction of the Scheme of Arrangement, CapitaLand Limited will be
                     delisted from the SGX-ST and CapitaLand Investment Limited (CLI) will be
                           listed on the SGX-ST in or around mid-September 2021

                    CapitaLand Thanks Shareholders for Their Strong Endorsement
                                                                                                                                                     7
• Test

Section 2
1H 2021 Financial
Highlights

                    8
Section 2: 1H 2021 Financial Highlights

 1H 2021 Key Figures

           Revenue                                                   EBIT                        PATMI (Operating)
                                                                                                  Operating PATMI                                                    PATMI
          S$2,730.0M                                          S$231.5M
                                                             S$2,165.7M                                      S$769.9M
                                                                                                             S$433.6M                                        S$(1,574.3M)
                                                                                                                                                               S$922.2M

   Operating Cashflow                                                       Net Debt/Equity                                                   Cash & Available
                                                                                                                                              Undrawn Facilities

Note:
1. The Group recorded a significant increase in PATMI in 1H 2021 as compared to 1H 2020 PATMI of S$96.6 million, mainly driven by better operating performance, higher gains from asset
   recycling as well as absence of revaluation losses from CICT                                                                                                                           9
Section 2: 1H 2021 Financial Highlights

PATMI Composition
Steady YoY recovery registered in 1H 2021

            Total                                                                      20%
S$’M                         Portfolio gains/       Revaluations       Total PATMI
          Operating         Realised FV gains   losses / Impairments                         Operating PATMI                Portfolio/Realised FV
  Trading  PATMI
  IP                                                                          854.5%
                                                                                                                            gains
            66.0%                 N.M                      N.M                               •   Lower rental rebates
                                                                                 922
                                                                                                                            •   Underpinned by
                                                                                             •   Higher transactional fee       gross divestment
                                     489                                                         income from both listed        value1 exceeding
                   434                                                                           and unlisted funds             S$11.2B in 1H 2021
                                                                                             •   Higher handover from
                                                                                                 China residential
           261      329
                  (76%)
            190
          (73%)                                                                              Revaluation losses/impairment
                                                                         97
                   105                                                                       •   Absence of FV losses from CICT recognised in 1H 2020
            71    (24%)       9
          (27%)                                   1H 2020 1H 2021

         1H 2020 1H 2021    1H 2020 1H 2021                 (1)        1H 2020 1H 2021

                                                   (173)

       Note:
       1. On a 100% basis                                                                                                                               10
Section 2: 1H 2021 Financial Highlights
Cash PATMI Continues to Strengthen
Healthy 1H 2021 Cash PATMI1 mainly attributed to a step up in capital recycling and improved
investment property operating income
Portfolio Gains/Realised
S$’M Operating PATMI Cash PATMI1
Fair Value Gains
1000 923
Investment Properties
Trading Properties
800
653
600
509 489
434
400 208
261 271
329
200 190 144
301
71 105 10
0
1H 2020 2H 2020 1H 2021 1H 2020 2H 2020 1H 2021 1H 2020 2H 2020 1H 2021
Note:
1. Cash PATMI = Operating PATMI + portfolio gains + realised FV gains
11Section 2: 1H 2021 Financial Highlights
Hardest Hit Sectors Contribute to Improved Performance
1H 2021 Operating EBIT for CapitaLand’s Retail and Lodging Segments exhibited YoY progress,
but are yet to return to pre-COVID levels
HoH
vs 2H 2019 (Pre COVID-19)
Retail Operating EBIT Lodging Operating EBIT
S$’M
S$’M
800
-35% 22% 4% 200 -83% NM NM
700 -35% -21% -17% -83% NM -70%
600
150
500
400 100
176
300
682 445 541 565
200 50
100
30 53
-9
0 0
2H 2019 1H 2020 2H 2020 1H 2021 2H 2019 1H 2020 2H 2020 1H 2021
-50 12Section 2: 1H 2021 Financial Highlights
Overall Fee Income1 Increases by c.36% YoY
Improvement is seen across all fee income segments
1H 2020 1H 2021
Others2
Others2
14%
12%
REIT REIT
Management3 Management3
Serviced 33%
34%
Residence Serviced
Management Residence
15% Management
Group Fee Income1: 16% Group Fee Income1:
S$307.1 Million S$416.9 Million
Property Private Fund Private Fund
Management Management3 Property Management3
25% 12% Management Project 12%
Project 22% Management
Management
3%
2%
Notes:
1. Includes fee-based revenue earned from consolidated REITs before elimination at Group level
2. Mainly include general management fees, leasing commission, HR services, MIS, accounting and marketing fees
3. Includes acquisition/ divestment fees of S$36 M (1H 2021: S$2 M) mainly fees of S$26 M relate to the acquisition of DC properties in Europe, Office in Sydney, 3 BP properties in China by REITs,
1 BP property in Singapore and divestment fees of S$10 M for 3 BP properties by fund, lodging & retail by REITs 13Section 2: 1H 2021 Financial Highlights
Proactively Managing Our Capital Requirements
S$2.4B 0.70x 0.70x
In available debt headroom
S$2.4 bn
S$961M1
debt S$4.3 bn
headroom debt 505 Brannan Street, U.S. 510 Townsend Street, U.S.
headroom
Ascendas Reit’s inaugural US$150 million green interest rate
Total sustainable financing
raised YTD Jun 2021 swap (IRS) with Scotiabank (May 2021)
S$14.8B2
• The green IRS will be used to hedge an existing US$150 million green loan,
0.64x 0.52x
also with Scotiabank
Total Group cash balances and • The green IRS supports Ascendas Reit’s commitment to meet key green
targets by the swap maturity date:
available undrawn facilities of
CapitaLand’s treasury vehicles ➢ The two U.S. office properties, located at 505 Brannan Street and 510
Townsend Street in San Francisco, are to maintain their LEED®
3.6 years2
CL Group On On B/S Platinum (or equivalent) classifications
B/S (excl. REITs) ➢ To increase the total number of green certified properties within its
Debt maturity profile portfolio by a pre-determined figure and achieve a minimum
Net D/E Debt Headroom certification level3 for a target number of properties
a-iTrust
• Secured maiden S$100 million sustainability-linked five-year loan from UOB in
Notes: April 2021
1. Including Off B/S sustainable financing
2. As of 30 Jun 2021 ART
3. Includes BCA Green Mark GoldPlus or above, LEED® Gold or above; NABERS 5 stars or above; BREEAM Excellent or
above or any other Green Building label that is an equivalent standard and above • Secured a 5-year S$50 million green loan from DBS to finance lyf one-north
Singapore in Jan 2021
14Section 3
1H 2021 Strategy
Execution
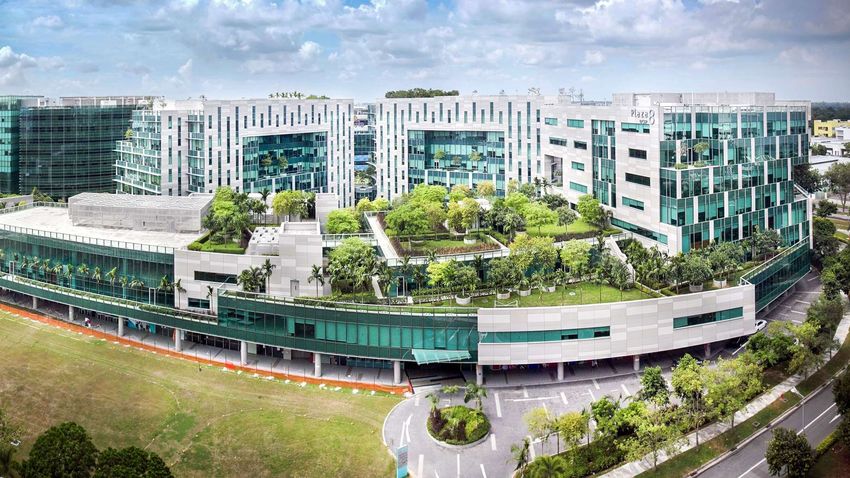
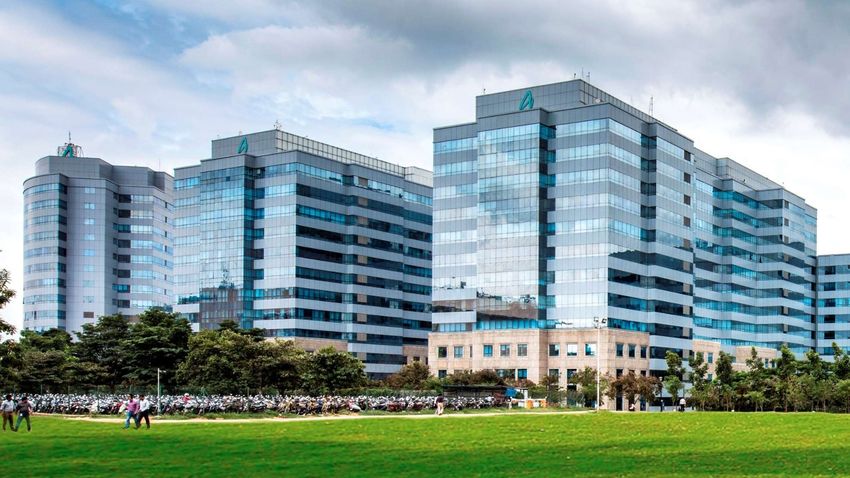
Plaza 8, Changi Business Park, SingaporeSection 3: 1H 2021 Strategy Execution
Disciplined and Focused Growth
Targeted growth in FUM and pipeline assets – S$3.6B total investments YTD 20211
YTD 2021 Transactions1
Announced Project
Sector Geography Strategy
Value (S$)2 Status
Data Centres
REAL ESTATE INVESTMENTS
◼ Acquisition of DC portfolio in Europe in March (Ascendas Reit) S$904.6M FUM Ex-Asia Core
◼ Acquisition of a hyperscale DC campus in Minhang, Shanghai in April S$757.7M Pipeline Asia Value-add
◼ Acquisition and development of prime site in Navi Mumbai, India into a DC
S$216.6M3 FUM Asia Opportunistic→Core
campus in July (a-iTrust)4
Logistics and Business Parks
◼ Acquisition of aVance 6, HITEC City in Hyderabad, India in March (a-iTrust) S$92.0M FUM Asia Core
New
◼ Forward purchase of an industrial facility at Mahindra World City in Chennai, India
Economy S$38.3M FUM Asia Opportunistic→Core
in March (a-iTrust)4
◼ Forward purchase of an IT Park at Hebbal, Bangalore in March (a-iTrust)4 S$268.2M FUM Asia Opportunistic→Core
◼ Acquisition of 75% stake in Galaxis, Singapore in May (Ascendas Reit) S$540.0M FUM Asia Core
◼ Acquisition of remaining 50% stake in Dalian Ascendas IT Park, China S$103.0M Pipeline Asia Opportunistic→Core
◼ Logistics development project in Japan in July S$90.8M(3) Pipeline Asia Opportunistic
◼ 72.4 acres of land at Farrukhnagar in National Capital Region, India in July (AILF) S$16.4M FUM Asia Opportunistic
PBSA
◼ Acquisition of an income-generating PBSA in Atlanta, Georgia, USA in February
S$129.7M FUM Ex-Asia Core
(ART)
◼ JV between The Ascott Limited and ART to develop a PBSA in Columbia, South
Longer-stay S$146.2M FUM/Pipeline Ex-Asia Opportunistic→Core
Carolina, USA in June
Lodging
Others
◼ Acquisition of 3 freehold rental housing properties in central Sapporo, Japan in
S$85.2M FUM Asia Core
June (ART)
◼ Acquisition of 2 turnkey lodging properties in France and Vietnam in June (ASRGF) S$210.0M FUM Asia/Ex-Asia Opportunistic
Notes:
(1) As at 12 Aug 2021
(2) Based on announced agreed property value (100% basis) or purchase/investment consideration where applicable
(3) Estimated total development cost
(4) Signed conditional Share Purchase agreements for acquisition of properties. Completion of acquisition is subject to fulfilment of certain Conditions Precedent. Figures indicated are estimated purchase considerations based on certain 16
pre-agreed formulaSection 3: 1H 2021 Strategy Execution
Continued Progress in Diversifying Portfolio with
New Economy Assets
Multiple Investments Across Business Park, Industrial and Logistics Sectors
Opportunistic
REAL ESTATE INVESTMENTS
>S$3B acquisition of
Total investments in partner’s stakes
new economy assets YTD1 Announced in July
• Increased stake from 50%
Dalian Ascendas IT Park, China to 100% in May for S$103M
>S$22.6B
RE AUM in Business Park, Second logistics facility in Japan
Industrial and Logistics2 segment
Close to S$400M of
as at 30 June 2021 investments
Acquisition of a freehold site announced YTD by
(vs. c. S$20.2B in 1H 2020) in Ibaraki City, Osaka, Japan Ascendas India Trust
to develop a modern logistics aVance 6, HITEC City in Hyderabad (a-iTrust)
Comprising c.16% facility
Announced in July Ascendas India Logistics Fund
• Acquired aVance 6, HITEC
City in Hyderabad, India at
of the Group’s total RE AUM S$92.0M (February)
• Investment amount: ~JPY 7.5B (S$90.8M3) Announced in July
Deployed S$16.4M to invest in 72.4 • Construction
(vs c.15% in 1H 2020) • Redeployment of capital into new economy funding/forward purchase of
after full exit from Japan retail sector acres of land at Farrukhnagar in
National Capital Region, India Industrial facility at Mahindra
• Acquired the site from Mitsui & Co, as part of World City in Chennai, India
ongoing collaboration to develop and at S$38.3M (March)
Ascendas Reit • Construction
Notes: operate best-in-class logistics projects in Japan Announced in May
1. As of 12 August 2021 funding/forward purchase of
2. Includes data centre • Expected completion in 3Q 2023 Acquired CapitaLand’s 75% stake in
3. Based on exchange rate of JPY 1 to 1.65 million sq ft of an IT Park
S$0.01218 Galaxis at S$540.0M at Hebbal in Bangalore, India
at S$268.2M (March) 17Section 3: 1H 2021 Strategy Execution
Continued Progress in Diversifying Portfolio with
New Economy Assets (Cont’d)
A Significant Leap in Data Centre (DC) Investments Across the Group
Maiden DC Investment for a-iTrust in Airoli, a
REAL ESTATE INVESTMENTS
S$1.9B of S$3B of new growing DC hub in Navi Mumbai
economy investments Announced in July
• Phase I development of a 6.6-acre greenfield site into a fully-
YTD1 were in data centre fitted data centre campus
assets: • Phase I development comprising the first building with built-up
area of about 325,000 sqft is expected to be completed by 2Q
2024
• Will be one of the largest DC campuses in Airoli
1➢ CapitaLand Artist impression of the Data Centre • To target global technology giants, cloud service providers, and
at Navi Mumbai, India
c.$757.7M (RMB3.66B) large domestic enterprises as tenants
2➢ Ascendas Reit Hyperscale DC Campus Acquisition of a
S$904.6M Acquisition in Minhang, Portfolio of 11 DCs
3➢ a-iTrust Shanghai (China) across Europe by
c.S$216.6 M1 (INR 12B)
Announced in April Ascendas Reit
• Fully-fitted campus consists of four Announced in March
buildings with a GFA of up to 75,000 • Well-located in Tier 1 cities
sqm and IT power capacity of up to such as London in UK,
Aerial view of DC campus in 55 megawatts
Minhang
Amsterdam in Netherlands,
• Gain immediate scale in a single Paris in France and Geneva in
transaction Switzerland
• Rental upside opportunity to • A further diversification of
complement current operational Ascendas Reit’s international
Notes: capability, with Building 3 ramp up portfolio
1. On a 100% basis
2. Estimated total development cost based on exchange
and Building 4 to be fitted out with
rate of SGD 1 to INR 55.0 M&E system. 18Section 3: 1H 2021 Strategy Execution
Positioning CapitaLand Lodging for Post
COVID-19 Demand
Entry into resilient longer-stay segments of Purpose-Built Student Accommodation (PBSA) and continued build
up of private rental product offerings → Close to S$600M invested YTD 20211
REAL ESTATE INVESTMENTS
PBSA in USA Rental Housing in Japan
• Resilient lodging asset class
• Located in catchments of central business
• Pre-leasing rates are near pre-pandemic districts or universities.
levels
• Long leases of typically two years
• Full re-opening of all universities in USA, wider
• Greater visibility and stability in future
distribution of vaccines, and lifting of travel ART’s rental housing
acquisitions in Sapporo, cashflows
Student accommodation restrictions for international students expected
development in South Japan
Carolina, USA to further spur demand
ART acquired 3 Expansion of lyf Somerset
coliving brand Metropolitan
Joint development between Ascott and Acquisition of freehold rental
into France West Hanoi
ART on a US$109.9M2 (S$146.2M) student Paloma West housing properties in
accommodation property in South Midtown3 Sapporo, Japan for
Carolina, USA Announced in January
JPY 6.78B (S$85.2M)
Announced in June • ART’s first student
Announced in June livelyfhere Gambetta Somerset Metropolitan
• 678-bed / 247-unit property accommodation
• Total of 411 units Paris West Hanoi
• Ascott and ART to each invest in a 45% acquisition at US$97.5M
(~S$129.7M) • Adds to ART’s 11 rental Invested through Ascott Serviced
• Ascott has separately formed a partnership to develop housing properties in
more student accommodation properties in the USA • Largely domestic Residence Global Fund at c.S$210M
Japan which have an
student base with >95%
Note:
average occupancy rate • To add 503 units to ASRGF’s portfolio
1. As of 12 Aug 2021 high occupancy, 1-year
2. Comprises Ascott’s and ART’s investment in the initial 90% stake, of >90% • Acquired on a turnkey basis and expected
estimated costs of the additional 10% which Ascott and ART will
average length of stay
acquire at fair market valuation and other deal-related and fully pre-leased for
to open in 2024
expenses 19
3. Previously known as Signature West Midtown
Fall 2021Section 3: 1H 2021 Strategy Execution
Remaining Steadfast to S$3B1 Capital Recycling Target
Gross divestments exceeding S$11.2B YTD2 compensated for lower capital recycling in FY 2020
Converting / Retaining FUM Entered into an agreement to divest
partial stakes in six Raffles City (RC)
Divested remaining 75% stake in
developments in China for RMB46.7B
REAL ESTATE INVESTMENTS
Galaxis in Singapore to Ascendas
(~S$9.6B)
REIT Announced in June
Completed in July • Achieved 6.7% premium to valuation
• Transacted above valuation at S$720M (100% basis)
• >S$2B of net proceeds3 to be unlocked
• Registered net gains of ~S$75M Raffles City Ningbo, China
• Reduced sponsor stakes to 12.6%-30.0% across the 6 RC
assets
• CapitaLand remains as asset manager
Divested ICON Cheonggye in
Seoul, South Korea
Completed in January
• Net gains of ~S$33M4 Raffles City Changning, China
Galaxis, Singapore • CapitaLand remains as fund and asset
manager
Divested two mature malls in Japan for JPY 42bn (~S$520M)
Non-core Divestment Announced in July
• Achieved net portfolio gain of ~S$109M, 30% premium to valuation
• Successfully exited from non-core retail sector in Japan
Notes:
1. Annual target
2. As of 12 August 2021
3. Proceeds and NAV uplift due to the divestment ~S$466.7M of total divestments attributed to the Group’s listed trusts
will be captured under CLI
4. Based on effective stake of 98.8%
20Section 3: 1H 2021 Strategy Execution
Fund Management FRE Growth Comparable to
Pre-COVID Levels
• Approximately 29% YoY increase in 1H 2021 FRE, driven by REITs’ higher (1) transactional activities and fee following improved
market sentiments; (2) base fee and performance fee
• Over S$5B or 6.9% growth in FUM since 31 December 2020, led by acquisitions by both listed and unlisted vehicles
• Raised S$6.4B4 of committed equity from external parties year to date through funds and co-investment arrangements
2021 YTD Gross Investments5
Fee Income1 by Quarter FUM by Geography and
FUND MANAGEMENT
(S$’M) S$2,347.7 M
Equity Sources (S$’B) FUM by Year (S$’B) By Listed Reits & Business
Trusts
Q4
Q3 34.8 PE Funds S$226.4 M
293.2 306.2 1.9 6.9%
Q2 REITs & BTs By Private Funds
225.8 28.1
88.7 Q1
104.7
188.7 20.1 Total ~72% of investments
57.9
71.1 3.1
22.7 groupwide YTD comprise
64.5 86.8 88.9 32.9 100.0 immediate FUM
69.9 73.7 77.6 83.0
56.8 52.1 17.0
99.8 FUM Pipeline5
49.6 76.5 5.4 28%
46.6 72%
2 3
FY 2018 FY 2019 FY 2020 YTD Jun 21 China Singapore Others 2019 2020 YTD Jun 2024
2021 Target YTD
Groupwide
Investments
Notes: ~S$3.6B
1. Includes fee-based revenue earned from consolidated REITs before elimination at Group level
2. Includes contribution from ASB for the period from 1 Jul to 31 Dec 2019
3. Others include Malaysia, Vietnam, other Asia, Europe and USA
4. Includes S$5.9bn new equity from Ping An Life Insurance for partial stakes in six Raffles City developments in China as announced on 28 June 2021
5. As of 12 August 2021 21
6. On balance sheet assets which are not currently earning FRE and contributing to potential pipeline for CapitaLand listed and unlisted fund vehiclesSection 3: 1H 2021 Strategy Execution
Stepping Up on Private Fund Platform Growth
Three new funds totaling c.S$800 million of new equity raised from external parties YTD 2021
Second Korea DC Fund Second India Logistics Private Fund
Incepted in May Launched in July
• Korea Data Centre Fund 2 (KDCF 2) is • CapitaLand India Logistics Fund II of
CapitaLand’s second private fund with 100% S$400M (INR22.5B) will invest in the
third-party capital to invest in an off-market development of logistics assets in key
data centre development near Seoul. warehousing and manufacturing hubs in six
major cities - Ahmedabad, Bangalore,
• Follows KDCF 1 which was incepted in October Chennai, Mumbai, NCR and Pune, as well
2020. as in emerging markets such as
FUND MANAGEMENT
Coimbatore and Guwahati.
• CapitaLand is the fund and asset manager.
• Follows the success of Ascendas India
• AUM upon completion expected to be around Logistics Programme to tap on the rising
KRW 337bn (~S$402m2). demand for high quality logistics space. Ascendas-Firstspace Chennai, Oragadam
under Ascendas India Logistics Programme
First Mezzanine Financing Targeting New Opportunities as CapitaLand
Venture Fund successfully registers as PE fund manager in
Incepted in July
• HKD 1.150B (SG$199M) mezzanine financing
China
venture, backed by a premium residential As announced in June
development project in Hong Kong.
• CapitaLand can now conduct RMB-denominated capital raising and provide fund
• Attracted capital commitments from new management services for domestic capital partners in China.
client relationships from Europe and US.
• Enhances CapitaLand’s capability to forge new capital partnerships with China’s
• The financing was completed within three domestic institutional investors.
weeks post securing the highly competitive
mandate. • Facilitates access to China’s financial markets to grow FUM FRE.
22Section 3: 1H 2021 Strategy Execution
Growing Lodging FRE Amidst COVID-19
Fourth consecutive year of lodging management contracts growth at approx. 20% CAGR since 2017
✓ 40% year-on-year growth in new signings compared to the
same period in 2020
• Over 8,300 units across more than 30 properties signed YTD1
✓ Boosted by record signings of over 2,800 new units in Vietnam,
exceeding full-year signings in previous years
• Ascott to manage the largest serviced residence development in Hanoi, Vietnam, which
will feature 3 of Ascott’s lodging brands; the development is expected to comprise over
1,900 units and open in phases from 2022
Façade of Somerset Feliz Ho Chi Minh City,
which opened in July 2021 • Other signings in Vietnam include another Citadines property in Hanoi and 2 properties,
for the first time, in Lào Cai
✓ Continued rapid expansion in China with over 2,900 units signed
LODGING
✓ Fee income expected to increase as units in the pipeline turn
operational
• Opened over 3,000 units in 13 properties year-to-date1 and expect to open c.50% more
units YoY
Living room of Ascott ICC Guangzhou,
which opened in June 2021
• S$20–25M of fees to be earned for every 10,000 stabilised serviced residence units
Note: 23
1. For the first 7 months of 2021Section 4
1H 2021 Operational
Highlights
Funan, SingaporeSection 4: 1H 2021 Operational Highlights
Residential Trading Performance
Tracking well with COVID-19 recovery
SINGAPORE CHINA VIETNAM
▪ Total sales value and number of units ▪ Sales Performance ▪ Achieved 80% of 1H 2021
sold in 1H 2021 were close to 6 times ➢ 2,625 units sold1 in 1H 2021, +48.4% Handover Plan of 177
of 1H 2020 YoY (1H 2020: 1,769 units) units.
▪ Launched projects continued to be ➢ Sales value2 at RMB8,007 M ▪ Handover pipeline
well-received with 90% of launched exceeded same period last year by comprising 554 units with
units sold for One Pearl Bank and 43.3% (1H 2020: RMB5,588 M) a value of S$193M4
94% of launched units sold for expected to be handed
Sengkang Grand Residences ▪ Handover Performance over from 3Q 2021
➢ 1,453 units handed over1 in 1H 2021, onwards.
▪ CanningHill Piers is targeted to be
launched in 2H 2021 2.2 times YoY (1H 2020: 652 units) ▪ No new launches
➢ Achieved RMB4,946 M of handover scheduled in 1H 2021. Two
value2, 3.1 times YoY (1H 2020: projects are targeted to
RMB1,595 M) be launched in 2H 2021.
▪ A total of ~6,700 units sold1 with a value of
~RMB14.1 bn3 expected to be handed
over from 3Q 2021 onwards
In the vicinity of CanningHill Piers - Aerial view of Clarke Quay and
Singapore River
Notes:
1. Above data is on a 100% basis, including strata units in integrated developments and considers only projects being managed
2. Value includes carpark and commercial, Sales value further includes value added tax
3. Units sold include options issued as of 30 Jun 2021. Value refers to value of residential units sold including value added tax 25
4. Value excludes value added tax and impact due to significant financing component for certain payment schemes under accounting principles IFRS 15Section 4: 1H 2021 Operational Highlights
Retail Performance
Healthy YoY recovery underpins shoppers’ keenness to return; occasional setbacks caused
by COVID-19 resurgence
Shopper Traffic1 (YoY) Tenants’ Sales1,2 (YoY)
Singapore
China 48.7%
Malaysia 34.6%
11.7%
2.8%
-3.6%
-10.8%
1Q 2020 2Q 2020 3Q 2020 4Q 2020 1Q 2021 2Q2021 -4.2% -19.0% 3Q -15.0%
1Q 2020 2Q 2020 2020 4Q 2020 1Q 2021 2Q 2021
-42.4% -11.8% -19.1% -17.0% -13.8%
-38.0% -12.7%
-20.9% -31.0% -17.6%
-42.4% -34.0%
-40.1%
-32.0% -42.0% -22.0%
-51.0% -45.0% -41.0% -42.7% Committed
-45.4% -57.0% occupancy rate (%)3
China Singapore Malaysia
97.1
• Strong YoY rebound in 1H 2021 as • Recovery on track but interrupted • Downward pressure from Malaysia’s
operating conditions largely normalise by new restrictions (Phase 2 continued nationwide movement
(Heightened Alert)) in 2Q 2021. control order (MCO), both shopper 91.9
• Downtrend in 2Q 2021 largely attributed
traffic and tenants’ sales have
to recurrence of COVID-19 cases in • Tenant sales exceeding shopper
been impacted in 2Q 2021
Guangdong province and some cities traffic partly due to higher value
including Beijing sales and digitalisation efforts • Rental reversions have remained 86.0
contributing to online sales largely muted in 2Q 2021 against
• Precautionary measures in place
1Q 2021
according to guidelines from respective • Over 150 new store openings in 1H
cities’ authorities. 2021
• ~82% of retail leases expiring in 2021
China Singapore Malaysia
renewed and issued with lease
agreements
Notes:
1. Quarters stated in the chart vs their respective quarters in the previous years
2. Change in tenants’ sales per sqm (for China) and sq ft (for Singapore and Malaysia)
26
3. As of 30 Jun 2021Section 4: 1H 2021 Operational Highlights
Workspace Performance
Committed occupancy1 for offices, business parks, industrial and logistics continued to
be resilient, with improvements registered across several markets
Offices
• Average rental reversions mostly positive across the portfolio in 1H 2021 Committed occupancy rate (%)1
• Maintained stable weighted average lease expiry across our key workspace markets 96.8 95.5
through proactive tenant engagements 93.9
90.4
Updates on on-going workspace projects 85
Six Battery Road, Singapore
• CapitaSpring on track to • Expected completion in end 2021 China Singapore Japan
2
complete in 4Q 2021 • Leasing in tandem with phased South Korea Germany
• 61.8% committed works
occupancy with another • Maintained BCA Green Mark Business Spaces, Industrial & Logistics
15% under advance Platinum Committed occupancy rate (%)1
negotiation as of 22 July
98.2
2021 21 Collyer Quay, Singapore 95.8
CapitaSpring • 7-Year lease to WeWork targeted to 92.8
commence in late 2021 90.9
88.1 87.9
• Achieved BCA Green Mark
Completion Platinum
• Grab Headquarters handed China Singapore Australia 3
over in July 2021 Europe
4
USA
5
India
• AEIs for 21 Changi South Ave 2 Notes:
in Singapore and 100 & 108 1. As of 30 Jun 2021
2. Refers to Singapore Grade A office buildings only, including 79 Robinson Road
Wickham Street in Australia Grab Headquarters, Singapore 3. Refers to the 31 logistics properties and 5 suburban office properties owned by Ascendas Reit
4. Refers to the 38 logistics properties and 11 data centres owned by Ascendas Reit
completed in April 2021 5. Refers to the 28 business park properties and 2 office properties owned by Ascendas Reit
27Section 4: 1H 2021 Operational Highlights
Lodging Performance
Broad-based sequential improvement across markets ⚫ Operating platform maintains positive cashflow
• >3,000 units turned operational YTD 20211, bringing the total
• RevPAU +9% QoQ operational units to 71,901
Singapore • Supported by government contracts, staycations and
bookings by those affected by border closure • >8,300 new units secured via management contracts
YTD 20211
• RevPAU +6% QoQ
SE Asia & • On track to meet 2023 target of 160K units under
• Led by stronger demand in Australia despite snap lockdowns;
Australasia improvement also in Indonesia and Philippines management with currently c.129K units under
management
• RevPAU +22% QoQ
China • Significant pick-up in recovery momentum due to higher Overall 2Q 2021 RevPAU
demand in both corporate and leisure segments increased by 53% YoY and 19% QoQ
Revenue per Available Unit (RevPAU) S$
• RevPAU +4% QoQ
North Asia • Sequential improvement mainly driven by a pick-up in leisure 99
105
demand in South Korea 89 91 53%
62 66
• RevPAU +44% QoQ 54
47 43
41
• Easing of restrictions across Europe, supported by higher 32
40 34
vaccination rates
Europe • Stronger performance due to higher leisure demand during
12
the summer holidays, coupled with resilience from long stays,
Singapore SE Asia & China North Asia Europe Gulf Region & Total
corporate and other group bookings Australia (ex China) India
(ex S'pore)
2Q 2020 2Q 2021
• RevPAU +19% QoQ
Gulf Region
• Higher demand following easing of restrictions in Middle East Note:
& India • Long stays continued to provide a stable occupancy base RevPAU statistics are on same store basis and include serviced residences leased and
managed by the Group. Foreign currencies are converted to SGD at average rates for
Note: the relevant period
1. For the first 7 months of 2021 28Section 4: 1H 2021 Operational Highlights
Conclusion
• The Group registered an improved operating and financial performance in 1H
2021, compared to the second half of 2020, as the global economy emerged
from the extraordinary challenges posed by COVID-19 in 2020.
• Notwithstanding this, given the unpredictability of the COVID-19 virus, as well as
the varied progress of inoculation globally, the pace of recovery across the
Group’s geographies and sectors is expected to remain uneven.
• Following the strong endorsement from CapitaLand Shareholders, the Group
expects to complete its strategic restructuring in or around mid-September 2021.
29Section 5
Supplementary Slides
Singapore Science ParkSection 5: Supplementary Slides
Overall Diversified Portfolio Remained Resilient
Diversified businesses kept concentration risks low ⚫ Offers opportunities for growth
AUM1: S$138.7 Billion Total Assets: S$82.7 Billion Total EBIT: S$2,165.7 Million
Other Other Emerging
Other Other Emerging
Other Emerging Developed Markets5 Other Developed
Developed Markets5
Markets5 Markets2 Markets2
Markets2 6% 14% 3% 13%
8%
18%
By
Geography 37%
Singapore
42% China4 52% 32%
32% 43%
China4
China4 Singapore Singapore3
Residential, Corporate Residential, Business Park,
Business Park, Commercial Strata & Business Park, & Others Commercial Strata Industrial & Residential,
Industrial & Urban Development Industrial & & Urban Logistics7 Commercial Strata
Logistics7 2% Development & Urban
Logistics7 10% 14%
17% 7% 13% Development
21%
By Lodging6
Retail Lodging6 16% 9%
Asset Class 26%
28% 33%
Lodging6
Retail 22%
22% Office 25% 35%
Office Retail
Office
Notes: All figures are as of 30 Jun 2021 unless otherwise stated
1. Refers to the total value of real estate managed by CapitaLand Group entities stated at 100% of property 4. Includes Hong Kong
carrying value 5. Excludes China
2. Excludes Singapore and Hong Kong 6. Includes multifamily and hotels
3. Includes corporate & others 7. Includes data centres 31Section 5: Supplementary Slides
1H 2021 EBIT* Analysis
Diversified portfolio behind portfolio resilience
Geography @ 1H 2021: S$2,166 M Asset Class @ 1H 2021: S$2,166 M
S$’M
S$’M
800 57%
1200 164% 1H 2020
700 1H 2021
1000 1H 2020
600
1H 2021
148% 63%
800 24% 500
400 90%
600 753
1110
NM
300
400 480 470
710 179% 451 197
200
574 318
200 420 13% 289 NM
285 100 182
70 61 32 167
102 16 -23
0 0
Singapore China Other Developed Other Emerging Resi, Comm Retail Office Lodging Biz Park, Ind Corp &
Markets 3 Markets2 -100 Strata & & Log Others
Urban Dev
Notes:
* Total EBIT for 1H 2020 and 1H 2021 excludes FV losses and impairment of $569.9M and $0.4M respectively.
1 China including Hong Kong
2 Excludes China
3 Excludes Singapore & Hong Kong
4 Includes Hotel
5 Includes Data Centre
32Section 5: Supplementary Slides
Strong Balance Sheet & Liquidity Position
Leverage Ratios
Coverage Ratio
Net Debt / Equity Net Debt / Total Assets1 Interest Coverage Ratio2
0.64x 0.33x 2.8x
0.68x in FY 2020 0.35x in FY 2020 0.7x in FY 2020
% of Fixed Rate Debt Ave Debt Maturity3 NTA Per Share NAV Per Share
63% 3.6 Years S$4.22 S$4.42
63% in FY 2020 3.5 years in FY 2020 S$4.09 in FY 2020 S$4.30 in FY 2020
Notes:
1. Total assets exclude cash
2. On a run rate basis. Interest Coverage Ratio = EBITDA/ Net Interest Expenses; EBITDA includes revaluation gain/(loss) and impairments. ICR excluding unrealised revaluation loss and impairment is 5.8x
(FY 2020: 4.8x)
3. Based on put dates of convertible bond holders
33Section 5: Supplementary Slides
Prudent Management Of Look-Through Debt
(As at 30 Jun 2021)
On Balance Sheet Off Balance Sheet
Net Debt (1) /Equity
0.64 0.60 (4) 0.65
0.52 0.56
0.43
CL Group On B/S On B/S (excl. REITs) (2) REITs (3) JVs/Associates (5) (6) Funds Off B/S REITs (7)
Net Debt (1) /Total Assets (8)
0.33 0.36 0.37
0.29 (4) 0.30
0.23
(3) (5)
CL Group On B/S On B/S (excl. REITs) (2) REITs JVs/Associates Funds Off B/S REITs (7)
Well-managed balance sheet
Notes:
1. Debt includes Lease Liabilities and Finance Lease under SFRS (I)16. (On B/S : S$1,050M , Off B/S : S$613M)
2. Proforma without SFRS (I)10 (excludes REITs Net Debt, includes CL’s share of REITs Equity)
3. The Group consolidated Ascott Residence Trust (ART), CapitaLand Integrated Commercial Trust (CICT), CapitaLand Malaysia Mall Trust (CMMT) and CapitaLand China Trust (CLCT) under SFRS (I)10.
4. 67% of the debt in JVs/Associates is from ION Orchard, Jewel Changi Airport, Datansha (Guangzhou, China), Raffles City Changning (Shanghai, China) and Hongkou Plaza (Shanghai, China).
5. JVs/Associates exclude investments in Lai Fung Holdings Limited.
6. JVs/Associates’ equity includes shareholders’ loans.
7. Off B/S REITs refer to i) Ascendas Reit and ii) Ascendas India Trust.
8. Total assets exclude cash.
34Section 5: Supplementary Slides
Well-Managed Maturity Profile of 3.6 Years
Plans in Place for Refinancing / Repayment of Debt1 Due In 2021
S$B Total Group cash
16.0 balances and available
undrawn facilities of
14.0
CapitaLand's treasury
12.0 vehicles:
10.0
8.0 6.9
~S$14.8 billion
5.9 5.8
6.0
3.6 3.3
4.0
1.8 2.0
1.4 1.2
2.0
1.5
0.0 0.3
2021 2022 2023 2024 2025 2026 2027 2028 2029+
On balance sheet debt 1 due in 2021 S$’ billion
Total
To be refinanced 1.2 Non-REIT level debt
To be repaid 0.6 REIT level debt
(2)
Total 1.8
As a % of total on balance sheet debt 6%
Well-equipped with ~S$14.8 billion in cash and available undrawn facilities
Notes:
1. Debt excludes S$1,050 million of Lease Liabilities and Finance Lease under SFRS(I)16
2. Ascott Residence Trust (ART), CapitaLand Integrated Commercial Trust (CICT), CapitaLand Malaysia Mall Trust (CMMT) and CapitaLand China Trust (CLCT) 35Section 5: Supplementary Slides
Disciplined Interest Cost Management
%
5.0
4.0
3.7
3.5
3.4
3.3 3.2
3.2 3.2
3.0
3.0
2.8
Implied Interest Rate
2.0
1.0
2 3
FY 2013 FY 2014 FY 2015 FY 2016 FY 2017 FY 2018 FY 2019 FY 2020 YTD Jun 2021
(Restated)
Implied interest rates 1 kept low at 2.8%
Notes:
1. Implied interest rate for all currencies = Finance costs before capitalisation/Average debt
2. Implied interest rate for all currencies before restatement was 4.2%
3. Straight annualisation 36Section 5: Supplementary Slides
YTD Investments Reached S$3.6 billion
YTD Investments1,2
Value
Transacted Investments Entity (Buyer)
S$ million
1.65 million sq ft of an IT Park at Hebbal in Bangalore, India3 268.2 a-iTrust
aVance 6, HITEC City in Hyderabad, India 92.0 a-iTrust
Industrial facility at Mahindra World City in Chennai, India3 38.3 a-iTrust
Phase 1 of Data Centre campus in Navi Mumbai, India (Development)4 216.6 a-iTrust
72.4 acres of land at Farrukhnagar in National Capital Region, India 16.4 Ascendas India Logistics Fund
Paloma West Midtown (formerly Signature West Midtown) in Atlanta, USA 129.7 ART
Three rental housing properties in central Sapporo, Japan 85.2 ART
Student Accommodation Property in South Carolina, USA (Development) 146.25 ART and Ascott
A Portfolio of 11 Data Centres in Europe 904.6 Ascendas Reit
75% stake in Galaxis in Singapore 540.0 Ascendas Reit
livelyfhere Gambetta Paris in France and Somerset Metropolitan West Hanoi in Vietnam 210.0 Ascott Serviced Residence Global Fund
Data centre campus in Shanghai, China 757.7 CapitaLand
Increase from 50% to 100% stake in Dalian Ascendas IT Park, China 103.0 CapitaLand
A logistics facility in Osaka, Japan 90.8 CapitaLand
Total Gross Investment Value6 3,598.7
Total Effective Investment Value7 1,591.3
Notes:
1. Announced transactions from 1 January to 12 August 2021
2. The table includes assets acquired by CapitaLand and CapitaLand REITs/Business Trusts/Funds
3. Signed conditional Share Purchase agreements for acquisition of properties. Completion of acquisition is subject to fulfilment of certain Conditions Precedent. Figures indicated are estimated purchase considerations based on certain pre-agreed formula
4. Estimated total development cost
5. Comprises Ascott’s and ART’s investment in the initial 90% stake, estimated costs of the additional 10% which Ascott and ART will acquire at fair market valuation and other deal-related expenses
6.
7.
Investment values based on agreed property value (100% basis) or purchase/investment consideration
Based on effective stake acquired
37Section 5: Supplementary Slides
YTD Capital Recycling On Track
YTD Divestments/Transfers1,2
Value
Transacted Divestments Entity (Seller)
S$ million
Citadines City Centre Grenoble, France 13.0 ART
Somerset Xu Hui Shanghai, China 215.6 ART
11 Changi North Way in Singapore 16.0 Ascendas Reit
82 Noosa Street and 62 Stradbroke Street in Brisbane, Australia 104.5 Ascendas Reit
1314 Ferntree Gully Road in Melbourne, Australia 24.2 Ascendas Reit
34.57 acres of land in OneHub Chennai, India 10.0 CapitaLand
ICON Cheonggye in Seoul, South Korea 166.43 CapitaLand
75% stake in Galaxis in Singapore 540.0 CapitaLand
Partial stakes in six Raffles City China developments 9,565.1 CapitaLand
Olinas Mall and Seiyu & Sundrug Higashimatsuyama, Greater Tokyo in Japan 520.0 CapitaLand
CapitaMall Minzhongleyuan in Wuhan, China 93.4 CLCT
Total Gross Divestment Value4 11,268.2
Total Effective Divestment Value5 3,344.0
Notes:
1. Announced transactions from 1 January to 12 August 2021
2. The table includes assets divested/transferred by CapitaLand and CapitaLand REITs/Business Trusts/Funds
3. Property value based on an as-is development-in-progress basis
4.
5.
Divestment/transfer values based on agreed property value (100% basis) or sales consideration
Based on effective stake divested
38Section 5: Supplementary Slides
Financial Performance For 1H 2021
S$' M 1H 2020 1H 2021 Change
Revenue 2,027.4 2,730.0 34.7%
EBIT 596.8 2,165.7 262.9%
PATMI 96.6 922.2 854.5%
Operating PATMI 261.2 433.6 66.0%
Portfolio Gains 9.3 489.0 NM
Revaluation Gains/(Loss) and
(173.9) (0.4) (99.8)%
Impairments
39Section 5: Supplementary Slides
EBIT By SBU – 1H 2021
S$' M Operating Portfolio Revaluation Total
EBIT gains/realised (losses)/ EBIT
FV gains impairments
1
CL Singapore & International 711.9 231.5 - 943.4
2
CL China 744.8 215.1 - 959.9
CL India 20.3 0.9 (0.1) 21.1
CL Lodging 15.3 154.3 - 169.6
CL Financial 121.2 - (0.3) 120.9
3
Corporate and others (49.9) 0.7 - (49.2)
Total 1,563.6 602.5 (0.4) 2,165.7
Notes:
1. Includes Malaysia, Indonesia and Vietnam
2. Includes Hong Kong 40
3. Includes intercompany eliminationSection 5: Supplementary Slides
EBIT By Asset Class – 1H 2021
S$' M Operating Portfolio Revaluation Total
EBIT gains / (losses)/ EBIT
realised FV impairments
gains
Residential, Commercial Strata & Urban
450.3 - - 450.3
Development
Retail 564.8 187.8 - 752.6
Office 293.3 176.7 (0.3) 469.7
1
Lodging 52.7 144.4 - 197.1
2
Business Park, Industrial & Logistics 224.6 93.0 (0.1) 317.5
3
Corporate and others (22.1) 0.6 - (21.5)
Total 1,563.6 602.5 (0.4) 2,165.7
Notes:
1. Includes hotel. The results for Lodging asset class is different from CL Lodging SBU as it includes the results of lodging component in integrated developments as well as U.S. multifamily
portfolio presented under other SBUs
2. Includes data centre
41
3. Includes intercompany elimination and expenses at SBU CorporateCapitaLand
Singapore and
International
One Pearl Bank, SingaporeSection 5: Supplementary Slides
Singapore And International Asset Portfolio
S$38.4 billion corresponding to 46% of Group’s total assets
International
8% International
Vietnam 25%
By Geography
3%
Total EBIT1,3:
Singapore,
Total Assets1,2: Malaysia &
S$943.4 Million Singapore,
Vietnam
S$38.4 Billion Indonesia 2%
Malaysia &
89% Indonesia
73%
Residential, Total EBIT1,3: 433.6
Others4 Commercial Strata & S$943.4 Million
Business Park, 4% Urban Development
Industrial &
6%
294.4
By Asset Class
Logistics5
12%
178.7
Total Assets1,2:
S$38.4 Billion Retail
39%
15.7 21.0
Office
Residential, Retail Office Business Park, Others 4
39%
Commercial Industrial &
Notes: Strata & Urban Logistics 5
1. Includes Singapore, Malaysia, Indonesia, Vietnam and International
2. Total assets as of 30 Jun 2021
Development
3. Total EBIT YTD Jun 2021
4. Include serviced residence component in integrated development projects such as CapitaSpring in Singapore, The Stature in Jakarta, Indonesia, The Vista in Vietnam and multifamily assets in International as well as Corporate & others
5. Include data centre 43Section 5: Supplementary Slides
Singapore, Malaysia & Indonesia Asset Portfolio
S$34.2 billion corresponding to 41% of Group’s total assets
Others4 Residential, Commercial
Business Park, Industrial & 1% Strata & Urban Total EBIT1,3: S$685.4 Million
Logistics5 Development
12% 5%
313.4
206.3
Total Assets1,2: 169.3
S$34.2 Billion
Retail
42% 0.2
Office
40%
(3.8)
Residential, Retail Office Business Park, Others 4
Commercial Industrial &
Strata & Urban Logistics 5
Development
Notes:
1. Includes Singapore, Malaysia and Indonesia
2. Total assets as of 30 Jun 2021
3. Total EBIT YTD Jun 2021
4. Include serviced residence component in integrated development projects such as CapitaSpring in Singapore and The Stature in Jakarta, Indonesia
5. Include data centre 44Section 5: Supplementary Slides
Singapore Residential Sales
• Sold 197 units worth S$330 million1 in 1H 2021
• ~ 92% of launched units sold as of 30 June 2021
1H 2021: ~5.6x YoY 1H 2021: ~5.5x YoY
350
250
Sales Value (S$ million)
300
200
Residential Units
250
150 200
330
150
100 197
100
50
50
35 60
0 0
1H 2020 1H 2021 1H 2020 1H 2021
Note:
1. Units sold and sales value are based on options issued accounted for aborted units 45Section 5: Supplementary Slides
Singapore, Malaysia & Indonesia Residential
Projects
Sales Status as of 30 Jun 20211,2
Units sold % of Launched units sold Average selling
Project Total units Units launched
as of 30 Jun 2021 as of 30 Jun 2021 price $ psf 3
Singapore
One Pearl Bank 774 500 449 90% S$2,401 psf
Sengkang Grand
680 480 453 94% S$1,721 psf
Residences
Malaysia
genKL 332 332 310 93% RM697 psf
Park Regent 505 505 465 92% RM1,040 psf
Indonesia
Stature Residences 96 96 43 45% IDR4.7M psf
Notes:
1. Figures might not correspond with income recognition
2. Sales figures of respective projects are based on options issued / bookings made
3. Average selling price (local currency psf) is derived using cumulative sales value achieved and area (based on options issued / bookings made) 46Section 5: Supplementary Slides
Singapore & Malaysia Retail
Portfolio1 Singapore Malaysia
No. of operating malls as of 30 Jun 2021 19 7
Change in Change in
NPI yield on Committed Change in
NPI6 (million) Shopper Tenants’ sales
valuation4 occupancy rate5 NPI6 (100%)
Same-mall2,3 traffic (per sqft)
As of
1H 2021 Curr 1H 2021 1H 2020 1H 2021 vs 1H 2020
30 Jun 2021
Singapore 4.7% 97.1% SGD 414 368 +12.5% +2.8% +11.7%
Malaysia 3.0% 86.0% MYR 80.1 92.1 -13.0% -12.7% -3.6%
Notes:
1. Portfolio includes properties that are operational as of 30 Jun 2021 and include properties managed by CapitaLand Group
2. Includes the retail components of integrated developments and properties owned by CapitaLand Group
3. Same-mall compares the performance of the same set of property components opened/acquired prior to 1 Jan 2020
4. NPI yield on valuation is based on valuations as of 31 Dec 2020
5. Committed occupancy rates as of 30 Jun 2021 for retail components only
6. Figures are on 100% basis, with the NPI of each property taken in its entirety regardless of CapitaLand’s effective interest. This analysis compares the performance of the same set of property
components opened/acquired prior to 1 Jan 2020. An integrated development is regarded as a single asset and NPI consists of all the components present in an integrated development
47Section 5: Supplementary Slides
Over 150 store openings in 1H2021
Refreshing trade mix across Singapore malls despite challenging market conditions
Sen-Ryo at ION Orchard Wonderful Bapsang at IMM
Luke Lobster at Jewel Elemis London at ION & Raffles City Clippers Barber at JCube
New to Market Japanese First concept in Singapore with
Second store in Singapore New to market beauty brand Refreshing our services offering
dining with a Sake Bar blend of food mart and food street
Tesla’s First Singapore
Showroom at Raffles City
Tesla opened its showroom in Raffles City on
30th July 2021 given its excellent accessibility
in the city and having brand adjacency with
the mall’s premium lifestyle offerings.
Momo Poptown at Funan Wanderlust X Playdress
New to Market store with products It adds vibrancy to the retail mix of Raffles at Plaza Singapura
from KAKAO FRIENDS, Blackpink, etc. City, clocking in a waiting time of up to 1.5 Concept by a popular local brand
hours upon its opening.
Fong Sheng Hao at Westgate Café Aux Bacchanales Mummy’s Market at Raffles City rrooll at Jewel
Kim Bong Bong at Bugis+
Popular Taiwanese brand opening at Plaza Singapura Introducing this brand New to market bakery
New to Market Korean Fast Food
its first outlet in Western Singapore New to Market concept to our portfolio of tenants specializing in cinnamon rolls
48Section 5: Supplementary Slides
New Retail Store Openings in Malaysia
NESPRESSO
Gurney Plaza
-----------------------------------------
NESPRESSO has opened its first island kiosk in CapitaLand Malaysia malls and
sells its own line of coffee, espresso makers & accessories for home brewing,
The iconic feature design is the center piece – Nespresso Grand Cru Wall.
There will be coffee specialists to guide new customers while the boutique will
also provide an environmentally friendly capsule recycling collection point for
returning customers.
VANS
Gurney Plaza
-----------------------------------------
The retail floor space includes several brand experience zones, product
KATE SPADE NEW YORK displays ranging from footwear to apparel & accessories for men and women.
Gurney Plaza
There is a customisation zone for customers to design their own shoes &
----------------------------------------- accessories.
Kate Spade New York opened its
Vans will display a changing rotation of curated content, including
second outlet in CapitaLand Malaysia
independent publications, skate-related art pieces and film.
malls at Gurney Plaza. The ground floor
store which spans 818 sq. ft. features a
design that reflects the brand’s unique
DNA.
Vibrant, youthful, and contemporary – GSC
the store uses thoughtful design 3 Damansara
elements and an uplifting use of colour ------------------
that can be seen throughout the space. Upgraded main foyer Spacious waiting lobby GSC reopened at 3 Damansara and
It exudes a bright effervescence with the renovated outlet features the
the use of various pink tones and rose Play+ lounge and hall suitable for
gold fixtures, mirroring the brand’s joyful families.
and feminine approach to style.
New Play+ lounge: reading corner and play area 49Section 5: Supplementary Slides
Singapore Office
Portfolio Singapore
No. of operating Grade A office buildings as of 30 Jun 2021 6
NPI yield on Committed
NPI3 (S$ million) Change in NPI (100%)
Grade A office valuation1 occupancy rate2
buildings
1H 2021 As of 30 Jun 2021 1H 2021 1H 2020 1H 2021 vs 1H 2020
Singapore 3.8% 90.4% 164.6 142.6 +15.4%4
Capital Tower CapitaGreen Asia Square Tower 2 One George Street Six Battery Road 79 Robinson Road
Notes:
1. NPI yield on valuation is based on annualized 1H 2021 NPI and valuation as of 31 December 2020
2. Committed occupancy rate as of 30 June 2021
3. Figures are on 100% basis, with the NPI of each property taken in its entirety regardless of CapitaLand’s effective interest.
4. 79 Robinson Road’s NPI contribution only in FY 2021
50Section 5: Supplementary Slides
Singapore Business Space, Industrial & Logistics
Number of Weighted average
Committed Average rental
operating lease expiry1
Portfolio occupancy rate reversion2
properties (years)
As of 30 Jun 2021 2Q 2021
Business Space3 33 82.3% 7.3%
Industrial 45 87.2% 3.1%
3.5
Logistics 20 94.9% 4.9%
Integrated
3 94.1% -3.1%
Development4
Ascent, Singapore Science Park, Singapore Aperia, Singapore 20 Tuas Avenue 1, Singapore
Notes:
1. Calculated based on balance of lease term of every lease weighted by annual rental income
2. Calculated based on average signing gross rent of the renewed leases divided by preceding average signing gross rent of current leases. For the period Apr – Jun 2-21(2Q 2021),
weighted by area renewed and for multi-tenant buildings only
3. Refers to business and science park properties
4. Comprises two or more types of space such as workspace, retail and warehousing facility within one integrated development 51Section 5: Supplementary Slides
Vietnam Asset Portfolio
S$1.0 billion corresponding to 1% of Group’s total assets
Others
18%
15.5 Total EBIT2:
S$17.5 Million
Office Total Assets1:
13% S$1.0 Billion
Retail 0.5 1.0
0.5
4%
Residential,
Commercial Strata Residential, Retail Office Others 3
& Urban Commercial
Development Strata & Urban
65% Development
Notes:
1. Total assets as of 30 Jun 2021
2. Total EBIT YTD Jun 2021 52
3. Include serviced residence component in an integrated development project - The VistaYou can also read