Investor Manual - China Yangtze Power Co., Ltd
←
→
Page content transcription
If your browser does not render page correctly, please read the page content below
Investor Manual
Disclaimer
1. The content of the manual is only for
   reference, and does not constitute any basis
   for making investment decisions.

2. The forward looking statements regarding
   future plans, development strategies, etc. in
   the manual do not constitute any material
   commitments to investors by the Company.
   Please pay attention to investment risks.
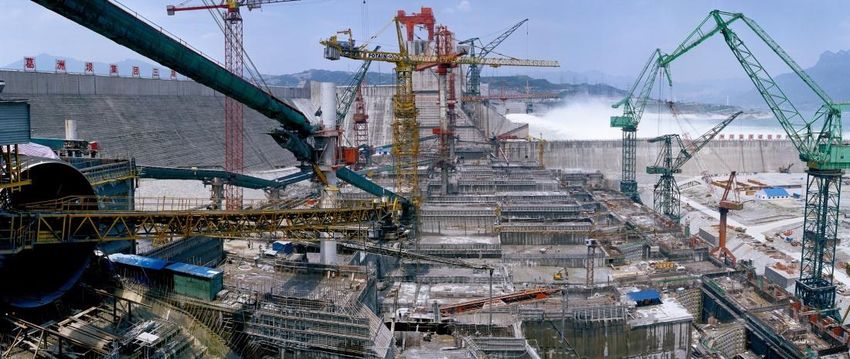
Table of Content
                   I Company Overview                                     4
                        1. Company Introduction                           5
                        2. Core Strengths                                 8
                        3. Major Businesses                               9
                        4. Core Competitiveness                           13
                        5. Development Strategy                           14
                   II Financial Analysis                                  15
                        1. Revenue, Cost and Profit                       16
                        2. Assets, Liabilities and Shareholder’s Equity   19
                        3. Cash Flow                                      21
                        4. Key Financial Metrics                          24
                   III Value Creation                                     25
                        1. Source of Current Value                        26
                        2. Mid-Term Growth Drivers                        27
                        3. Future Outlook                                 29

                   IV Valuation Analysis                                  31

                   Appendices
                        I Hydropower Basics                               35
                        II Cascade Dispatching                            57
                        III Power Market                                  64
                        IV Investment and Financing                       75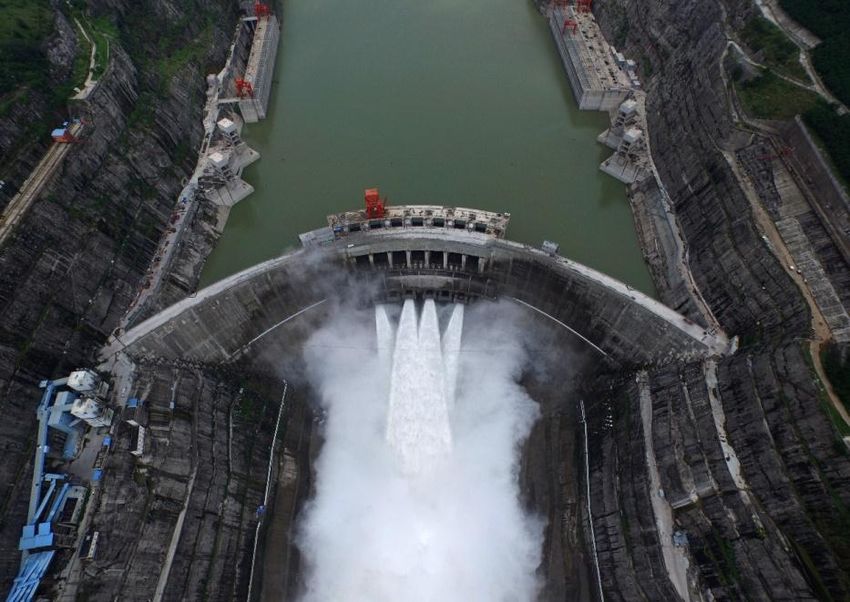
I

    Company Overview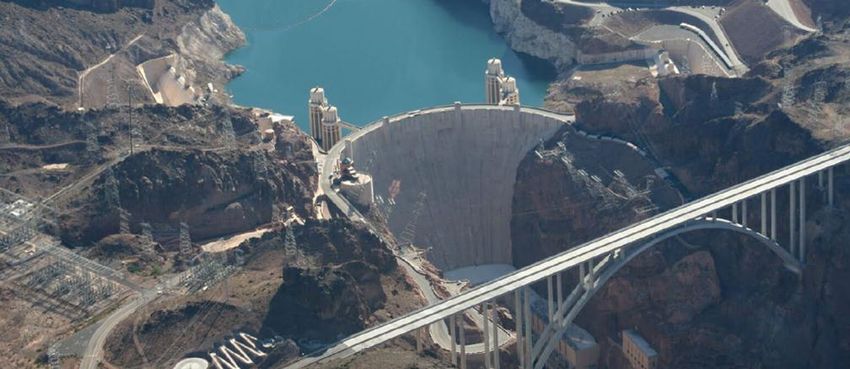
I. Company Introduction

 China Yangtze Power Company Ltd. (“CYPC”) is the largest hydropower company in China, with
 45.495GW of generation capacity in four dams operating along the Yangtze River Valley, including the
 world’s largest hydropower plant, the Three Gorges Dam. CYPC’s generation capacity is fully utilized and
 100% of its electricity is sold, largely to regions of rapid industrialization, with high economic and
 population growth, where the demand for electricity in intense and growing - from Chongqing in Central
 China, to Shanghai in the East, and to Guangdong Province on the Pearl River Delta in the South.

                             CYPC Hydropower Network and Major Markets Served

     CYPC was established by its parent company, China Three Gorges Corporation (“CTG”) to own and
     operate all CTG hydropower dams along the Yangtze River. CYPC’s acquisition of the four dams from
     CTG, as each was completed and became operational, was finalized in 2016. CTG retains a controlling
     62.27% ownership in CYPC.

     In the future, CYPC will become the largest hydropower company in the world, upon completion and
     acquisition of two new dams from CTG on the Yangtze River, which will increase generation capacity by
     26.2GW to 71.695GW. With six dams operating sequentially on over 1,000 miles of the Yangtze, CYPC
     will be a fully integrated hydropower company, able to manage water flow to optimize utilization and
     output and achieving economies of scale, efficiency, reliability, and cost. Hydropower is able to produce
     electricity at operating costs 32.5% lower than coal-fired plants, and to sell electricity at substantially
     lower prices to consumers.

 5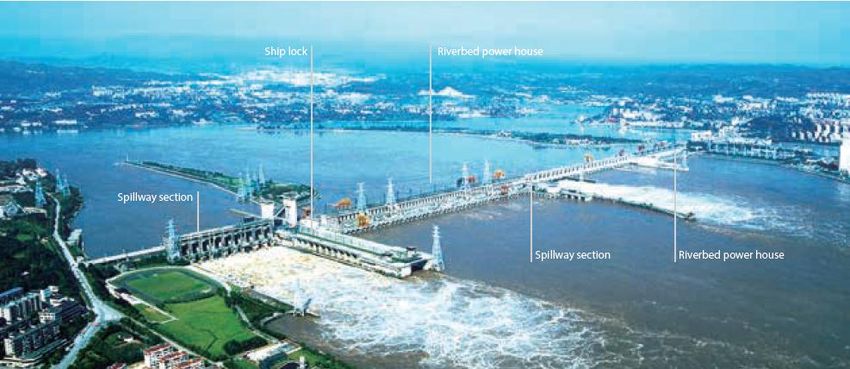
I. Company Introduction

  1. History Timeline

       CYPC listed on Shanghai           Three Gorges power stations                       Power plants at all                         Three Gorges power
          Stock Exchange                    commence operation                           four dams commence                          plant aggregated power
                                                                                               operation                                generation output
   CYPC                                                                                                                              achieves 1 trillion kWh
established                                                    The Three Gorges                               Acquired 30% of
                                                             reservoir reaches full                         Meerwind, a German
                                                                   capacity                                 offshore wind project

       2002 - 2006                                   2007 - 2011                                  2012 - 2016                               2017

            Completed equity                            Listing of the Three                                   Issued US$300 mm               Market value reaches
         division restructuring as                     Gorges power station                                     and EUR 200 mm                  RMB 380 bn, a
         the first player in China                                                       Acquisition of Xiluodu exchangeable                   milestone in the
                                          Issued the first                               and Xiangjiaba Dams         bonds
                                      corporate bond in China                                                                                power distribution and
                                                                                               from CTG                                          sales industry

2. Ownership Structure (1)

                                100%                                   (2)                       62.27%
      Controlling
                                                        China Three Gorges Corporation
     Shareholder
                                        (Including party acting in concert)

                                      Hong Kong Securities Clearing Company
                                                                                         5.15%
                                                        Limited
                                         Ping An Life Insurance Company of
                                      China – Traditional – General Insurance            4.49%
                                                       Product
                                        Sichuan Energy Industry Investment
                                                                                         4.00%
                                                    Group Co Ltd
       Majority
                                       Yunnan Provincial Energy Investment
     Shareholders                                                                        3.67%     24.38%
                                                    Group Co Ltd                                                                    (600900.SH)
                                        China Securities Finance Corporation
                                                                                         2.83%
                                                       Limited                                                                        100%
                                       Sunshine Life Insurance Group Inc - Jili
                                                                                         1.91%
                                          Endowment Insurance Product
                                        China National Nuclear Corporation               1.19%
                                          Sunshine Life Insurance Co Ltd –
                                                                                         1.14%
                                          Universal Life Insurance Product

        Others                                                                                   13.35%

   ____________________
   (1) Ownership structure as of March 31, 2018
   (2) China Three Gorges Corporation ownership includes the stakes owned by party acting in concert
                                                                                                                                                                      6
I. Company Introduction

        3. Dividends

                                                        Historical Dividend Payout
    (RMB bn)

20                                                                                                                                           100%

                                                                                                                                             80%
15
                                                                                                                                             60%
10
                                                                                                                                             40%
    5
                                                                                                                                             20%

    0                                                                                                                                        0%
          2003   2004     2005    2006     2007      2008     2009    2010        2011     2012    2013     2014    2015     2016     2017

                                                    Total cash dividend             Dividend payout ratio

                                                       Dividend Yields Comparison

          8%

          6%

          4%

          2%

          0%
                   2010             2011               2012               2013              2014            2015             2016
                             Company          A-share average              Power sector average             10-year government bond

                                 2016 Dividend Yield of Major Hydroelectric Power Companies

           5%
           4%
           3%
           2%
           1%
           0%
                   Company       Sichuan Chuantou     Guangdong            SDIC          Guangxi Guiguan Guizhou Qianyuan   Hubei Energy
                                      Energy           Shaoneng

7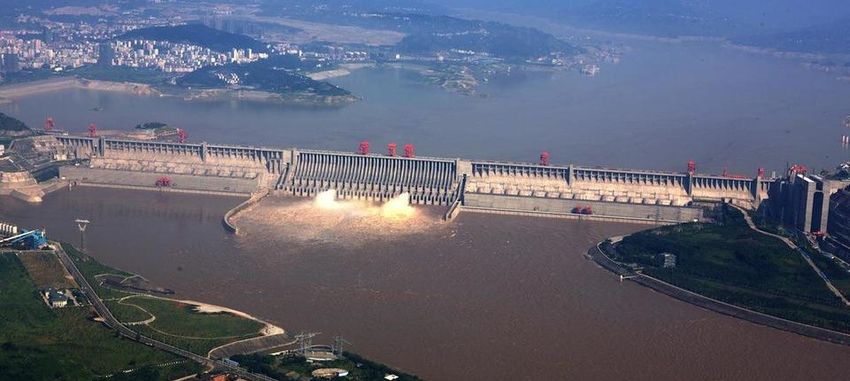
II. Core Strengths

                                                                                                        Company has the Best Water
                 World Hydropower Leader                                                                Resources in China
             ■     World’s largest hydropower company                                                 ■ Permanent use rights to the best water
                   with 45.495 GW installed generation                                                  resources in China
                   capacity, owning 3 of the 12 largest
                                                                                                      ■ CYPC dams and power stations are of
                   hydro power stations in the world
                                                                                                        strategic importance to China in power
             ■     CYPC hydropower is 100% renewable                                                    generation, flood prevention, shipping,
             ■     High market valuation confirms CYPC’s                                                and water resource management.
                   global power industry leadership

                          Outstanding                                                                   Attractive Shareholder
                 Competitive Strengths                                                                  Returns

             ■     China sovereign credit rating of A+                                                ■      Commitment to high cash dividend policy,
                   from Fitch                                                                                and explicitly stated in its Articles of
             ■     CYPC hydropower is the lowest cost                                                        Association.
                   of all other forms of electricity                                                  ■      2016 – 2020: Dividend per share no less
                   generation.                                                                               than RMB 0.65
             ■     High profitability, strong balance                                                 ■      2021 – 2025: Dividend payout ratio no
                   sheet, sustainable business growth,                                                       less than 70%
                   and abundant cash flow.

                              Top 12 Hydropower Stations in the World by Installed Capacity(1)

 Installed Capacity
       (GW)

                    22.5

                                  16.0
                                                 14.0     13.9
                                                                       11.2       10.3     10.2
                                                                                                       8.7         8.5
                                                                                                                                6.8         6.4           6.4

Power Station    Three Gorges Baihetan*          Itaipu   Xiluodu   Belo Monte*   Guri   Wudongde*   La Grande    Tucurui   Grand Coulee Xiangjiaba     Sayano-
                                                                                                                                                      Shushenskaya

        Country

                                                                                                  Company         CTG          Others     * Under construction

   ____________________
   (1) Based on publicly available information

                                                                                                                                                                     8
III. Major Businesses
1. Hydropower Generation
Total installed capacity reached 45.495 GW in 2017, equivalent to 13.3% of China’s hydropower
capacity, contributing over 99% of the company’s total revenue.
In 2020, CYPC intends to acquire two additional dams from CTG upon completion of construction,
increasing generating capacity by 26.2 GW to 71.695 GW. The Company will then own 5 of the 12
largest hydropower stations in the world, and will also achieve a market share of over 20% of China’s
hydropower capacity.
Xiluodu Xiangjiaba
Installed capacity (GW) 13.86 Installed capacity (GW) 6.4
COD 2013 COD 2012
Wudongde
Estimated installed
10.20
capacity (GW)
Henan Jiangsu
Estimated COD 2020 Anhui
重庆 Hubei
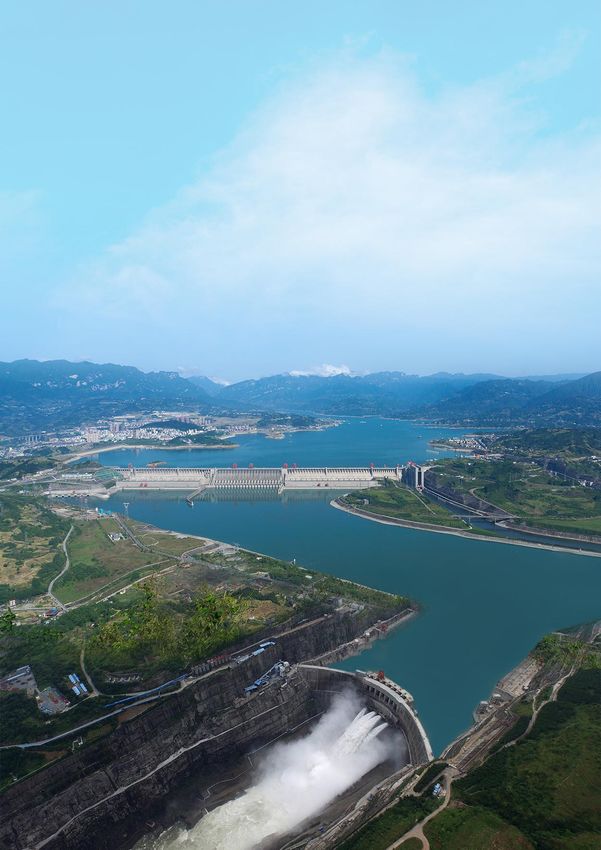
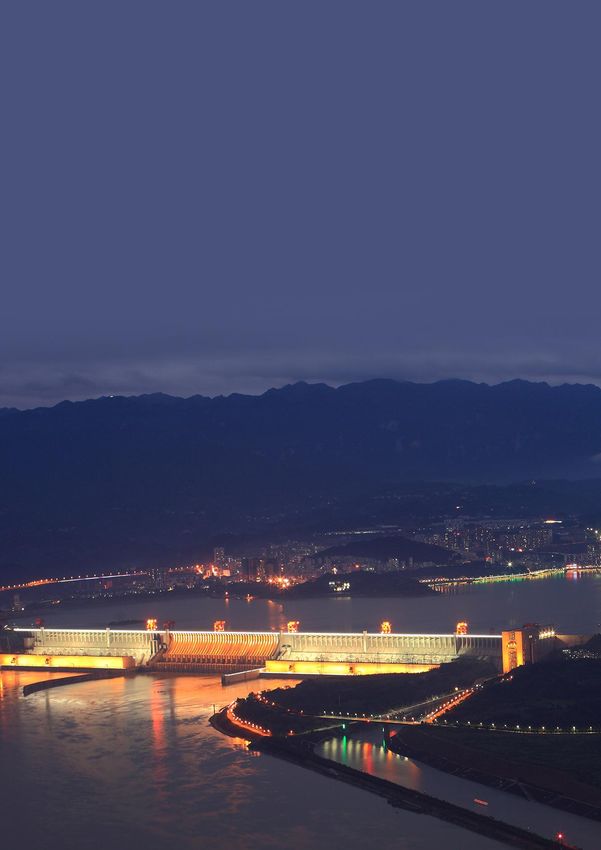
Three Gorges Shanghai
Sichuan
Yangtze Zhejiang
River Gezhouba
Hunan Jiangxi
Xiangjiaba
Wudongde
Xiluodu Three Gorges
Baihetan
Yunnan Guangdong
Installed capacity (GW) 22.50
COD 2003
Baihetan Gezhouba
Estimated installed
16.0
capacity (GW) Installed capacity (GW) 2.735
Estimated COD 2021 COD 1981
Provinces and municipalities covered by
the Group’s distribution network
Projects under construction(1)
Projects in operation
Jinsha River Hydro Resources Base
____________________
(1) Currently owned by CTG and will be injected into Company after commercial operations according to non-compete undertakings
9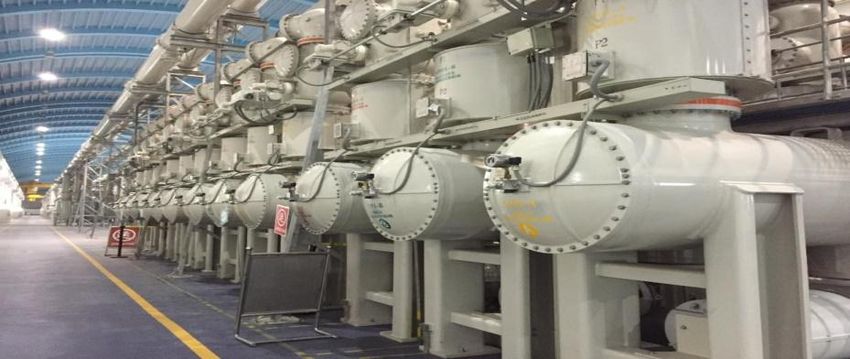
III. Major Businesses
2. Electricity Distribution and Sales
Mar 2015 Dec 2015 Oct 2016 Dec 2016 Feb 2017 Mar 2017
"Directives on Further Chongqing and Issued the “Measures Issued “Basic Principles Written reply to pilot Issued “Notice on
Government Deepening the Power Guangdong were for Entry and Exit of for Mid-Long Terms works on cross-regional Orderly Open up of
Sector Reform” was authorized to conduct Power Selling Power Transaction incremental and spot Power Utilization Plan”
Policy issued to open up the pilot program of Companies” (Provisional)” market renewable
power distribution and power retail reform energy transactions
sales sector to private
capital
2015 2016 2017 2018
Jul 2015– Jan 2018 Sep 1, 2016 Dec 1, 2016 2017 Year End Jan 17, 2018
Three Gorges Electric Energy and Changxing Electric Power made The power distribution business Company completed integration Changxing Electric Power signed
Company its subsidiaries and affiliates equity investment in Chongqing in Chongqing Liangjiang New of Chongqing Wujiang Industry cooperation agreement with
Response were established with business Electricity Trading Center as an District becomes first batch of and Chongqing Fuling Julong State Grid Chongqing to set up
across 10 provinces and electricity sales representative pilot projects by NDRC and Power; made additional equity 50:50 JV responsible for
municipalities National Energy Administration investment in Chongqing Fuling incremental power distribution
Energy to obtain its 32.49% construction and operation in
stake, becoming its single largest Liangjiang New District and
shareholder power sales in the whole city
Continue to Expand Power Distribution Create the Leading Fully-Integrated Chain of
and Sales in CYPC Markets Power Generation, Distribution and Sales
Equity investment in local
energy companies for power Establish subsidiary power
distribution and sales distribution and sales
companies CYPC power distribution and sales
segment sold 15 billion kWh of power in
2017
Henan Significant expansion of distribution and
sales of electricity in Chongqing region
Anhui Jiangsu Continue expansion of hydropower
Sichuan Hubei Shanghai distribution, as well as distribution of
natural gas and solar power nationwide
Chongqing
Zhejiang Invested in Yan’an Electricity and secured
Hunan Jiangxi development rights to three national
Guizhou power showcase projects
Fujian
Development of distributed energy and
Yunnan charging station initiatives. Implemented
Guangxi Taiwan new technology R&D. Completed
Guangdong
construction of Taipingxi Pier Power
Project at Three Gorges
Established strategic regional energy
Hainan distribution companies, including in
Yangtze River Basin industrialized Chongqing Province
Dedicated sales and distribution team
comprised of 300 professionals
10III. Major Businesses
3. International Operations
Global Hydropower Operations Direct Investment
Utilizing our core expertise in operating large hydropower In August 2016, CYPC, jointly with CTG Europe, acquired BCP
projects, CYPC operates and manages prime projects in Meerwind Luxembourg which, controls an 80% stake in the
international locations, including: Meerwind offshore wind farm.
Meerwind commenced full commercial operations in
February 2015 with a total installed capacity of 288MW, and
Brazil has accumulated paid dividends of RMB 72.7 mm to CYPC.
CYPC operates and manages hydropower
projects owned by CTG in Brazil, providing
services which include production preparation,
O&M, technical upgrades, consultation, and
training
Pakistan
Participated in operation and management of
hydropower projects in Pakistan
Malaysia
Provided consultation services to Murum
hydropower project, to optimize the production
management system, increase operating
capabilities and improve technical skills
Germany
Pakistan
Malaysia
Brazil
Hydropower Business Investment Projects
11III. Major Businesses
4. Investment and Financing Activities
Credit Ratings Obtained
A+ AAA AAA
Sovereign Credit Rating
With a sovereign credit rating, CYPC has access to international financial markets and the broad array of
modern financial instruments.
The Company closely manages the cost of debt and successfully lowered interest costs in each of the past
three years.
During 2016 and 2017, CYPC’s average interest costs fell within the 1-year interbank borrowing rate.
Investment Income
The Company’s investment income from domestic and international projects exceeded RMB 1 billion in each of the last
seven years, rising to RMB 2.3 billion in 2017.
Investment income has consistently ranged between 5%-15% of total profit , effectively smoothing the Company’s
profitability by counteracting any impact of seasonal water fluctuations on hydropower generation.
(RMB bn)
40 14.8% 16%
35 14%
11.1% 11.6%
30 12%
25 8.7% 10%
7.5%
20 6.9% 8%
5.3%
15 6%
10 12.7 23.8 24.3 4%
12.6 14.3
9.0 10.4
5 2%
1.1 1.0 1.4 1.1 2.2 2.3
0 1.3 0%
2011 2012 2013 2014 2015 2016 2017
Investment income Total profit % of total
12IV. Core Competitiveness
1 A Fully Integrated Power Company
• With four dams operating sequentially on over 1,000 miles of the Yangtze River, CYPC is a fully integrated
hydropower company, able to manage cascading reservoir water flow system-wide, optimizing utilization and
output, and achieving economies of scale, efficiency, reliability, and low cost.
• Cascading reservoir management has already provided additional hydropower output of over 9 billion kWh.
• CYPC technology collects water flow data to constantly monitor and forecast flow requirements across the
entire system. With a forecasting accuracy of up to 99%, CYPC can effectively manage output and demand under
all conditions.
950
820
Wudongde
600
Baihetan
380 Three
Xiluodu Gorges Gezhouba
175
Xiangjiaba 66.5
Shuibuya Geheyan
Gaobazhou
Design water level (m)
2 Management Expertise 3 Maintenance Capabilities
• With over 30 years of industry experience and over 18,000 highly • The largest hydropower maintenance team in China, with leading
skilled staff, CTG ranks #1 in the world in installed capacity and expertise in complex hydropower systems.
installed capacity managed per person.
• The Company has unique and leading expertise in managing and • Fully integrated data platform to analyze and diagnose system-
operating large-scale hydropower systems with multiple dams, wide performance. Maintenance is performed with minimum
reservoirs and power generating facilities. down-time.
• Proven capability to generate and distribute uninterrupted large • Established the “China Yangtze Power Standards” in conjunction
electricity loads. with the International Energy Agency and the International
• CYPC has a globally-unmatched track record for safe and stable Electrotechnical Commission.
hydropower operations.
• The Company is the first to formalize safety standards for
hydropower plants, and is the recognized global leader in this
category.
4 High Demand for Hydropower 5 Capital Management
• Electricity from renewable sources is by law given first priority in • Long-term assets with high profitability, low operating costs, and
sales and distribution over other generation sources. abundant cash flow are the foundation of solid financial stability.
• The Chinese Government has implemented policies requiring
• With a sovereign credit rating, CYPC is recognized and respected
sustained increase in the availability and distribution of
in domestic and international financial markets, with access to low
renewable energy.
cost financing.
• CYPC’s business is market-oriented, providing electricity where
demand is highest, at competitive prices, backed by reliability and • Along with hydropower generation, CYPC considers management
service. of capital and financial stability to be a core expertise and
business objective.
• CYPC’s distribution channels ensure efficient and effective service
and 100% utilization of CYPC output.
• Strategic investments which generate high returns provide
• CYPC serves regions where the demand for electricity in intense additional margins of performance and earnings.
and growing, from Chongqing to Shanghai to Guangdong Province.
13V. Development Strategy
One Business, Two Markets, Three Key Strategies
One • Maintain global hydropower leadership and focus on
Business innovation to lead development of hydropower sector
Two Markets
• The power market
• The capital market
Two • Be the first-mover in renewable power development
Markets opportunities, make strategic and financial
investments for growth of profitability and ROE.
• Utilize the sovereign credit rating to manage capital
for optimal financial structure and performance.
• Continually enhance the Company’s reputation for
Three Key performance and expertise.
Strategies • Expand internationally when strategically appropriate.
• Further develop the Company’s integrated
hydropower systems.
14II
Financial AnalysisI. Revenue, Cost and Profit
Achieving Scale and Growth…
In the period from 2008, CYPC has become the largest hydropower company in China, with 45.495
GW of generation capacity in four dams operating along the Yangtze River Valley.
During that period, assets have grown from RMB 58 billion to RMB 299 billion.
…With Profitability and Stability
Upon this exceptionally strong asset base, CYPC has during the same period achieved the following
operating results:
2008 2017 CAGR
Revenue: RMB 9 BN RMB 50 BN 20.99%
Net Profit: RMB 4 BN RMB 22 BN 20.85%
Operating Cash Flow: RMB 6.6 BN RMB 39.7 BN 22.06%
Revenue and Net Profit
(RMB bn)
60 49 50 100%
50
75%
40
26 27 24
30 22 21 23 21 22 50%
20 9 9 11 12 12
6 7 7 4 5 4 5 8 10 25%
10 3 1 3 3 9
8
0 0%
2003 2004 2005 2006 2007 2008 2009 2010 2011 2012 2013 2014 2015 2016 2017
Total revenue Net profit Net margin
16I. Revenue, Cost and Profit
2017 Revenue Breakdown Revenue Breakdown Evolution
(RMB bn)
60
1%
4% 4%
40
91% 20
0
2007 2008 2009 2010 2011 2012 2013 2014 2015 2016 2017
Power generation revenue Power generation revenue Investment income
Non-operating revenue Non-operating revenue Other revenue
2017 Cost Breakdown Cost Breakdown Evolution
31% 100%
25.7% 22.2% 25.9% 25.9% 26.1% 30.7%
80%
45%
60% 30.2% 26.4% 23.6% 21.0% 23.9% 21.5%
3.8% 3.8% 3.8% 3.0% 3.1%
40% 3.7%
21% 3% 43.8% 45.5% 44.1% 44.7%
20% 40.0% 43.0%
Depreciation SG&A Finance expenses Other costs 0%
2012 2013 2014 2015 2016 2017
Depreciation SG&A
Finance expenses Other costs
(RMB) Earnings Per Share
1.5
1.0
0.5
0.0
2003 2005 2007 2009 2011 2013 2015 2017
17II. Depreciation Policies
Depreciation of Long Life Assets
CYPC, like most power companies, holds a large portion of its assets in fixed property and equipment
such as dams , power generating turbines, etc. As indicated in the chart below, fully 87.5% of total
assets are long-life, low maintenance fixed assets.
Under currently required accounting policies, the depreciation period for key assets is as follows:
• Three Gorges , Xiangjiaba and Xiluodu Dams 45 years
• Gezhouba Dam 60 years
• Water turbine and power generators 18 years
Average depreciation period for key assets 27 years
Actual expected service life >100 years
CYPC has adopted straight line depreciation to mitigate, to the extent possible , the mismatch between
a required depreciation that is significantly shorter than the expected long useful life of key assets,
and to mitigate as well the accounting effects of “excess” depreciation to net earnings, EPS and
cash flow.
(RMB bn)
As % of total
Original value Total depreciation Net value assets
Dam Structures 141.9 20.6 121.2 40.6%
Properties and buildings 89.6 12.5 77.2 25.8%
Machinery and equipment 100.9 38.0 62.9 21.1%
Transportation vehicles 0.2 0.2 0.05 0.02%
Other 0.8 0.4 0.4 0.1%
18III. Assets, Liabilities and Shareholder’s Equity
Balanced Growth
CYPC’s total assets have risen from RMB 30 billion in 2003 to RMB 299 billion in 2017,
notably with the completion of dam and power station acquisitions from CTG in 2009
and 2016.
The growth in liabilities during the same period is proportionate to asset growth,
reflecting the company’s strong cash flow and financial management, such that the
liability to asset ratio is managed in the optimal range of 45% to 55%.
(RMB bn) Total Assets
400
299 299
300
200 162 157 158 155 150 147 142
100 41 64 58
30 33 39
0
2003 2004 2005 2006 2007 2008 2009 2010 2011 2012 2013 2014 2015 2016 2017
Total Liabilities
(RMB bn)
200 170 164
150
100 100 91 90 80 71 61 51
50
17 19 23 20
10 11
0
2003 2004 2005 2006 2007 2008 2009 2010 2011 2012 2013 2014 2015 2016 2017
Short-term liabilities Long-term liabilities Total liabilities
Total Assets to Liabilities Ratio
(RMB bn) (%)
400 80
300 60
Optimal Level
200 40
100 20
0 0
2003 2004 2005 2006 2007 2008 2009 2010 2011 2012 2013 2014 2015 2016 2017
19III. Assets, Liabilities and Shareholder’s Equity
2017 Asset Breakdown Asset Breakdown
Evolution
(RMB bn)
1% 2%
11% 300
250
200
150
100
86% 50
0
Cash and cash equivalents 2008 2009 2010 2011 2012 2013 2014 2015 2016 2017
Outbound investment
Property and materials Cash and Equivalents Outbound investment
Receivables and advance payments Property and materials Receivables and advance payments
2017 Liabilities Breakdown Liabilities Breakdown Evolution
1% 14% (RMB bn)
200
150
100
85% 50
0
Short-term payables Interest-bearing debt 2008 2009 2010 2011 2012 2013 2014 2015 2016 2017
Other non-current liabilities
Short-term payables Interest-bearing debt Other non-current liabilities
2017 Shareholder’s Equity Breakdown Shareholder’s Equity Timeline
(RMB bn)
3% 16%
120
32% 90
60
33%
30
16% 0
2008 2009 2010 2011 2012 2013 2014 2015 2016 2017
Equity Capital reserve Surplus reserve
Equity Capital reserve
Undistributed profits Others Surplus reserve Undistributed profits
Others
20V. Cash Flow
CYPC’s solid financial stability is founded upon long-term assets with high profitability,
low operating costs, and abundant cash flow.
These dynamics produce the following results:
Key 2017 Metrics
Revenues RMB 50.0 billion
EBITDA RMB 45.1 billion
EBITDA Margin 90.2%
Net Profit RMB 22.0 billion
Net Margin 44.0%
Operating Cash Flow RMB 39.7 billion
Operating Cash Flow/Total Revenues 79.4%
Net Cash Flow from Operating Activities
(RMB bn)
60
CAGR 2003 – 2017: 24.7% 39.7
39.0
40
21.5 21.3
17.3 18.1 17.7
20 15.5
6.6 8.2
5.3 5.4 5.0 4.9
1.8
0
2003 2004 2005 2006 2007 2008 2009 2010 2011 2012 2013 2014 2015 2016 2017
21V. Cash Flow
Uses of Cash Flow
• Production and operating costs
• Taxes and fees
• Financing cost and debt repayment
• Shareholder dividends
• Operational and financial investment
2017 Cash Inflow Breakdown Cash Inflow Evolution
1%
(RMB bn)
180
37%
150
120
59% 90
60
3%
Cash from power generation and labor service 30
VAT return
0
Borrowings
2003
2004
2005
2006
2007
2008
2009
2010
2011
2012
2013
2014
2015
2016
2017
Cash from investment
Operating Activities Investing Activities Financing Activities
2017 Cash Outflow Breakdown Cash Outflow Evolution
(RMB bn)
180
29%
150
42% 120
1% 90
1% 60
4% 30
8% 11%
Debt repayment 0
2003
2004
2005
2006
2007
2008
2009
2010
2011
2012
2013
2014
2015
2016
2017
Dividend & interest payment
Tax payment
Investment
Purchase of commodities & labors Operating Activities Investing Activities Financing Activities
Construction of fixed assets
Employee’s remuneration
Others
22IV.Financial Management
Financial stability
Along with hydropower generation, CYPC considers management of capital and financial
stability to be a core expertise and business objective.
Strong Balance Sheet
With the long-term nature of assets, CYPC has directly accessed debt markets to manage its
financial structure, increasing the length of debt maturities while maintaining a strong
balance sheet .
Lower Financing Costs
CYPC gradually increased direct financing in debt market and kept optimizing the debt
structure by dynamic capital control. CYPC sought market windows and grasped opportunities
when interest rates were at market lows to issue direct financing products in a rolling manner
to lower financing costs and reduce financing expenses.
2017 Interest-Bearing Debt Breakdown
9.6%
2.3%
30.9%
10.4%
15.8%
16.3%
Short-term borrowings Other current liabilities
Non-current liabilities due within one year Long-term borrowings
Bonds payable Long-term payables
(RMB bn)
Finance Expenses
(%)
8 40%
6.7
30.2% 5.9
6 26.4% 30%
4.6 23.6% 23.9%
21.0% 21.5%
3.8 3.4
4 2.9 20%
2 10%
0 0%
2012 2013 2014 2015 2016 2017
Finance Expenses Finance Expenses %
23VI. Key Financial Metrics
EBITDA Free Cash Flow(1)
(RMB bn) (RMB bn)
48 44.1 45.1 50
40 36.7 37.1
36
30
24
20
12
10
0 0
2016 2017 2016 2017
Capital Expenditure(2) Maintenance Expenditure
(RMB bn) (RMB bn)
15 0.5
10.6 0.4
10 0.3
0.3
0.2
0.2
5
2.7
0.1
0 0.0
2016 2017 2016 2017
Return On Equity Interest-Bearing Debt/EBITDA(3)
(x)
20% 3.5 3.3
3.1
16.2% 16.5%
3.0
15% 2.5
2.0
10%
1.5
5% 1.0
0.5
0% 0.0
2016 2017 2016 2017
EBITDA/Interest Expense FFO/Interest-Bearing Debt(4)
(x) (x)
10.0 0.4
8.0 7.3
6.7 0.3 0.3 0.3
6.0
0.2
4.0
0.1
2.0
0.0 0.0
2016 2017 2016 2017
Note: (1) Free cash flow = cash flow from operation – fixed asset investment: (2) Capital Expenditure = maintenance expenditure + capacity
expansion and closing project + investment; (3) Interest-bearing debt includes short-term borrowings, non-current liabilities due within one year,
other current liabilities, long-term borrowings, bonds payable and long-term payables. ;(4) FFO = Cash flow from operation before changes in
working capital
24III
Value CreationI. Sources of Current Value
Commitment of High Dividend Payout Ratio
CYPC’s sovereign credit rating and commitment to a high cash dividend payout ratio provide
investors with lower risk and higher yield investment choices.
Commitment of High Cash Dividend Payout
Cash dividend of 75.1% 70.0%
2016 – 67.2%
no less than RMB 51.4% 52.9% 57.3%
2020
0.65 per share
0.71 0.68 0.65
Cash dividend 0.38 0.40
0.28
payout ratio of
2021 –
no less than 70% 2013 2014 2015 2016 2017 2018-2020 2021-2025
2025
of annual net
DPS (RMB) Payout Ratio
profit
Company Dividend Payout vs 10-Year Government Bond Yields
6.0%
4.2% 3.9%
4.0% 2.9%
2.0%
0.0%
Company payout ratio China 10-year government bond U.S. 10-year treasuries
Clean Energy is Socially Responsible
Customer satisfaction Cumulative power output
100% 2.0 tn kWh
Tax payment in the last five years Hub Operation Cumulative flood retention in the
Dedication to Society recent five years
RMB 56.4 bn
70.7 bn cubic meters
Input in social responsibility projects
Cumulative water replenishment
RMB 62.1 mm in the recent five years
Volunteer services participated 131.5 bn cubic meters
Over 700
Talent Retention and Training Low carbon and Environment Protection
Since operation:
Total training input Standard coal saved
RMB 17.7 mm 637.2 mm tons
No. of staff receiving on- CO2 emissions reduction
the-job training 1.7 bn tons
Over 70,000 Equivalent to the effect of forest
planted
4.6 mm hectares
26II. Mid-Term Growth Drivers
1.Installed Capacity and Profitability Growth
A key indicator of CYPC’s operational success and business capability is that the rate of
profitability growth exceeds the growth in assets and installed generation capacity. As the
company has grown, it has become proportionately more profitable.
CYPC installed capacity increased from 5.515 GW in 2003 to 45.495 GW in 2017, at a CAGR of
22.3%. During the same period, net profit grew at a CAGR of 29.7%.
Annualized Growth Rates 2003 – 2017
Installed capacity 22.3%
Net profit 29.7%
Furthermore, the planned acquisition of the Baihetan and Wudongde Dams in the future will
increase generation capacity by 26.2 GW to 71.7 GW.
Installed
capacity per
Installed capacity share
(W/share)
(GW) Acquire 18 Three Gorges Gensets Complete acquisition of all
(81.2% in cash, 18.8% equities) Gensets of Three Gorges Project 2.1 2.1
All of Gezhouba Generation Units
2.1
Acquire 3 Three Gorges
and 4 TGP Generation Units
Gensets
(IPO: RMB 9.83 bn)
45.5 45.5 1.8
1.5 1.5 1.5 1.5
Acquire 2 Three Gorges Acquire 2 Three Gorges 1.4
Gensets Gensets 1.3 1.3 1.5
25.3 25.3 25.3 25.3 1.2
23.2
0.9 0.9 0.9 0.9 21.1 21.1
0.8
0.7 Complete acquisition of all
0.9
Gensets of Xiluodu and
8.4 8.4 Xiangjiaba power stations 0.6
5.5 6.9 6.9 6.9 (47.0% cash, 53.0% equities)
0.3
0 0.0
2003 2004 2005 2006 2007 2008 2009 2010 2011 2012 2013 2014 2015 2016 2017
Installed capacity Installed capacity per share
272.Increase in Utilization through Water Management
Management of reservoir water levels is a fundamental and essential part of hydropower dam
operations.
This topic is discussed in further detail in Appendices I and II, but mention here is made of the
impressive fact that, through advanced water management systems, CYPC has increased power
generation since 2010 by 60.2 billion kWh than would otherwise have been achieved.
2010-2017 Additional Power Generated Through Water Management
(bn kWh)
12
9.9 9.6
9.1 9.2
9 7.6
5.0 5.5
6 4.3
3
0
2010 2011 2012 2013 2014 2015 2016 2017
28III. Future Outlook
1.China Economic Growth and Electricity Consumption
China has experienced transformative economic growth in recent decades.
Looking ahead, the Chinese government has prioritized economic growth to achieve the following
social objectives:
Phase I 2020 to 2035: Achieve a well-off society
Phase II 2035 to 2050: Achieve a modern powerful society
To achieve these objectives, China will, of course, require additional power generation.
How much will China’s future electricity consumption increase? A comparison may help to indicate
the trend line. In 2015, China’s per capita electricity consumption was 4,231 kWh, significantly less
than in developed economies in North America, Asia and Europe.
Per Capita Electricity Consumption in Key Developed and Developing Countries
(kWh)
14,000
12,000
10,000
8,000
6,000
4,000
2,000
0
US South Korea Japan Germany UK China World Brazil India
292.Trend of Electric Vehicles Replacing Gasoline Vehicles
Electric vehicle sales more than doubled in 2017, and over half of those were sold in China. That
trend is expected to accelerate significantly in the future.
Some countries have set deadlines to eliminate the sale of conventional gasoline vehicles. Others
have set targets for future sales of electric vehicles. China has initiated planning of an exit timetable
of conventional gasoline vehicles.
In China, automobile sales grew at a CAGR of 15.67% from 2005 to 2015, and the gradual
replacement of gasoline vehicles by electric vehicles will further boost the electricity consumption in
China. By some estimates, 200 million electric vehicles will have been sold in China by 2040,
comprising fully 60% of its vehicles.
2005-2015 Trend of Vehicle Sales in China
(mm vehicles)
CAGR = 15.67%
30
23.5 24.6
25 22.0
18.1 18.5 19.3
20
13.6
15
8.8 9.4
10 5.8 7.2
5
0
2005 2006 2007 2008 2009 2010 2011 2012 2013 2014 2015
30IV
Valuation AnalysisI. A Clear and Successful Business Model
CYPC’s business model is clear, and its results are clearly successful.
• High earnings
• Low operating costs
• Abundant cash flow
• Solid financial structure
• Foreseeable growth prospects in:
o Revenue, Earnings, and Market Share
o Productive asset acquisitions from parent company
Cash Flow and EPS Growth
Acquisition of Xiluodu and
Xiangjiaba power stations
from CTG
(RMB bn) Post completion of substantial asset restructuring of (RMB/share)
power units of Three Gorges power station
60 1.20
1.01
0.94
50 1.00
39.0 39.7
40 0.72 0.70 0.80
0.60 0.63
0.56
30 0.47 0.50 0.47 0.60
0.42 21.5 21.3
17.3 18.1 17.7
20 15.5 0.40
6.6 8.2
10 4.9 0.20
0 0.00
2007 2008 2009 2010 2011 2012 2013 2014 2015 2016 2017
Net cash flow generated from Company’s operating activities in recent 10 years Change of EPS post asset injection
32II. Clear and Foreseeable Future Growth Prospects
1.Major Asset Acquisitions in the future
China Three Gorges has committed to inject into CYPC the Wudongde and
Baihetan Hydropower Dams assets into Company in the future, which will
increase CYCP’s installed capacity 26.2 GW to 71.7 GW.
Wudongde Dam and Power Station
Baihetan Dam and Power Station
332. Clear and Foreseeable Future Growth Prospects, Continued
Increased Efficiency and Utilization Further Boost Performance
Water flow at each power station, and amongst all CYPC power stations on the Yangtze
River, is controlled as needed by cascading reservoir water storage, thereby increasing
power generation efficiency and alleviating fluctuations in power generation and
revenues. Utilization hours at each power station are increasing steadily, and power
output has reached record highs.
Three Gorges, Xiluodu and Xiangjiaba hydropower stations, in particular, have large
reservoir capacities and are able to control water flow in flood season, reduce water
wastage, and ensure water supply to downstream hydropower stations during dry
season.
34Appendix I: Hydropower Basics
I. Hydropower vs Other Power Sources

         Of all methods of power generation - thermal, nuclear, wind, solar –
         hydropower stands out singularly as clean, efficient, safe, stable and lowest in
         price. It is by far the most advanced of all renewable power sources, with
         highly evolved and proven technology, and with a long track record of
         success. Hydropower is the first renewable energy to achieve large-scale
         commercial development, in locations across the globe.

         China is committed to developing and expanding its renewable energy
         resources. The development of the Yangtze River Valley hydropower system,
         for example, including the Three Gorges Dam, is known worldwide. With that
         commitment to renewable energy, and with the most abundant hydropower
         resources in the world, China now leads the world in hydropower power
         generation and installed capacity, and does so with the most modern and
         advanced hydropower facilities.

                                Hydropower Generation Output

 (bn kWh)
 1,200
                  1,052
 1,000

   800

   600
                                                              380                   410
   400
                                        266
   200

    0
                  China                  US                  Canada                Brazil

                                                                                            36
1. Hydropower Location, Construction, and Water Flow
Hydropower is most efficient at large scale, so hydropower facilities are best built on rivers
with abundant water resources. Then, selection of a suitable dam requires expert
consideration of complex factors including geology, power distribution, local population ,
shipping traffic, and environment effects.
Furthermore, the water flow of any river will vary with seasonal rainfall, and hydropower
output will vary accordingly. In China, precipitation rates rise during the period from June
through September. The effect of seasonal and year-to-year variations in precipitation on
power output is seen in the following chart.
Comparison of Monthly Power Output by Three Gorges Power Station
(bn kWh)
20
15
10
5
(RMB bn)
0
Jan Feb Mar Apr May Jun Jul Aug Sep Oct Nov Dec
2013 2014 2015 2016 2017
2017 Quarterly Main Financial Metrics
(RMB bn)
20
15
10
5
0
Q1 Q2 Q3 Q4
Revenue Net profit attributable to shareholders Net cash flow from operating activities
372. Construction, Investment, Financial Returns
Large-scale hydropower stations can be formidable engineering and construction projects.
Often, hydropower dams must be located in remote mountains or river canyons. Before
construction can commence, access to the site may require logistic preparation such as
roads, bridges, work and living facilities, etc. Dam construction involves – all while a large
river flows thorough the construction site – massive earth excavation, water diversion, and
the creation of the dam itself, a colossal concrete structure, with sophisticated power
generation and water management facilities. It is a long and costly undertaking.
The construction of Three Gorges project, for example, commenced in 1993 and was
completed in 2011, with a total investment of RMB 200 billion. For financial efficiency, the
construction of power generation facilities was staged to come online when earliest
feasible, with the first completed in 2003, and the remainder delivered sequentially
through 2011. Once completed, the investment in a dam becomes a business enterprise,
producing returns with high profit margins, stable cash flow, and long-life, low-
maintenance assets.
2012-2017 Comparison of Net Profit for Hydropower and Thermal Power Companies
(RMB bn)
25.0
20.0
15.0
10.0
5.0
0.0
(5.0) 2012 2013 2014 2015 2016 2017
Company Huaneng Power International GD Power
Huadian Power International Datang International Power
383. Naturally Unique Advantages of Hydropower The energy sources for thermal, nuclear, photovoltaic power - coal, nuclear fuel, and solar energy - can only be used once, in a single power station. Wind power can be re-used, but wind cannot be adjusted to match output requirements. Only hydropower, utilizing the kinetic energy of water flow, can be reused in multiple power stations on the same river. And unlike wind, the rate of water flow at each dam, by storing or releasing water from dam reservoirs, can be regulated in accordance with output requirements and to achieve maximal efficiency. For hydropower, the wider the river basin that can be controlled, the larger the reservoir capacity, and the more effectively can water flow be managed. In a multi-dam system such as CYPC’s, augmented with a coordinated water dispatching across the system, even greater flow management and productive efficiency can be achieved. 39
4. Priority Connection, Full Utilization, Supportive Legal Framework

  Commencing with the Renewable Energy Law of 2006, the Government of the PRC has
  adopted significant statutory measures expressly in support of the development and
  expansion of renewable energy, including:
        • Renewable energy is guaranteed first priority connection to the grid.
        • By law, 100% of power generated by renewable sources must be purchased by
          power distribution companies.
        • Expansion of the renewable energy industry, including hydropower, is given
          official priority over fossil fuel and nuclear power generation. China legislatively
          requires that renewable energy output grow annually.
        • Renewable energy is given head-of-the-line preference in project approval.
        • Preferential tax treatment is given to renewable energy companies.
        • Renewable energy R&D is specifically encouraged through government scientific
          programs, cost-sharing partnerships with the private sector, and preferential tax
          treatment of renewable energy research costs.

 5. Comparison of On-Grid Tariff of Hydropower and Other Forms of Power

    Hydropower, more than all other forms of power generation, enjoys substantial
    advantages in both operating costs and on-grid tariff.

           Average Operating Costs per kWh

                  Hydropower                    RMB .04 - .09

                  Thermal                       RMB .20                       2.2-5X

                  Nuclear                       RMB .128                      1.4-3.2X

           Average On-Grid Tariff per kWh

                  Hydropower                    RMB .27 - .30

                  Thermal                       RMB .36 - .43                 1.3-1.4X

                                                                                                 40
Comparison of On-Grid Tariffs
Hydropower vs. All Others
1,064
1,016
927 918
(RMB/kWh)
751 735
683 695
562 598 574 567
427 401 403 436 438 436 421
362
283 298 275 266
Hydropower Coal-fired Nuclear Wind Gas-fired Solar
2013 2014 2015 2016
6. Significant Social, Commercial and Environmental Benefits
The reservoirs created by hydropower dams are fundamental to their operation, storing
and releasing water to adjust power generation requirements. But the reservoirs, and their
attendant ability to manage the river’s water flow, have also have significant social,
commercial and environmental benefits.
Flood Prevention
The Yangtze River, historically prone to intermittent and dangerous flooding, has
effectively been tamed b the construction of the Three Gorges Dam. Built to
withstand the heaviest floods (one in 100 years), Three Gorges protects a
population of 20 million people and 3.8 million acres (1.5 million hectares) of
cultivation land in the Jianghan Plain.
Shipping
Shipping has flourished on the Yangtze River with the Three Gorges Dam. A 10,000-
ton vessel fleet can now sail directly from Shanghai to Chongqing, and
transportation costs have been lowered by 33%. During dry periods, when the
river height is lower, water flow can now be adjusted from the Three Gorges
reservoir to facility shipping year-round.
416. Significant Social, Commercial and Environmental Benefits
Water Replenishment
Water flow is managed from the reservoir to ensure adequate water supply to
downstream residents, agriculture and industry.
Ecological Benefits
Hydropower is clean energy. The Three Gorges project, compared to coal-fired power
generation, annually:
• Reduces coal burned: 65,799,000 tonnes
• Reduces greenhouse gas emissions:
CO2 173,400,000 tonnes
Sulfur Dioxide 82,200 tonnes
Nitrogen Oxide 75,900 tonnes
• Restored water levels in the 1,000 square mile Dongting Lake, famous in Chinese
culture as the origin of dragon boat racing, and home to the endangered Finless
Porpoise
• Reduces river bed sand accretion
• Boosts downstream fish breeding
Yangtze River waterway
42II. Hydropower Generation Concepts
1. Principles of Hydropower Generation
Large waterfalls are, theoretically, an ideal location for hydroelectric generation. The rapid
cascade of water from crest to base produces immense kinetic energy which can be harnessed in
turbines to produce electricity. Power stations at Niagara Falls in the USA and Victoria Falls in
Zambia are among the most famous waterfall generators.
But the reality of waterfalls too often disappoints the theory, because most rivers do not have
waterfalls large enough to efficiently and reliably generate hydropower, or the site of a waterfall
may be geologically incompatible with hydropower development, or natural variations in the
river’s water flow may not be conducive with reliably consistent power generation. There is a
better way: the hydropower dam.
A hydropower dam, by storing upstream water in large, regulated reservoirs, in effect creates its
own ideal waterfall by releasing water as needed through the dam to operate turbines. The rate
of water flow through the dam is managed precisely. And seasonal river flow variations can be
offset by managing reservoir levels accordingly. One might consider a dam reservoir to be a huge
storage tank of hydro energy.
Illustration of Principles of Hydropower Generation
Three
Chongqing 175 Gorges Gezhouba
66.5
River
For example, as seen in the illustration above, a level difference at Three Gorges Dam is created
between upstream waters (175 meters) and downstream (66.5 meters) by elevating the water
level in the reservoir behind the dam, gathering the massive water energy of the Yangtze River in
its passage from Chongqing to the dam site, to be used as needed in a consistent and highly
effective way.
43II. Hydropower Generation Concepts
Illustration of Gathering Hydro Energy at Three Gorges Dam
River
Reservoir
Power
Station
Dam Transmission
Lines
Generator
Water
Inflow
Turbine
2. Key Elements of Hydropower Generation
(1) Output (power):
N=9.81ηQH (kw)
N—output of turbine; Q—water flow through the turbine; H—water level difference between
upstream and downstream of the reservoir; η—turbine efficiency
(2) Power Generation Output:
E=kNT (kw·h)
E—power generation output; N—average output of turbine; T— time; K—efficiency of hydro-
generator
We can see from the formula above that the greater the water flows through the turbine, the
higher the water level difference between the upstream and downstream of the dam and the
longer the generation time, the more power can be generated
44III. Hydropower Water Resources in China
According to the National Development and Reserve Commission, water resources in China have
a potential exploitable hydropower capacity of 542 million kw of installed capacity, with an
annual generation potential of 2.47 trillion kWh.
At the end of 2017, China had an installed hydropower of 340 million kw, equivalent to 63% of
total exploitable capacity.
Water Resources Distribution in China
Water Energy Reserve Exploitable Water Energy
Installed Annual As % of China Installed Annual As % of China
Region
Capacity Generation Capacity Generation
(MW) Output (MW) Output
(bn kWh) (bn kWh)
North China 12,299 108 1.8 692 23 1.2
Northeast
12,127 106 1.8 1,199 38 2.0
China
East China 30,049 263 4.4 1,790 69 3.6
Mid & South
64,084 561 9.5 6,743 297 15.5
China
Southwest
473,312 4,146 70.0 23,234 1,305 67.8
China
Northwest
84,177 737 12.5 4,194 191 9.9
China
China 676,047 5,922 100.0 37,853 1,923 100.0
Largest Hydropower Bases in China
Northeast China
Mainstream of North Yellow River
Upstream Yellow River
Yalong River Upstream Yangtze River
Dadu River Fujian, Zhejiang, Jiangxi
Jinsha River
Nu River Wu River West Hunan
Lancang River Mainstream
Total capacity: 275772 MW Nanpan River, Hongshui River
45 * Includes mid to large scale power plants (≥50 MW)
South China Sea IslandsSelected Hydropower Planned
Relevant Listed
Hydropower Base River Region Station Installed
Company
Representative Capacity (GW)
Jinsha River Shigu – Yibin Xiluodu, Xiangjiaba 62.3 Company
Upstream of Yibin – Yichang, Three Gorges, Company, Hubei
28.8
Yangtze River Qingjiang Gezhouba, Shuibuya Energy
SDIC Power,
Yalong River Lianghekou – Jiangkou Ertan, Jinping 25.7
Chuantou Energy
SDIC Power,
Lancang River Yunnan Province Dachaoshan, Jinghong 25.1 Guangdong Electric
Power Development
Dadu River Xiaerxia – Tongjiezi Pubugou, Shenxigou 24.9 GD Power
Below Songta of Nu
Nu River 22.0
River to the border
Upstream of Yellow Ciha of Yellow River – Xiaoxia, Daxia,
20.9 SDIC Power
River Qingtong Valley Wujinxia
Huangni River,
Nanpan River, Guiguan Electric
Tiansheng Bridge – Longtan, Yantan 14.3
Hongshui River Power
Changzhou
Heilongjiang, Jilin and
Northeast Yunfeng, Weiyuan 13.3 GD Power
Liaoning
Fujian, Zhejiang and Fujian, Zhejiang and Mindong Electric
Xinan River 12.2
Jiangxi Jiangxi Power
Qianyuan Power,
Wu River Wu River – Hongjiadu Yinzidu, Pengshui 11.2
Datang Power
Xiangxi Xiang, Zi, Yuan, Lishui Dafutan, Sanjiangkou 10.8 Guangdong Shaoneng
North of Yellow
Togtoh – Tongguan Longmen 6.4
River
____________________
Source: NDRC, Haitong Securities Research Institute
There are different names for different parts of the Yangtze River. The upstream part of Yangtze River includes the part from river origin to Yichang, Hubei. The section from Yushu,
Qinghai to Yibin, Sichuan is called the Jinsha River and the section from Yibin to Yichang is called Chuanjiang. The section from Yichang to Hukou is the midstream of Yangtze River and
the section from Hukou to the estuary is referred to as the downstream of Yangtze River. 46IV. Basic Facilities of a Hydropower Station
1. Types of Hydropower Dams
Gravity Dam
As the name implies, a gravity dam uses its own weight and strength to contain
upstream water. The Three Gorges dam is a gravity dam. Gravity dams are
constructed in vertical sections, designed so that each section of the dam is
stable, independent of the other dam sections.
The advantages of a gravity dam are strength and stability; disadvantages include
higher cost and longer construction schedule.
Components of Three Gorges Hydropower Plant
Non- Right plant section Spillway section Left plant section Non-
overflow overflow
dam dam
Ship-lift
Power house Power house
Downstream
47Arch Dam
An arch dam is most suited to river canyons and gorges with steep walls of stable
rock to support the structure. Convex in shape, and built into the river bed and
into the rock walls on each side, an arch dam transfers the force of the upstream
water into its foundation and abutments, utilizing the natural strength of
geological formations for support. The stability of an arch dam therefore, unlike a
gravity dam, does not depend alone on the weight of the dam for support.
For example, while a gravity dam simply stands firm on the river bed, an arch dam
also has two hands holding firmly to the mountains on both sides. As a result, an
arch dam is generally lighter in structure than a gravity dam, and costs less to
build. But arch dams can only be constructed where specific geological conditions
permit.
The Xiluodu Dam and the Hoover Dam in the U.S. are arch dams.
Xiluodu Dam
Hoover Dam in the United States
482. Power House
The power house of a hydropower station is used to hold the hydro-generators, transformers, and
other generation equipment. There are different designs for power houses, including dam-toe
design, riverbed design and diversion type design based on its location.
Dam-Toe
The power house is located at the dam toe, i.e., the junction of the downstream face of a
dam with the river bed.
The Three Gorges and the Xiangjiaba Left Bank Hydropower Station are dam-toe style
hydropower stations.
Layout of Xiangjiaba Hydropower Station
Left bank dam-toe power house
Spillway section
Right bank irrigation water gate Dam Left bank irrigation water gate
Level 1 ship-lift
Right bank underground power house
49Riverbed Dam
Located on the riverbed, the power house is built as part of the dam structure on the
riverbed itself.
Gezhouba is a riverbed power station.
Layout of Gezhouba Hydro Power Station
Ship lock Riverbed power house
Spillway section
Spillway section Riverbed power house
Diversion Dam
The power house is typically located on the river bank, away from the dam, and is often
built underground at the point of water flow.
Both Xiluodu and Xiangjiaba Right Bank Hydropower Station's power houses are
underground design.
V. Major Electrical Equipment of a Hydropower Station
A hydropower station’s electrical equipment mainly includes water turbines, hydro generators,
main transformers, switching stations, and other related equipment.
Major Components of a Hydro Power Station
Power House
Switch Power
Generator Transformer
station grid
Water
Reservoir
diversion Turbine River
(river)
system
501. Water Turbine
A water turbine converts the energy of water flow into mechanical energy. There are two
basic types of turbines: Impulse and Reaction.
In an impulse turbine, water flow strikes the turbine blades directly, and kinetic force
pushes the blade to turn the turbine.
In a reaction turbine, the water flow is directed through the blades, creating differences in
water pressure that propel the turbine. Think of an airplane. When air passes over an
airplane’s curved wing, the air pressure above the wing is less than the air pressure below,
creating lift, and the airplane flies. This same principle is used to turn the airfoil-shaped
blades of a reaction turbine, aided by kinetic force of the water flow.
For large hydropower systems, the reaction turbine is often the most efficient. All CYPC
power stations use reaction turbines.
Structure of Francis Turbine
51Turbine Runner: Francis vs. Axial-flow Fixed Paddle
Francis turbine runner Axial-flow fixed paddle turbine runner
2. Power Generator
A power generator is converts mechanical energy into electrical power. The hydro-
generator is mounted on top of the water turbine and rotates synchronously with the
turbine.
3. Main Transformer
A main transformer raises the electric current of the generator to a higher voltage to
reduce losses during the power transmission process. The main transformer is located
between the generator and the switching station.
Structure of Main Transformer
52Switch Station
A switch station, located between the main transformer and the power grid,
is a high voltage circuit breaker that connects the power plant to the power
grid. Similar to the switching mechanism on a railroad, directing rail traffic to
the appropriate track, the switching station in a power plant directs the
electricity to the appropriate transmission lines for distribution.
Switch Station
53VI. Regulating Water Flow By Reservoir Dispatching
Reservoir dispatching is a fundamental and essential part of hydropower dam operations.
By utilizing the storage capacity of the dam’s reservoir and by controlling the discharge
volume of water through the dam, reservoir dispatching manages the consistency of water
flow to achieve multiple key purposes:
• Flood control
• Power generation
• Shipping
• Managing downstream water supply for residential, agricultural and industrial use
At the Three Gorges Dam, the reservoir water level ranges between 145 m and 175 m. In a
typical year, the water level of the Three Gorges reservoir is lowered to 145 m in early June to
provide flood storage capacity, allowing for greater accumulation of water during the rainy
season (June 10 – September 10) to reduce the potential for downstream flood.
On July 1, 2016, for example, with the reservoir level at 145 m, the water inflow of the Three
Gorges reservoir had risen to 50,000 m3/s. The discharge volume was lowered by 19,000
m3/s, to 31,000 m3/s, thereby reducing downstream flood risk, and the water level of the
Three Gorges reservoir rose. Later, when the water inflow from the Yangtze River diminished
below discharge volume, the water level of the reservoir declined once again to 145 m.
At the end of the flood period, generally in early September, when the water inflow from the
Yangtze River falls to 10,000 to 20,000 m3/s, the reservoir begins storing water. The water
level will normally reach 175 m by the end of October. Once the reservoir reaches capacity,
all of the water inflow will thereafter discharged throughout the dry season o maintain the
desired upstream and downstream water flow., gradually declining to 145 m by early June,
ready once again for the onset of the rainy season.
Three Gorges’ Monthly Average Reservoir Water Level
(m)
180 173 174 173
171
168 166
170
162
159
160 156
151
146 147
150
140
Jan Feb Mar Apr May Jun Jul Aug Sep Oct Nov Dec
54Water Level of Three Gorges and Xiluodu Reservoir
Three Gorges Xiluodu
Name
Water Level Storage Capacity Water Level Storage Capacity
(m) (bn m³) (m) (bn m³)
Water level for checking 180.4 45.0 608.9 12.8
Designed flood level 175.0 39.3 600.6 11.7
Normal water level 175.0 39.3 600.0 11.6
Upper water level for flood
175.0 39.3 600.0 11.6
control
Dropping water level during dry
155.0 22.8 / /
season
The flood control limit level 145.0 17.2 560.0 6.9
Dead water level 145.0 17.2 540.0 5.1
Beneficial reservoir capacity 16.5 6.5
Flood control capacity 22.2 4.7
55Reservoir Water Level Management
Water level for checking
Designed flood level
Upper water level for flood control
Normal water level Reservoir capacity for flood regulation
The flood control limit level
Spillway Flood control capacity
Total reservoir capacity
Dead water level Beneficial reservoir capacity
Drainage channel Dead reservoir capacity
Glossary of Terms
Dead water level
Also known as the designed lowest water level, representing the lowest water level allowed to drop for a
reservoir to operate in a normal condition
Flood control limit level
The upper water level for water retaining in a reservoir during the flood season and it also represents the
initial operation water level for a reservoir to be used for flood control during the flood season
Normal water level
It is the level to which water should be stored in order to begin supply water and to meet the requirements for
water conservancy under normal operating conditions for a reservoir
Upper water level for flood control
The highest water level when the reservoir encounters flood that meets the designed flood control standard
of downstream protected objects
Designed flood level
The highest water level when the reservoir encounters flood that meets the designed flood control standard
Water level for checking
The highest water level when the reservoir encounters the flood that requires checking. It is the temporary
upper water level allowed for flood control under the extraordinary operation condition of a reservoir, also a
key reference to determine the height of dam and to conduct dam safety check
Dead reservoir capacity
The storage capacity under the dead water level. The water volume of dead storage capacity is not intended
for use directly to adjust run-off water except in special conditions (such as during extreme draught)
Beneficial reservoir capacity
Storage capacity of a reservoir that is between the normal water level and dead water level, also known as
regulated storage capacity
Flood control capacity
Storage capacity of a reservoir that is between the upper water level for flood control and flood control limit
level
Reservoir capacity for flood regulation
Storage capacity of a reservoir that is between the water level for checking and the flood control limit level
Total reservoir capacity
Storage capacity of a reservoir that is under the water level for checking
56You can also read