Our Carbon Footprint - October 2012
←
→
Page content transcription
If your browser does not render page correctly, please read the page content below
Our Carbon Footprint

          October 2012
TEAM MEMBERS AND ACKNOWLEDGEMENTS

Research Team

 Desert Development Center                                   Office of Sustainability

 Richard Tutwiler, Director                                  Marc Rauch, Sustainability Coordinator,
 Tina Jaskolski, Research Coordinator                        Office of Sustainability
 Andrew Petrovich, Research Associate
 Paul Rau, Research Associate                                The Office of Sustainability is a division
 Shaymaa Hassan, Research Assistant
                                                             of the Office of the Vice President for
 Faiza Sadek, Student Research Assistant
 Laura Emberson, Student Research Assistant                  Planning and Administration

Acknowledgements

 We would like to extend special thanks to

 Eng. Mahmoud Gamal, Contracts Manager, Office of Facilities and Operations/Maintenance
 Mohamed Galal Hassan, Assistant Professor, Department of Petroleum and Energy Engineering
 Ashraf Salloum, Director Of Planning & Design, Office of Campus Planning and Design, and
 Hani Sewilam, Professor of Sustainable Development and Water Resources Management

 for their time, support and expert assistance in calculating AUC’s carbon footprint.

 Special thanks also to Ahmed Gaber and BadrKheir El-Dine of Chemonics Egypt for their invaluable
 assistance in calculating the energy needed to supply the university with water from the municipal
 transfer stations. Determining our carbon emissions from water use would not have been possible
 without their generous expert assistance.

 Thanks also to Ola Abdel Hamid Anwar, Manager of Institutional Surveys at AUC’s Institutional
 Research Office and Mahmoud Zouk, Executive Director for Public Safety at AUC’s Office for Public
 Safety for their help in drafting and conducting the Transportation Sustainability and Safety Survey
 2012, which provided valuable data for the carbon footprint project.

The Desert Development Center (DDC)
The DDC is a non-profit research center established by the American University in Cairo in 1979. The
center’s mission is the ecologically, socially, and economically sustainable development of Egypt’s
communities. The center conducts research and offers training and community services.

The Office of Sustainability
The Office of Sustainability, headed by a Sustainability Coordinator, was established in September, 2011.
The Office is responsible for addressing AUC’s environmental challenges, including climate change,
pollution, waste management and resource conservation, in ways that improve the university’s operations
and strengthen its finances.

                                                                                                          2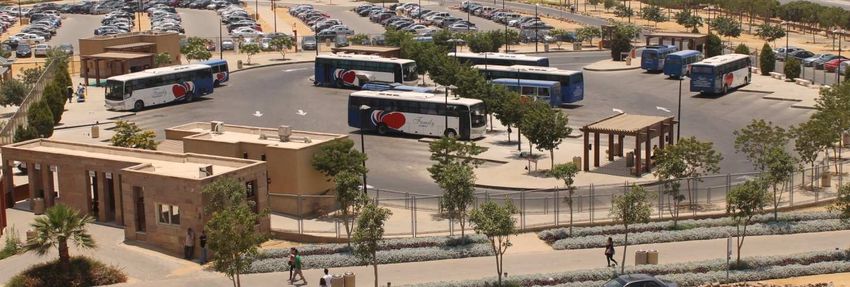
MESSAGE FROM THE PRESIDENT

With the establishment of its Office of Sustainability in September 2011, the American University in
Cairo reaffirmed its commitment to environmentally-responsible economic growth and stewardship of the
earth’s resources. Since the creation of the Desert Development Center more than three decades ago,
AUC has championed what would become known as sustainable development and today, with the
publication of the first Carbon Footprint Report by a university in the Middle East and North Africa, we
challenge ourselves and our communities to measure our impact and manage it responsibly.

Egypt’s special vulnerability to the effects of climate change and its rising per capita carbon emissions
make it a particularly opportune time to address this crucial component of sustainability. We at AUC
believe that having a meaningful impact on climate change starts at home, with calculation of our own
carbon footprint. This project represents the first attempt in the region to measure a university’s impact on
climate change. It not only enables AUC to work on the reduction of greenhouse gas emissions on its
own campus, but to serve as a model and a challenge, encouraging others to address climate change as
well.

Preparation of this report was an interdisciplinary effort, drawing on talent from across the university,
including faculty in engineering, students in public policy and in science, and administrative staff from a
variety of departments, from facilities and maintenance to institutional research. The report includes 17
specific recommendations for reducing AUC’s carbon footprint; in the coming months, we will be
developing community conversations about how to assess and apply those recommendations.

I would like to thank all those who worked with Marc Rauch, the Sustainability Coordinator and Richard
Tutwiler, the Director of the Desert Development Center, in developing this ground-breaking report, and
hope that it will be model for future efforts at AUC and universities across Egypt and the region to ensure
that we all recognize our responsibilities to be trustworthy stewards of the Earth’s resources.

Lisa Anderson

President

The American University in Cairo

September, 2012

                                                                                                           3
Table of Contents
TEAM MEMBERS AND ACKNOWLEDGEMENTS ................................................................................ 2
MESSAGE FROM THE PRESIDENT ......................................................................................................... 3
EXECUTIVE SUMMARY ........................................................................................................................... 5
1. INTRODUCTION ..................................................................................................................................... 7
1.1 Why Do a Carbon Footprint Study at AUC?....................................................................................... 7
1.2 Greenhouse Gas Emissions in Egypt and the MENA Region ............................................................. 8
1.3 University Overview ........................................................................................................................... 9
1.4 AUC’s Central Utility Plant and Co-Generation ................................................................................. 9
2. OVERALL METHODOLOGY AND ORGANIZATION OF REPORT ............................................... 11
2.1 Reference Carbon Calculator ............................................................................................................ 11
2.2 Boundaries ......................................................................................................................................... 12
2.3 Calculations ....................................................................................................................................... 12
2.4 Organization of Balance of Report .................................................................................................... 13
3. HEATING, VENTILATION, AIR CONDITIONING (HVAC) AND DOMESTIC HOT WATER ..... 13
3.1 Summary ........................................................................................................................................... 13
3.2 Electricity for HVAC ........................................................................................................................ 14
3.3 Chilled / Hot Water ........................................................................................................................... 15
3.4 Water Consumption for HVAC ......................................................................................................... 16
4. TRANSPORTATION ............................................................................................................................. 17
4.1 Summary ........................................................................................................................................... 17
4.2 Commuting by Bus and Car .............................................................................................................. 19
4.3 University Fleet ................................................................................................................................. 20
4.4 Air Travel .......................................................................................................................................... 21
5. ELECTRICITY FOR LIGHTING AND EQUIPMENT (OTHER THAN HVAC) ............................... 23
5.1 Summary ........................................................................................................................................... 23
5.2 Emissions........................................................................................................................................... 24
6. PAPER USE ............................................................................................................................................ 24
7. WATER SUPPLY (OTHER THAN WATER USED FOR HVAC) ...................................................... 24
8. MISCELLANEOUS OTHER SOURCES .............................................................................................. 25
8.1 Summary ........................................................................................................................................... 25
8.2 Solid Waste Disposal......................................................................................................................... 26
8.3 Fertilizer Application ........................................................................................................................ 27
8.4 Refrigerant Leakage .......................................................................................................................... 28
8.5 Natural Gas for Domestic and Lab Use ............................................................................................. 29
9. CARBON OFFSETS............................................................................................................................... 29
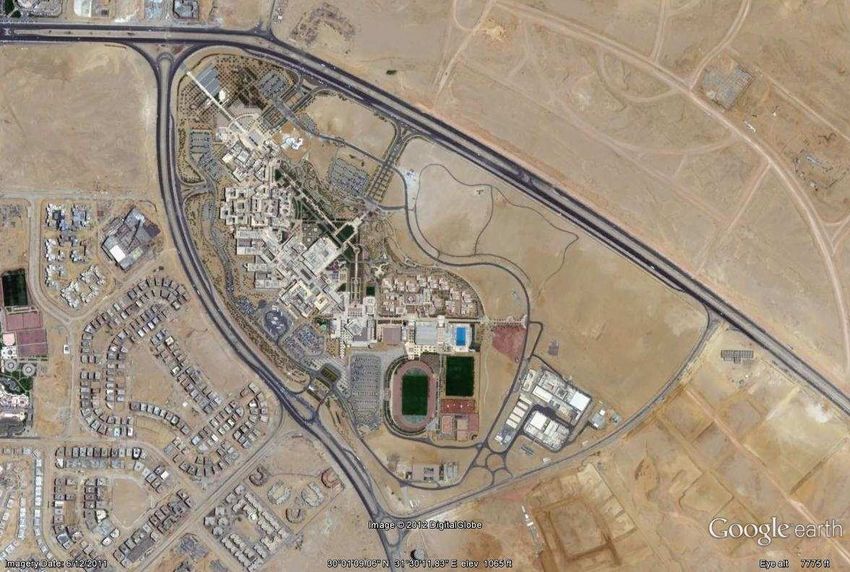
9.1 Reducing CO2 Emissions through Co-Generation ............................................................................. 30
9.2 Sequestering CO2 through Landscaping ............................................................................................ 31
10. AUC’s CARBON FOOTPRINT COMPARED TO OTHER UNIVERSITIES ................................... 32
11. RECOMMENDATIONS FOR REDUCING OUR CARBON FOOTPRINT ...................................... 33
REFERENCES ............................................................................................................................................ 34
APPENDIX 1: Campus Maps ..................................................................................................................... 35
APPENDIX 2: Electricity Emission Factor Calculations ........................................................................... 37
APPENDIX 3: Heated and Chilled Water Emission Factor Calculations................................................... 39
APPENDIX 4: AUC Transportation Safety and Sustainability Survey 2012 ............................................. 40
APPENDIX 5: Water Supply Delivery Path and Energy Calculation Example ......................................... 43
4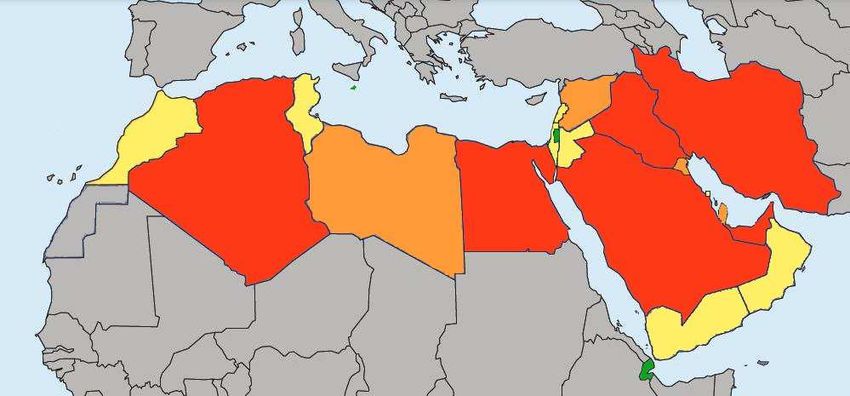
EXECUTIVE SUMMARY

Carbon footprints are a widely accepted method of measuring the impact of human activity on climate
change. A university’s carbon footprint is the annual total of carbon dioxide (CO2) and other significant
greenhouse gases emitted into the atmosphere as a result of daily activities and campus operations.
Carbon footprints are commonly measured in metric tons of carbon dioxide equivalents (MTCO2e). The
impetus to calculate AUC’s carbon footprint came from three overlapping concerns: first, the growing
scientific consensus that climate change is real and potentially catastrophic; second, the University’s
commitment to innovative research in the field of sustainability; and third, the desire to make AUC’s
operations more sustainable.

Figure 1: AUC’s Carbon Footprint, Fiscal Year 2011.

                                                                                                       5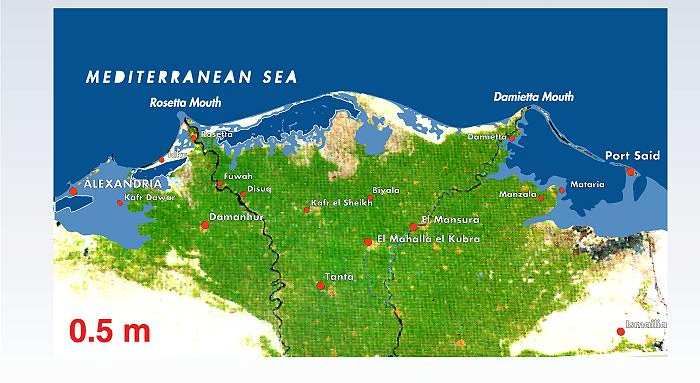
This study calculates the carbon footprint for AUC’s New Cairo campus, where the bulk of the
University’s activities now take place. It covers AUC’s Fiscal Year 2011 (FY 2011), which ran from
September 1, 2010 through August 31, 2011. FY 2011 will serve as the baseline from which all future
changes to AUC’s carbon footprint will be measured. The main activities contributing to AUC’s carbon
footprint (see Box 1), namely heating, ventilation and air conditioning (HVAC) and domestic hot water,
transportation, lighting and use of electrical equipment, paper use and water supply, are shown in Figure
1, together with the percentage contribution of each to the carbon footprint.

Box 1: The Key Contributors to the Footprint
Nearly 90% of AUC’s carbon footprint is attributable to three activities: (1) heating, ventilation and air
conditioning (commonly known as “HVAC”) and domestic hot water; (2) commuting; and (3) lighting
and use of other electrical equipment (see Figure 1).
HVAC
More than 40% of the carbon footprint results from HVAC. Not surprisingly, given that the campus is
located in a desert climate where air conditioning is needed more than half the year, the vast majority of
these CO2 emissions are caused by air conditioning. There is simply no way to significantly reduce
AUC’s carbon footprint unless we find more efficient ways to air condition the campus.
Commuting
More than 27% of the carbon footprint can be traced to commuting by bus and car. Again, this is hardly
surprising since thousands of AUCians now commute daily from all over Greater Cairo to AUC’s New
Cairo campus 35 km east of Downtown. Developing more sustainable modes of commuting is a must if
we are to significantly reduce our carbon footprint.
Lighting
More than 21.5% of the carbon footprint results from lighting and from the use of office and other
electrical equipment on campus. Simply put, if we are serious about reducing our carbon footprint, we
must learn to turn off the lights.
Paper
The use of paper contributes 3.24% to the carbon footprint. Unfortunately, recycled paper for office use
is not yet locally available in Egypt. Although we have greatly reduced paper consumption since moving
from Downtown, we need to cut our paper use further.
Water
Just over 2% of AUC’s carbon footprint is caused by water use, 0.41% for HVAC and the remaining
1.64% for domestic use and irrigation. Given the unique geography of Egypt, where for millennia the
very possibility of life has depended on proximity to the Nile, no study of AUC’s carbon footprint
would be complete without examining the CO2 emissions resulting from transporting AUC’s water from
its source, the Ismailia Canal 54 km away, and up inclines totaling more than 300 meters to the New
Cairo campus. Not only to reduce our carbon footprint but because water scarcity is a looming threat to
Egypt, we must do a better job of conserving water.

The paths to reducing AUC’s carbon footprint are clear. In the report that follows, we set forth the
methodology, sources of data and assumptions that underlay our findings, and we propose specific,
concrete steps that we can take to reduce our carbon footprint.

                                                                                                         6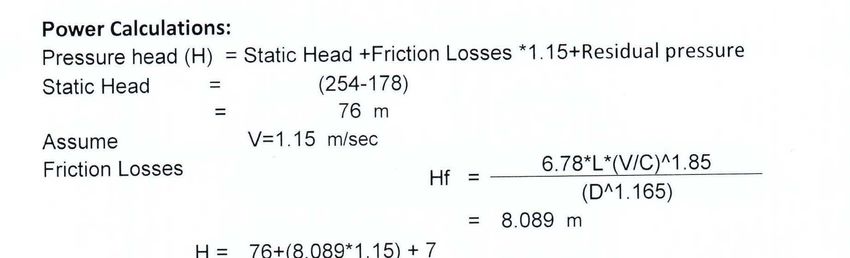
1. INTRODUCTION

1.1 Why Do a Carbon Footprint Study at AUC?1
Of all the countries in the Arab world, Egypt is the most vulnerable to global warming. The rising sea
level predicted by climate change models threatens to flood large swaths of the Delta, Egypt’s
breadbasket (see Figure 2), undermining Egypt’s food security and threatening the livelihoods of millions
of agricultural workers. Key population centers are also at risk, most notably the cities of Alexandria and
Port Said. Additionally, rising mean temperatures will have a negative impact on Egypt’s ability to grow
enough food to feed its burgeoning population, causing further disruptions in the agricultural sector that
presently employs over 30% of the workforce. Not least among the threats is the potential impact on
rainfall patterns in highland Ethiopia, the source of over 80% of the Nile River flow reaching Egypt.
Given Egypt’s near total dependence on the Nile for its fresh water, either a reduction in average
precipitation or a greater variation in annual rainfall in Ethiopia would seriously challenge the
sustainability of Egyptian society.

Displaced population: 3,800 000                                 Displaced population: 6,100 000
Lost cropland: 1,800 km²                                        Lost cropland: 4,500 km²

Figure 2: Potential impact of sea level rise: Egypt’s Nile Delta.
Sources: Simonett (UNEP/Grid), Sestini (Remote Sensing Center) and DIERCKE Weltwirtschaftsatlas.

The potentially stark consequences of climate change for Egypt led The American University in Cairo to
undertake the first carbon footprint study of an institution of higher education in the Middle East and
North Africa (MENA). The study also responds to a concern about the sustainability of AUC’s own
operations after the University moved most of its activities from a small 90-year-old campus in
Downtown Cairo to a new 260-acre campus in the sprawling desert suburb of New Cairo, about 35 km to
the southeast of the Downtown campus.

Carbon footprints are widely used as a measure of the impact of human activities on global warming.2 A
carbon footprint calculates net greenhouse gas (GHG) emissions over time, typically one or more years.
The World Resources Institute describes the term as “a representation of the effect you, or your
organization, have on the climate in terms of the total amount of greenhouse gases produced (measured in

1
  Portions of Section 1.1 appeared initially in Tutwiler, R. and Rauch, M., "Our Carbon Footprint", The Cairo Review of Global
Affairs, Spring, 2012, pp. 12-15.
2
  A recent high-level survey of sustainability indicators concluded that carbon footprints remain a powerful tool, “capable of
sending strong messages in terms of the overutilization of the planet’s capacity for absorption” (Stiglitz et al., 2010, p.113-116).

                                                                                                                                  7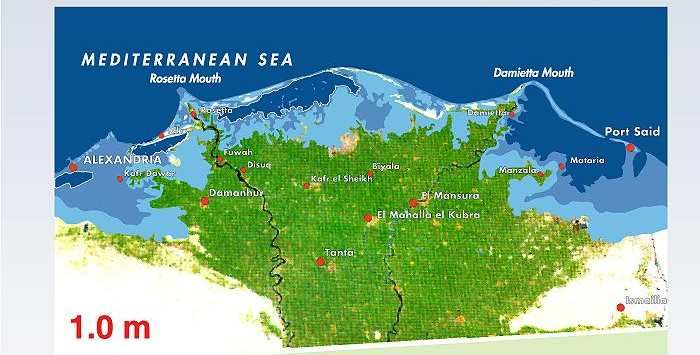
units of carbon dioxide)”.3 A carbon footprint offers a means to identify carbon emission sources, and to
evaluate progress in the reduction of these emissions. In AUC’s case, a principal goal of the study is to
develop information that can be used to mitigate climate change by reducing AUC’s own greenhouse gas
emissions. A second important goal is to strengthen the University’s finances for the long term by
permanently reducing its appetite for carbon-based energy sources like natural gas, electricity, gasoline
and diesel fuel that must be purchased from third parties. Finally, our footprint study is designed to
provide a replicable model and methods that can be adopted by other institutions of higher education in
the MENA region to calculate and evaluate their own carbon emissions.

1.2 Greenhouse Gas Emissions in Egypt and the MENA Region
The principal activities generating Egypt’s carbon emissions on the macro level are broadly comparable
to AUC’s, in that just over 40% of Egypt’s total emissions come from two sectors: power generation and
road transport. This is comparable to other MENA countries (see Box 2), particularly those with a
significant hydrocarbon (petroleum and natural gas) sector. In Egypt, the proportional shares of emissions
from power, road transport, and basic industry are expected to increase, while the proportional
contributions from agriculture, solid waste, and construction should decrease.4

    Box 2: Carbon Emissions in the Middle East

    Egypt’s national greenhouse gas (GHG), or carbon,
    emissions profile is broadly similar to those of its
    neighbors. With an estimated total emissions of around
    318.2 million metric tons of CO2e (carbon equivalent) in
    2010, Egypt is among the highest in total emissions.
    However, its per capita emissions, given Egypt’s large
    population of more than 85 million inhabitants, are less
    than half the regional average. Qatar heads the list of the
    world’s highest per capita carbon emitters, while
    Kuwait, the Emirates and Bahrain occupy ranks three,
    four and five; Saudi Arabia ranks14th on the same list,
    while Egypt, at about 2.8 tons per person, ranks 124th.
    Nevertheless, predictions are for Egypt’s emissions to        MENA annual CO2 emissions per country (thousand metric tons).
    increase at a faster pace than population growth: by the               0-4,999;          5,000-49,999;              50,000-99,999;
    year 2030 Egypt’s total emissions will have more than
    doubled and Egypt’s share of world emissions will grow                 100,000-550,000
    by 50%.
                                                                  Source: United Nations Statistics Division. (2008).
    Source: Carboun Group, 2011; EEAA, 2012.

The obstacles to reducing emissions in Egypt and the region include arid to hyper arid desert ecosystems,
lengthy summers with extreme temperatures, rapid urbanization and the limits of prevailing technologies.
In Egypt, the potential for lowering emissions or at least reducing the rate of growth in emissions is
slightly lower than in comparable developing economies because gains have already been made in the
power generation sector: Egypt already has a high proportion of natural gas-fired power plants and uses
no coal-fired plants. Overall, the best strategy may be to lower consumer demand for electricity in
buildings, while developing more power generating capacity from renewable sources, particularly wind
and solar energy. 5

3
  World Resources Institute (WRI), SafeClimate, http://www.safeclimate.net/calculator/, viewed in November 2011.
4
  Industrial Modernization Center (IMC, Egypt). 2010. “Egypt GHG emissions reduction strategy”
www.imc-egypt.org/studies/Egypt GHG Emissions Reduction Strategy.pdf.
5
  Ibid.

                                                                                                                                         8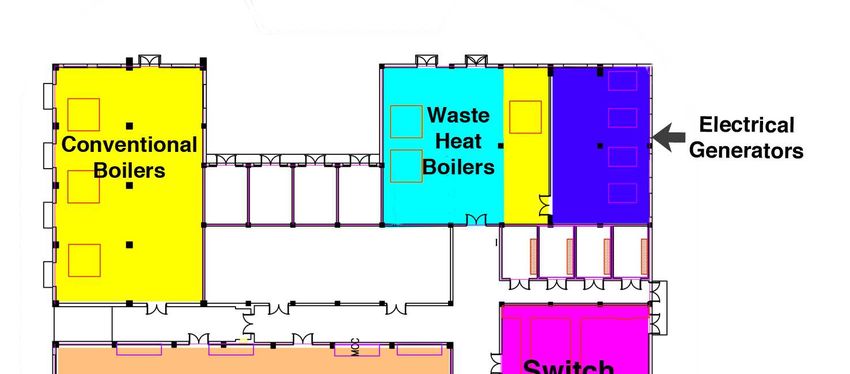
1.3 University Overview
The American University in Cairo (AUC) was founded in 1919 as a liberal arts college offering quality
American-style education to Egyptians and other students in the MENA region. AUC is also dedicated to
community service and promoting sustainable development. In September 2008, the University moved
the bulk of its operations from its original five acre central Cairo campus on Tahrir Square to an all-new,
state-of-the-art 260 acre campus in New Cairo. The amount of built space jumped from 68,000 m2 to
203,000 m2. In the past five years, the University’s operating budget has more than doubled, and the
student, faculty, and staff head counts have increased considerably. In short, the University’s activities are
expanding to capitalize on its new facilities and achieve its long-term strategic goals.

In Fiscal Year 2011 (September 1, 2010 – August 31, 2011), the University’s operating budget was
US$160.5 million, including an energy budget of US$6 million and a research budget of US$8.7 million.
Table 1 below shows the New Cairo campus population in FY 2011:

Table 1: AUC student body in FY 2011
               Full-Time Students                                                            5,321
               Part-Time Students                                                            1,232
                     Faculty                                                                  838
                      Staff                                                                  2,198
                      Total                                                                  9,589
   Total Full-Time Equivalent (FTE) Students6                                                5,937

1.4 AUC’s Central Utility Plant and Co-Generation
Since nearly two thirds of AUC’s greenhouse gas emissions can be traced to heating, ventilation and air
conditioning (HVAC), domestic hot water, and use of lighting and other electrical equipment (See Figure
1), a basic understanding of how these vital services and utilities are delivered to the New Cairo campus
is crucial for understanding AUC’s carbon footprint. In 2006, as part of the construction of the New Cairo
campus, AUC entered into a long-term contract with The Egyptian Company for Refrigeration by Natural
Gas (GasCool) to build and operate an on-campus central utility plant.7 The plant, which has a floor area
of some 5,781 m² (62,226 ft²) and is illustrated schematically in Figure 3, produces all of the chilled water
used for air conditioning campus buildings8, all of the hot water used for heating, most of the domestic
hot water9 and two thirds of the electricity10 used on campus.

The design of AUC’s central utility plant is environmentally friendly in two important respects. First, the
fuel used is natural gas, a relatively clean-burning (albeit hydrocarbon-based) fuel that is extracted
domestically from abundant reserves in Egypt. Second, the plant uses co-generation, a process of
capturing and recycling waste heat from generating electricity, to produce a significant portion of the hot
water used on campus for heating and domestic hot water.

6
  Includes full-time students and part-time students representing half of one full-time student.
7
   GasCool later subcontracted operation of the electricity-generating portion of the plant to Kahraba, also known as the
National Electricity Technology Co.
8
  A few specialized areas, e.g. the rare books section of the library, are served by stand-alone air-cooled air conditioning units.
9
   In locations where demand for domestic hot water is relatively light, e.g. hot water taps in bathrooms in campus office
buildings, hot water is supplied by stand-alone electric hot water heaters.
10
    The remaining electricity is obtained from the public utility (Egyptian Engineering Agencies or EEA), as discussed further
below.

                                                                                                                                 9
Figure 3: Schematic Diagram of the Central Utility Plant
                        on the AUC Campus.

1.4.1 How the Utility Plant Works

Chilled Water for Air Conditioning

Chilled water is produced by five gas-fired absorption chillers, shown in Figure 3. Natural gas is burnt to
drive compressors that remove accumulated heat from circulating water, in a process not unlike what
occurs in a home refrigerator but on a larger scale. Waste heat produced by the gas-fired chillers is
released through evaporation of water from six cooling towers shown adjacent to the gas-fired chillers in
Figure 3. The cooling towers are shown in Figure 14.

Electric pumps (also shown in Figure 3) circulate the chilled water to a system of 150 electric-powered air
handling units throughout the campus. The air handling units effectively convert chilled water to cool air,
which is then circulated to air conditioned zones within campus facilities by a system of more than 1,200
electric-powered VAV (variable air volume) units.

Hot Water for Heating and Domestic Hot Water

Four conventional boilers (shown in yellow in Figure 3) and two waste heat boilers (shown adjacent to
the electricity generators in Figure 3) produce hot water for heating and for domestic hot water. The four

                                                                                                        10
conventional boilers heat water by burning natural gas. Each of the waste heat boilers, by contrast, heats
water by using hot exhaust fumes from a gas-fired electricity generator. This is the co-generation process
referred to previously. Hot water produced by the gas-fired boilers and the waste heat boilers is circulated
to individual facilities throughout the campus by electric pumps, then converted to hot air for heating or
used for domestic hot water, in each case by means of additional pumps and other electrical equipment.
Electricity – Principal Uses
It is presently estimated that half11 of all electricity used on campus in FY 2011 was used for HVAC:
electricity drives pumps circulating chilled water and hot water throughout the campus for air
conditioning, heating and domestic hot water, and it also powers air handling units, VAV units,
ventilation equipment and other electrical equipment that is part of the HVAC system. The balance of the
electricity used on campus (i.e. the approximate half of all electricity not used for HVAC) is used for
lighting, office equipment and many other types of electrical equipment.
Electricity – From Two Sources
Approximately two thirds of the electricity used on campus in FY 2011 was produced by three of the four
gas-fired electricity generators shown in Figure 312. As noted above, two of these gas-fired electricity
generators feed their exhaust fumes to waste heat boilers for co-generation.13 The remaining one third of
the electricity used on campus in FY 2011 was obtained from EEA, the public utility. The decision
whether to use electricity from the on-site electricity generators, from the public utility or from both
simultaneously depends on the size of the demand for electricity on campus, on the amount of electricity
then available from each source, and on the cost per kilowatt hour from each source. The electric switch
gear shown in Figure 3 continually enables technicians to adjust the amount of electricity consumed by
AUC from each source.
2. OVERALL METHODOLOGY AND ORGANIZATION OF REPORT
2.1 Reference Carbon Calculator
AUC’s emission calculations are premised on the methodology used by the Clean Air – Cool Planet
Carbon Calculator (CA-CPCC).14 CA-CPCC is widely used by other universities and time-tested. CA-
CPCC is an Excel-based workbook capable of quantifying an annual aggregate carbon footprint. Once
data is collected, verified and formatted into proper units for entry, the software calculates emissions of
carbon dioxide, methane and nitrous oxide, the three most commonly reported GHG emissions. The CA-
CPCC spreadsheets in turn are based on workbooks and protocols provided by the Intergovernmental
Panel on Climate Change (IPCC), the GHG Protocol Initiative and the Climate Registry.
CA-CPCC had to be modified and supplemented for use at AUC. For example, as discussed more fully
below, the AUC team had to identify and construct a number of emission factors specific to Egypt, to
Cairo and even to processes occurring uniquely at AUC’s central utility plant. Moreover, CA-CPCC does
not account for carbon emissions attributable to water supply, an issue of significant concern in an arid
11
The conclusion that approximately half of all electricity used on campus was used for HVAC is based on preliminary surveys,
in selected buildings on campus, of electricity used for HVAC equipment as a proportion of electricity used for all purposes.
12
The fourth generator was added at the start of FY 2012.
13
See discussion of co-generation as a carbon offset in Section 9.1 of this report.
14
Clean Air-Cool Planet was established in 1999 as a non-profit organization and has published several versions of its carbon
calculator software. To date more than 1,000 universities in North America have used CA-CPCC to calculate their carbon
footprints. CA-CPCC is also the calculator most commonly used by signatories to the American College and University Presidents
Climate Commitment (ACUPCC). Additionally, most of AUC’s peer institutions have relied on CA-CPCC.
11country like Egypt. Ultimately, the AUC team used CA-CPCC as a guide for constructing AUC’s own
calculator based on methodologies substantially similar to CA-CPCC’s, rather than using the CA-CPCC
worksheets as such. Whenever possible, however, this carbon footprint report uses categories and
methods of analysis similar to those used by CA-CPCC to facilitate comparisons with the other schools
also relying on CA-CPCC.
2.2 Boundaries
This report focuses exclusively on the New Cairo campus where the bulk of the University’s operations
now take place.15 AUC’s original historic campus in Tahrir Square, as well as smaller remote or satellite
facilities, have accordingly been excluded from this analysis.
2.3 Calculations
This report accounts for three of the six main greenhouse gases (GHGs): Carbon Dioxide (CO2), Methane
(CH4) and Nitrous Oxide (N2O). The main unit of measure is metric tons (MT) of carbon dioxide
equivalents (CO2e), which is the most widely used reporting method (see Box 3).16 Carbon dioxide
equivalents of CH4 and N2O are based on the global warming potential (GWP) of each gas – which
compares the amount of heat trapped by a similar mass of carbon dioxide. Methane has a GWP of 21 and
nitrous oxide has a GWP of 310 over a 100 year interval.17 Carbon dioxide equivalents (CO2e) are used
here to express the relative global warming impact of each of the three greenhouse gases through a single
unit of measure. The principal formula used in this report for calculating equivalents is as follows:
Consumption of Energy (unit) x Emission Factor (unit CO2e/unit of energy) = Units of CO2 Equivalent
Box 3: What does 1 metric ton of carbon dioxide look like?
In order to visualize a metric ton (MT) of carbon dioxide (CO2), see the box diagram below.
1 MT of CO2 in its gaseous form as it is found in the atmosphere would amount to approximately 557 m³,
represented here by a cube of 8.23 m length per side. The small stick figure was placed in the cube for
scale comparison – it has the height of an average Egyptian
adult male.
Sources:
Egypt – Demographic and Health Survey, 2008
Calabrese, 2010
World Bank, 2011
15
By way of example, in FY 2011 91% of the energy consumed by the university as a whole was consumed at the New Cairo
campus.
16
See Box 1 for description.
17
Global Warming Potentials, http://unfccc.int/ghg_data/items/3825.php.
122.4 Organization of Balance of Report
Sections 3 through 7 of this report analyze the number of metric tons of carbon dioxide equivalent
resulting from each of the principal activities at AUC giving rise to carbon emissions, in descending order
by amount of emissions: (1) HVAC, (2) transportation, (3) elelectricity
ectricity used for lighting and equipment, (4)
paper use and (5) water supply. Section 8 analyzes the smaller, but still significant, carbon emissions
resulting from miscellaneous other activities on campus. The detailed analysis of emissions in Sections 3
through 8 is followed in Section 9 by an analysis of AUC’s carbon offsets resulting from co co-generation
and landscaping. The final two sections of the report, Sections 10 and 11, compare AUC’s emissions to
those of other universities and offer 17 specific recommendations for reducing AUC’s carbon footprint.
3. HEATING, VENTILATION, AIR CONDITIONING (HVAC) AND DOMESTIC HOT WATER
3.1 Summary
As shown above in Figure 1, more than 40% of AUC’s carbon emissions are attributable to heating,
ventilation and air conditioning (HVAC), and domestic hot water. These vital services are produced by
using electricity, natural gas and water in various proce
processes occurring at the central utility plant.
plant
Electricity is used to power pumps circulating chilled water throughout the campus for air conditioning
and pumps circulating hot water throughout the campus for heating and domestic hot water. Electricity is
also used to power air handling units, variable air volume (VAV) units and other equipment required to
operate and regulate the HVAC system.
Chilled water for air conditioning (AUC’s biggest energy user and source of carbon emissions given
Cairo’s hot climate18) is produced by gas
gas-fired
fired chillers at the central utility plant. The waste heat given off
by the gas-fired
fired chillers is removed by a circulating water system that releases the waste heat from six
cooling towers through evaporation of water (see Figure 4).. This process alone accounts for more than
20% of AUC’s total water use during the hot summer months (s (see Section 3.4).
Hot water for heating and domestic hot water is produced in one of two ways. Whenever possible,
exhaust fumes from gas-fired electricity
ricity generators are used to heat water in waste
waste-heat
heat boilers (a process
known as co-generation).
generation). When the waste heat boilers are not sufficient for producing the volume of hot
water required, additional hot water is produced in conventional, gas
gas-driven boilers.
Figure 4: Cooling towers forming part of AUC’s air
conditioning system. Note the plainly visible water evaporation.
18
A recent New York Times article reported that Cairo has nearly twice as many “cooling degree days” (a common measure of
the need for air conditioning) as Tokyo and nearly three times as many cooling degree days aass New York City (Rosenthal, 2012).
133.2 Electricity for HVAC
3.2.1 Emissions
In FY 2011, the University emitted an estimated 7,045.59 MT CO2e through the consumption of
electricity from the Cairo grid (Egyptian Engineering Agencies or EEA) and an estimated 17,104.38 MT
CO2e from electricity consumed from the central utility plant. Out of the total emissions from the
consumption of electricity, 24,149.96 MT CO2e, an estimated 50% or 12.074.98 MT CO2e resulted from
operation of the HVAC system.19
Emissions from Electricity
(Total) 17104
18000 71%
16000
14000
12000
MT CO2e
10000 7046
8000 29%
6000
4000
2000
0
EEA Central Utility Plant (GasCool/Kahraba)
Source
Figure 5: Emissions from electricity from the grid (EEA) and the central utility plant.
3.2.2 Consumption
The University consumed 14,005,600 kWh of electricity from EEA (Cairo electricity grid) and
27,900,000 kWh from its own central utility plant.
3.2.3 Methodology
In order to calculate the emission factor for the Cairo grid it was necessary to determine emission factors
for the energy inputs used to create the electricity. In the Cairo Zone, the fuel mix is 83.8% natural gas
and 16.2% mazout (high density fuel oil).20 The efficiency of electricity production is 42.59% (weighted
average among the seven Greater Cairo generating facilities). The central utility plant uses 100% natural
gas and produces electricity at 32.98% efficiency. We calculated emission factors for the Cairo grid using
the following formula:21
(Emission FactorNatural Gas * % Natural Gas) + (Emission FactorMazout * % Mazout)
Emission Factorgrid =
Efficiency
19
See Section 1.4.1.
20
EEA Annual Report Fiscal Year 2011.
21
UNFCCC/CCNUCC, EB 61 Report, Annex 12, Version 02.2.0, 2011.
14The formula was modified for the electricity coming from the central utility plant, since no mazout is
used. We used the same formulas for CH4 and N2O emissions.22
3.2.4 Data Sources
Data on electricity consumption was provided by AUC’s Office of Facilities and Operations/Maintenance
and EEA.
3.2.5 Emission Factors23
Source Mass Emissions (kgCO2e/kWh)
EEA 0.503055231
GasCool/Kahraba 0.613060036
3.3 Chilled / Hot Water
3.3.1 Emissions
The University emitted an estimated 10,135.56 MT CO2e from the production of chilled water for air
conditioning and the production of hot water for heating and domestic hot water (see Figure 6). Most of
these emissions result from air conditioning. Of the total emissions, 9,436.46 MT CO2e can be attributed
to chilled water consumption, the remaining 699.10 MT CO2e to the consumption of hot water. Through
co-generation, much of the hot water used for heating and domestic hot water is produced from waste heat
in special waste heat boilers that do not generate additional carbon emissions. Without co-generation,
production of hot water for heating and domestic hot water would have resulted in an additional 1,438.09
MT CO2e of carbon emissions in Fiscal Year 2011.24
Emissions from Chilled and Hot
Water Production
9436
10000 93%
8000
MT CO2e
6000
4000
699
2000
7%
0
Chilled Water Hot Water
Figure 6: Emissions from chilled and hot water production.
22
See Appendix 2 for calculations.
23
Constructed values, see Appendix 2.
24
See discussions of co-generation in Sections 1.4.1 and 9.1.
153.3.2 Consumption
In total, the University consumed energy equivalent to 45,362,434.35 kWh for chilled and hot water
produced by chillers and conventional boilers at the central utility plant. Of the total, 36,404,084.00 kWh
are attributable to chilled water, the remaining 8,958,350.35 kWh to hot water.25
3.3.3 Methodology
We constructed emission factors for the production of chilled water by gas-fired chillers and hot water by
gas-fired (conventional) boilers at the central utility plant (see Appendix 3 for calculations).
3.3.4 Data Sources
We obtained data on chilled and hot water use from the Office of Facilities and Operations/Maintenance.
3.3.5 Emission Factors26
Source Mass Emissions (kgCO2e/kWh)
GasCool (Chilled Water Production) 0.259214359
GasCool/Kahraba (Hot Water Production) 0.238568968
3.4 Water Consumption for HVAC
3.4.1 Summary
The gas-driven chillers that produce chilled water for air conditioning generate enormous amounts of
waste heat. The waste heat is dissipated through a circulating water system that releases it from six
cooling towers through the evaporation of water. The consumption of water for HVAC increases
considerably during the summer months, exceeding, at times, 20% of the University’s total monthly water
use (see Figure 7).27 We calculated28 carbon emissions resulting from the consumption of water for air
conditioning separately and added these emissions to the total for HVAC.
Monthly Proportion of HVAC Water of Total Water
Consumption, FY 2011
Monthly Water Consumption [m3]
120000
100000
80000 Total Water
60000 HVAC Water
40000
20000
0
Figure 7: Monthly proportion of water used for HVAC of total water consumption in FY2011.
25
Converted values from ton-hours (refrigeration), http://www.unitconversion.org/energy/.Because much of the hot water is
produced through co-generation, these figures are not equivalent to the emissions figures presented in Figure 6.
26
See Appendix 3 for calculations.
27
In FY 2011, the university consumed a total of 175,731 m³ of water for HVAC. This amount represents an average of 20% of
the campus’s total water consumption, which amounts to 883,741 m³.
28
See Section 7 and Appendix 5.
163.4.2 Emissions
Out of a total of 1133.00 MT CO2e of emissions attributable to water supply, 225.30 MT CO2e of
emissions, or 20%, are attributable to water use for HVAC. The remainder of the emissions related to
water supply is attributable to other water uses such as consumption of domestic water and irrigation (see
Figure 8).
For details on Non-HVAC water use, methodology, data sources and emission factors see Section 7.
Water Use Emission Distribution
1000 908
80%
900
800
700
600
MT CO2e
500
400
225
300
20%
200
100
0
HVAC other
Figure 8: Distribution of water use emissions.
4. TRANSPORTATION
4.1 Summary
More than 27% of AUC’s carbon emissions in FY 2011 can be attributed to commuting to the New Cairo
campus by bus or car. By moving its main operations from Downtown Cairo to the satellite city of New
Cairo, located approximately 35 km from the city center, AUC has significantly increased the distances
traveled by its faculty, students and staff to reach its campus. Fewer than 8% of the 2,036 respondents to
the online Transportation Sustainability and Safety Survey carried out in the spring of 2012 live in New
Cairo. The largest contingents of AUCians live in Heliopolis and Maadi, followed by Nasr City, Zamalek,
Mohandessin and Giza (see Figure 9). In order to reach the New Cairo campus and return home in the
evening, AUCians travel an average of 65 km each day.
17Commuting Locations & Distances for AUC Community
20 80
18
Percentage of Survey Respondents [%]
70
16
60
14
One-Way Distances [km]
12 50
% of
10 40
Commuters
8 30 Distance
6
20
4
2 10
0 0
Maadi
Dokki/Agouza
Shubra
Heliopolis
Giza/Haram
Moqattam
6th October
New Cairo
Zamalek
Nasr city
Mohandessin
Downtown
El Rehab
Figure 9: Commuting locations and distances for the AUC community.
In order to facilitate commuting, AUC offers its own bus service that is outsourced to two private
transportation companies and connects the New Cairo campus to greater Cairo along 16 bus routes
throughout the day and evening (see Figure 10). Apart from this bus service there is no public transport
connecting the New Cairo campus to Cairo’s neighborhoods. Most commuters who do not make use of
the bus service reach the New Cairo campus by private car.
Figure 10: AUC bus terminal with campus parking lot in rear.
While the bulk of AUC’s emissions from transportation are caused by daily commuting, the University
also operates a fleet of cars, vans, microbuses and light duty trucks for use by AUC personnel. The
operation of the fleet accounts for 1.62% of AUC’s overall carbon emissions in FY 2011 (see Figure 1).
18Additionally, faculty and staff fly to destinations around the globe for meetings, conferences, research and
other business purposes. This business air travel accounted for 2.50% of AUC’s overall carbon emissions
(see Figure 1).
Finally, the University sponsors student field trips for educational purposes (generally by bus to
destinations within Egypt). In FY 2011 (see Figure 1), these field trips accounted for 0.01% of AUC’s
overall carbon emissions.
4.2 Commuting by Bus and Car
4.2.1 Emissions
In FY 2011, commuting to and from the New Cairo campus by AUCians contributed an estimated
15,252.52 MT CO2e of carbon emissions to the footprint.
Nearly 70% of AUCians and 80% of AUC students commuted by bus in FY 2011, while slightly more
than 30% commuted by private car.29 Bus service to and from the New Cairo campus amounted to an
estimated 18,228,360 km traveled in FY 2011. Bus-related emissions are estimated to be 10,447.18 MT
CO2e. Of this total, the larger diesel coaches produced 6,504.41 MT CO2e with the remaining 3,942.77
MT CO2e produced by microbuses (see Figure 11).
Commuters by private car drove an estimated 20,301,388 km in FY 2011. 69% of the private car
kilometers were traveled by students. We estimated that total emissions from private car commuting are
4,805.34 MT CO2e (see Figure 11). Of this total, students account for 3,332.05MT CO2e with the
remaining 1,473.29 MT CO2e attributable to faculty and staff commuting.
According to the transportation survey, to date only 19% of those who drive to the University have
carpooled. However, without this car pooling activity, emissions from commuting by private car would
have been even higher. Clearly, carpooling holds considerable potential for reducing AUC’s carbon
footprint.
Emissions from Commuting 6504
7000 43%
6000 4805
31% 3943
5000
26%
MT CO2e
4000
3000
2000
1000
0
Private Car Microbus Coach Bus
Mode of Transport
Figure 11: Emissions from commuting to and from AUC’s New Cairo campus.
29
See 2012 AUC online transportation survey in Appendix 4. See also the AUC Transportation Committee’s “Transportation
Service Report” dated November 30, 2011 at pp. 4, 25.
194.2.2 Methodology
The total distances traveled by AUC coach buses and microbuses were calculated by AUC’s Department
of Transportation Services using information regularly provided in the ordinary course of business by the
private companies operating the bus system on AUC’s behalf.
Regarding the distances traveled by those commuting in private cars, the DDC in partnership with AUC’s
Offices of Sustainability, Institutional Research, and Public Safety conducted the online Transportation
Sustainability and Safety Survey.30 The 2,036 responses were used to estimate total annual car commuting
distances for the AUC community.
The survey shows how often, from where, and by what mode of transportation (bus, car, etc.)
undergraduate students, graduate students, staff, and faculty commute to the New Cairo campus. To
calculate total kilometers traveled for the entire AUC population, the survey data was scaled up to reflect
the full size of the AUC community using 2011 enrollment data. A weekly kilometer total for each Cairo
location was then calculated by multiplying the approximate roundtrip distance to campus by the number
of trips made every week from that location. Carpooling was factored in by adjusting total distance
traveled each week from each location to account for the average number of carpooling rides and riders.
The sum of weekly carpooling-adjusted distances traveled for each Cairo location and each demographic
group approximates the total weekly roundtrip distance traveled by private car commuters during the fall
and spring academic semesters. This weekly total was then further adjusted to reflect reduced commuting
during University breaks and holidays, as well as lower enrollments during winter session. The estimated
total distance traveled by private car commuters is simply the sum of these adjusted weekly totals over the
course of the year.
The annual kilometers traveled by diesel buses (bus service) and average gasoline cars (car commuters)
were then multiplied by the relevant emission factors provided below.
4.2.3 Data Sources
Data on bus commuting was provided by the AUC Department of Transportation Services and data on
private automobile commuting was acquired through the University-wide online transportation survey.
4.2.4 Emission Factors31
Source Mass Emissions (kgCO2e/km traveled)
Average Gasoline Vehicle (Car) 0.2367
Average Diesel Vehicle (Van/Microbus/Light Duty
0.3636
Truck)
Diesel Bus (Coach) 0.8808
4.3 University Fleet
4.3.1 Emissions
The University operates a fleet of 70 vehicles (54 gasoline cars, 14 diesel vans/microbuses/light duty
trucks), used for transportation of University personnel and other daily operations, that consumed 260,381
liters of gasoline and 105,121 liters of diesel fuel in FY 2011. Emissions from the gasoline vehicle fleet
30
A copy of the questionnaire used in the survey is attached to this report as Appendix 4. An Arabic version was also made
available.
31
Converted values from EIA 2011 and EPA 2011, www.emissionfactors.com.
20are 615.33 MT CO2e; and from the diesel fleet 282.06 MT CO2e (see Figure 12). The total emissions from
the University vehicle fleet are 897.39 MT CO2e.
University Fleet Emissions
700 615
69%
600
500
MT CO2e
400 282
31%
300
200
100
0
Cars Van/Microbus/Light Duty Truck
Figure 12: Carbon emissions caused by AUC’s fleet of vehicles.
4.3.2 Methodology
Emission factors were based on the vehicle composition of the fleet. For the gasoline fleet, consisting
almost entirely of cars, an average emission factor for gasoline cars was used. For the diesel fleet, made
up almost entirely of microbuses, an average emission factor for diesel light duty trucks (vans) was used.
Total amounts of fuel used were multiplied by their respective emission factors.
4.3.3 Data Sources
We obtained data for the University fleet from the AUC Department of Transportation Services.
4.3.4 Emission Factors32
Source Mass Emissions (kgCO2e/Liter of fuel used)
Average Gasoline Vehicle (Car) 2.3631787
Average Diesel Vehicle (Van/Microbus/Light Duty
2.683210969
Truck)
4.4 Air Travel
4.4.1 Emissions
Air travel by faculty and staff for business amounted to a total of 11,521,285.9 passenger kilometers
(pass. km) traveled in FY 2011 resulting in an estimated 1,385.88 MT CO2e emissions. Long haul air
travel accounted for 87% of the km traveled and 88% (1,214.81 MT CO2e) of the total GHG emissions
(see Figures 13 and 14). Medium and short haul travel accounted for only 13% of the kilometers traveled
and 12% of the emissions or 171.06 MT CO2e.
32
Converted values from EIA 2011 and EPA 2011, www.emissionfactors.com.
21Air Distance Traveled
Medium Haul
Short Haul
12%
1%
Long Haul
87%
Figure 13: Short, medium and long haul business-related flights taken by the AUC
community.
Emissions from Air Travel
1215
1400
88%
1200
1000
MT CO2e
800
600
400 146
25 10%
200
1%
0
Short Haul Medium Haul Long Haul
Type of Trip
Figure 14: Carbon emissions caused by air travel.
4.4.2 Methodology
The University Travel Office coordinates official University (business) travel as well as personal travel
requests from the University community. All flights booked through the travel office are compiled in a
database. However, it was not until the start of FY 2012 (i.e. September 1, 2011) that business travel
could be differentiated from personal travel in the database. Accordingly, the proportion of business
flights to personal flights recorded between September 2011 and April 2012 was used to estimate the
number of kilometers traveled for business purposes in FY 2011. Flight distances were calculated using
www.webflyer.com. Given that business class flights cause significantly more CO2 emissions than
economy class flights, a weighted emission factor for business/economy was used. For emission factor
22purposes flights were subdivided into short haul (≤785 km), medium haul (between 785 km and 3,700
km) and long haul (≥3,700 km).33
4.4.3 Data Sources
Data provided by the AUC Travel Office.
4.4.4 Emission Factors34
Mass Emissions (kgCO2e/passenger km
Source
traveled)
Short Haul35 0.1796639
Medium Haul (Average Class) 0.105535449
Long Haul (Average Class) 0.121499129
4.5 Sponsored Field Trips
4.5.1 Emissions
The University sponsored a number of field trips within Egypt in FY 11, resulting in an estimated 5,687
km of road travel by bus. Total emissions caused by these field trips are 5.01 MT CO2e.
4.5.2 Methodology
Distances to destinations were estimated using Google Maps with the departure point assumed to be
AUC’s New Cairo campus. Where the final destination was a city, distance was measured to the city
center. It is assumed that travel was undertaken by diesel fuel bus, given that this is the most commonly
used method of transportation for field trips.
4.5.3 Data Sources
We obtained data on field trip transport from the AUC’s Office of Public Safety.
4.5.4 Emission Factors36
Source Mass Emissions (kgCO2e/km traveled)
Diesel Bus (Coach) 0.8808
5. ELECTRICITY FOR LIGHTING AND EQUIPMENT (OTHER THAN HVAC)
5.1 Summary
As discussed in Sections 3.1 and 3.2, it is presently estimated that half of all electricity consumed by
AUC in FY 2011 was used to operate the HVAC system. The remaining half was used for lighting and
for operation of office equipment and other electrical equipment. The electricity used to power lighting
and other electrical equipment accounted for nearly 22% of AUC’s carbon emissions in FY 11 (see Figure
1).
33
Air Travel Definitions, www.emissionfactors.com.
34
Converted values from Defra/DECC 2011, www.emissionfactors.com.
35
Source does not list differentiated emission factors by class for short haul flight.
36
Converted value from EIA 2011 and EPA 2011, www.emissionfactors.com.
235.2 Emissions
The University emitted an estimated 7,045.59 MT CO2e through the consumption of electricity from the
Cairo grid (Egyptian Engineering Agencies or EEA) and an estimated 17,104.38 MT CO2e from
electricity consumed from AUC’s central utility plant. In total, AUC emitted 24,149.96 MTCO2e into the
atmosphere from use of electricity in FY 2011, out of which approximately 12.074.98 MT CO2e resulted
from the use of lighting and other electrical equipment.
For the methodology, assumptions, data sources and emission factors for electricity, please see Section
3.2.
6. PAPER USE
6.1 Emissions
The University purchased an estimated 631,373.96 kg of paper in FY 2011. The emissions from paper
purchases for the New Cairo campus total 1,796.28 MT CO2e.
6.2 Methodology
The research team reviewed all paper purchase invoices, categorized paper by coated and uncoated paper,
and weighed the paper packages. More than 99% of the paper AUC purchases is uncoated, as opposed to
only 1% of coated paper, which is used, for example, for glossy brochures.
All paper is 0% recycled, as recycled paper for office use is not yet available in Egypt. Recycled office
paper would have to be imported, which is not only costly but would indirectly increase the University’s
carbon footprint.
6.3 Data Sources
We obtained information on paper purchases from the Office of Supply Chain Management and Business
Support.
6.4 Emission Factors37
Source Mass Emissions (MT CO2e/kg of paper)
Uncoated Paper 0.0028451
Coated Paper 0.0027417
7. WATER SUPPLY (OTHER THAN WATER USED FOR HVAC)
7.1 Summary
Egypt is an arid country with minimal rainfall. It has less water per capita than the global scarcity
benchmark of 1,000 m³ per capita per annum. Simply put, Egypt is in a situation of constant water
scarcity and sustainable water management is one of the most important issues Egypt will face in the
coming years.
Energy and water supply at AUC are intimately connected. The New Cairo campus is located on an
elevated desert plain east of central Cairo. In order to supply water to AUC from the Ismailiya Canal
northeast of Cairo, water must be pumped across a distance of 54.45 km, and up inclines totaling 308 m.
37
Accounts for entire paper life-cycle, http://calculator.environmentalpaper.org/home.
24Reducing water consumption, whether for the central utility plant, for irrigation of campus landscaping,
or for domestic use, would reduce our carbon footprint in addition to saving scarce water resources.
7.2 Emissions
The University consumed 883,750 m3 of water during the 2011 fiscal year resulting in GHG emissions
that amount to 1,133.00 MT CO2e. Of this total, 225.30 MT CO2e can be attributed to HVAC, the
remaining 907.71 MT CO2e to Non-HVAC water uses such as domestic use and irrigation.
7.3 Methodology
Chemonics Egypt graciously assisted the carbon footprint team by mapping the water supply route from
the original water source at the Ismailiya Canal through a number of treatment and pumping stations to
the perimeter of the New Cairo campus, then calculating the electricity used to move the water along each
leg of the trip from source to final destination. A sample of the Chemonics Egypt calculations, covering
the 8-kilometer leg of the trip from pumping station 4 to pumping station 5, is attached to this report as
Appendix 5.
Chemonics Egypt concluded that 2.55 kilowatt hours (kWh) of electricity are required to bring each cubic
meter of water from the Ismailiya Canal to the New Cairo campus, given a system pumping efficiency of
65%. It is worth noting that, as Hani Sewilam, AUC Professor of Sustainable Development and Water
Resources Management has observed, 2.55 kWh/ m³ is nearly as much energy as is needed to produce
fresh water from sea water by desalination.
The total consumption of water by the University was taken from meter readings and estimates of all
water used on campus, including domestic use, irrigation, and the production of electricity and hot and
chilled water.
7.4 Data Sources
We obtained energy consumption for water delivery to the New Cairo campus from Chemonics Egypt
and data on University water consumption from AUC’s Office of Facilities and Operations/Maintenance
and the Desert Development Center.
7.5 Emission Factors
Source Mass Emissions (CO2e/kWh)
Cairo Grid (Electricity) 0.50276612
8. MISCELLANEOUS OTHER SOURCES
8.1 Summary
Significant but comparatively minor sources of AUC’s carbon emissions (see Figure 15) are solid waste
disposal, fertilizer use, refrigerant leakage and the burning of natural gas for domestic and lab purposes.
Together, these represent less than 1.5% of AUC’s total carbon emissions.
25You can also read