Energy Consumption and Potential Savings in the Automotive Body Shop
←
→
Page content transcription
If your browser does not render page correctly, please read the page content below
Energy Consumption and Potential
Savings in the Automotive Body Shop

Bachelor’s Thesis within the Industrial and materials science programme

RAFID KADHIM
ALBERT NORIN

DEPARTMENT OF INDUSTRIAL AND MATERIALS SCIENCE
C HALMERS U NIVERSITY     OF   T ECHNOLOGY
Gothenburg, Sweden 2021
www.chalmers.se
Bachelor’s thesis 2021

Energy consumption and potential savings in the
            automotive body shop

  Bachelor’s Thesis within the Industrial and materials science
                          programme

                           Rafid Kadhim
                           Albert Norin

             Department of industrial and material science
              Chalmers University of Technology
                     Gothenburg, Sweden 2021
Energy consumption and potential savings in the automotive body shop Bachelor’s Thesis within the Industrial and materials science programme © RAFID KADHIM, 2021. © ALBERT NORIN, 2021. Supervisor: Göran Kollback, Volvo Cars Examiner: Dag Henrik Bergsjö, Department of Industrial and Materials Science Bachelor’s Thesis 2021 Department of industrial and material science Chalmers University of Technology SE-417 56 Gothenburg Telephone +46 31 772 1000 Cover: Visualization of the robots working in the automotive body shop. Typeset in LATEX, template by Magnus Gustaver Printed by Chalmers Reproservice Gothenburg, Sweden 2021 iv
Energy consumption and potential savings in the automotive body shop
Bachelor’s Thesis within the Industrial and materials science programme
RAFID KADHIM
ALBERT NORIN
Department of industrial and material science
Chalmers University of Technology

Abstract
Extensive effort has been put into measuring sustainability efficiency within the
manufacturing over the last few years. This study presents a comprehensive look at
sustainability solutions within the industry and further development of an existing
energy map. It is vital that existing buildings operate more efficiently while pro-
viding a lower impact on the environment, and it is essential that new structures
maximize their energy efficiency. The ventilation system of a building accounts for
a significant portion of its energy consumption, and there is frequently significant
potential for the system to be optimized and streamlined. This report consists of the
end result of an evaluation of the usage of sustainability evaluation techniques inside
the industry. This through a literature study and meetings with experienced individ-
uals from each relevant sector. Based on our analysis, a conclusion could be drawn
that the possibilities for a more environmentally friendly and efficient system were
possible and profitable for the case company when making changes to their lighting
situation such as changing to LED lights and also making the heat exchangers more
effective by establish a regular maintenance schedule against the so called "Fouling
effect". Furthermore, when working with the effectiveness of the heat exchangers
calculations were made to obtain a value, this value showed the potential amount
of heat that could be recovered from the given system. Some suggestions were pro-
posed to the case company on where this obtained value could be used in future
research. In order to promote sustainable production, industry and academia must
collaborate on method creation and implementation. Also, collaboration between
industries must be implemented, because the case company must show a sense of
responsibility and understand that sustainability is not a competition-oriented topic.

Keywords: Sustainable energy systems, energy research, energy optimization, heat-
ing, lights.

                                                                                     v
Acknowledgements
First and foremost, we would like to thank the department of sustainability in Volvo
Cars for giving us the opportunity to conduct this project. An extra big thank you
to Göran Kollback for his involvement and support throughout.
We would like to express our gratitude especially for the expertise and tremendous
support of our project supervisor Dag Henrik Bergsjö, it’s highly appreciated by us.
We would also like to thank the department of Industrial and Materials Science at
Chalmers University of Techology for their involvement and for taking us in and
giving us the opportunity to work in this field.
Rafid Kadhim
Albert Norin
Gothenburg, May 2021
viiAbbrivations
VCT - Volvo Cars Torslanda.
CTH - Chalmers University of Technology.
CL90 - Cluster 90, the car models in the 90-series.
CL60 - Cluster 60, the car models in the 60-series.
TA - A VCT body shop.
TA3 - A VCT body shop, housing most of the CL90 production lines.
TAÖ - A VCT body shop, housing both CL60 and CL90 production lines.
LCC - Life cycle cost analysis.
PLC - Programable logic controller, used to communicate and control systems.
Keytalk - Holistic control system used by the case company for controlling lighting
and ventilation.
ixx
Contents

List of Figures                                                                                                                                      xiii

List of Tables                                                                                                                                       xv

1 Introduction                                                                                                                                         1
  1.1 Background .       .   .   .   .   .   .   .   .   .   .   .   .   .   .   .   .   .   .   .   .   .   .   .   .   .   .   .   .   .   .   .     1
  1.2 Aim . . . . .      .   .   .   .   .   .   .   .   .   .   .   .   .   .   .   .   .   .   .   .   .   .   .   .   .   .   .   .   .   .   .     1
  1.3 Limitations .      .   .   .   .   .   .   .   .   .   .   .   .   .   .   .   .   .   .   .   .   .   .   .   .   .   .   .   .   .   .   .     2
  1.4 Methodology        .   .   .   .   .   .   .   .   .   .   .   .   .   .   .   .   .   .   .   .   .   .   .   .   .   .   .   .   .   .   .     2

2 Theory                                                                                                                                               3
  2.1 Facility . . . . . . . . . . . . . . . . . . . . . . . . .                                             .   .   .   .   .   .   .   .   .   .     3
      2.1.1 Heating . . . . . . . . . . . . . . . . . . . .                                                  .   .   .   .   .   .   .   .   .   .     3
      2.1.2 Insulation/leakage . . . . . . . . . . . . . .                                                   .   .   .   .   .   .   .   .   .   .     3
      2.1.3 Ventilation . . . . . . . . . . . . . . . . . . .                                                .   .   .   .   .   .   .   .   .   .     3
              2.1.3.1 Natural ventilation . . . . . . . . .                                                  .   .   .   .   .   .   .   .   .   .     3
              2.1.3.2 Mechanical ventilation . . . . . . .                                                   .   .   .   .   .   .   .   .   .   .     4
              2.1.3.3 Heat recovery . . . . . . . . . . . .                                                  .   .   .   .   .   .   .   .   .   .     4
              2.1.3.4 Introduction to heat exchangers . .                                                    .   .   .   .   .   .   .   .   .   .     4
                      2.1.3.4.1 Rotary heat exchanger . .                                                    .   .   .   .   .   .   .   .   .   .     5
                      2.1.3.4.2 Plate heat exchanger . . .                                                   .   .   .   .   .   .   .   .   .   .     5
              2.1.3.5 Conduction . . . . . . . . . . . . .                                                   .   .   .   .   .   .   .   .   .   .     6
              2.1.3.6 Convection . . . . . . . . . . . . .                                                   .   .   .   .   .   .   .   .   .   .     6
              2.1.3.7 Radiation . . . . . . . . . . . . . .                                                  .   .   .   .   .   .   .   .   .   .     6
      2.1.4 Lights . . . . . . . . . . . . . . . . . . . . .                                                 .   .   .   .   .   .   .   .   .   .     7
              2.1.4.1 Light source . . . . . . . . . . . . .                                                 .   .   .   .   .   .   .   .   .   .     7
              2.1.4.2 Control system . . . . . . . . . . .                                                   .   .   .   .   .   .   .   .   .   .     7
              2.1.4.3 Comparison of light sources . . . .                                                    .   .   .   .   .   .   .   .   .   .     7
              2.1.4.4 Phasing out of dated light sources                                                     .   .   .   .   .   .   .   .   .   .     8

3 Methods                                                                                                                                           9
  3.1 Data collection . . . . . . . . .                          .   .   .   .   .   .   .   .   .   .   .   .   .   .   .   .   .   .   .   .   . 9
      3.1.1 Secondary data . . . . .                             .   .   .   .   .   .   .   .   .   .   .   .   .   .   .   .   .   .   .   .   . 9
      3.1.2 Reviewing material . . .                             .   .   .   .   .   .   .   .   .   .   .   .   .   .   .   .   .   .   .   .   . 9
  3.2 Meetings . . . . . . . . . . . . .                         .   .   .   .   .   .   .   .   .   .   .   .   .   .   .   .   .   .   .   .   . 10
      3.2.1 Maintenance engineer . .                             .   .   .   .   .   .   .   .   .   .   .   .   .   .   .   .   .   .   .   .   . 10
      3.2.2 Veolia energy optimizer .                            .   .   .   .   .   .   .   .   .   .   .   .   .   .   .   .   .   .   .   .   . 10

                                                                                                                                                      xi
Contents
3.2.3 CTH professor . . . . . . . . . . . . . . . . . . . . . . . . . . . 10
3.2.4 Electric specialist . . . . . . . . . . . . . . . . . . . . . . . . . 11
3.3 Site visits . . . . . . . . . . . . . . . . . . . . . . . . . . . . . . . . . 11
3.3.1 First visit . . . . . . . . . . . . . . . . . . . . . . . . . . . . . 11
3.3.2 Second visit . . . . . . . . . . . . . . . . . . . . . . . . . . . . 11
4 Results 13
4.1 What factors contribute to the energy consumption in an Automotive
Body shop . . . . . . . . . . . . . . . . . . . . . . . . . . . . . . . . . 13
4.2 How is the energy consumption distributed in the factory . . . . . . . 14
4.3 What potential energy savings can reduce energy consumption . . . . 18
4.3.1 Lighting control system in TA3 . . . . . . . . . . . . . . . . . 18
4.3.1.1 In-depth measures . . . . . . . . . . . . . . . . . . . 18
4.3.1.2 Energy savings . . . . . . . . . . . . . . . . . . . . . 18
4.3.1.3 Complexity and risk . . . . . . . . . . . . . . . . . . 19
4.3.1.4 Side values . . . . . . . . . . . . . . . . . . . . . . . 19
4.3.2 Change to LED lights in TA3 and TAÖ . . . . . . . . . . . . . 19
4.3.2.1 In-depth measures . . . . . . . . . . . . . . . . . . . 19
4.3.2.2 Savings . . . . . . . . . . . . . . . . . . . . . . . . . 20
4.3.2.3 Project costs . . . . . . . . . . . . . . . . . . . . . . 20
4.3.2.4 Result . . . . . . . . . . . . . . . . . . . . . . . . . . 21
4.3.2.5 Complexity and risk . . . . . . . . . . . . . . . . . . 21
4.3.2.6 Side values . . . . . . . . . . . . . . . . . . . . . . . 22
4.3.3 Heat recovery . . . . . . . . . . . . . . . . . . . . . . . . . . . 22
4.3.4 Calculations . . . . . . . . . . . . . . . . . . . . . . . . . . . . 23
4.3.5 Suggestions for improving Efficiency of plant . . . . . . . . . . 24
4.3.5.1 More about heat exchanger study . . . . . . . . . . . 24
4.3.5.2 Series benefits . . . . . . . . . . . . . . . . . . . . . . 24
4.3.5.3 Parallel benefits . . . . . . . . . . . . . . . . . . . . . 24
4.3.6 Suggestions . . . . . . . . . . . . . . . . . . . . . . . . . . . . 25
4.3.7 Increase effectiveness of plate heat exchangers . . . . . . . . . 26
4.3.7.1 Suggestions . . . . . . . . . . . . . . . . . . . . . . . 26
5 Conclusion 29
6 Discussion 31
Bibliography 33
A Appendix 1 I
xiiList of Figures
4.1 Total energy use 2018 . . . . . . . . . . . . . . . . . . . . . . . . . . . 14
4.2 Electricity consumption for each factory part in 2018 . . . . . . . . . 14
4.3 Hot water consumption on a monthly basis for the years 2016-2018 . 15
4.4 Compressed air consumption per month 2016-2018 . . . . . . . . . . . 15
4.5 Distribution of electricity consumption . . . . . . . . . . . . . . . . . 16
4.6 Consumption of hot water per hour from May to December 2018 . . . 16
4.7 Sankey diagram showing the distribution of energy use. The thickness
of the arrows corresponds to the size of the energy use over a year. . . 17
A.1 A theoretical mindmap was created to get a view of areas that could
affect the energy usage. . . . . . . . . . . . . . . . . . . . . . . . . . . I
A.2 The technicality of a rotary heat exchanger. Red arrow as supply air,
blue as outdoor air, yellow as exhaust air, brown as waste air[6] . . . II
A.3 The technicality of a plate heat exchanger. Red arrow as supply air,
blue as outdoor air, yellow as exhaust air, brown as waste air[6] . . . II
A.4 A view of how the control system in Cluster 60 looks like. . . . . . . . III
A.5 A view of how the control system in Cluster 90 looks like. . . . . . . . IV
A.6 Existing cooling circuit system . . . . . . . . . . . . . . . . . . . . . . VII
A.7 LCC diagram that shows the investment cost and savings for TAÖ,
the payback time is visualised as the intersection of the lines. . . . . . VII
A.8 LCC diagram that shows the investment cost and savings for TA3,
the payback time is visualised as the intersection of the lines. . . . . . VIII
A.9 LCC diagram that shows the investment cost and savings for TA3 and
TAÖ combined, the payback time is visualised as the intersection of
the lines. . . . . . . . . . . . . . . . . . . . . . . . . . . . . . . . . . . VIII
A.10 Diagram that shows the CO2e emissions from the energy usage for
TAÖ. . . . . . . . . . . . . . . . . . . . . . . . . . . . . . . . . . . . . IX
A.11 Diagram that shows the CO2e emissions from the energy usage for
TA3. . . . . . . . . . . . . . . . . . . . . . . . . . . . . . . . . . . . . IX
A.12 Diagram that shows the CO2e emissions from the energy usage for
TA3 and TAÖ. . . . . . . . . . . . . . . . . . . . . . . . . . . . . . . X
A.13 Multi-criteria analysis that in a simple way, shows the expected effects
for the perspectives. . . . . . . . . . . . . . . . . . . . . . . . . . . . X
xiiiList of Figures xiv
List of Tables

2.1   Exemptions from requirements exist for certain applications accord-
      ing to Appendix III in the EU 2019/2020 . . . . . . . . . . . . . . . .                           8

4.1   Operating times according to the report . . . . . .      .   .   .   .   .   .   .   .   .   .   18
4.2   Compiled proposals for the replacement of lighting .     .   .   .   .   .   .   .   .   .   .   20
4.3   Calculated costs for the project . . . . . . . . . . .   .   .   .   .   .   .   .   .   .   .   20
4.4   Data specifications on the plate heat exchanger. . .     .   .   .   .   .   .   .   .   .   .   27

A.1 General lighting TA3 + TA3 CL90 . . . . . . . . . . . . . . . . . . . V
A.2 Cost- and energy savings with new operating times. . . . . . . . . . . VI

                                                                                                       xv
List of Tables xvi
1
                           Introduction

This chapter presents the background to the subject of sustainability and how energy
consumption is defined today and and why reducing the energy consumption in the
automotive body shop is important. It also presents the aim of the report, broken
down in Research Questions (RQ)s which will be answered during the project. A
presentation of the limitations that could emerge is also included. Lastly the chapter
ends with a brief introduction about the methodologies used in the project.

1.1     Background
Our and future generations face a huge challenge. Since the birth of industrialism,
humans have been constantly looking for new ways to streamline manufacturing
processes and this has led to more products at lower prices. However, this improved
existence has come at a very high price. We see today that the sea temperature
is rising in everything as the great ice melts, that our lakes and seas are becoming
more acidic, that extreme weather and other natural disasters are happening more
and more frequently.[1] All data show that these effects are due to global warming
due to our use of fossil fuels.[2]
Breaking humanity’s dependence on fossil fuels is therefore of high interest.
In Sweden, industry used 142 TWh in 2019, this corresponded to around 38 percent
of Sweden’s total energy use.[3]

1.2     Aim
In this report, we intend to examine the factors that contribute to energy con-
sumption in a body factory for the automotive industry. We expect to present the
distribution of energy consumption in industry as well as potential improvement
proposals. In order to determine how the case company Volvo Cars can develop
their work for sustainability, the following research questions will be answered;
   • What factors contribute to the energy consumption in an Automotive Body
      shop?
   • How is the energy consumption distributed in the factory?
   • What potential energy savings can reduce energy consumption?

                                                                                    1
1. Introduction 1.3 Limitations The project will only examine the energy consumption in the body factory, this means that the painting factory, assembly plant and other premises are not handled in this project. The project aims to present an overview of energy consumption in the body factory and present new methods that have the opportunity to reduce energy consumption. This means that the large part of the project will consist of information gathering of scientific methods and presentation of this as well as overall calculations, not in-depth analysis and calculations. Due to the prevailing pandemic, most things will happen at a distance. This is seen as a demarcation as our ideas will not be able to be discussed immediately with individuals in the area. The project is planned to be carried out in the spring of 2021, starting in January and final presentation in May. Due to the time constraint, we will need to prioritize the factors that have the greatest impact, thus certain factors may not be presented in the project. 1.4 Methodology The methodology described in this chapter is a run-through of how the analysis was carried out. It begins by describing the literature review process and then the process of the conducted meetings. Furthermore, demonstrating how the data from these sources was used as material in order to achieve our results. Meetings will be carried out during the project and the goal is to do them with relevant individuals from the case company and Chalmers to give us various input data. The meeting would be constructed in a way that they will include insight on what is actually implemented or not and why. Also the meetings will be kept with high quality output. The literature review will cover what kind of methods that will be implemented within manufacturing companies and what academia believes can be implemented. Also previous thesis work was reviewed to get an idea on what approach and various layout could be implemented for the project. A tour on the facility was done in the early phase to get an idea and an understanding of how the ventilation system, cooling system and heating system were constructed. Furthermore, Meeting routines for reconciliation played an important role to set the project into the right course. This was done once a week and became the foundation of the thesis. 2
2
                                  Theory

In this chapter, a theoretical framework was developed to serve as the study’s foun-
dation. A mindmap was produced to identify areas related to energy savings within
the automotive body shop. Theory for how to work with these areas will be de-
scribed, see Appendix A.

2.1       Facility
2.1.1     Heating
The heating of the facility mainly consists of heated water that is bought and dis-
tributed to areas that needs to be heated. Passive heating also exists, in form of
workers that emits heat to the premises as well as robots/machines that emits heat
during operations.

2.1.2     Insulation/leakage
Heat losses due to air leakage occur in buildings when it’s shell is not intact. Leaks
can consist of holes, cracks or openings in the facade and can, for example be found
around doors and windows.

2.1.3     Ventilation
The movement and exchange of air in buildings is referred to as ventilation. There
are many reasons for using ventilation, the most common is to maintain a pleasant
indoor environment. The ventilation system removes moisture, toxins, and other
contaminants from the space and replaces them with fresh air.
To enable fresh air to replace the used air, the air needs to be moved. This can be
done in two general ways, by natural ventilation and by mechanical ventilation.

2.1.3.1   Natural ventilation
Natural ventilation is triggered by natural forces (e.g. winds and thermal buoyancy
force due to indoor and outdoor air density differences) drive outdoor air through
purpose-built, building envelope openings. Purpose-built openings include windows,
doors, solar chimneys, wind towers and trickle ventilators. This natural ventilation
of buildings depends on climate, building design and human behaviour.[4]

                                                                                    3
2. Theory
2.1.3.2 Mechanical ventilation
Mechanical ventilation uses mechanical fans to drive the air flow. In facilities where
a large air flow is needed or precise control is required, this solution is used. These
fans are often installed in air ducts for supplying air into, or exhausting air from, a
room. [4].
2.1.3.3 Heat recovery
Heat recovery, which uses the heat content of the exhaust air to mitigate energy
use and heating costs for heating the ventilation supply air, is most often used to
minimize energy use and heating costs for heating the ventilation supply air. A
strong heat recovery of exhaust air adds to cost savings while also lowering total
energy consumption. The quality of the indoor environment is maintained and can
even be enhanced with the addition of heat recovery. FTX ventilation, which stands
for exhaust and supply air ventilation, is another heat recovery technique.
Heat recovery accounts for between 50 and 80 percent of the heat required to sus-
tain a comfortable indoor environment. The property’s environment shell must be
airtight in order for FTX equipment to work as effectively as possible. Because of
this, transmission losses through the climate shell of the house are reduced, allowing
for optimum heat recovery [6]. The temperature efficiency of heat recovery units can
be conveniently calculated using the formula below based on three temperatures.
T2 − T1
nt = (2.1)
T3 − T1
2.1.3.4 Introduction to heat exchangers
Heat exchangers are devices that transfer heat between two or more liquids of varying
temperatures, such as liquids, vapors, or gases. Heat transfer may occur from gas
to gas, liquid to gas, or liquid to liquid. Depending on the form of heat exchanger
used, this can be accomplished by the use of a solids separator, which prevents
liquids from mixing or coming into close contact with liquids. Other design elements,
such as materials and parts, heat exchangers with transfer mechanisms, and flow
configurations, aid in the classification and categorization of heat exchangers. A
variety of heat exchange devices have been developed and manufactured for use in
heating and cooling processes, and they are used in a variety of industries.[8]
A heat exchanger’s architecture is an exercise in thermodynamics, a science that
studies the distribution of thermal energy, temperature, and their relationships with
other forms of energy. It is a good idea to understand the three types of heat transfer
(conduction, convection, and radiation). A starting point for learning about heat
exchanger thermodynamics.
Each of these heat transfer modes is addressed in depth in the sections that follow.
Boilers, condensers, and radiators all have heat exchangers. Let’s consider some
examples of heat exchangers. Hot:
42. Theory
I. Preheaters and Intercoolers
II. Condensers and boilers in steam plant
III. Regenerators
IV. Radiators used in automobile
V. Boiler
The most popular types of heat exchangers used in almost all energy applications
are shell and tube heat exchangers. Their applications include air conditioning,
chemical and process industries, power generation, and medical applications. The
sheath is made of polyvinyl chloride (PVC), and the pipes are fin-type and made
of copper. Another one flows through the tubes of a shell and tube heat exchanger,
while a liquid flows through the tube banks. It’s expected to flow through the finned
copper pipes, losing heat to the cold water in the PVC jacket as it goes. Heat is
transferred between the shell and the liquids on the tube side. It is made up of
housing, tubes, baffles, a front head, a back head, tube plates, and nozzles. The hot
and cold water inlets and outlets are divided by two circular baffles, one between
the two inlets and one between the two outlets.
2.1.3.4.1 Rotary heat exchanger The exhaust air from the ventilation system
passes through a revolving filter made up of narrow sheet metal ducts in a rotary
heat exchanger. A rotary heat exchanger requires the use of a generator, which
consumes a limited amount of energy. The filter has strong thermal conductivity,
and the plate is ruffled in several layers to have a large heat dissipating surface. The
heat from the exhaust air is contained in the plate, which rotates to the supply air
vent and releases the heat to the outside air [5]. Low pressure drops characterize
the rotary heat exchanger, resulting in low fan power requirements and, as a result,
low electrical energy consumption during fan service. It’s relatively simple to clean
and has a high productivity of about 80%. Disadvantages of using a rotary heat
exchanger is that the temperature efficiency is severely harmed by even the tiniest
dust or dirt on their structure. See Appendix A.X for an illustration of a rotary
heat exchanger.[6]
2.1.3.4.2 Plate heat exchanger A plate heat exchanger is a type of heat ex-
changer that transfers heat between two fluids using metal plates. Since the fluids
are spread out over the plates, this has a significant advantage over a traditional
heat exchanger in that the fluids are exposed to a much greater surface area.There
are no moving parts which doesn’t consume any energy [5]. Plate heat exchangers
have efficiencies of 60-90 percent, with countercurrent heat exchangers having the
best efficiency. Disadvantages of using plate heat exchangers are their structure,
plate heat exchangers can be perceived as difficult to clean. See Appendix A.X for
an illustration of a plate heat exchanger. [6]
52. Theory
2.1.3.5 Conduction
Conduction is the transfer of thermal energy between materials in contact. Tem-
perature is used to calculate the overall kinetic energy of molecules in a substance;
colder structures (those with a higher temperature) have more molecular motion.
When a warmer object collides with a colder object (one that is at a lower temper-
ature), the cooler object becomes more energized, and the warmer object becomes
less energized. This process will continue to operate until the temperature reaches
thermal equilibrium.[7]
The following expression expresses the rate at which heat energy is transferred in a
material through thermal conduction:
Q kA∆T
= (2.2)
t d
2.1.3.6 Convection
Convection is the conversion of thermal energy from a surface to a substance that
has been heated, such as air or water. When a fluid is heated, it expands, becoming
less compact and rising in comparison to other areas of the fluid that are colder.
As a result, when a room’s air is heated, it rises to the ceiling when it is colder
and less compact, transfers heat energy when it collides with the room’s cooler air,
then becomes denser and falls to the surface. A normal or free convection current is
created as a result of this process. Forced or aided convection occurs as hot water
is pumped into a nozzle, such as in a hydronic heating system.[7]
For free convection, the rate of transfer of heat is expressed by Newton’s law of
cooling:
Q̇ = hc A∆T (2.3)
2.1.3.7 Radiation
Thermal radiation is a form of heat energy transfer that occurs when a hot surface
or substance emits electromagnetic waves. Unlike conduction and convection, ther-
mal radiation does not require an intermediate medium to transmit wave energy.
Thermal radiation is released in a wide spectral range from all surfaces with a tem-
perature greater than absolute zero (-273.15◦ C).[7]
The Stefan-Boltzmann Law can be used to express the net rate of radiation heat
loss as follows:
Q = σ Th4 − Tc4 Ah (2.4)
62. Theory
2.1.4 Lights
2.1.4.1 Light source
There have been many types of light sources in the market since the making of the
incandescent bulb, and ever since then research for better, more efficient technology
have been done. Today the dominant technology for creating light is light emitting
diodes (LEDs) due to it’s many upsides, mostly being luminous efficacy and long
lifespan. The downside of LEDs is the increased purchase price compared to fluo-
rescent tubes/CFL, this increased cost can however be payed of over time due to
it’s lower running costs and lifespan.
2.1.4.2 Control system
The light sources can be controlled in different ways. They can be controlled by the
press of a button, different types of sensors and they can be connected to a smart
control system with online access. In a large facility like an automotive plant, large
amounts of energy could be saved if the light stays off when it’s not needed, therefore
control systems can have a great impact on the energy usage of the facility.
2.1.4.3 Comparison of light sources
To be able to compare different light sources, we need to introduce the measure
luminous efficacy. This is a measure of how efficient a light source is at emitting
visible light. It is the ratio of luminous flux to power, measured in lumens per watt
in the International System of Units (SI).
R∞
Φv 0 K(λ)Φe ,λ δλ
K= = R∞ ,
Φe 0 Φe ,λ δλ
where,
φv is the luminous flux
φe is the radiant flux
φv ,λ is the spectral radiant flux
φv is the luminous flux
K(λ) = Km V (λ) is the spectral luminous efficacy
72. Theory
2.1.4.4 Phasing out of dated light sources
According to energimyndigheten [9], (EU 2019/2015) will take effect and a roadmap
for phasing out dated lighting sources were published. See table 2.1
Allowed - Lamps allowed to be placed on the market
Outdated - Lamps phased out, can not be placed on the market
Date 1 sept 2018 1 sept 2021 1 sept 2023
Halogen lamps 230 V (except R7s and G9) Outdated Outdated Outdated
Halogen lamps G9 (230 V) Allowed Outdated Outdated
Low voltage halogen lamps G4 and GY6.35 Allowed Allowed Outdated
Other low voltage halogen lamps Allowed Outdated Outdated
Halogen lamps R7s (230 V), ≤ 2700lm Allowed Allowed Allowed
Halogen lamps R7s (230 V), ≥ 2700lm Allowed Outdated Outdated
Low energy light bulbs (CFLi) Allowed Outdated Outdated
Fluorescent T8 (2.4 and 5 feet) Allowed Allowed Outdated
Fluorescent lamp T2 Allowed Outdated Outdated
Fluorescent lamp T12 with outer ignition strip Allowed Outdated Outdated
Fluorescent lamp T12 without outer ignition strip Outdated Outdated Outdated
Table 2.1: Exemptions from requirements exist for certain applications according
to Appendix III in the EU 2019/2020
83
Methods
This chapter goes through a step-by-step approach to how the research was con-
ducted. Firstly defining the process the literature review, then the benefits that
were drawn from the meetings with relevant individuals and lastly the site visits
that were carried out during the project. The report concludes by showing how this
knowledge was put to use in the rest of the study, addressing the research questions
that were outlined in the previous chapter.
3.1 Data collection
In order to capture, analyze and summarize material of the literature, a systemic
approach was adopted during the review process suggested [17]. The journal of
cleaner production database was suitable since all publications would comply with
the appropriate criteria for publishing but not too strictly to exclude essential arti-
cles.
The case company gave access to their database with all the necessary data to achieve
the result needed for this project. Data were gathered mainly through meetings with
key employees in the relevant department, and the energy mapping report provided
by the case company. Lastly, knowledge has been acquired by publications and
manuals of various sorts. The literature used has primarily consisted of publications
on Volvo’s intranet or that were otherwise accessible at the company, as well as
research literature. This has been done in consultation with competent specialists
in the industry or sector.
3.1.1 Secondary data
Selected data is supplemented by secondary sources, since it helps to confirm the
ongoing research questions and is useful to others as well as distributing it to the
public. Secondary data help analysis that has already been done to advance the
study of research. However, it is important to recognize that their motivation might
have been other than what they had anticipated.[11] The gathering of secondary
data has mostly been done from Chalmers University library, DiVA and the database
provided by our supervisor, A journal of cleaner production.
3.1.2 Reviewing material
All documents collected from A journal of cleaner production and DiVA were evenly
divided between the two of us in the project group. In order to assess the contribu-
93. Methods tions of the documents, they were first reviewed. When evaluating the document, it was first established whether or not the document could help in supporting the case. Most relevant papers were noted. The articles where the individual project members could not decide the level of relevance, they were taken to a discussion within the project group where a decision could be made together. 3.2 Meetings Four important meetings with relevant individuals from the case company and Chalmers were carried out. They were conducted to collect data and information about how the project would proceed and what type of material that were available for the project. But also to understand how the system and facility looks today. To gather energy usage data, energy and sustainability experts at the case company were contacted. From them we could collect energy invoices that showed energy us- age for the specified facilities. The case company uses a energy measurement system called esight. Electricity measurements are available at the transformer level, with logged values for energy consumption in esight. 3.2.1 Maintenance engineer Several meetings with a maintenance engineer with knowledge about the production and lighting configurations happened during the study. The engineer provided us with knowledge of the current situation and problems that existed, as well as some ideas of how to proceed during the project. 3.2.2 Veolia energy optimizer Several meetings with an energy optimizer with knowledge of the ventilation and lighting configurations happened during the study. We collected information of how the ventilation and lighting were controlled in the different factories. We also got information that one of the factories within the scope of our project the TA factory, were undergoing a renovation. During this renovation the roof will be rebuilt and new up to date lights and ventilation solutions will be acquired. We will therefore not focus on this part of the plant. 3.2.3 CTH professor To get an idea of how we would proceed with the heat exchangers, we had a meeting with a professor from Chalmers who had previous knowledge in the field. This became the turning point for the project because it gave the project new ideas that were not thought of earlier. It was also here the project knew how to look for specific literature studies that would help support the results later. The meeting was overall short but really beneficial. 10
3. Methods

3.2.4     Electric specialist
To collect data needed to do a Life cycle cost analysis for the change to LED lightning
in TA3 and TAÖ, we got in contact with a Senior electrical specialist that had good
knowledge of the lighting situation. The electrical specialist provided us with data
needed for the LCC such as, estimated costs for, lighting solutions, installation of
hardware and software, planned and unplanned repairs.

3.3      Site visits
Site visits were carried out to get a better understanding of their systems today.
Due to the current situation of the COVID-19 pandemic we were only given two site
visits. During these site visits we were introduced to their current system to give a
better understanding to proceed with our project.

3.3.1     First visit
The first site visit was carried out at the TA factory. During this meeting, we were
shown the factories control system for ventilation and lighting from their office by
one of the case company´s energy optimizers. In this system, they have the ability to
monitor ventilation and lighting systems, as well as control the systems to a certain
degree.
Later we went on a tour up to the roof of the factory, where we went into the
various cooling towers that exist, these vary in modernity and only some of the
cooling towers have been modernized since the 90s.
We noticed that cooling towers 110 and 120 are of the old model and do not take
advantage of process heat that is currently ventilated out on the roof freely through
a couple of fans. We also visited cooling tower 170 and 180. Cooling tower 170 is
also of an older model, but here the process heat is used and is used to heat the new
air that is ventilated into the facility.

3.3.2     Second visit
The second site visit was carried out at the TA factories. During this meeting, a tour
was conducted with two maintenance engineers. In TA3, One of them described the
problem of controlling the lighting in the TA3 factory and the CL-90 line in TAÖ.
The problem is due to the supplier of the control system not carrying out qualitative
work and not making the system work properly. The supplier’s system is used here
as an intermediary between the case company’s HMI system and the holistic control
system. This has created problems that do not exist in the 60 line in TAÖ, as the
control there takes place without intermediaries. The problem that has been created
is that the lighting is sometimes dimmed to about 30% and cannot be adjusted as
input signals are not communicated correctly via the intermediary. The control has
therefore been corrected to a manual control in order to be able to keep production
going.

                                                                                    11
3. Methods The lighting in TA3 and TAÖ - 90 line also consists of fluorescent lighting, however, it is considered that there is no value in switching to LED lighting here without solving the problem with the control first, because only changing to led lights wont remove the problem of insufficient light and might resolute in double work. The improvement proposal here consists primarily of changing the control to a robust control system that is compatible with the case company´s overhaul / control sys- tem. In this way, we can reduce the operating hours of the lighting, as well as smartly control and dim lighting at the right times to reduce energy consumption. The second step consists of replacing existing fluorescent lighting with LED, this reduces energy consumption with the added benefit of decreases losses of energy for the lighting in form of heat losses. More on this in 4.3.1 and 4.3.2. Compressed air sensors in different robot flows were also shown, these compressed air sensors today only have the function of showing a value of the flow in the compressed air pipe to the line. They described that the sensor has the function of visualizing the instantaneous volume flow and pressure in the systems. When the line were stationary we could see that most often a value for volume flow could be observed. This means that energy is lost in form of leaking compressed air, which apart from energy losses also can lead to breakdowns as well as increase the cycle time for lines, due to pressure drops. The improvement proposal here was to connect these sensors to the case company’s inspection system and the Status Boards at the lines, this could give line mechanics and team leaders new visual information about the status of the compressed air sensors at standstill. This would give line mechanics and team leaders up-to-date information on where problems are and the opportunity to troubleshoot simpler problems such as non-clogged quick couplings or valves in the wrong position. If the problem cannot be solved, maintenance could be planned and called in. This would have led to better opportunities for preventive maintenance for the pressure systems in the lines, simple visualized information for line mechanics to work with to prevent downtime and energy losses. 12
4
                                 Results

4.1     What factors contribute to the energy con-
        sumption in an Automotive Body shop
Here we will list some factors we have considered to have an impact on the energy
consumption.

• Continuous collaboration between organizations working with similar and ad-
jacent products/services.
High impact. To have organizations collaborating, sharing their progress and status
in its work of improving energy consumption is a great way of sharing knowledge. Or-
ganizations should share their knowledge of what improvement ideas they’ve tested,
which ones that worked and which ones that did not. By doing this other organiza-
tions will be able to collect already proven improvements. Making decision making
easier.
• Operating times
Medium impact. By planning and optimizing the operating times for production and
supporting systems, the systems can be active when they are required and inactive
when not required. By doing this much energy can be saved from being consumed
unnecessarily.
• Workforce awareness
Medium impact. People working in or for the organization can have a big positive
impact on the energy usage, it is therefore important to raise the awareness of what
they can do to decrease the energy usage. It could be people working in the facilities
with access to equipment that can be turned off during breaks etc.
• Equipment status/ need of maintenance
Medium impact. Its important to keep the production systems and supporting sys-
tems in good shape to have them perform as energy efficient as possible. This applies
to both robot systems as well as ventilation and compressed air systems.
• Production rate/production mix
Lesser impact. The production lines are automated and flexible for the current
product mix.
• Weather conditions
Lesser impact. The weather has an impact on the energy usage in forms of need for
heating/cooling.

                                                                                   13
4. Results
4.2 How is the energy consumption distributed in
the factory
Figure 4.1: Total energy use 2018
Figure 4.1 illustrates the overall energy usage of different types for each factory sec-
tion in 2018, both in total and per square meter. It is clear that the consumption
of hot water per square meter for the various parts is relatively equal, while the
consumption of electricity per square meter in TA3 is substantially higher than in
the other parts. This is most likely due to the fact that, in comparison to TA and
TA, TA3 had no demolished areas without operations in 2018.
Figure 4.2: Electricity consumption for each factory part in 2018
Figure 4.2 illustrates a more comprehensive look back at the years 2016-2018 in
terms of electricity consumption. The most noticeable difference in a calendar year
is the holiday leave in July. In other words, consumption varies equally well over
the year, with the lowest and highest consumption occurring in different years. This
144. Results
supports the hypothesis that variations in occupancy rate are primarily responsible
for variations in electricity consumption.
Figure 4.3: Hot water consumption on a monthly basis for the years 2016-2018
Hot water serves as TA’s heat source. Figure 4.3 contains information on purchased
hot water over the last three years. As previously stated, hot water consumption
is primarily determined by outdoor weather, as shown by the 2018 consumption,
which reflects the exceptionally cold late winter during February and March, as well
as the hot summer. It can be seen that in the last two years, the use of hot water
during the summer months has been limited, which mostly consists of hot water for
changing rooms and restaurants.
Figure 4.4: Compressed air consumption per month 2016-2018
At TA, compressed air is used extensively, primarily to transfer information in the
robot cells with vacuum suctions. Figure 4.4 summarizes the compressed air in-
take per month for the years between 2016-2018. It’s amazing how little use of
compressed air decreases during the month of July, when most of the facility is on
holiday. It can be seen that compressed air usage was higher in most months in 2018.
154. Results Figure 8 depicts how compressed air use has risen over the last three years. This is because of increased compressed air leakage and the addition of a new line in 2018. Figure 4.5: Distribution of electricity consumption Electricity consumption is divided by various consumers. The three factory pieces are also used to separate the main customers. Figure 4.5 also includes percentages and comments for each section. TA receives heat from hot water provided in a boiler plant. The hot water is then Figure 4.6: Consumption of hot water per hour from May to December 2018 delivered to TA via pipe systems and exchanged in heat exchangers. The water on the secondary side is transferred and used to heat tap water, radiator circuits, and air heaters and other air handling units. When it is cold outside, the need for heat is highest. When the hot water meters were replaced in the spring of 2018, there was no hot water calculation for TA3, so there is only revised hourly data for this consumption from May onward. Figure 4.6 illustrates this information. It should be noted that this data includes the hot water delivered to TP’s storage tent via TA. 16
4. Results

Figure 4.7: Sankey diagram showing the distribution of energy use. The thickness
of the arrows corresponds to the size of the energy use over a year.

The sankeydiagram in Figure 4.7 shows in a more systematic way how the energy
purchased is divided into different consumers

                                                                             17
4. Results
4.3 What potential energy savings can reduce en-
ergy consumption
4.3.1 Lighting control system in TA3
The lighting in parts of the TA factories is lacking in how they are controlled. Today,
a large part in the TA3 factory the existing control system does not work properly
and is therefore controlled manually. This leads to all lighting often being on around
the clock every day and that the lighting does not dim correctly, in this way the
lighting is on unnecessary hours and the workers sometimes get insufficient light.
A lot of extra manual work is required to compensate for this which is both costly
and time consuming. The recommendation is therefore to replace the current non
functional control system to reduce the lighting’s operating time and at the same
time increase operational reliability as there is a great potential for savings and an
improved working environment.
Table 4.1: Operating times according to the report
4.3.1.1 In-depth measures
The control system in the different factory parts varies. In TAÖ CL60, the produc-
tion PLC communicates directly with the overview control system Keytalk. This
communication works as intended and the operating times for the lighting can be
seen in Table 4.1.
In TAÖ CL90 and TA3 however, another control system called Teamster was pur-
chased to handle the communication between production PLC and Keytalk. As said,
this communication setup does not work as intended, therefore it is recommended
that the control system is redesigned so that the control is to be handled in a similar
way as in CL60. In this way, the lighting can be controlled in the same way as the
ventilation is controlled today. That the operating time is set on time channels ac-
cording to the regular operating hours that can be updated when overtime is called
for. This would reduce the operating time of low process lighting from 168 hours
to 127 and from 168 hours to 77 hours for general lighting in a normal week. With
this as a background, it is proposed that the operating times for the lighting in TA3
and TAÖ CL90 be changed according to Table 4.1.
4.3.1.2 Energy savings
The energy savings are calculated based on all production lighting having the pro-
posed operating times.
184. Results
Electricity cost: 0.54 sek/KWh
Electricity: 595 MWh Total/year
Cost savings: 321 533 kr/year
4.3.1.3 Complexity and risk
As the operating hours in most parts of the factory are around the clock on weekdays
and daytime on weekends, some changes will need to be made during operation,
which increases the complexity somewhat. However, good planning can minimize
this complication. There is some maintenance work outside the normal operating
hours that would also need lighting, which can be disadvantaged by controlling the
lighting in the proposed way. Therefore it is important to make it possible for
maintenance personnel to have access to local buttons that gives them the required
lighting.
4.3.1.4 Side values
The fact that the lighting is on less time, it will increase the service life of the lighting
and reduces the need for maintenance. During the summer, the excess heat in the
factory premises decreases when the heat dissipation from the lighting decreases.
However, for the same reason you might buy more heat in the winter.
4.3.2 Change to LED lights in TA3 and TAÖ
In the TA factories the distribution of light sources differs. In TAÖ about 45% of
the armatures are LEDs, in TA3 only 3% of the armatures are LEDs. The rest
of the armatures are still fluorescent tubes with a mix of T8 and T5 tubes. The
remaining 3673 Fluorescent armatures in TAÖ and TA3 should be changed to LEDs
to lower the energy usage from lighting. By changing to LED lights mainly two
positive effects will happen. The first thing is much lower energy usage, due to
the improved luminous efficacy from the LEDs. The second improvement will be
lower maintenance cost over time, hence the much longer service time. These effects
will therefore not only lower the energy usage and cost but also lower the cost for
maintenance. As can be seen in 2.1.4.4, older light sources such as T8 fluorescent
lamps are being phased out and will not be available on the market in the near future
and will therefore need to be replaced. Therefore it can be a good opportunity to
change to LEDs.
4.3.2.1 In-depth measures
The measure for replacement of the lighting fixtures for each location within the
factories can be seen in Table 4.2. The number of LEDs that are needed to replace
the old lighting fixtures were calculated by comparing the total luminous flux of the
current situation to one with the specified LED alternative. By doing this, the total
light emitted i lumens should therefore be the same.
194. Results Table 4.2: Compiled proposals for the replacement of lighting 4.3.2.2 Savings The energy savings are calculated based on all production lighting having the pro- posed operating times which can be seen in table 4.1. This is done to avoid the savings from 4.3.1 to be calculated twice. Electricity cost: 0.54 sek/KWh Electricity: 1083 MWh Total/year Cost savings: 585 197 Kr/year As mentioned earlier the change to LEDs will lower the need for maintenance, this also leads to some savings. These costs are calculated from the service time of the light source. Maintenance TAÖ: 109 260 kr/year Maintenance TA3: 120 720 kr/year Total: 229980 kr/year Total savings from energy. TAÖ: 266 848kr/year TA3: 318 350 kr/year Total: 585 197 kr/year 4.3.2.3 Project costs The costs for the project/installation costs are presented in table 4.3, below. Table 4.3: Calculated costs for the project 20
4. Results
4.3.2.4 Result
An assessment of the total life cycle costs (LCC), were carried out. See Figure A.7-9
in appendix A. The LCC provided a estimate for the payback time and is presented
below.
TAÖ: 11,1 years
TA3: 11,2 years
The long payback time is due to the high investment cost. However a lot of energy
and money can be saved in the long term.
To get a good holistic view of what effects the measure of replacing the current light-
ing situation with one with only LEDs could have, data where analysed in terms of
economical, ecological and social perspectives.
Seen to the economical perspective a Life Cycle Cost analysis (LCC) were con-
ducted. In the LCC, projecting costs, maintenance costs and running costs were
put together. The result can be seen in Figure A.7-9 in appendix A.
In the Figures we can see that for TAÖ there will be a investment of about 4
000 000 Kr which means that the measure will be payed off in 11.2 years. For TA3
the investment will be around 5 000 000 Kr which means a payback time of 11,1
years. After the payback point running costs will decrease by 376 108 Kr/year for
TAÖ and 439 070 Kr/year for TA3.
For the ecological perspective, energy savings were calculated and converted to CO2e
emissions by using the conversion table from Energimyndigheten. [20] In Figure
A.10-12. the expected CO2e emissions for each factory can be seen. The conclu-
sions that can be drawn from this diagram is that from day one CO2e emissions will
be decreased, due to the reduction of energy usage. However production emissions
for the LEDs have not been added to the calculation here. For TAÖ and TA3 com-
bined this would lead to a reduction of about 4 Tons CO2/year.
Seen to the social perspective, we think it would have an immediate positive ef-
fect. We think that due to the expected lowered need for maintenance, maintenance
personnel will work less with fixing and repairing the lighting. This also means that
the production workers and other personnel in the factory will get a better guarantee
for correct and sufficient light.
4.3.2.5 Complexity and risk
Dismantling just over 3,500 fluorescent lamps and fitting new LEDs is an extensive
task, which needs a lot of planning. As the operating hours in most parts of the
factory are around the clock on weekdays and daytime on weekends, some changes
will need to be made during operation, which increases the complexity somewhat.
It might be a good idea to use the semester or other natural idle scenarios for the
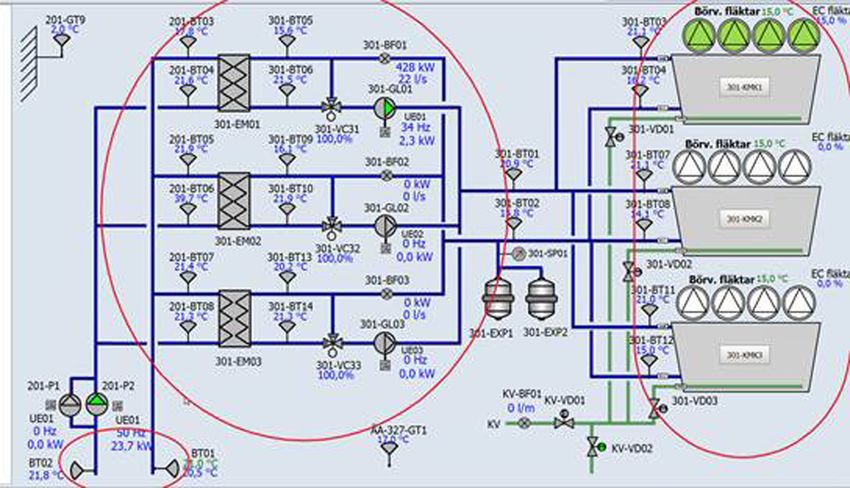
214. Results plant. 4.3.2.6 Side values The change to LEDs will not only lower the energy usage heavily, but also have sev- eral positive effects as mentioned earlier.The longer service life of the lighting will reduce the need for maintenance. The LEDs are much more efficient and therefore have lower heat losses. During the summer, the excess heat in the factory premises will therefore decreases when the heat dissipation from the lighting decreases. How- ever, for the same reason you might buy more heat in the winter. The LEDs also have improved functionality when it comes to communication with the control sys- tem and can give notice when its health gets low. This means that the maintenance for the lighting can be planned more efficiently. 4.3.3 Heat recovery There are three separate cooling systems that serve the factory and the processes that generate heat during processing. A system for TA3 and TAÖ, one for laser and one for the old part of the factory located in TAV. description of the system goes as follow, which is the one we got to inspect during our site visit. This cooling system serves the factory parts TA3 and TAÖ. The system emits its heat via three modular coolant coolers of the type AIA VX3 which are located on the ground floor outside the TA3 sub-factory. The cooling system is switched in steps, this means that there is a cooling circuit between the coolant coolers which are then switched to 8 cooling circuits which are located in three substations (pump rooms), these cooling circuits are then switched to the end users. There are three circulation pumps between the heat exchangers and the coolant coolers (301-GL01, GL02 and GL03), these pumps are speed controlled on the temperature sensor 201-BT01 at a set value. the pumps and, if necessary, the other pumps are also started. The fans on the three KMK are regulated by the sensors 301-BT03, 4,7,8,11 and 12. In the circuit between the coolant coolers and the cooling circuit towards the factory are two pumps (201-P1 and 201-P2) which circulate the cooling water which is exchanged between the cool- ing towers and the other three substations. We have measured the flow through 201-P1 and P2, we got 302 cubic meters per hour and as seen in the image,(See Appendix A.4) right there we have ∆T at 1.3 degrees. Now we attend to investigate where this energy can be used. As per given data, we have 302 m3 /hr. (Volumetric Flow) and Temperature Gra- dient of 1.3 degrees, and we need to use this energy against something else in the system to make existing system more energy efficient. Let’s consider about the parts in given system, they are as follows: Heat Exchangers (301-EM01, 301-EM02, 301-EM03), Coolant Coolers (301-GL01, GL02 and GL03), Three Circulation Pumps 301- VC 31, 32, 33), Set Point Fans (Börv. Fläktar), EC Fans Electronically Commutated Fans (EC Fläktar), the tem- perature sensor 201-BT01, Fan regulating sensors the sensors 301-BT03, 4, 7, 8, 22
4. Results

11 and 12, Pumps to measure flow rates (201-P1 and P2), three modular coolant
coolers of the type AIA VX3, Cooling Towers etc

4.3.4    Calculations
We have given that, 302 cubic meters per hour of cooling water is available. This is
nothing but Volume Flow Rate (m3 /hr.). In fluid dynamics, volumetric flow rate is
the volume of fluid which passes per unit time, and is denoted by (Q or V̇ ). The SI
unit is m3 /s. So, first we will convert the unit,

                        V̇ = 302m3 /hr. = 302/3600(m3 /s)                      (4.1)

Hence, V̇ = 0.08388 (m3 /s)

Now, we know that mass flow rate ṁ is the mass of the substance which passes
per unit time. Unit is kg/s.

As per given data, fluid is the cooling water. We know that water has density
of 1000 kg/m3 .

                                     ṁ = ρ · V̇                               (4.2)

                         ṁ = 1000 · 0.08388 = 83.88kg/s                       (4.3)

Mass flow rate available is 83.88 kg/s.

Heat transfer is the fundamental energy engineering operation. Here we will try
to find out, Heat Loss or Heat Gain (i.e. Amount of Heat Energy Transferred).
Heat Energy Transferred is calculated from following formula:

                                Q = m · Cp · Tdiff.                            (4.4)

Where, the specific heat capacity Cp [J/kg. K] is a thermodynamic property specific
of the fluid used to transfer heat. For water, specific heat capacity at constant
pressure is given below. The heat energy required to raise the temperature of 1 kg
of water by 1 K is 4184 joules so the specific heat capacity of water is
4184 J · kg −1 · K −1

                 Q = 83.88(kg/s) · 4.184(KJ/kgK) · 1.3(degrees)                (4.5)

                                                                                 23
4. Results
Q = 83.88(kg/s) · 4.184(KJ/kgK) · (294.95K − 293.65K) (4.6)
Calculating above equation we get,
Q = 456.24(KJ/s) (4.7)
We have to use this available energy, 456.24 KJ/s of heat energy to something else
in our system to make our system more energy efficient.
4.3.5 Suggestions for improving Efficiency of plant
The available water (measured by Temperature Sensor BT 01) (of approx. heat
energy 456.24 KJ/s) can be used in heat exchangers (301-EM01, 301-EM02, 301-
EM03), this may increase efficiency of plant.
4.3.5.1 More about heat exchanger study
The efficiency of the heat exchanger is determined by the temperature difference
between the two liquids. If all other factors remain constant, a heat exchanger
with a greater temperature difference can transfer more heat. Any cooler has a
temperature gradient running through it. We may also investigate what happens
when they are linked in sequence. First, you can read more about the theory of heat
exchanger series and parallel connections.
4.3.5.2 Series benefits
The key benefit of series radiators is that they can maintain consistent flow through
each radiator. This is required for maximum production. You can make all hose
lengths the same and have the same accessories (minor losses) for each route in a
parallel system, but there is no guarantee.
The second benefit of the sequence is that as the flow velocity increases, so does the
turbulence in the cooler. If the liquid is not as strong a heat conductor as gasoline,
it can result in a measurable increase in total heat transfer. Connecting radiators
in series necessitates less accessories. This means less installation time and less leak
points. In the series, the flow rate is higher. The configuration also increases the
pressure drop, pump power demand, and heat added to the liquid by the pump
power draw (everything must go somewhere). [8]
4.3.5.3 Parallel benefits
The second benefit of the sequence is that as the flow velocity increases, so does the
turbulence in the cooler. If the liquid is not as strong a heat conductor as gasoline,
it can result in a measurable increase in total heat transfer. Connecting radiators
244. Results
in series necessitates less accessories. This means less installation time and less leak
points. In the series, the flow rate is higher. The configuration also increases the
pressure drop, pump power demand, and heat added to the liquid by the pump
power draw (everything must go somewhere).
In parallel, a cooler can be separated for operation when it is running. This is a slight
advantage, as the series can be isolated and fixed when running with a few extra
installation add-ons. When the coolers are run in parallel, it is easier to compare
their performance. If a radiator becomes dirty from the inside or the outside, if
there is outside pollution, it is easy to see that one differential is less than the other
without having to do the calculations.[8]
4.3.6 Suggestions
Suggestions improve efficiency or performance of Heat Exchangers:
Fouling effect, Heat transfer coefficient, pressure drop, baffles etc. are responsible
for the efficiency of the heat exchanger. By increasing the flow resistance the heat
transfer rate can be increased by creating the turbulence in the shell side of the heat
exchanger.
The material which is depositing on the inner sides of the tube is responsible for the
formation of fouling; the fouling rate can be reduced by pre- treatment of fluid (wa-
ter). The proper cleaning of the heat exchanger can minimize the effect of fouling.
Passing the higher temperature over the shell side will reduce the fouling rate.
Now let’s consider about baffles plates used in Heat Exchangers. Efficiency can be
improved by using helical baffles. The baffles are used to increase the heat transfer
coefficient by diverting the fluid. The perfect baffle spacing should be done for the
better heat transfer rate. According to some researchers, it is found that, the helical
baffles at 400 inclinations will gives the higher heat transfer rate. Helical baffles
with inclination angles of 40 degree have maximum efficiency in heat transfer and
minimal pressure drop. It offers following advantages:[16]
• Increased heat transfer rates /pressure drop ratio.
• reduced bypass effect
• Reduced maintenance of equipment and prevention of flow induced vibrations.
• Reduced shell-side fouling.
CFD (Computational Fluid Dynamics) software can be used to study such
thermal design analysis. The factors which are responsible for affecting the efficiency
of the heat exchanger is the temperature, heat transfer coefficient and surface area.
This is according to Newton’s Law of Cooling.
The baffles and the flow breakers will definitely increases the surface area,
the wave strip type flow breaker has a less pressure drop, with increased
temperature range and hence the efficiency of the heat transfer (Q) is
improved.
(Note: The scope of improvement of plant efficiency is by improving Existing Heat
Exchanger Design and utilizing available heat energy (due to temperature gradient
of 1.3 degrees) in the Heat Exchanger with proper thermal study.)
25You can also read