Diving Behavior and Fine-Scale Kinematics of Free-Ranging Risso's Dolphins Foraging in Shallow and Deep-Water Habitats
←
→
Page content transcription
If your browser does not render page correctly, please read the page content below
ORIGINAL RESEARCH
                                                                                                                                             published: 12 March 2019
                                                                                                                                        doi: 10.3389/fevo.2019.00053

                                             Diving Behavior and Fine-Scale
                                             Kinematics of Free-Ranging Risso’s
                                             Dolphins Foraging in Shallow and
                                             Deep-Water Habitats
                                             Patricia Arranz 1,2*, Kelly J. Benoit-Bird 3 , Ari S. Friedlaender 4,5 , Elliott L. Hazen 6 ,
                                             Jeremy A. Goldbogen 7 , Alison K. Stimpert 8 , Stacy L. DeRuiter 9 , John Calambokidis 10 ,
                                             Brandon L. Southall 4,5 , Andreas Fahlman 11,12 and Peter L. Tyack 1
                                             1
                                               Sea Mammal Research Unit, School of Biology, Scottish Oceans Institute, University of St Andrews, St Andrews,
                                             United Kingdom, 2 Biodiversity, Marine Ecology and Conservation Group, Department of Animal Biology, University of La
                                             Laguna, La Laguna, Spain, 3 Monterey Bay Aquarium Research Institute, Moss Landing, CA, United States, 4 Institute of
                                             Marine Sciences, University of California, Santa Cruz, Santa Cruz, CA, United States, 5 Southall Environmental Associates,
                                             Aptos, CA, United States, 6 Environmental Research Division, NOAA Southwest Fisheries Science Center, Monterey, CA,
                           Edited by:
                                             United States, 7 Department of Biology, Hopkins Marine Station, Stanford University, Monterey, CA, United States,
                    Thomas Wassmer,
                                             8
                                               Vertebrate Ecology Lab, Moss Landing Marine Laboratories, Moss Landing, CA, United States, 9 Department of
              Siena Heights University,
                                             Mathematics and Statistics, Calvin College, Grand Rapids, MI, United States, 10 Cascadia Research Collective, Olympia, WA,
                        United States
                                             United States, 11 Fundación Oceanogràfic, Valencia, Spain, 12 Woods Hole Oceanographic Institution, Woods Hole, MA,
                        Reviewed by:         United States
                  Stephen J. Trumble,
       Baylor University, United States
                           Kagari Aoki,      Air-breathing marine predators must balance the conflicting demands of oxygen
            University of Tokyo, Japan       conservation during breath-hold and the cost of diving and locomotion to capture prey.
                  *Correspondence:           However, it remains poorly understood how predators modulate foraging performance
                       Patricia Arranz
                        arranz@ull.es        when feeding at different depths and in response to changes in prey distribution and type.
                                             Here, we used high-resolution multi-sensor tags attached to Risso’s dolphins (Grampus
                  Specialty section:         griseus) and concurrent prey surveys to quantify their foraging performance over a range
        This article was submitted to
 Behavioral and Evolutionary Ecology,
                                             of depths and prey types. Dolphins (N = 33) foraged in shallow and deep habitats
               a section of the journal      [seabed depths less or more than 560 m, respectively] and within the deep habitat, in
   Frontiers in Ecology and Evolution
                                             vertically stratified prey features occurring at several aggregation levels. Generalized linear
            Received: 25 July 2018
                                             mixed-effects models indicated that dive kinematics were driven by foraging depth rather
        Accepted: 14 February 2019
         Published: 12 March 2019            than habitat. Bottom-phase duration and number of buzzes (attempts to capture prey)
                              Citation:      per dive increased with depth. In deep dives, dolphins were gliding for >50% of descent
              Arranz P, Benoit-Bird KJ,      and adopted higher pitch angles both during descent and ascents, which was likely to
           Friedlaender AS, Hazen EL,
          Goldbogen JA, Stimpert AK,
                                             reduce energetic cost of longer transits. This lower cost of transit was counteracted by
         DeRuiter SL, Calambokidis J,        the record of highest vertical swim speeds, rolling maneuvers and stroke rates at depth,
 Southall BL, Fahlman A and Tyack PL
                                             together with a 4-fold increase in the inter-buzz interval (IBI), suggesting higher costs of
(2019) Diving Behavior and Fine-Scale
   Kinematics of Free-Ranging Risso’s        pursuing, and handling prey compared to shallow-water feeding. In spite of the increased
     Dolphins Foraging in Shallow and        capture effort at depth, dolphins managed to keep their estimated overall metabolic
                 Deep-Water Habitats.
                Front. Ecol. Evol. 7:53.
                                             rate comparable across dive types. This indicates that adjustments in swimming modes
       doi: 10.3389/fevo.2019.00053          may enable energy balance in deeper dives. If we think of the surface as a central

Frontiers in Ecology and Evolution | www.frontiersin.org                           1                                                 March 2019 | Volume 7 | Article 53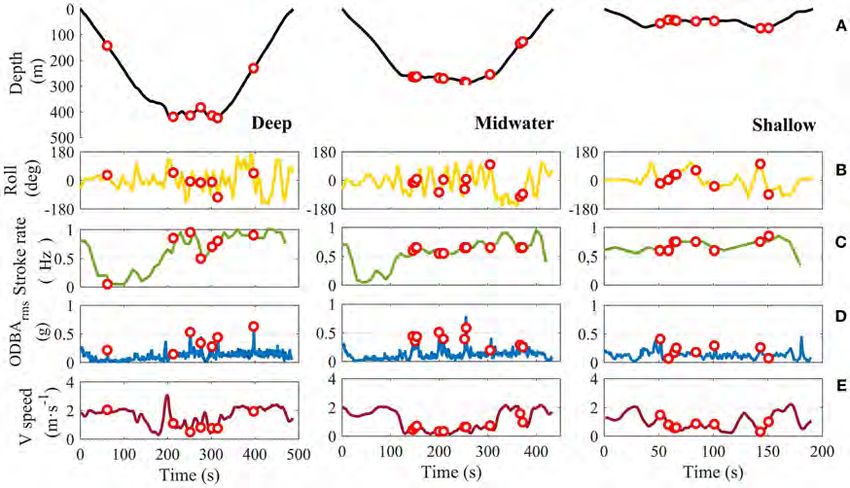
Arranz et al.                                                                                                                     Risso’s Dolphins Foraging

                                             place where divers return to breathe, our data match predictions that central place
                                             foragers should increase the number and likely quality of prey items at greater distances.
                                             These dolphins forage efficiently from near-shore benthic communities to depth-stratified
                                             scattering layers, enabling them to maximize their fitness.

                                             Keywords: deep diving odontocete, foraging energetics, marine mammal, Grampus griseus, activity level, prey
                                             value, central place foraging theory

INTRODUCTION                                                                      animals should feed on higher value prey to optimize foraging
                                                                                  efficiency (Schoener, 1969, 1979). It is known that toothed whales
When animals are foraging, their efficiency can be defined as the                 (Odontoceti) hunt and capture individual prey across a wide size
difference in energy gained from ingesting prey relative to the                   range (Clarke, 1996; Andersen et al., 2016); however it remains
energy expenditures associated with searching for and capturing                   unclear whether odontocetes selectively vary feeding rates when
prey (Parker et al., 1996). Therefore, to increase efficiency,                    feeding at different depths and/or modulate their locomotor and
animals must minimize the cost of prey capture (Williams                          diving performance in response to changes in prey distribution
et al., 2000) and/or increase the energetic benefits from prey                    and availability. To test the above hypothesis, we explore the fine-
(Watanabe and Takahashi, 2013; Watanabe et al., 2014). To                         scale foraging behavior and kinematics of the cephalopod-eating
minimize locomotor costs, aquatic animals adopt gliding gaits,                    Risso’s dolphin using motion-sensing and acoustic recording tag
and slow swimming speeds to decrease drag and the energetic                       data to quantify the foraging performance of this species in
requirements of searching for food (Williams, 2001; Fahlman                       the wild.
et al., 2008, 2013; Watanabe et al., 2011). To increase energy
intake, they can increase feeding rates by extending the time
spent in a prey patch (Doniol-Valcroze et al., 2011; Wilson et al.,               MATERIALS AND METHODS
2011), or selecting prey patches of higher quality (Orians and
Pearson, 1979). Higher quality prey can take the form of larger                   Dolphin Data Collection
bodied prey for animals that take prey individually (i.e., particle               Archival tags (Johnson and Tyack, 2003) were attached
feeders, hunting predators), greater densities of the same type                   dorsally to free-ranging Risso’s dolphins off Santa Catalina Island,
for multiple-prey loaders (i.e., filter feeders or grazers), or other             California during field efforts from 2010 through 2016. The
prey changes that decrease handling time or increase catch per                    tags had a suction-cup system that released at local sunset,
unit effort. Moreover, the cumulative benefit from a foraging                     or unintentionally due to movement of the dolphins. They
bout may increase due to a combination of these processes and                     were positively buoyant and transmitted a VHF signal when
mechanisms (Daniel et al., 2008; Doniol-Valcroze et al., 2011;                    at the surface, allowing tracking, and recovery. Stereo acoustic
Gibb et al., 2016). However, what remains poorly understood is                    data were sampled with 16-bit resolution at a sampling rate
how predators modulate foraging performance when faced with                       of 240 kHz, except for tag gg11_216a where 120 kHz was used.
heterogeneous, dynamic prey-scapes (Friedlaender et al., 2016).                   Data from the other sensors were sampled at 200 Hz per channel
   Many animals across taxonomic groups and environments                          and converted into depth, pitch, roll, and heading of the tagged
are central place foragers where feeding bouts occur far from a                   animal, following methods described in Johnson and Tyack
return location (Houston and McNamara, 1985). Air-breathing                       (2003). Pressure and accelerometer data were decimated to 20
divers can be described as central place foragers, where the sea                  and 5 Hz, respectively, before analysis. Analyses were carried
surface is the return location that provides a critical source of                 out in Matlab 9.1.0 (http://www.mathworks.es/) using the DTAG
oxygen replenishment (Kramer, 1988). In this context, divers face                 toolbox (https://www.soundtags.org/dtags/dtag-toolbox/) and
the conflicting demands of oxygen conservation during apnea                       custom-made scripts. A subset of 18 tagged dolphins were subject
and the energetic costs associated with diving, swimming, and                     to controlled acoustic playback exposure experiments (CEE)
feeding (Davis et al., 2004). Therefore, diving foragers must                     (Table 1). Detailed exposure protocols are described in Southall
balance managing oxygen stores while maximizing net energy                        et al. (2012). Dives were classified as “non-CEE,” “pre-exposure,”
intake during feeding at depth (Hazen et al., 2015). If the high                  “CEE,” or “post-exposure,” depending on the time overlap with
energetic costs of feeding deplete body oxygen stores, this in                    the onset and end of the acoustic stimuli. Generalized additive
turn would reduce aerobic diving capacity and thus impose a                       mixed models (GAMMs) were used to assess the effect of
potential constraint on foraging performance (Croll et al., 2001;                 CEE mode and type on two representative metrics of foraging
Acevedo-Gutiérrez et al., 2002; Goldbogen et al., 2012).                          performance. We fitted GAMMs using maximum dive depth and
   Central place foraging theory predicts that predators should                   buzz rate as response variables, including CEE categorical data
only swim farther from the central place to encounter increasing                  as a factor and individual dolphin as random effect, to identify
numbers or quality of prey (Carbone and Houston, 1996).                           potential behavioral responses as a function of CEE mode (non-
When the same prey resource is targeted, diminishing energetic                    CEE, pre-CEE, during-CEE, and post-CEE) and type (non-CEE,
returns are expected at increasing distances from the central                     Control, PRN, Simul-MFA, Real MFA). As we were testing a
place, because of increased travel time. Thus, at greater distances               specific hypothesis no model selection was needed. This statistical

Frontiers in Ecology and Evolution | www.frontiersin.org                      2                                           March 2019 | Volume 7 | Article 53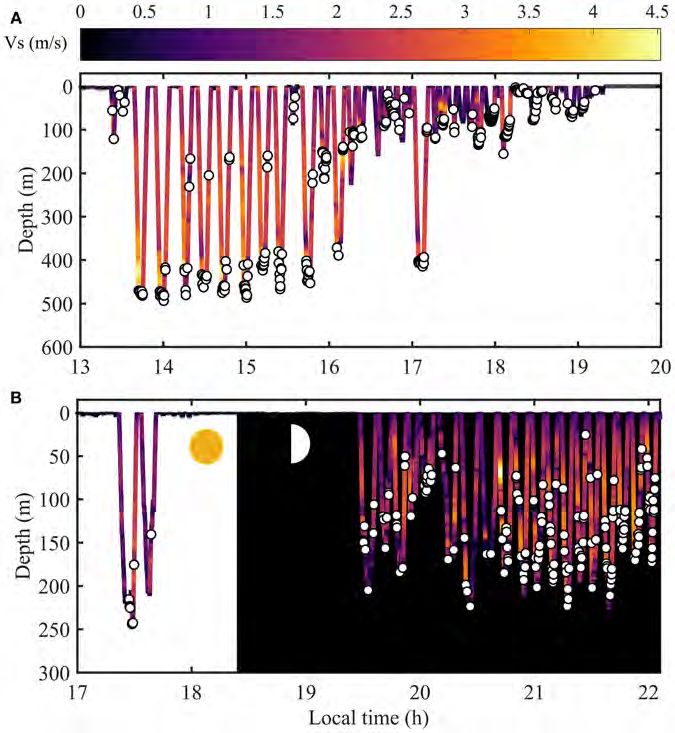
Arranz et al.                                                                                                          Risso’s Dolphins Foraging

approach allowed us to assess whether there was a behavioral             platforms used is provided by Moline et al. (2015) while Benoit-
response as a consequence of CEE, which was important to                 Bird et al. (2017) provide a detailed description of biological
determine if the full Grampus tag dataset could be pooled across         sampling and active acoustics methodology. Briefly, acoustic
CEE modes and types for further analysis. Foraging models were           scattering data were processed using Echoview and individual
fitted as a functions of dive metrics and of CEE modes and types,        prey detected from the AUV within scattering features were
using the mgcv 1.8–15 package (Wood, 2011) in R 3.3.2 “Sincere           identified as single targets (Sawada et al., 1993), providing
Pumpkin Patch” (http://www.R-project.org/).                              measurements of target strength at two frequencies. Frequency
    Focal follows of tagged animals were conducted whenever              differencing was used to facilitate coarse taxonomic classification
possible, avoiding approaches closer than 25 m. Observations             (i.e., fish, squid, or crustacean) while target strength was used
were made from the tag boat with the aid of binoculars and               as a proxy of length within each taxonomic class. Calculation
VHF radio tracking equipment. Individuals were identified via            of inter-individual spacing of prey in layers was measured
photos of their dorsal fin and scar pattern, which facilitated           using the nearest neighbor distance for each individual target
tagging different individuals every time. Location of the tagged         sampled by the AUV, both in the beam and along the track.
animals was recorded with a GPS on board and seabed depth                The dominant composition of layers identified from the active
at dolphin sighting locations was extracted using NOAA’s                 acoustics was determined using a net towed at relatively high
NGDC bathymetric charts in ArcMap 9.2 (Environmental                     speed (1–2.2 m s−1 ) that captured mobile organisms between 1
Systems Resource Institute, Redlands, CA, USA) with 3-                   and 35 cm body length. This catch matched the composition
arc second resolution (https://www.ngdc.noaa.gov/mgg/coastal/            identified acoustically (Benoit-Bird et al., 2017). Sampling of the
grddas06/grddas06.htm). Average seabed depth was estimated               deep-water habitat of the dolphins was coincident in space and
from all positions gathered during each tag deployment and               time with tagging of two of the 33 dolphins (tag id gg13_266b and
the maximum depth of the deepest dive recorded among the                 gg13_267a, Table 1). The spatial coverage of the prey mapping
33 dolphins. This was 560 m, considering that in the deep-               and its overlap with the tag data is presented in Figure 2
water habitat the seabed must be deeper than the deepest dive            in Arranz et al. (2018). Another 15 dolphins were tagged in
recorded. In this way dolphins were broadly classified as foraging       the same general habitat, 6 of them in the same year. Prey
in a shallow or deep-water habitat (Table 1). Only two of the            fields in the shallow-water habitat were not sampled in this
dolphins (data sets gg14_223a and gg14_253a) were close to               study. Dolphins in shallow-water habitat were mostly tagged
the boundary defined by this depth threshold, as they remained           in 2013, when increased upwelling productivity conditions may
above average seabed depths of 450 and 500 m, respectively.              have influenced prey availability, particularly of market squid
Those depths may have allowed deep diving but if so, foraging            (Doryteuthis opalescens) in coastal waters off the island. Hence
would likely have occurred close to the seabed, in the benthic           the dolphin’s foraging opportunities were higher close to shore
boundary layer (Angel and Boxshall, 1990). Given the differences         (Vanderzee et al. pers. comm.). This was supported by visual
between benthopelagic and pelagic organisms, these dolphins              observations during tagging in 2013, when market squid were
were classified as in a shallow-water habitat. Moreover, data for        observed at the surface and in the mouths of Risso’s dolphins.
each dive were analyzed with respect to which habitat the dolphin        Dives occurring within the shallow-water habitat were classified
was in, based on the seabed depth of the closest focal follow            based on their depth distribution as Shallow (100 m), for comparison of dive parameters.
dive. We acknowledge the low accuracy of these estimates but the
seabed depth at the nearest focal follow location was considered         Kinematic Analyses
a representative measure of the type of foraging habitat                 Dives were defined as vertical excursions exceeding 20 m depth.
used by the animal. Dives without focal follow information               Dives recorded within 15 min of tag-on were excluded from
within the 15 min time window was not considered for                     the analysis, to remove data potentially affected by the tagging
kinematic analyses.                                                      procedure (the 15 min duration is roughly equivalent to two deep
                                                                         dives or 5 shallow dives by this species). Incomplete dives at the
Prey Data Collection                                                     start or end of the record (caused by a delay in triggering the
Data on the distribution of prey in the Catalina Basin, off the          salt water switch or release at depth) were also excluded. Dives
eastern coast of Santa Catalina Island, California, comprising           performed in the deep-water habitat were classified according
the deep-water habitat of the dolphins, were obtained from ship          to their maximum depth and the prey feature targeted in the
and underwater autonomous vehicle (AUV) based hydroacoustic              bottom phase (sensu Arranz et al., 2018). Echolocation clicks
surveys. The ship transects covered seabed depths ranging from           and buzzes from the tagged dolphin, respectively, indicative of
300 to 900 m and the AUV sampled pre-defined depths between              prey search and capture attempts within dives, were isolated
50 and 500 m, depending on the location of prey layers. Both             using a supervised click detector together with spectrogram
platforms were equipped with Simrad EK60 echo sounders at 38             visualizations of acoustic recordings, following the methods
and 120 kHz. The AUV survey provides a 15 × 10 cm sampling               described in Arranz et al. (2016). The interpretation that buzzes
resolution in horizontal and vertical planes, respectively. This         are associated with prey capture attempts has been confirmed for
allowed individual animals to be observed within scattering              several echolocating marine mammals, including sperm whales
features, whereas the ship-based sensors provided a view of              (Miller et al., 2004), beaked whales (Johnson et al., 2004), pilot
entire features. Comprehensive explanation of the sensors and            whales (Aguilar de Soto et al., 2008), porpoises (Deruiter et al.,

Frontiers in Ecology and Evolution | www.frontiersin.org             3                                         March 2019 | Volume 7 | Article 53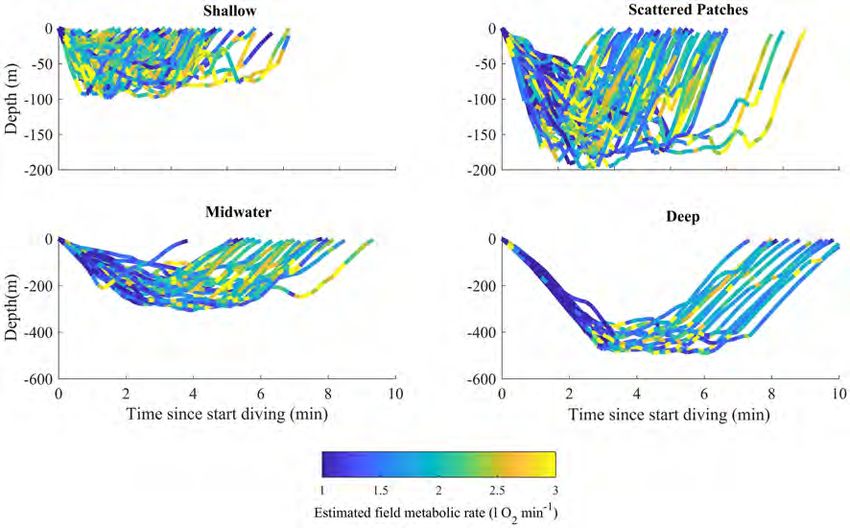
Arranz et al.                                                                                                                                                  Risso’s Dolphins Foraging

TABLE 1 | Risso’s dolphins tagged off California from 2010 to 2016.

Tag record ID          Age class         CEE type           Tag on (h:m)         RD (h)           FD/Ttal             Pre/CEE/                     Seabed depth                  Habitat
                                                                                                 Dives (Nr)         Post dives (Nr)                  (m)/(Nr)                     type

gg10_266a              Unknown            Non-CEE               10:01              0.3              0/ 4                  4/0/ 0                 773 [312–859]/26                   DE
gg10_266b              Unknown            Non-CEE               10:01              1.8              0/ 4                 4 /0/ 0                 773 [312–859]/26                   DE
gg11_266a                 Adult           Non-CEE                7:29              0.6              0/ 1                  1/0/0                   809[646–933]/6                    DE
gg11_272a                 Adult           Non-CEE               13:25              4.5              0/2                   2/0/0                 1015 [963–1188]/50                  DE
gg13_204a                 Adult           Non-CEE               11:35              0.7             1/4                    4/0/0                   164 [31–507]/30                  SH
gg13_215a                 Adult           Non-CEE               12:38              1.4              0/0                   0/0/0                   717 [705–729]/2                   DE
gg13_230a                 Adult           Non-CEE               15:00              1.5             3/11                  11/0/0                  662 [491–854]/41                   DE
gg13_264a              Sub-adult          Non-CEE               10:57              1.0              5/7                   7/0/0                    111 [83–143]/8                  SH
gg13_267a*                Adult           Non-CEE               11:44              6.8             21/24                 24/0/0                  598 [408–746]/11                   DE
gg13_270a                 Adult           Non-CEE               09:25              0.7              8/8                   8/0/0                   295 [75–478]/27                  SH
gg13_270b              Sub-adult          Non-CEE               13:58              3.3              0/4                   4/0/0                    400 [230–478]                   SH
gg15_223a+                Adult           Non-CEE               08:28              2.3             16/20                 20/0/0                  483 [378–584]/35                  SH
gg_14_253a+            Sub-adult          Non-CEE               13:07              1.3              5 /7                  7/0/0                   467 [98–511]/14                  SH
gg16_230a                 Adult           Non-CEE               12:30             1.25              4/7                   7/0/0                   337[184–460]/3                   SH
gg16_237a                 Adult           Non-CEE               09:15             1.75              4/9                   9/0/0                   531[531–531]/2                    DE
gg13_204b                 Adult             CTRL                13:35              3.3              1/2                   2/0/0                   164 [31–507]/30                  SH
gg13_212a              Sub-adult            CTRL                16:00              1.1              0/6                   5/1/0                    242 [90–472]/8                  SH
gg13_261a                 Adult             CTRL                 8:58              4.9             10/13                 13/0/0                  592 [212–813]/73                   DE
gg13_262a                 Adult             CTRL                 7:25              6.4             19/21                 19/0/2                    76 [19–173]/62                  SH
gg13_262b#                Adult             CTRL                 8:26             13.5             28/29                 3/0/26                    83 [69–856]/77                  SH
gg13_262c#                Adult             CTRL                 9:57              9.9             5/13                  1/0/12                    83 [69–856]/77                  SH
gg14_254a              Sub-adult            CTRL                08:36              3.3              0/8                   8/0/0                    127 [9–245]/2                   SH
gg11_265a              Unknown              PRN                 12:41              6.6             36/53                27/3/23                   103 [89–290]/39                  SH
gg12_209a              Unknown              PRN                 14:13              3.8              0/0                   0/0/0                 978 [393–1232]/97                   DE
gg13_190a                 Adult           Real MFA              12:40              5.1             6/10                   9/0/1                 621 [104–1170]/35                   DE
gg13_213a                 Adult           Real MFA              16:09              0.3              0/1                   1/0/0                   575[153–984]/9                    DE
gg11_216a              Unknown           Simul MFA              12:18              8.4             33/37                 0/5/32                  573 [387–634]/54                   DE
gg11_264a              Unknown           Simul MFA              10:52              5.3              0/7                   4/0/3                  569 [450–692]/44                   DE
gg11_269a              Unknown           Simul MFA              11:30              9.9             3/11                  0/1/10                  654 [240–901]/72                   DE
gg13_255a                 Adult          Simul MFA              14:00              6.5              3/7                   4/0/3                  345 [231–911]/70                  SH
gg13_255b                 Adult          Simul MFA              15:18              4.4              0/0                   0/0/0                 618 [424–1286]/17                   DE
gg13_266a               Juvenile         Simul MFA              11:17              3.1              0/5                   5/0/0                   228 [39–489]/36                  SH
gg13_266b*                Adult          Simul MFA              11:23              2.3             12/13                 11/2/0                  762 [540–788]/41                   DE

Tag record ID: identification of the tag recording from each dolphin. CEE type: Type of control exposure experiment (CEE) - Non-CEE, outside the context of CEEs; CTRL, control; PRN,
Pseudo-random noise; Real MFA, Real Medium Frequency Sonar (MFA); Simul MFA, Simulated MFA. Tag on: Local time of tag deployment; RD: record duration, in hours. FD/Ttal dives:
Nr of foraging dives and total Nr of dives recorded. Pre/CEE/Post dives: Nr of dives recorded before during and after the CEE transmissions. Seabed depth: mean and range in brackets
of the bathymetry at the positions of the tagged dolphin’s focal follows with Nr of focal follows. Habitat: Type of habitat where dolphins distributed (see methods for detailed description
of habitat classification). *Dolphins with concurrent prey data available. + Dolphins likely foraging benthopelagically. # Dolphins moved offshore during the afternoon.

2009), and belugas (Ridgway et al., 2014). Foraging dives were                                   exceeded 70% of the maximum dive depth. The ascent phase
defined as including one or more buzzes. For each dive, the mean                                 started at the last time the depth exceeded 70% of maximum
descent and ascent depth rates and the proportion of descent time                                dive depth and ended when the dolphin reached the surface. The
spent gliding were computed. Fluke strokes were identified in                                    bottom phase was defined as the period from the first to the last
the recordings as cyclic variations in the pitch with a magnitude                                time the depth exceeded 70% of the maximum dive depth. The
>3 degrees and with a period between 0.4 and 5 s, estimated                                      inter-buzz interval (IBI) was estimated as the time elapsed since
from a nominal fluking period of 1.5 s for Risso’s dolphin. The                                  the end of a buzz and the start of the next one. The vertical
stroke count was verified visually by checking the pitch angle in                                swim speed was computed as the rate of change in depth (as in
random sections of the record. Glides were defined as 10 s time                                  Aguilar de Soto et al., 2008).
intervals with no stroking. Descent, bottom and ascent phases
in dives were defined following a 70% rule, as in Arranz et al.                                  Energetic Analyses
(2016). The descent phase of each dive was considered the period                                 As a proxy for the activity level of the dolphins we computed the
from when the dolphin left the surface to the first time the depth                               overall dynamic body acceleration (ODBA, Wilson et al., 2006)

Frontiers in Ecology and Evolution | www.frontiersin.org                                     4                                                       March 2019 | Volume 7 | Article 53
Arranz et al.                                                                                                                                  Risso’s Dolphins Foraging

as the norm of the high-pass filtered acceleration resulting from                      and multiplying by the estimated body mass (M b ), or (3) using
the movement of the animal and recorded by the tag sensors                             Kleiber’s equation (Equation 1) for terrestrial mammals and the
(ODBA tool from the soundtags toolbox). Cut-on frequency                               estimated M b of the tagged dolphin (Kleiber, 1947). The M b of
required for ODBA estimation was set to 0.35 Hz (about half of                         tagged Risso’s dolphins was approximated from individual age
the normal stroking rate for these dolphins). Previous studies                         class (Table 1), implying a mass of 500 kg for adults and 300 kg
have shown that ODBA is a reasonable proxy for metabolic rate                          for sub-adults and juveniles (Jefferson et al., 2008).
in marine mammals (Fahlman et al., 2013) although other studies
report difficulty in observing such a relationship (Halsey et al.,                                            V̇O2min = 0.00993 ∗ M0.75
                                                                                                                                   b                                (1)
2011; Halsey, 2017). An exploratory analysis of this relationship
in Risso’s dolphins is presented here, assuming that for each                          V̇O2max was modeled in two different ways (Table S1 in Data
individual dolphin, the lowest ODBA recorded on each dive                              Sheet S1): scaling up V̇O2min (1) by 5 times or Metabolic
(ODBAmin ) corresponded to the V̇O2min , or estimated resting                          Equivalents of Task (MET’s, Savage et al., 2007), a level
metabolic rate (RMR) and the highest ODBA for each dive                                of exercise that one would expect animals to undertake
(ODBAmax ) corresponded to its V̇O2max or estimated maximum                            routinely; or (2) by the Hoppeler equation (Equation 2)
metabolic rate.                                                                        (Weibel and Hoppeler, 2005).
   For comparative purposes, we modeled V̇O2min in three ways                                                  V̇O2max = 0.118 ∗ M0.87
                                                                                                                                  b                                 (2)
(Table S1 in Data Sheet S1): (1) using the measured V̇O2min from
the smaller bottlenose dolphin (Tursiops truncatus) (Equation 3.2                      A regression equation was built using estimated V̇O2min , aV̇O2max
in Fahlman et al., 2018) and scaled allometrically for the larger                      for each dolphin, in one of the ways described above, estimated
Risso’s dolphin, (2) assuming an average mass-specific V̇O2min                         ODBAmin and ODBAmax for a given dive. We acknowledge
of 3.9 ml O2 kg min−1 (Figure 3B in Fahlman et al., 2018)                              reasonable concerns about generating a regression equation from

 FIGURE 1 | Dive profiles from two Risso’s dolphins with (A) the longest period of time with consistent deep dives and (B) the longest night time foraging period
 recorded, among 33 tagged individuals. Prey capture attempts are represented by white circles. Dive profile is colored according to vertical swim speed (Vs).

Frontiers in Ecology and Evolution | www.frontiersin.org                           5                                                  March 2019 | Volume 7 | Article 53
Arranz et al. Risso’s Dolphins Foraging
two data points, but it allowed us to estimate the V̇O2 (or modeled using gamma family with log link, to account for right-
field metabolic rate) of the dive based on the overall activity. skew and overdispersion of residuals, and for number of buzzes
Regression lines were re-calculated for each dive to account a negative binomial type I with log link and an offset for dive
for different tag placements within the same individual (due duration, since data are count data, and to account for right skew
to potential tag moves) and likely variation of minimum and and overdispersion of residuals. We used ANOVA to compare
maximum ODBA values amongst dolphins (Figure S1 in Data models with and without habitat and dive type as predictors, and
Sheet S1). The resulting intercept and slope of the regression line in the case of a significant result, we used Tukey’s method to
obtained for a given dive were multiplied either by the average assess pairwise differences between dive types [using R package
ODBA of the dive+ surface interval, to estimate the average V̇O2 emmeans (Lenth, 2018)].
per dive, or by the average ODBA of the dive phase (descent,
bottom and ascent) to estimate the average V̇O2 of each phase, RESULTS
as follows:
A total of 124 h of acoustic and movement data from 33 Risso’s
V̇O2 = [(V̇O2min − ODBAmin ∗ slope) + (V̇O2max − V̇O2min ) dolphins (20 adults, 5 sub-adults, 1 juvenile, and 7 individuals
/ODBAmax − ODBAmin )] ∗ ODBAdive/phase (3) of unknown age) resulted in 331 dives during 22 deployments
as analyzed here. Most tags recorded data during daytime only
Recorded ODBAmin and ODBAmax per dive were regressed but two documented 2 h 19 min and 3 h 30 min after local sunset,
as a function of duration of the deployment, to rule out respectively, resulting in an overall time coverage from 7:25 a.m.
correlation between these variables (Figure S2 in Data Sheet S1). to 9:57 p.m. local (UTC−7) (Table 1, Figure 1). No clear time-
The ratio between the estimated metabolic costs of each dive of-day dependent pattern of feeding behavior or inshore-offshore
phase in different dive types was used comparatively, to assess movements were detected from plots of the seabed depth at
relative differences in dolphin metabolic costs when diving to the focal follow positions of the dolphins in relation to time
different depths. of day. These results are based on a small sample size without
full day/night periods from tag records. GAMMs revealed no
Statistical Modeling significant effect of CEEs on the buzz rate per dive nor the
To assess differences in dive parameters by dive type, we used maximum dive depth in any of the 18 out of 33 tagged dolphins
generalized linear mixed-effects models fitted in R, using the subject to the experiments (Table 2).
package glmmTMB (Brooks et al., 2017). We modeled each dive
parameter as a function of habitat and dive type, controlling for Habitat
effects of age class (via fixed effects) and individual differences Hydroacoustic sampling of the biotic structure in the water
and temporal autocorrelation (via a random intercept of tag column throughout the Santa Catalina Basin >560 m seabed
ID). We used Gaussian models with identity link, except for the depth, i.e., deep-water habitat, revealed prey fields vertically
following parameters. Inter-buzz interval and buzz duration were stratified into four prey features comprising three sound-
scattering layers. Each prey layer was horizontally identified as
follows: Shallow [30–90 m], Midwater [200–300 m], and Deep
[350–450 m], and a zone of scattered patches between 100
TABLE 2 | Generalized Additive Mixed Model (GAMM) estimates for the effects of
mode and type of Controlled Exposure Experiments (CEE) on behavioral criteria of
and 200 m depth named Intermediate (see Figure 2 in Arranz
33 Risso’s dolphins. et al., 2018). The shallow layer was dominated by larval fish
and small crustaceans, the midwater layer by myctophids and
Parametric Estimate Std. Error t- value Pr(>|t|) krill, and the deep layer primarily by dragonfish, squid, shrimp,
coefficients:
and large krill (Benoit-Bird et al., 2017). Scattered patches
Buzz rate R-sq.(adj) = 0.03 were not directly sampled to confirm potential composition
Scale est. = 29.48 but echo characteristics were consistent with small schooling
n = 277 fish. Measures of the horizontal patch structure are reported
by Benoit-Bird et al. (2017). Prey patch aggregations had
(Intercept) 0.23 1.46 3.59 0.001 similar topological extent, 100 individuals across, irrespective
CEE mode 0.73 0.48 1.49 0.14 of taxonomic composition, animal size, and depth. Inter-
CEE type −1.06 0.67 −1.58 0.12 individual spacing increased with relative animal size within
each taxonomic group. When Grampus were detected by AUV
Max Dive depth R-sq.(adj) = −0.001
echosounder sampling in the deep-water habitat of the dolphins,
Scale est. = 10494
they were found mostly within the boundaries of monospecific
n = 300
aggregations with a frequency response corresponding to
(Intercept) 70.93 26.27 2.70 0.007 squid (Benoit-Bird et al., 2017). About half of the dolphins
CEE mode 15.87 8.78 1.81 0.07 (N = 17) stayed within the deep-water habitat during most
CEE type 7.21 12.13 0.59 0.55 of the recording time, whereas the other animals (N = 16)
The response variables are buzz rate and maximum dive depth with individual dolphin as stayed in shallow-water habitat (Table 1). In the deep-water
random effect. habitat, 39% of the dives performed by the dolphins were
Frontiers in Ecology and Evolution | www.frontiersin.org 6 March 2019 | Volume 7 | Article 53Arranz et al. Risso’s Dolphins Foraging shallow (to a max depth of 30–90 m), 35% intermediate (to a maximum depth of 90–200 m), 15% midwater (to a maximum depth of 200–300 m), and 8% were deep dives (to a maximum depth >350 m). Foraging Behavior Dolphins spent 83 (SD 48)% of the time near (
Arranz et al. Risso’s Dolphins Foraging
TABLE 3 | Kinematic data for Risso’s dolphins foraging dives, pooling dives from all tagged dolphins by habitat type and depth layer.
Shallow–water (N = 133) Deep–water habitat (N = 168)
Units Shallow Intermediate Shallow Scattered Patches Midwater (N = 32) Deep (N = 18)
(N = 95) (N = 38) (N = 71) (N = 42)
Depth m 57[20, 99] 144[100, −266] 54[20, 97] 151[101, 198] 240[200, 309] 460[386, 566]
Duration min 3.4[1.3, 5.9] 4.8[3.0, 8.0] 2.9[0.2, 6.9] 5.0[3.2, 9.0] 6.5[3.1, 9.4] 8.9[7.4, 10.7]
% feeding % 52% 94% 53% 92% 90% 89%
Nr buzz n dive·−1 5.7[0, 38] 6.8[0, 22] 2.3[0, 32] 6.5[0, 19] 8[1, 18] 9[3, 16]
Bot duration min 1.7[0.2, 4.5] 1.9[0.7, 3.9] 1.2[0, 4.7] 2.2[0.6, 4.7] 2.9[0.9, 5.7] 4.1[1.8, 5.9]
Bot stroke r Hz 0.5[0.1, 1.1] 0.7[0.3, 1.0] 0.5[0.2, 0.9] 0.6[0.1, 1.0] 0.6[0.4, 0.9] 0.7[0.6, 0.8]
Bot buzz r nmin −1 2[0.6, 8] 3[0.6, 9] 1[0.4, 10] 2[0.3, 7] 2[0.2, 5] 2[0.5, 3]
Buzz duration s 0.8[0.3, 5.7] 1.6[0.3, 4.3] 0.7[0.4, 4.5] 1.2[0.3, 4.0] 1.1[0.3, 2.0] 1.5[0.4, 5.7]
IBI s 13.3 [7.0, 24.0] 20.0[5.1, 47.5] 7.23[3.7, 14.6] 26[12.4, 49.8] 27[8, 68] 31[6, 85]
Buzz depth m 34[0, 92] 111[0, 188] 25[0, 80] 109[0, 193] 171[98, 241] 371[210, 488]
Desc stroke r Hz 0.4[0.05, 0.85] 0.5[0.1, 0.8] 0.5[0, 0.9] 0.5[0.06, 1.2] 0.4[0.2, 1.2] 0.3[0.2, 0.5]
Desc rate ms−1 0.8[0.2, 1.9] 1.2[0.4, 2.3] 0.8[0.09, 2.6] 1.4[0.2, 2.5] 1.6[0.6, 2.6] 2.4[1.3, 2.9]
Desc pitch deg −38.4[−76.7, 49.8] −39.6[−63.8, −13.6] −33.9[−75.7, 59.7] −40.6[−66.1, 11.6] −42.7[−72.7, −20.6] −46.9[−69.4, 30.5]
Desc glide % 8[0, 91] 11[0, 80] 9[0, 73] 21[0, 86] 35[0, 77] 57[0, 79]
Asc rate ms−1 1[0.1, 2.4] 1.5[0.8, 2.2] 0.9[0.3, 2.1] 1.4[0.7, 2.1] 1.8[0.9, 2.4] 2.2[1.8, 2.9]
Asc pitch deg 24.2[−23.3, 71.7] 36.9[7.8, 60.9] 28.9[−21.4, 65.5] 44.8[0.2, 69.3] 53.3[30.8, 73.4] 59[25.4, 72.1]
Roll var deg 26.8[5.3, 46.9] 31.9[8.5, 51.2] 25.3[4.5, 68.4] 26.7[4.6, 47.7] 30.1[13.5, 50.1] 30.9[16.2, 42.9]
Head var deg 21.6[7.6, 49.6] 23.5[10.6, 36.7] 21.9[5.6, 57.9] 21.2[3.2, 64.8] 25.4[8.2, 59.1] 24.5[12.0, 40.8]
V̇O2desc lO2 min−1 2.8[1.2, 5.7] 2.8[1.4, 5.7] 3.2[2.0, 6.7] 3.1[2.2, 5.0] 2.9[2.3, 4.4] 2.5[2.2, 3.1]
V̇O2bot lO2 min−1 2.9[1.2, 6.1] 3.2 [2.0, 5.4] 3.5 [2.1 9.0] 3.6 [2.4, 6.0] 3.8 [3.0, 5.2] 3.7[3.1, 4.7]
V̇O2asc lO2 min−1 3.1 [1.2, 5.9] 3.4 [2.3, 6.3] 3.5 [2.2 7.3] 3.7 [2.3, 7.1] 3.5 [2.6, 4.5] 3.4 [2.8, 4.9]
Depth: maximum dive depth. Duration: Dive duration. % feeding: Proportion of dives with the buzzes. Nr buzz: Total number of buzzes recorded per dive. Bot duration: Duration of the
bottom phase of the dive. Bot stroke r: number of strokes per second averaged in 10 s bins over the duration of the bottom phase of the dive. Bot buzz r: number of buzzes recorded
in the bottom phase of the dive divided by bottom time. Buzz duration: time since start to end of the buzz. IBI: Time interval between buzzes; Buzz depth: Average depth of buzzes
recorded per dive. Desc stroke r: number of strokes per second averaged in 10 s bins over the duration of the descent phase of the dive. Desc. rate: rate of change in depth recorded
during dive descents, in 10 s bin. Desc. pitch: average body pitch angle of the dolphins during the descent phase of dives. Desc. glide: proportion of descent time spent gliding. Asc rate:
rate of change in depth recorded during dive ascents, in 10 s bin. Asc pitch: average body pitch angle of the dolphins during the ascent phase of dives. Roll var: variation in roll angle
over the 5 s before the buzz. Head var: variation in heading over the 5 s before the buzz. V̇O2 desc : Estimated field metabolic rate for the descent phase of the dive. V̇O2 bot : Estimated
field metabolic rate for the bottom phase of the dive. V̇O2 asc : Estimated field metabolic rate for the ascent phase of the dive. V̇O2 estimates calculated using Equation 3.2 in Fahlman
et al. (2018). Values are mean [min, max] of all dives of each type.
(chisq = 3, p-value = 3.62−8 ). According to the full model, dives and 1.11 ± 0.09 l O2 min−1 for deep dives, calculated using
IBI did not differ by dive type (chisq = 2.69, p-value = 0.44), Equation 3.2 in Fahlman et al. (2018). The second method used,
however pairwise comparison for individual dive types reported based on Figure 3B in Fahlman et al. (2018), rendered V̇O2
significant differences between shallow and deep dives. There values that doubled or tripled the previous results but were
was also evidence of a difference in roll variance by dive type again consistent across dive types: 1.69 ± 0.25 l O2 min−1 for
(chisq = 8.56, p-value = 0.03), with shallow dives being different shallow dives, 1.65 ± 0.17 l O2 min−1 for scattered patches dives,
from midwater and deep dives. Buzz duration did not vary 1.63 ± 0.17 l O2 min−1 for midwater dives and 1.53 ± 0.13 l
among dive types (chisq = 4.28, p-value = 0.23). None of the O2 min−1 for deep dives. Estimates using Kleiber’s equation
models indicated significant differences in dive response variables resulted in slightly higher V̇O2 estimates but were also similar
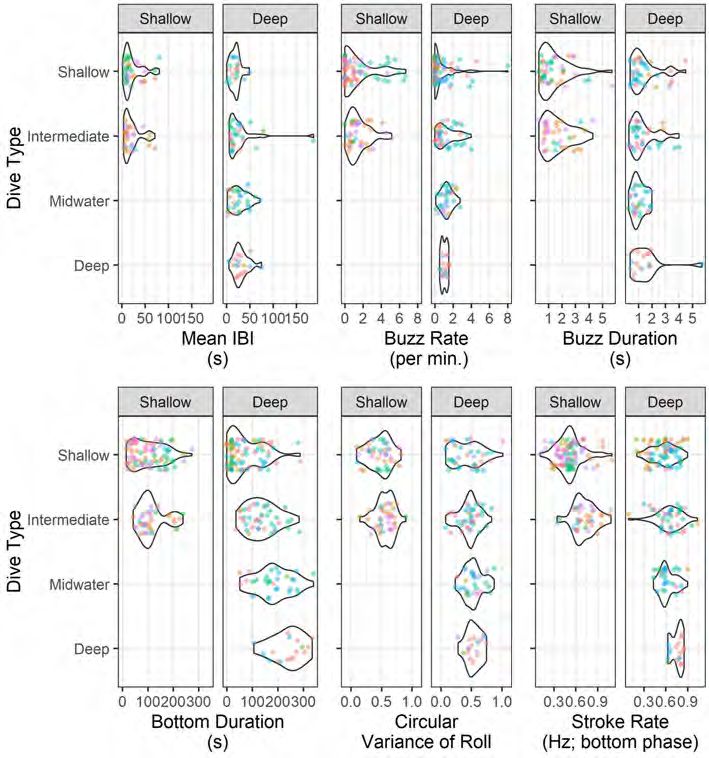
when fitted with habitat type as predictor. Figure 3 shows kernel among dive types: 3.14 ± 0.46 l O2 min−1 for shallow dives, 3.06
density of the above modeled parameters separated by age class, ± 0.32 l O2 min−1 for scattered patch dives, 3.03 ± 0.32 l O2
habitat and dive type. min−1 for midwater dives and 2.85 ± 0.24 l O2 min−1 for deep
dives. Hoppeler’s equation yielded an upper bound for V̇O2max
Metabolic Costs of 16.8 l O2 min−1 for a 300 kg dolphin and 26.3 l O2 min−1 for
GLM results indicated that estimated V̇O2 per dive was similar a 500 kg dolphin.
across dive types and habitats (Figure S3 in Data Sheet S1) but
differed between dive phases (chisq = 120.92, p-value = 4.88−26 ), DISCUSSION
with descent being different from bottom and ascent estimates
(Figure 5, Table 3). Estimated average V̇O2 per dive was 1.22 The Risso’s dolphins in this study appear to employ several
± 0.18 l O2 min−1 for shallow dives, 1.19 ± 0.12 l O2 min−1 mechanisms to maximize foraging efficiency, depending on their
for scattered patch dives, 1.18 ± 0.12 l O2 min−1 for midwater feeding depth. The dolphins varied their diving kinematics
Frontiers in Ecology and Evolution | www.frontiersin.org 8 March 2019 | Volume 7 | Article 53Arranz et al. Risso’s Dolphins Foraging FIGURE 3 | Summary statistics of Risso’s dolphins foraging parameters by dive type. Multi-panel violin plot of kernel probability density colored by individual dolphin, different shapes correspond to age class (dots represent adults and triangles non-adults) and separate panels correspond to each habitat. Results of the GLMM (Generalized linear mixed model) fitted for the above parameters with and withouth habitat and dive type as predictors are reported in the text and Data Sheet S2. and prey quantity when foraging in prey layers with different benthic organisms during some of these dives. Opportunistic composition. They foraged throughout the day in shallow and observations report Risso’s dolphins feeding on non-gregarious deep-water habitats, attempting to capture prey at depths up to benthic prey, like octopods in very shallow-waters (Ruiz et al., 488 m. Foraging dives had maximum dive depths up to 560 m 2011). Stomach contents from stranded specimens from another and occurred in bouts representing about 20% of a dolphin’s location reveal that the benthic octopus Eledone cirrosa can daytime activity, although tag-on durations averaged only a few represent up to 55% of the cephalopod prey consumed by hours and at most 13.5 h. These foraging dives targeted epipelagic this species (Clarke and Pascoe, 1985; Blanco et al., 2006), to mesopelagic prey resources and may have also included which would support the potential benthic feeding strategy near-benthic and coastal water foraging. Foraging bouts were inferred from data presented here. Nevertheless, foraging interspersed by traveling/resting/socializing periods of variable patterns were comparable when diving at similar depths but in length at the surface, which may be needed for recovery. Diving different habitats. patterns were stereotyped when foraging at particular depths Furthermore, dolphins feeding in deep-water exhibited irrespective of the habitat type. They altered their activity for several adaptations to reduce the energy cost of locomotion different types of dives in response to metabolic demands, when searching for food at different depths, such as the use indicating that their foraging tactics were influenced by foraging of gliding gaits and higher pitch angles during ascent and costs and benefits. descent (Table 3). Therefore, despite the longer transit distance When feeding in the shallow-water habitat, buzz depth and to forage for deep-water resources, the dolphins managed to keep seabed depth at focal follow positions point to dolphins targeting their average field metabolic rate similar across dive types (i.e., Frontiers in Ecology and Evolution | www.frontiersin.org 9 March 2019 | Volume 7 | Article 53
Arranz et al.                                                                                                                                 Risso’s Dolphins Foraging

 FIGURE 4 | Representative examples of fine-scale kinematics of a Risso’s dolphin feeding in a deep-water habitat during deep, midwater, and shallow dives (dolphin
 with tag id gg13_267a). Dive profiles with buzzes in red (A) and associated measurements of body roll (B), fluke stroke rate (C), ODBArms (D) and vertical swim speed
 (E) during the first dive of each type recorded on this tag (15 min after the tag on). Red dots indicate prey capture attempts (buzzes). ODBArms corresponds to the
 root-mean-square (rms) of the 2-norm overall dynamic body acceleration (ODBA). Shallow and midwater dives started 5 min before and 12 min after the start of the
 deep dive, respectively, by the same dolphin and within the same general habitat. Note the gliding periods during the second part of the descent during deep and
 midwater dives.

shallow, intermediate, midwater, and deep). While our approach                         (25%) of prey caught in deep dives, however if dolphins were still
to estimate field metabolic rate relies on the assumption that the                     diving deep to forage, it suggests intermediate and midwater prey
lowest and highest ODBA for each dive represent resting and                            is of lower quality, with respect to prey energy content and/or
maximal metabolic rate. This assumption may not be true for                            prey density per unit volume, compared to deeper prey.
each individual dive, but this analysis allows us to explore the                           Hydroacoustic sampling within the same general area did not
relative metabolic costs within dives, and accounts for possible                       find greater prey density at depth (Benoit-Bird et al., 2017). Active
changes in tag placement on overall ODBA. In addition, the                             acoustics data revealed that inter-individual distances in schools
heterogeneity in the regression estimate between ODBA and                              targeted by Risso’s dolphins increased with total body length of
metabolic rate within an individual between dives was acceptable                       prey items (Benoit-Bird et al., 2017). Moreover, the scattering
(C.V. of 32% for slope and of 0.7% for intercept), suggesting that                     layers were stratified vertically in terms of composition and size.
there were not large variation in estimated costs between dives. It                    The average length of individuals constituting mono-specific
has been suggested that glide and stroke behavior helps conserve                       prey patches in the Catalina basin generally increased with
energy (Williams et al., 2017). Gliding during dive descent may                        depth, while the average density of prey in patches decreased. It
help to reduce the metabolic costs of deep dives up to 40% to                          therefore seems that the dolphins benefit from deeper foraging
balance their need to perform long ascents while fluking actively.                     trips through accessing prey of varied quality rather than greater
Similarly, Steller sea-lions diving to artificial prey patches from 5                  prey density. The longer IBI associated with deeper buzzes is
to 50 m in experimental studies have been observed to decrease                         consonant with dolphins targeting more widely spaced prey
their overall (average) diving metabolic rate and activity level                       items (i.e., larger distance between individuals) during deep
with dive depth (Fahlman et al., 2009, 2013). These adaptations                        dives or that it requires longer handling times, an interpretation
may allow them to extend their time at depth in deeper dives                           compatible with prey data reported here.
and to make a greater number of prey attempts at the bottom                                The records of higher V̇O2 in the bottom phase of deep
of the dive; although bottom buzz rates remained comparable                            dives is consistent with the registered increase in body roll
for shallow vs. deep dives. Foraging during transits from (and to                      and stroke rate and suggest a greater effort involved in the
a lesser extent to) foraging depths slightly increases the overall                     pursuit of deep-water prey items. These results support the
foraging rate during midwater dives compared to intermediate                           notion of shift in prey type with increasing foraging depth and
dives, but not in deep dives. This represented about a quarter                         could be related to the observed escalation of prey length as

Frontiers in Ecology and Evolution | www.frontiersin.org                          10                                                 March 2019 | Volume 7 | Article 53
Arranz et al.                                                                                                                                  Risso’s Dolphins Foraging

 FIGURE 5 | Estimated field metabolic rate of Risso’s dolphins in foraging dives performed within the deep-water habitat. Colored lines represent estimates of the field
 metabolic rate as a function of dive time and depth of the dolphin for each dive type, showing maximum estimated value per every 10 s window.

a function of depth. Stomach contents from stranded Risso’s                             apparently high levels of exercise undertaken by Risso’s dolphins
dolphins reveal consumption of large mesopelagic cephalopods,                           during deep-water feeding recorded here are highly significant,
including the family of muscular squid Ommastrephiidae.                                 together with the measured increase of total body length of
Examples are the jumbo squid Dosidicus gigas (García-Godos                              prey items in schools targeted by these dolphins as a function
and Cardich, 2010; Yates and Palavecino-Sepúlveda, 2011) or                             of depth. This evidence points to a potential common strategy
the neon flying squid Ommastrephes bartramii (Fernández et al.,                         of some deep-diving toothed whales, in which the capture of
2017). Such squid, including species from genera Todarodes,                             larger, more nutritious prey in deep-waters may compensate for
have strong locomotor abilities (O’dor and Webber, 1991)                                the higher metabolic costs of performing longer foraging dives
and present high energy density per unit of wet weight                                  at depth.
(3–4.5 kJ g−1 wet weight Clarke et al., 1985), constituting                                Some deep diving species, such as sperm whales and pilot
a potential high-quality target for Risso’s dolphins during                             whales, adapt to circadian migrations of prey distribution
deep dives.                                                                             (Watwood et al., 2006; Aoki et al., 2007; Aguilar de Soto et al.,
    Data on swimming speeds of the dolphins while foraging                              2008) and exploit deep-water resources when they are available at
at the bottom could not be estimated reliably in this study                             shallower depths at night. Other species, like Blainville’s beaked
(but see Cade et al., 2017), however the relatively high vertical                       whales (Mesoplodon densirostris) seem to adjust little (Arranz
swimming speeds recorded in the bottom phase of deep dives                              et al., 2011). All prey layers in the deep-water habitat of Risso’s
(up to 4.5 m s−1 ) (Figure 4), are coherent with dolphins chasing                       dolphins, other than the deepest, have been described to perform
prey at depth. Deep-water sprints associated with capturing                             diel vertical migrations (Benoit-Bird et al., 2017). It is therefore
large squid have been described in short-finned pilot whales                            possible that these dolphins benefit from the availability of
(Globicephala macrorhynchus) (Aguilar de Soto et al., 2008).                            deep-water prey in shallower waters at night, so as to reduce
Similarly, Aoki et al. (2012) reported bursts of speed in sperm                         the apparently higher energetic costs involved in foraging at
whales (Physeter macrocephalus), suggesting that they performed                         depth. Soldevilla et al. (2010) reported higher click detection
these bursts to catch powerful and nutritious deep-water prey                           rates of Risso’s dolphins at night within the Catalina basin,
(i.e., large and/or muscular). In deep dives, we found no                               suggesting either a higher feeding rate or shallower foraging
strong evidence of longer buzzes that have been associated with                         depths. A few data about night-time foraging behavior of Risso’s
the capture of larger prey items in beaked whales (Johnson                              dolphins presented here are inconclusive, limiting interpretation
et al., 2008), although it may depend on the clicking rate and                          of whether, and to what extent, this species adapts to circadian
closing speed at which targets are approached. Nevertheless, the                        changes in prey distribution. Collection of night-time tag data

Frontiers in Ecology and Evolution | www.frontiersin.org                           11                                                  March 2019 | Volume 7 | Article 53
Arranz et al. Risso’s Dolphins Foraging
on foraging dolphins would be needed to better understand the dolphin [36 ml kg−1 , see Table 5 in Ponganis (2011)] and
feeding patterns of this species. the average diving V̇O2 for each dive type (via Equation 3.2
A number of methods have been developed to estimate in Fahlman et al., 2018) to estimate cADL. This resulted in
metabolic rate in free-ranging marine mammals. In pinnipeds a cADL ranging between 14.8 and 16.2 min and 8.9–9.7 min
and smaller cetaceans, indirect measurements have been made for adult and non-adult Risso’s dolphins, respectively. While
using doubly labeled water, or species-specific calibrations of our estimated diving V̇O2 entail a number of uncertainties,
proxies of energy expenditure, such as heart rate and activity they provide an initial estimate of energy use and indicate
(Butler et al., 2004; Maresh et al., 2014). In larger cetaceans, heart that all dives in the current study are apparently within the
rate has seldom been measured in situ, nor has the relationship estimated cADL.
between activity and metabolic cost been validated. However, The Risso’s dolphins in this study fed in shallow and deep-
activity correlates reasonably well with diving metabolic rate water habitats, foraging in different depth layers in deep-waters
in Steller sea-lions (Fahlman et al., 2008, 2013). Recent work (occasionally within the same dive) and possibly benthically
has also determined the RMR during restrained near-shore near the shore when in shallow-waters. In order to balance
shallow diving or off-shore deep-diving in bottlenose dolphins the energetic needs and costs of foraging at increased distances
undergoing capture-release health assessments (Fahlman et al., from the surface, these dolphins altered their dive kinematics
2018). Indeed, there is a relative similarity in the deep diving to minimize energy consumption during longer transits and
capacity, anatomy, morphology, and body structure of bottlenose extended feeding time with increased depth. They thus allowed
dolphins and Risso’s dolphins. Despite the fact bottlenose for a higher number of prey encounters per dive. Moreover,
dolphins are within Delphininae and Risso’s dolphins within in spite of the increased overall cost of deep dives, they left
Globicephalinae, groups separated by about 10 million years longer intervals between prey capture attempts during deep
of evolution, we hypothesize that a comparable relationship dives. Even faced with the increased need to manage oxygen
exists in Risso’s dolphin. While we have made the assumption during deeper and longer dives, prey capture appeared to be more
that the maximal and minimal ODBA represent maximal and energetic during deep foraging. To maintain energetic returns
resting V̇O2 , respectively, we cannot confirm that these are at increasing distances from the surface, Risso’s dolphins appear
true estimates of these two measures. This is especially true to choose to feed on larger prey at increasing depth, which
for the resting ODBA, where the variability was higher for points to a potential increased prey size-distance relationship
tag durations that were < 4 h (Figures S1, S2). However, for for these predators. This strategy is however difficult to
maximal ODBA and minimal ODBA for tag durations > 4 h measure in free-ranging diving animals. This adaptive strategy
and up to 13.5 h there were no systematic trends with tag appears to increase their foraging efficiency both within and
duration. We therefore argue that if these estimated minimal between foraging bouts, thus enhancing their fitness throughout
or maximal values were grossly over- or underestimated, different habitats. Together with this, these predators show
we would have seen at least one outlier for 13 dolphins an apparent flexibility in using a variety of resources while
with an overall tag duration of 92 h. We also used two maintaining their average metabolic rates per dive similar across
independent methods, based on Kleiber’s equation (Kleiber, foraging depths.
1947) and Fahlman et al. (2018), to estimate the RMR in
free-ranging Risso’s dolphins. This was to address the caveats
associated with the application of respirometry data from
DATA AVAILABILITY
restrained bottlenose dolphins in relatively warm water, since Datasets are available on request. The raw data supporting
temperature differences have a potential impact. Consequently, the conclusions of this manuscript will be made available
the estimated absolute metabolic rate is higher in the larger by the authors, without undue reservation, to any
Risso’s dolphin, whereas the mass-specific metabolic rate is qualified researcher.
lower (Lavigne et al., 1986). Although the results of the three
methods varied between 1 and 3 l O2 min−1 , they all reveal a
consistent overall consumption rate across dive types (Figure 5), AUTHOR CONTRIBUTIONS
indicating that Risso’s dolphins compensate for energetic costs
associated with diving, swimming and feeding at different ASF, JC, BS, EH, JG, AS, SD, KB-B, and PA carried out the
depths (Davis et al., 2004). experiments. KB-B, BS, PT, JG, ASF, AF, PA conceived the
The calculated aerobic dive limit (cADL), the total O2 stores presented idea. KB-B, EH, ASF, AS, SD, and PA performed the
divided by the diving V̇O2 , provides a useful index to indicate computations. PA wrote the manuscript with support from JG,
whether the animal mainly forages aerobically or possibly uses AF, and PT. The project was supervised and funding provided
anaerobic pathways (Butler and Jones, 1997). The majority by KB-B, BS, PT, and JC. All authors discussed the results and
of diving animals are thought to perform most dives well contributed to the final manuscript.
within their cADL, since this maximizes long-term foraging
efficiency (Costa, 2001). Nevertheless, there are some notable FUNDING
examples like fur seals that appear to regularly dive outside
their cADL (Costa et al., 2001). In the current study, we Funding for the SOCAL-BRS project was provided by the Chief
used the estimated mass-specific O2 stores from the bottlenose of Naval Operations Environmental Readiness Division, the US
Frontiers in Ecology and Evolution | www.frontiersin.org 12 March 2019 | Volume 7 | Article 53Arranz et al. Risso’s Dolphins Foraging
Navy’s Living Marine Resources Program, and the Office of ACKNOWLEDGMENTS
Naval Research Marine Mammal Program. Experiments were
performed under the US National Marine Fisheries Service We would like to thank Selene Fregosi for endless logistical
(NMFS) (Permit # 14534-2), Channel Islands National Marine support and effort in processing visual data, the crew of the
Sanctuary (Permit # 2010-003) (BS principal investigator for R/V Truth for their help in the field and the two reviewers for
both) and IACUC permits issued to the project investigators. The their critical review of this manuscript. The authors wish to
Strategic Environmental Research and Development Program acknowledge the University of St Andrews Library Open Access
via an Army Corps of Engineers Contract (KB-B and BS) Fund for support with Open Access costs.
provided funding for data collection and prey analysis. PT
acknowledges support from ONR grant N00014-15-1-2553 SUPPLEMENTARY MATERIAL
and from the MASTS pooling initiative (Marine Alliance
for Science and Technology for Scotland; supported by the The Supplementary Material for this article can be found
Scottish Funding Council, grant reference HR09011, and online at: https://www.frontiersin.org/articles/10.3389/fevo.
contributing institutions). 2019.00053/full#supplementary-material
REFERENCES Butler, P. J., and Jones, D. R. (1997). Physiology of diving birds and
mammals. Physiol. Rev. 77 837–899. doi: 10.1152/physrev.1997.77.
Acevedo-Gutiérrez, A., Croll, D. A., and Tershy, B. R. (2002). High feeding costs 3.837
limit dive time in the largest whales. J. Exp. Biol. 205, 1747–1753. Cade, D. E., Barr, K. R., Calambokidis, J., Friedlaender, A. S., and Goldbogen,
Aguilar de Soto, N., Johnson, M., Madsen, P. T., Díaz, F., Domínguez, I., Brito, J. A. (2017). Determining forward speed from accelerometer jiggle in aquatic
A., et al. (2008). Cheetahs of the deep sea: deep foraging sprints in short environments. J. Exp. Biol. 221(Pt 2):jeb170449. doi: 10.1242/jeb.170449
finned pilot whales off tenerife (Canary Islands). J. Anim. Ecol. 77, 936–947. Carbone, C., and Houston, A. I. (1996). The optimal allocation of time over the
doi: 10.1111/j.1365-2656.2008.01393.x dive cycle: an approach based on aerobic and anaerobic respiration. Anim.
Andersen, K. H., Berge, T., Gonçalves, R. J., Hartvig, M., Heuschele, J., Hylander, Behav. 51, 1247–1255. doi: 10.1006/anbe.1996.0129
S., et al. (2016). Characteristic sizes of life in the oceans, from bacteria to Clarke, A., Clarke, M. R., Holmes, L. J., and Waters, T. D. (1985).
whales. Ann. Rev. Mar. Sci. 8, 217–241. doi: 10.1146/annurev-marine-122414- Calorific values and elemental analysis of eleven species of oceanic
034144 squids (Mollusca: Cephalopoda). J. Mar. Biol. Assoc. U.K. 65, 983–986.
Angel, M. V., and Boxshall, G. A. (1990). Life in the benthic boundary layer: doi: 10.1017/S0025315400019457
connections to the mid-water and sea floor. Philo. Transac. R. Soc. Lond. Series Clarke, M., and Pascoe, P. (1985). The stomach contents of a risso’s dolphin
A 331, 15–28. doi: 10.1098/rsta.1990.0053 (Grampus Griseus) stranded at thurleston, south devon. J. Mar. Biol. Assoc. U.K.
Aoki, K., Amano, M., Mori, K., Kourogi, A., Kubodera, T., and Miyazaki, N. 65, 663–665. doi: 10.1017/S0025315400052504
(2012). Active hunting by deep-diving sperm whales: 3d dive profiles and Clarke, M. R. (1996). Cephalopods as prey. part 3. cetaceans. philosophical
maneuvers during bursts of speed. Mar. Ecol. Progr. Ser. 444, 289–301. transactions of the royal society of london. Ser. B. Biol. Sci. 352, 1105–1112.
doi: 10.3354/meps09371 Costa, D. P. (2001). “Diving Physiology of Marine Vertebrates," in eLS (Chichester:
Aoki, K., Amano, M., Yoshioka, M., Mori, K., Tokuda, D., and Miyazaki, N. (2007). John Wiley and Sons, Ltd.) doi: 10.1002/9780470015902.a0004230
Diel diving behavior of sperm whales off japan. Mar. Ecol. Progr. Ser. 349, Costa, D. P., Gales, N. J., and Goebel, M. E. (2001). Aerobic dive limit: how
277–287. doi: 10.3354/meps07068 often does it occur in nature? Compar. Biochem. Physiol. 129, 771–783.
Arranz, P., Aguilar de Soto, N., Madsen, P. T., Brito, A., Bordes, F., and doi: 10.1016/S1095-6433(01)00346-4
Johnson, M. (2011). Following a foraging fish-finder: diel habitat use of Croll, D. A., Acevedo-Gutiérrez, A., Tershy, B. R., and Urbán-Ramírez, J. (2001).
blainville’s beaked whales revealed by echolocation. PLoS ONE 6:E28353. The Diving Behavior Of Blue And Fin Whales: Is Dive Duration Shorter Than
doi: 10.1371/journal.pone.0028353 Expected Based On Oxygen Stores? Compar. Biochem. Physiol. Part A. 129,
Arranz, P., Benoit-Bird, K. J., Brandon Southall, L., John, C., Ari, S., Friedlaender, 797–809. doi: 10.1016/S1095-6433(01)00348-8
A., et al. (2018). Risso’s Dolphins Plan Foraging Dives. J. Exp. Biol. Daniel, S., Korine, C., and Pinshow, B. (2008). Central-place foraging in nursing,
221:jeb165209. doi: 10.1242/jeb.165209 arthropod-gleaning bats. Can. J. Zool. 86, 623–626. doi: 10.1139/Z08-041
Arranz, P., Deruiter, S. L., Stimpert, A. K., Neves, S., Friedlaender, A. S., Goldbogen, Davis, R. W., Polasek, L., Watson, R., Fuson, A., Williams, T. M., and Kanatous, S.
J. A., et al. (2016). Discrimination of fast click series produced by tagged risso’s B. (2004). The diving paradox: new insights into the role of the dive response
dolphins (Grampus Griseus) for echolocation or communication. J. Exp. Biol. in air-breathing vertebrates. Compar. Biochem. Physiol. Part A. 138, 263–268.
219, 2898–2907. doi: 10.1242/jeb.144295 doi: 10.1016/j.cbpb.2004.05.003
Benoit-Bird, K. J., Moline, M. A., and Southall, B. L. (2017). Prey in oceanic Deruiter, S. L., Bahr, A., Blanchet, M.-A., Hansen, S. F., Kristensen, J.
sound scattering layers organize to get a little help from their friends. Limnol. H., Madsen, P. T., et al. (2009). Acoustic behaviour of echolocating
Oceanogr. 62, 2788–2798. doi: 10.1002/lno.10606 porpoises during prey capture. J. Exp. Biol. 212, 3100–3107. doi: 10.1242/jeb.
Blanco, C., Raduán, M. A., and Raga, J. A. (2006). Diet of risso’s dolphin (Grampus 030825
Griseus) in the western mediterranean sea. Sci. Mar. 70, 407–411. Doniol-Valcroze, T., Lesage, V., Giard, J., and Michaud, R. (2011). Optimal
Brooks, M. E., Kristensen, K., Van Benthem, K. J., Magnusson, A., Berg, C. W., foraging theory predicts diving and feeding strategies of the largest marine
Nielsen, A., et al. (2017). Glmmtmb balances speed and flexibility among predator. Behav. Ecol. 22, 880–888. doi: 10.1093/beheco/arr038
packages for zero-inflated generalized linear mixed modeling. R J. 9, 378–400. Fahlman, A., Brodsky, M., Wells, R., Mchugh, K., Allen, J., Barleycorn, A.,
doi: 10.32614/RJ-2017-066 et al. (2018). Field energetics and lung function in wild bottlenose dolphins
Butler, P. J., Green, J. A., Boyd, I. L., and Speakman, J. R. (2004). Measuring Tursiops truncatus in sarasota bay florida. R. Soc. Open Sci. 17:171280.
metabolic rate in the field: the pros and cons of the doubly labelled water and doi: 10.1098/rsos.171280
heart rate methods. Func. Ecol. 18, 168–183. doi: 10.1111/j.0269-8463.2004. Fahlman, A., Hooker, S. K., Olszowka, A., Bostrom, B. L., and Jones, D. R. (2009).
00821.x Estimating the effect of lung collapse and pulmonary shunt on gas exchange
Frontiers in Ecology and Evolution | www.frontiersin.org 13 March 2019 | Volume 7 | Article 53You can also read


