Why More Leaflets? The Role of Natural Selection in Shaping the Spatial Pattern of Leaf-Shape Variation in Oxytropis diversifolia (Fabaceae) and ...
←
→
Page content transcription
If your browser does not render page correctly, please read the page content below

ORIGINAL RESEARCH
                                                                                                                                             published: 19 August 2021
                                                                                                                                        doi: 10.3389/fpls.2021.681962

                                              Why More Leaflets? The Role of
                                              Natural Selection in Shaping the
                                              Spatial Pattern of Leaf-Shape
                                              Variation in Oxytropis diversifolia
                           Edited by:
                     Martina Stromvik,
             McGill University, Canada
                                              (Fabaceae) and Two Close Relatives
                      Reviewed by:            Hui Wang 1*†, Pei-Liang Liu 2, Jian Li 1, Han Yang 1, Qin Li 3† and Zhao-Yang Chang 1†
                          Emily Bellis,
           Arkansas State University,         1
                                               College of Life Sciences, Northwest A&F University, Yangling, China, 2 Key Laboratory of Resource Biology and
                        United States         Biotechnology in Western China, Northwest University, Xi’an, China, 3 Department of Science and Education, Field Museum,
                   Vladislav Kolarčik,        Chicago, IL, United States
      Pavol Jozef Šafárik University in
                     Košice, Slovakia
                                              Leaf shape exhibits tremendous diversity in angiosperms. It has long been argued that
                  *Correspondence:
                          Hui Wang            leaf shape can affect major physiological and ecological properties of plants and thus is
              hui.wang@nwafu.edu.cn           likely to be adaptive, but the evolutionary evidence is still scarce. Oxytropis diversifolia
                           ORCID              (Fabaceae) is polymorphic for leaf shape (1 leaflet, 1–3 leaflets, and 3 leaflets) and exhibits
                               †

                         Hui Wang
    orcid.org/0000-0003-4149-1144             clinal variation in steppes of Nei Mongol, China. With two close relatives predominantly
                             Qin Li           fixed for one phenotype as comparison (Oxytropis neimonggolica with 1 leaflet and
    orcid.org/0000-0001-9976-8236
                                              Oxytropis leptophylla with 5–13 leaflets), we used a comprehensive cline-fitting approach
                  Zhao-Yang Chang
    orcid.org/0000-0003-4216-054X             to assess the role of natural selection in shaping the spatial pattern of leaf-shape variation
                                              in this system. For 551 individuals sampled from 22 populations, we quantified leaf-
                   Specialty section:
         This article was submitted to
                                              morphological differentiation, evaluated patterns of neutral genetic variation using five
      Plant Systematics and Evolution         chloroplast DNA intergenic regions and 11 nuclear microsatellite loci, and performed
                a section of the journal      microhabitat and macroclimatic-association analyses. We found that 1-leaflet proportions
             Frontiers in Plant Science
                                              in O. diversifolia populations significantly increased from west to east, and three phenotypes
          Received: 17 March 2021
           Accepted: 19 July 2021             also differed in leaflet-blade size. However, compared with the other two species,
         Published: 19 August 2021            populations of O. diversifolia showed little neutral genetic differentiation, and no population
                             Citation:        structure was detected at either marker. We further revealed that the leaf-shape cline
       Wang H, Liu P-L, Li J, Yang H,
     Li Q and Chang Z-Y (2021) Why
                                              could largely be explained by three macroclimatic variables, with leaflet number decreasing
  More Leaflets? The Role of Natural          and leaflet-blade size increasing with annual precipitation and showing the reverse trends
      Selection in Shaping the Spatial        with temperature seasonality and isothermality. Our results suggest that spatially varying
   Pattern of Leaf-Shape Variation in
 Oxytropis diversifolia (Fabaceae) and        abiotic environmental factors contribute to shape the leaf-shape cline in O. diversifolia,
                  Two Close Relatives.        while the interspecific pattern may be due to both local adaptation and historical events.
         Front. Plant Sci. 12:681962.
      doi: 10.3389/fpls.2021.681962           Keywords: leaf shape, cline, natural selection, gene flow, Oxytropis

Frontiers in Plant Science | www.frontiersin.org                                    1                                           August 2021 | Volume 12 | Article 681962
Wang et al.                                                                                                    Leaf-Shape Cline in Oxytropis diversifolia

INTRODUCTION                                                                    From an evolutionary perspective, a classical approach to
                                                                            assess whether selection is responsible for phenotypic divergence
Leaf shape is one of the most variable plant traits and exhibits            within a species is to directly quantify fitness consequences
tremendous diversity in angiosperms. Understanding the                      of focal traits in different environments. This approach, typically
evolutionary drivers of diversification in leaf shape and their             performed by reciprocally transplanting individuals that are
functional significance has been of continuing interest for many            the product of controlled crosses into divergent natural field
years (Nicotra et al., 2011). Remarkable differences in leaf                sites, can be very powerful (Rausher and Delph, 2015; Ferris,
shape may occur between closely related species (e.g.,                      2019). A few studies have detected natural selection on leaf
Pelargonium, Jones et al., 2009; Achillea, Sha et al., 2018), as            shape with this approach, including I. hederacea (Bright and
intraspecific geographic variants (Asclepias tuberosa, Wyatt and            Rausher, 2008), the Mimulus guttatus species complex (Ferris
Antonovics, 1981; Ipomoea hederacea, Bright and Rausher, 2008),             and Willis, 2018), and the Senecio lautus species complex
or even in the same plant (heterophylly and heteroblasty,                   (Richards et al., 2019). However, this approach can have
reviewed in Chitwood and Sinha, 2016). As the leaf is the                   limitations. Because there may be substantial temporal and
primary photosynthetic organ and therefore of paramount                     spatial variation in selective environments across species’ ranges,
functional importance for plants, leaf shape has long been                  it can be difficult to extrapolate results from short-term, spatially
hypothesized to be adaptive (Givnish, 1979, 1995; Nicotra et al.,           restricted experiments, to an understanding of the forces shaping
2011). However, leaf-shape variation between or within natural              patterns of divergence across populations over generations
populations or closely related species can be controlled by                 (Hopkins et al., 2012). Moreover, this approach is only available
genetic loci (Kidner and Umbreen, 2010) and thus may also                   for organisms that are amenable to field experiments in which
be influenced by neutral processes, such as genetic drift and               fitness can be measured. For some plant species, e.g., perennial
restricted gene flow. Yet few studies have detected genetic                 species, the total lifetime fitness can hardly be quantified.
signatures of natural selection on leaf shape and related variation             A complementary approach that can circumvent some of
to putative adaptive function (Ferris, 2019; but see Bright and             the problems is the cline-fitting method, that is, to compare
Rausher, 2008; Campitelli and Stinchcombe, 2013; Ferris and                 clinal patterns of focal traits to background patterns of
Willis, 2018; Richards et al., 2019), the adaptive feature of leaf          differentiation at presumably neutral markers, as well as to
shape still needs to be further elucidated.                                 environmental clines. If phenotypic patterns are explained by
   The adaptive hypothesis of leaf shape is empirically based               environmental variation rather than neutral population structure,
on the physiological and ecological consequences of leaf shape,             then selection is likely at work (Ferris, 2019). Several studies
although this type of evidence is typically correlative and indirect.       have partially applied this approach to identify signatures of
Leaf-shape variation can affect the thickness of leaf boundary              natural selection on leaf shape. They either revealed coincidence
layer, which in turn affects thermoregulation (Givnish, 1979;               of phenotypic and geographic/macroclimatic clines without any
Schuepp, 1993; Lambers et al., 2008). All else being equal, the             genetic data (Wyatt and Antonovics, 1981; Gurevitch, 1988;
thickness of a boundary layer increases with length from the                Harris et al., 1998; Zhu et al., 2015; Alcántara-Ayala et al.,
windward edge, so that heat convection from small leaves is                 2020) or compared geographical leaf-shape cline with neutral
more rapid than from large leaves (Nobel, 2005). Likewise, leaf             genetic structure without any environmental association analysis
lobing can probably reduce the distance across the lamina, the              (Brennan et al., 2009; Campitelli and Stinchcombe, 2013).
rate of heat transfer is predicted to be greater in a lobed leaf            Furthermore, both macrohabitat at coarse scale and microhabitat
than an unlobed leaf with equivalent area (Givnish, 1979; Nicotra           at fine scale can contribute to divergent selection thus to
et al., 2011). Compared with entire leaves, lobed and dissected             speciation (Coyne and Orr, 2004). Yet no universal relationship
leaves with reduced lobe/leaflet width can also have fewer minor            between leaf shape and broad-scale environmental variation
veins and a lower ratio of mesophyll tissue to large, highly                has been found across taxa, which also suggests a potential
conductive veins, and thus lower hydraulic resistance, which                role of natural selection at microhabitat level (Nicotra et al.,
can be advantageous in dry environments (Brodribb et al., 2010;             2011; Ferris, 2019). Therefore, an integrative study that combines
Nicotra et al., 2011). Given these physiological effects, complex           geographic leaf-shape variation, neutral genetic structure,
leaves (deeply divided or dissected and compound) are likely                macrohabitat, and microhabitat analyses is likely to be more
adaptive in particularly cold, hot, or dry habitats (Givnish, 1979;         effective in understanding the drivers of leaf-shape variation.
Ferris, 2019). Consistently, the global pattern clearly shows that              Oxytropis diversifolia E. Peter is a perennial herb distributed
extant plants with entire leaves are more frequent in subtropical           across the steppes of Nei Mongol, China, which possesses an
and tropical, as well as frigid regions, while dissected leaves             interesting pattern of intraspecific leaf-shape variation. Leaf
are often found in mid-latitude regions (reviewed in Chitwood               shape in this species is polymorphic for leaflet production:
and Sinha, 2016). Moreover, leaf shape may affect plant resistance          Individuals can have leaves with only 1 leaflet (Figure 1A),
to herbivores. Leaves of relatively palatable species may mimic             1 to 3 leaflets (Figure 1B), or 3 leaflets (Figure 1C). The
the leaf shape of relatively distasteful species (Givnish, 1984;            three phenotypes can co-occur within populations without any
Brown and Lawton, 1991). Complex leaves may also gain advantage             spatial segregation. According to our population survey in three
through isolating and/or limiting herbivorous damage to discrete            consecutive years (2016–2018), clinal variation for leaf shape
areas, and making grazing less efficient for herbivores (Brown              is revealed, where eastern populations are composed chiefly
and Lawton, 1991; Niinemets et al., 2006).                                  of 1-leaflet phenotype, and western populations are highly

Frontiers in Plant Science | www.frontiersin.org                        2                                      August 2021 | Volume 12 | Article 681962
Wang et al.                                                                                                                         Leaf-Shape Cline in Oxytropis diversifolia

  FIGURE 1 | (A–E) Phenotypes of Oxytropis diversifolia (A, 1 leaflet; B, 1–3 leaflets; and C, 3 leaflets), O. neimonggolica (D, 1 leaflets), and O. leptophylla (E, 5–13
  leaflets). Scale bars = 5 mm. (F) Example of a microhabitat plot (40 cm × 40 cm). Scale bar = 5 cm. (G) Map of northern China showing locations of 22 sampled
  Oxytropis populations. Each pie chart indicates the proportions of different leaf phenotypes in each population. Twelve populations are O. diversifolia; Δ five
  populations of O. neimonggolica; and * five populations of O. leptophylla.

polymorphic with phenotypes of 1–3 leaflets and 3 leaflets                               imparipinnate with 5–13 leaflets (Figure 1E) and parapatrically
more frequent (Figure 1G). Moreover, two close relatives of                              distributed to the east of O. diversifolia (Figure 1G). In the
O. diversifolia are also included in our study. One is Oxytropis                         narrow zone of contact, the two species can hybridize with
neimonggolica C. W. Chang & Y. Z. Zhao, which is predominantly                           both pure and intermediate phenotypes co-existing, suggesting
fixed for the 1-leaflet phenotype (Figure 1D) and allopatrically                         recent gene flow between the two species (Wang et al., unpubl.
distributed in the Helan mountains (Figure 1G). The other is                             Res.). Having compound leaves are one of the main characteristics
Oxytropis leptophylla (Pall.) DC., which is predominantly                                of Fabaceae and are evolutionary conserved in a phylogenetic

Frontiers in Plant Science | www.frontiersin.org                                     3                                             August 2021 | Volume 12 | Article 681962
Wang et al.                                                                                                    Leaf-Shape Cline in Oxytropis diversifolia

context (Geeta et al., 2012). Leaf shape in O. diversifolia is               Population Survey and Sampling
highly polymorphic (1 leaflet, 1–3 leaflets, and 3 leaflets), while          A total of 22 populations were surveyed in April and May
the two close relatives are either fixed for a phenotype of 1                from 2016 to 2018 (Figure 1G; Supplementary Table 1).
leaflet (O. neimonggolica) or 5–13 leaflets (O. leptophylla), which          We conducted a census of 12 and five populations for
can be used for comparison (predominantly monomorphic).                      O. diversifolia and O. neimonggolica, respectively, covering their
Consequently, the three species form an ideal system in which                entire distributional range in Nei Mongol. For O. leptophylla,
to explore the evolutionary forces shaping the spatial pattern               we sampled five populations in eastern Nei Mongol as
of leaf-shape variation.                                                     representatives. In each population, leaf-phenotype surveys were
   Here, we use a comprehensive cline-fitting approach to assess             performed by tallying leaf-phenotype counts (≤100 individuals),
the role of natural selection in explaining the spatial pattern              or along three to five transects spanning the length of the
of leaf shape in O. diversifolia as well as two close relatives.             population (>100 individuals). The sampling effort, i.e., the
Specifically, we seek to address the following questions: (1)                number of transects and the distance between transects, depended
What is the spatial pattern of leaf-shape variation across the               on both population size and density.
distribution range of O. diversifolia in Nei Mongol? Are leaf-                  We randomly sampled 20 (populations dominated by one
morphological traits related to leaflet-blade size also differentiated       phenotype) to 30 individuals (polymorphic populations) per
among phenotypes? (2) Compared with O. neimonggolica and                     population. Effort was made to distribute the sampling throughout
O. leptophylla, is there evidence of genetic differentiation and             the population and no neighboring plants were collected. In
hierarchical population structure for O. diversifolia at neutral             two extremely small populations Z and PSET, 11 and seven
genetic markers (chloroplast DNA intergenic regions and nuclear              individuals were sampled, respectively. In polymorphic
microsatellites)? (3) Do microhabitat variables differ among                 populations of O. diversifolia, effort was made to sample an
different phenotypes? And/or do macroclimatic variables explain              equal number of individuals for each phenotype
the clinal leaf-shape variation?                                             (Supplementary Table 7). For each individual, after taking
                                                                             the picture for microhabitat analysis, we collected several entire
                                                                             leaves (with the petiole and all leaflets, from both early leaves
MATERIALS AND METHODS                                                        and mature leaves), immediately desiccated in silica gel, and
                                                                             stored in the dark at room temperature. In total 551 individuals
Study System                                                                 were sampled, of which 321 were O. diversifolia, 128 were
Oxytropis diversifolia (Fabaceae) is a diploid (2n = 16)                     O. neimonggolica, and 102 were O. leptophylla.
perennial herb occurring in dry Stipa grasslands/semi-desert
regions of Nei Mongol, China and Mongolia (Zhu et al.,
2010). It is a typical xerophytic plant species with long
                                                                             Measurements and Analyses of Leaf
roots (>50 cm) extending deep underground, while the                         Morphology
aboveground part is very small (3–5 cm tall). It is acaulescent              Four leaf-morphological traits related with leaflet-blade size
and the emerging leaves exhibit heteroblasty, with leaflet                   were measured by digital caliper for all 551 individuals: early
blades of early leaves being lanceolate-obovate to elliptic,                 leaf length, mature leaf length, early leaf width, and mature
while mature leaves are narrowly linear (Figures 1A–C). It                   leaf width. Measurements were always done by the same
can produce 1- or 2-flowered racemes and flowering occurs                    experimenter (HY) to reduce sampling errors. The variation
in April to May. Although automatic self-pollination does                    of these traits was then analyzed separately by performing
not occur, population genetic analysis suggests it is probably               linear mixed-effects models, with species or phenotype as a
self-compatible (see results). It is bee-pollinated with an                  fixed effect and population nested within species as a
explosive pollination mechanism (e.g., Alemán et al., 2014).                 random factor.
Livestock grazing can be observed in some of the populations
(e.g., population DT and DIANT), but there does not seem                     DNA Extraction, Chloroplast DNA
to be an apparent difference of damage among phenotypes.                     Sequencing, and Nuclear Microsatellite
Field-transplanting experiments in controlled conditions                     Genotyping
showed that leaf shape in this species is heritable                          Genomic DNA was extracted from leaf tissue using the
(Supplementary Figures 1A–C), but the molecular genetic                      cetyltrimethyl ammonium bromide method (Doyle and Doyle,
basis is still to be investigated.                                           1990). After preliminary universal primer screening, five cpDNA
   Oxytropis neimonggolica is endemic to China and mainly                    intergenic regions (trnT-psbD, petN-psbM, trnS-trnG, psbE-petL,
found on sunny slopes of the Helan mountains (Chang and                      and rpl16 intron; Supplementary Table 3) with good
Zhao, 1981). The morphology of this species is similar to the                amplification and considerable nucleotide diversity were used
1-leaflet phenotype of O. diversifolia (Figure 1D). O. leptophylla           for the large-scale survey of 237 individuals from 22 populations
is more widely distributed and can be found in northeastern                  (Six to 17 individuals per population; Supplementary Table 4).
China (Nei Mongol, Jilin, Hebei, Shanxi), Mongolia, and Russia               Each PCR amplification was implemented in a 15 μl volume
(Zhu et al., 2010). The distinct morphological characteristics               containing 7.5 μl 2 × TSINGKE Master mix (Tsingke Biological
include imparipinnate leaves with 5–13 leaflets and a purple                 technology, Xi’an, Shaanxi, China), 1 μl of each primer at
corolla (Figure 1E).                                                         10 μm, and 1 μl of diluted template DNA. PCR thermocycling

Frontiers in Plant Science | www.frontiersin.org                         4                                    August 2021 | Volume 12 | Article 681962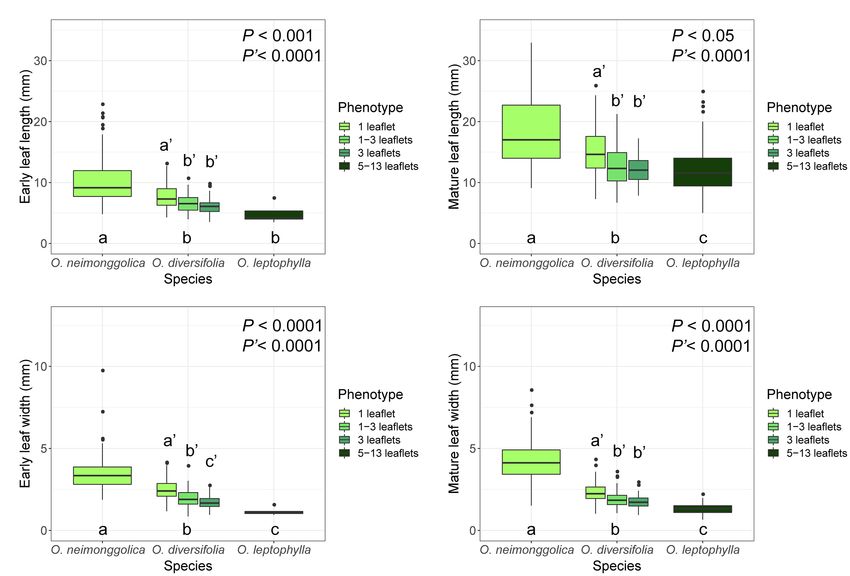
Wang et al.                                                                                                            Leaf-Shape Cline in Oxytropis diversifolia

conditions were 3 min of initial denaturation at 95°C, followed          heuristic search, TBR branch-swapping, 1,000 bootstrap replicates,
by 30 cycles of 30s at 94°C, 30s at the annealing temperature            random addition sequence with 10 replicates, and a maximum
(Supplementary Table 3), 60s of elongation at 72°C, and ending           of 1,000 trees saved per round. jModelTest v2.1.7 (Darriba
with a 7 min extension at 72°C. Sequencing was conducted                 et al., 2012) was used to choose the best-fit nucleotide substitution
by Tsingke Biological technology on an ABI 3730xl DNA                    model following the Bayesian Information Criterion (BIC). The
analyzer (Applied Biosystems, Foster City, CA, United States).           Bayesian inference was performed using MrBayes v3.2.5 (Ronquist
All of the sequences were deposited in GenBank under accession           and Huelsenbeck, 2003; Ronquist et al., 2012). Two independent
numbers MN950995-MN952199 (including sequences of the                    analyses starting from different random trees with three heated
four outgroup species, see below).                                       and one cold chain were run for 10,000,000 generations, and
   Nuclear DNA variation was characterized at 11 microsatellite          trees were sampled every 1,000 generations (10,000 trees sampled
loci for all 551 individuals (Supplementary Table 6). These              in total). The first 2,500 trees (25%) were discarded as burn-in.
microsatellites were retrieved from Wang et al. (2018) based             Tree visualization was achieved in FigTree v1.4.3.2 A statistical
on the reliability of amplification and the ease of scoring. The         parsimony network based on Median Joining method (Bandelt
sequences of the primer pairs, PCR conditions, and the genotyping        et al., 1999) was constructed and visualized using PopArt 1.7
method were described in detail in Wang et al. (2018).                   (Leigh and Bryant, 2015).

Chloroplast DNA Sequence Analyses                                        Nuclear Microsatellite Analyses
Population Genetics                                                      Microsatellite Polymorphism and Genetic Diversity
Sequences were aligned and edited using Geneious 9.0.2.1 The             We first tested genotypic linkage disequilibrium between each
five fragments were concatenated for further analyses. Haplotypes        pair of loci within each population, using the G test available
were identified using DnaSP v6.12.01 (Rozas et al., 2017), with          in GENEPOP 4.7 (Rousset, 2008). Multiple tests were then
sites of nucleotide substitutions considered only. Several genetic       corrected using Benjamini–Hochberg correction (Benjamini
diversity parameters, including number of segregating sites (S),         and Hochberg, 1995). We also used exact tests implemented
number of haplotypes (h), haplotype diversity (Hd), and                  by GENEPOP to test for departure from Hardy–Weinberg
nucleotide diversity (π; Nei, 1987), were calculated for each            equilibrium (Rousset and Raymond, 1995). Because heterozygote
population and also at the species level using DnaSP. To test            deficiency was recorded for almost all loci across populations,
whether the observed amount of genetic diversity deviates from           we tested large allele dropout and stuttering using Micro-
neutral expectations, we estimated Tajima’s D (Tajima, 1989),            Checker 2.2.3 (van Oosterhout et al., 2004) and estimated null
Fu and Li’s D* and F* (Fu and Li, 1993), and assessed the                allele frequencies using the EM algorithm with the program
significance of these statistics in DnaSP with default settings.         FreeNA (Chapuis and Estoup, 2007). Several genetic diversity
    To explore whether genetic diversity at the population level         parameters, including number of alleles (Na), observed
was different among species, we fitted a linear model with               heterozygosity (Ho), and unbiased expected heterozygosity (He)
those genetic diversity parameters in each population as response        and FIS, were calculated using GenAlEx version 6.503 (Peakall
variables, the number of individuals sampled, population size            and Smouse, 2006, 2012). Linear models were fitted as described
(with the basic assumption that genetic diversity increases with         in the “Chloroplast DNA Sequence Analyses” section.
both of them), and species identity as explanatory variables.
The significant contribution of each explanatory variable was            Genetic Differentiation and Isolation by Distance
tested using the stepwise multiple regression procedure.                 Pairwise FST estimates were calculated following Weir and
    To examine how nucleotide variation is partitioned among             Cockerham (1984) in GENEPOP, and tests of the genotypic
species, as well as among populations within O. diversifolia,            differentiation among populations were performed using the
we investigated population structure using the spatial analysis          exact G test provided by GENEPOP. To test for isolation by
of molecular variance (SAMOVA, Dupanloup et al., 2012)                   distance (IBD), we regressed linearized genetic differentiation
implemented by SPADS 1.0 (Dellicour and Mardulyn, 2014).                 between populations, measured as FST/(1 − FST; Rousset, 1997),
We ran 10 independent replicates testing for 2–20 groups (K),            and geographic distances using Mantel tests with 10,000
and the number of iterations was set to 10,000.                          permutations.

Phylogenetic Relationship                                                Population Structure
The phylogenetic relationship among haplotypes was                       We used the Bayesian clustering program STRUCTURE 2.3.4
reconstructed based on maximum parsimony (MP) and Bayesian               (Pritchard et al., 2000) to probabilistically assign all individuals
inference (BI). We used four species collected in Nei Mongol             to a varying number of clusters (K). We used an admixture
(O. aciphylla, O. bicolor, O. racemosa, and O. squammulosa)              model with independent allele frequencies and ran 10 replicates
as outgroups. For all the analyses, we considered sites of               for each value of K = 1–10 with a burn-in of 10,000 Markov
nucleotide substitutions only. PAUP* 4.0b10 (Swofford, 2002)             Chain Monte Carlo (MCMC) steps followed by 50,000 iterations.
was used to conduct the MP analyses with the following settings:         The best K was determined using the method of Pritchard

 http://www.geneious.com
1
                                                                          http://tree.bio.ed.ac.uk/software/figtree/
                                                                         2

Frontiers in Plant Science | www.frontiersin.org                     5                                                 August 2021 | Volume 12 | Article 681962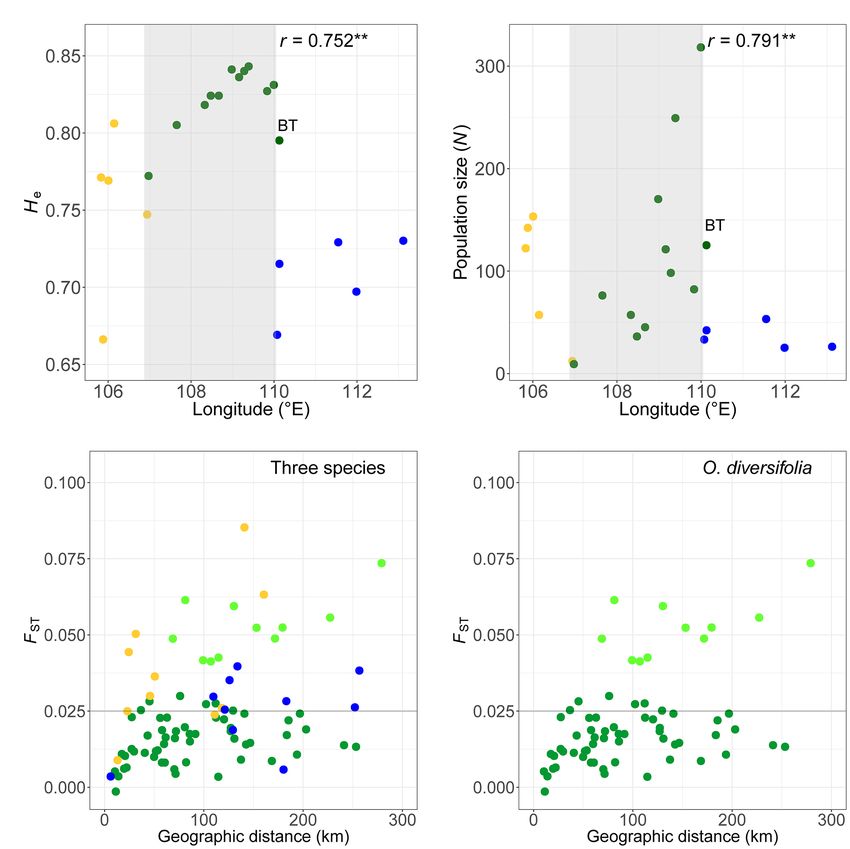
Wang et al.                                                                                                   Leaf-Shape Cline in Oxytropis diversifolia

et al. (2000) and Evanno et al. (2005) in CLUMPAK (Kopelman                two strategies were used as: population-based model and
et al., 2015). The individual cluster assignments were determined          individual-based model. Firstly, at the population level (N = 12),
and visualized also using CLUMPAK. Additionally, we used                   we calculated the weight mean of leaflet-blade size indicator
the program InStruct (Gao et al., 2007), which is based on a               for each population as response variable, i.e., (mean X of 1
similar algorithm to STRUCTURE but allows for partial self-                leaflet) × (proportion of 1 leaflet) + (mean X of 1–3 leaflets)
fertilization or inbreeding, to verify our results.                        × (proportion of 1–3 leaflets) + (mean X of 3 leaflets) ×
                                                                           (proportion of 3 leaflets), in which X can be early leaf length,
Micro- and Macrohabitat Analyses                                           mature leaf length, early leaf width, or mature leaf width.
Microhabitat Differentiation                                               We then constructed a linear model including six macroclimatic
To detect any potential effect of abiotic environment on the               variables and altitude as explanatory variables (i.e., full model;
observed pattern of leaf-phenotypic differentiation, we collected          the null model had no explanatory variables but only mean
data of different niche variables separated into microhabitat              value of the response variable as intercept), and performed
and macrohabitat axes, according to the hierarchical scale at              spatial autocorrelation tests for the simulated residuals (1,000
which the variables were measured. The microhabitat axes                   permutations) from both the null model and the full model.
captured habitat attributes at the local scale of individuals              For early/mature leaf width, although residuals from the null
within populations. For each individual sampled, we surveyed               model showed spatial autocorrelation (Moran’s index = 0.12/0.092,
a 40 cm × 40 cm square plot, of which the edge length was                  p = 0.037/0.067), residuals from the full model showed no
about four times the focal plant height (plant height < 10 cm;             spatial autocorrelation (p = 0.33/0.99), which indicates the spatial
Figure 1F). We measured slope (by geologic compass), the                   autocorrelation of early/mature leaf width can be explained by
percent of total vegetation cover, the percent of rocky ground             those variables. Next, a stepwise multiple regression analysis
(rock diameter > 0.2 cm), and the percent of bare ground                   was performed. Data were scaled prior to analyses. Secondly,
(sand and soil). The latter three were scored on pictures by               at the individual level, we randomly selected maximum individuals
eye, and always done by the same experimenter (HW). In                     in each population according to leaf-shape phenotype frequency
total, we collected microhabitat data for 438 individuals in 18            (N = 231) and then performed linear mixed-effects models
populations (Supplementary Table 7). We then conducted                     with spatially autocorrelated random effects considered (longitude
linear mixed-effects models on the four variables as described             and latitude coordinates as spatial information). The explanatory
in the “Measurements and Analyses of Leaf Morphology”                      variables (fixed effects) included six macroclimatic variables,
section.                                                                   altitude, and STRUCTURE admixture proportion (green cluster
                                                                           value in K = 4). The significance of each variable was tested
                                                                           through likelihood-ratio test (for details see Imbert, 2020).
Macrohabitat Differentiation
The macrohabitat axes of bioclimatic data were retrieved based                 All of the statistical analyses were performed using R software
on field sampling localities at the coarse scale (22 records;              version 3.5.2 (R Core team, 2018). PCA was performed using
Supplementary Table 1). Nineteen contemporary bioclimatic                  the “FactoMineR” library (Lê et al., 2008). General linear
variables of the time period 1970–2000 at 30-s resolution were             mixed-effects models were fitted using the “lmer” function
downloaded from WorldClim3 (Hijmans et al., 2005).                         from the “lme4” library (Bates et al., 2015). Linear mixed-
We conducted PCA on the 19 variables, and then removed                     effects models with spatially autocorrelated random effects
highly correlated variables while keeping relatively orthogonal            considered were fitted using the “fitme” function from the
variables important to plant physiology and phenology, and                 “spaMM” library (Rousset and Ferdy, 2014). Spatial
hence geographical distribution for further analyses: annual               autocorrelation analyses were performed using the “DHARMa”
mean temperature (Bio01), mean diurnal range (Bio02),                      library (Hartig, 2020). Mantel tests were performed with the
isothermality (Bio03), temperature seasonality (Bio04), annual             “ecodist” library (Goslee and Urban, 2007).
precipitation (Bio12), and precipitation seasonality (Bio15).
We also extracted aridity index for those localities from the
Global Aridity Index database (at 30-s resolution of the time
                                                                           RESULTS
period 1970–2000; Trabucco and Zomer, 2018). Aridity index
is calculated as mean annual precipitation divided by mean                 Spatial Pattern of Leaf-Shape Distribution
annual potential evapotranspiration, which can be a better                 For O. diversifolia, three populations in the east were dominated
index of relative moisture supply based on the prevailing climate          by the 1-leaflet phenotype (>95.0%) coupled with the phenotype
instead of annual precipitation.                                           of 1–3 leaflets only, while the three phenotypes co-occurred
   According to the leaf ecophysiological theory, leaf lobation/           in the remaining nine populations (1 leaflet, 1–3 leaflets, and
dissection can affect leaf thermoregulation and hydraulic efficiency       3 leaflets; Figure 1G; Supplementary Table 1). As a whole,
mainly through reduction in effective leaf size (see Introduction).        the range and mean of proportions of three phenotypes in
For O. diversifolia, in order to explain variation of the four             O. diversifolia populations were 5.3–97.6% (43.1%), 2.4–63.1%
leaf-morphological traits measured with macroclimatic variables,           (24.4%), and 0–70.2% (32.4%), respectively. For O. neimonggolica,
                                                                           four out of five populations were monomorphic with 1-leaflet
 http://www.worldclim.org
3
                                                                           phenotype (Figure 1G), and the only exception was one

Frontiers in Plant Science | www.frontiersin.org                       6                                     August 2021 | Volume 12 | Article 681962
Wang et al. Leaf-Shape Cline in Oxytropis diversifolia
individual with 1–3 leaflets in the population PFIF (0.7%; (Supplementary Figure 2). The majority of haplotypes (72.5%,
Supplementary Table 1). The five populations of O. leptophylla 37 out of 51) was fixed in one population (private haplotypes,
were predominantly monomorphic with the phenotype of 5–13 hp), ranged from one to six per population
leaflets, and exceptions were found in BOPO (one with 1 (Supplementary Table 4). We found that Tajima’s D, Fu and
leaflet, one with 3 leaflets, and three with 3–5 leaflets; 15.1%) Li’s D* and F* did not deviate from neutrality for any individual
and H (one with 3–5 leaflets; 4.0%; Figure 1G; population (Supplementary Table 4). However, these values
Supplementary Table 1). were significantly negative for all populations combined in O.
For 12 populations of O. diversifolia, the 1-leaflet proportion diversifolia (p < 0.01; Table 1A).
showed significant spatial autocorrelation (Moran’s index = 0.22, At the species level, the genetic diversity parameters (S, h,
p = 0.0018). Autocorrelation was also revealed for the proportion hp, and Hd) were highest in O. diversifolia (54, 51, 37, and
of 1–3 leaflets (Moran’s index = 0.13, p = 0.031) and marginally 0.910, respectively; Supplementary Table 4). At the population
detected for the proportion of 3 leaflets (Moran’s index = level, the species effect was still significant for estimates of h
0.094, p = 0.065). Similarly, a significant positive relationship and Hd, while marginally significant for the estimation of hp
was found between the difference in 1-leaflet proportion (Table 1A).
(Euclidean distance) and the geographical distance (Mantel test,
r = 0.43, p = 0.013), but this relationship was not detected Population Structure
for the difference in the proportion of 1–3 leaflets or for 3 Spatial analysis of molecular variance results indicated that
leaflets (p > 0.10). Significant correlations were also observed FCT reached a plateau when K = 3 (Supplementary Figure 3),
between 1-leaflet proportion and longitude (Spearman’s rank in congruence with the species delimitation. When K = 4–7,
test, r = 0.70, N = 12, p = 0.015), as well as latitude (r = −0.62, further population segregations could be found in
p = 0.035). The proportion of 1–3 leaflets was marginally O. neimonggolica and O. leptophylla, but not in O. diversifolia
correlated with longitude (r = −0.56, p = 0.063) and latitude (Supplementary Table 5).
(r = 0.57, p = 0.059), while the proportion of 3 leaflets was
significantly correlated with longitude (r = −0.63, p = 0.029),
Phylogenetic Relationship
but not with latitude (p = 0.12). No correlation was detected
The phylogenetic analyses based on BI and MP methods yielded
between phenotype proportion and altitude (p > 0.10).
largely congruent topologies (Figure 3A). Two well-supported
sister clades were revealed, corresponding to O. neimonggolica
Inter- and Intraspecies Variation of Leaf (H1–H9) and O. diversifolia (H10–H60), respectively. The rare
Morphology haplotypes in O. leptophylla (H63 and H64) had a close
Concerning the four leaf-morphological traits related with relationship with the former two major clades, while the main
leaflet-blade size measured, we found that they were all haplotypes (H61 and H62) were close to the outgroup species
significantly differentiated among the three species (p < 0.05 in O. racemosa.
all the cases), with O. neimonggolica > O. diversifolia > The relationships of those haplotypes were further illustrated
O. leptophylla (Figure 2; Supplementary Table 2). Similarly, using parsimony network (Figure 3B). We revealed that
for the intraspecies analysis of O. diversifolia, the leaf-shape haplotypes of O. diversifolia could be categorized into four
phenotype effect was also significant for the four traits measured haplogroups, which were derived from three main haplotypes
(p < 0.0001 in all the cases), with higher value of 1-leaflet (H12, H15, and H17) and H51. H15- and H17-derived
phenotype than phenotypes of 1–3 leaflets and 3-leaflets haplogroups could be found in all 12 populations
(Figure 2; Supplementary Table 2). Overall, the inter- and (Supplementary Figure 2). The proportions of three leaf-shape
intraspecific morphological differentiation exhibited a similar phenotypes in three main haplotypes/haplogroups were not
trend, the leaflet blade was smaller if the species/phenotype significantly different from the expected proportion
had more leaflets (Figure 2). (Χ2 = 0.0042–4.73, df = 2, p > 0.05). Consistently, the phenotypes
and haplotypes/haplogroups were not significantly associated
(Pearson’s Chi-squared test, Χ2 = 3.72/2.47, df = 4, p > 0.05).
cpDNA Sequence Variation
cpDNA Haplotypes and Genetic Diversity
The concatenated cpDNA dataset had a total alignment length Nuclear Microsatellite Variation
of 3,849 bp. Across all 237 sequences, 64 haplotypes were Microsatellite Polymorphism and Genetic Diversity
identified, characterized by 88 variable sites, of which 49 were The allelic diversity was highly variable among 11 loci genotyped,
parsimony informative. The three species were fixed for distinct with the total number of alleles ranging from 10 to 47, and
haplotypes, with H1–H9 in O. neimonggolica, H10–H60 in the average number of alleles (Na) per population varying from
O. diversifolia, and H61–H64 in O. leptophylla (Figure 3). In 5.5 to 15.3 (Supplementary Table 6). Thirty-three out of 1,210
O. diversifolia, the number of haplotypes (h) per population (2.7%) within-population genotypic disequilibria were significant
ranged from four (BT) to 11 (PTWE; Supplementary Table 4). at the 5% level after Benjamini–Hochberg correction but were
Three most frequent haplotypes (H12, H15, and H17; Figure 3B) not specific for any pairwise loci or population. Significant
accounted for 47.4% of the samples, which could be found heterozygote deficits were observed in 155 out of 242 locus-
in 5, 9, and 10 out of 12 populations, respectively specific tests. Consistently, in all 22 populations, FIS across
Frontiers in Plant Science | www.frontiersin.org 7 August 2021 | Volume 12 | Article 681962Wang et al. Leaf-Shape Cline in Oxytropis diversifolia
A B
C D
FIGURE 2 | Boxplots of four leaf-morphological traits measured showing inter- and intraspecific leaflet-blade size differentiation. (A) early leaf length; (B) mature leaf
length; (C) early leaf width; and (D) mature leaf width. Values of P indicate the significance of differences among species (P) or among phenotypes of O. diversifolia
(P′) in linear mixed-effects models, and different letters indicate significant differences of pairwise comparisons (p < 0.05, Tukey’s HSD test).
loci was significantly higher than expected and ranged from (Figure 4A). We also found that the population size decreased
0.23 to 0.35 (Supplementary Table 7). We found no evidence westward as well (r = 0.79, p = 0.0061; Figure 4B).
of large allele dropout and the genotyping error of stuttering
was scarce, but the presence of null alleles at all loci was
suggested by Micro-Checker. The null allele frequencies were Genetic Differentiation and Isolation by Distance
low to moderate in most loci (0.038–0.18), but locus N745892 Pairwise FST (22 populations and 231 pairs) ranged from 0
and N2717495 exhibited a high level of null alleles (0.21 and to 0.20: 217 values of p were significantly different from 0
0.23, respectively). Excluding these two loci decreased the FIS at the 5% level (exact G test). FST values between pairwise
values (0.12–0.30), but all values were still significantly larger populations of different species were generally high, with O.
than zero (data not shown). Thus, it seems these two loci leptophylla – O. neimonggolica (FST = 0.16 ± 0.021, mean ± s.d.)
were not the only cause of heterozygosity deficits, and the > O. leptophylla – O. diversifolia (FST = 0.11 ± 0.014) > O.
systematic pattern of heterozygote deficiency found in our diversifolia – O. neimonggolica (FST = 0.083 ± 0.022). By
study is likely due to the self-compatibility and/or inbreeding. contrast, the FST values between pairwise populations of the
We then retained all 11 loci to calculate genetic diversity indices same species were relatively low (Figure 4C), with
and estimated genetic structure. 0.021 ± 0.016 in O. diversifolia, 0.039 ± 0.022 in O. neimonggolica,
At the species level, the genetic diversity parameters (Na, and 0.025 ± 0.012 in O. leptophylla, respectively. It is worth
Ho, and He) across loci were highest in O. diversifolia (22.7, noting that, in O. diversifolia, most of the largest FST values
0.583, and 0.845, respectively; Supplementary Table 7). Similarly, were associated with a single population, the 1-leaflet-dominant
at the population level, the species effect was also significant population BT (FST = 0.053 ± 0.0098), indicating a genetic
for estimates of Na, Ho, and He (Table 1B). Moreover, in O. discontinuity between this population and the other populations
diversifolia when excluding population BT with low genetic (Figure 4D). When excluding BT, the FST values in O. diversifolia
diversity (Supplementary Table 7) but high genetic differentiation were even lower (0.015 ± 0.0073), and 49 out of 55 FST values
with other populations (see results below), He showed a significant were below 0.025. A marginally significant IBD pattern was
correlation with longitude (Spearman’s rank test, r = 0.75, obtained in O. diversifolia (Mantel test, r = 0.43, p = 0.071;
N = 11, p = 0.0076), that is, He decreased from east to west Figure 4D) and O. neimonggolica (r = 0.54, p = 0.084), but
Frontiers in Plant Science | www.frontiersin.org 8 August 2021 | Volume 12 | Article 681962Wang et al. Leaf-Shape Cline in Oxytropis diversifolia
A B
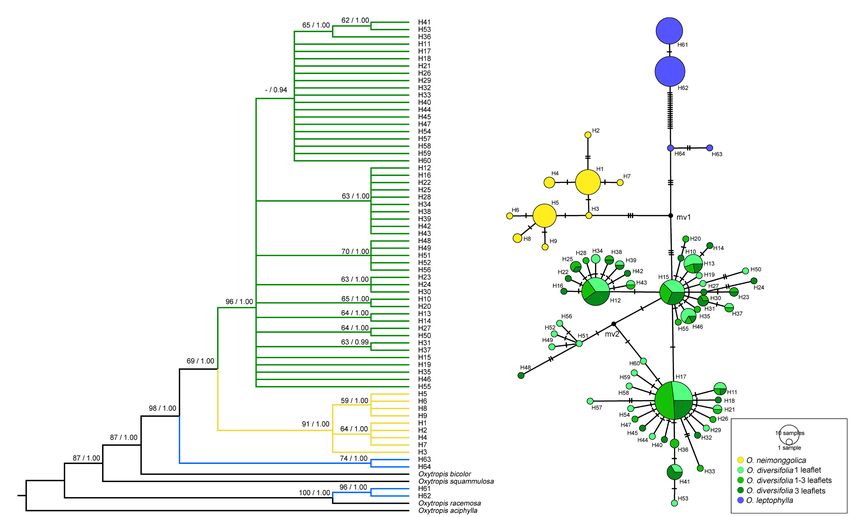
FIGURE 3 | Phylogenetic relationships based on cpDNA haplotypes. (A) The Bayesian tree topology of 64 cpDNA haplotypes detected in the three Oxytropis
species. Numbers above the branches are MP bootstrap support values (left) and Bayesian posterior probability (right). (B) Network-derived genealogical
relationships of the 64 haplotypes.
TABLE 1 | Descriptive statistics of genetic variability based on cpDNA and 11 nuclear microsatellite loci.
O. neimonggolica O. diversifolia O. leptophylla Value of p
(5 populations) (12 populations) (5 populations)
(A) cpDNA
S 2.4(0.548) 9.1(3.40) 5(8.94) 0.30
h 2.8(0.447)a 7.8(2.12)b 2.4(0.894)aWang et al. Leaf-Shape Cline in Oxytropis diversifolia
A B
C D
FIGURE 4 | (A,B) Scatterplots of (A) the unbiased expected heterozygosity (He) based on microsatellite dataset and (B) the estimated population size (i.e., the total
number of individuals in the population) against longitude in 22 populations. Light grey shaded parts indicate a significant cline in O. diversifolia excluding population
BT (coefficients of Spearman’s rank test were shown, **p < 0.01). (C,D) Scatterplots of pairwise FST calculated from microsatellite dataset against geographic
distances (km). (C) Pairwise combinations of populations in the three species. (D) Pairwise combinations of populations in O. diversifolia. Light green circles
represent the pairwise combinations between BT, a 1-leaflet-dominated population, and the other populations of O. diversifolia. Yellow circles, O. neimonggolica;
green circles, O. diversifolia; and blue circles, O. leptophylla. Forty-nine out of 55 FST values of O. diversifolia were below 0.025, while only three out of 10 FST values
of O. neimonggolica/O. leptophylla were below 0.025 (the horizonal line of FST = 0.025 is highlighted in C and D)
estimation indicated that the optimal value for K was 5 correlation between admixture proportions (green cluster) and
(Supplementary Figure 4B). We showed the results with K = 2–5 four leaf-morphological traits measured, and all the tests were
(Figure 5). For K = 2, individuals from O. leptophylla populations not significant (Pearson’s correlation test, N = 302–311, p = 0.26–
were predominantly assigned to the blue cluster, while the ones 0.75) except for mature leaf width with a weak correlation
from O. neimonggolica and O. diversifolia were assigned to the (r = −0.13, N = 311, p = 0.020). After controlling for latitude
green cluster. For K = 3, the assignments of individuals were and longitude, the correlation was not significant (Pearson’s
in good congruence with the three species delimitation, although partial correlation test, p = 0.48). Finally, the analysis of K = 5
nine individuals (four of 1 leaflet, two of 1–3 leaflets, and three exhibited further partitioning of populations from O. neimonggolica,
of 3 leaflets) of O. diversifolia had probabilities greater than with population N and PFIF differed from PSIT, Y, and Z in
0.50 of being assigned to the yellow O. neimonggolica cluster. average likelihood of individuals being assigned to the yellow
For K = 4, the individuals of O. diversifolia populations were cluster (0.81 ± 0.24 vs. 0.17 ± 0.26). The results obtained from
further partitioned into different clusters. The likelihood of the InStruct program were largely congruent with the STRUCTURE
individuals from population BT being assigned to the light green results (Supplementary Figure 5).
cluster was 0.92 ± 0.041 (mean ± s.d.). Taken all the 12 populations
together, individuals of the three phenotypes did not differ Micro- and Macrohabitat Differentiation
substantially in being assigned to the green cluster (0.50 ± 0.35 Microhabitat Differentiation
for 1 leaflet, 0.54 ± 0.33 for 1–3 leaflets, and 0.57 ± 0.33 for At the species level, we found that the values of slope (°)
3 leaflets; one-way ANOVA, p = 0.25). We also tested for in O. diversifolia (4.94 ± 3.64, mean ± s.d.) were significantly
Frontiers in Plant Science | www.frontiersin.org 10 August 2021 | Volume 12 | Article 681962Wang et al. Leaf-Shape Cline in Oxytropis diversifolia
FIGURE 5 | STRUCTURE results for 22 Oxytropis populations based on microsatellite dataset (K = 2–5). The small black lines separate populations, named at the
bottom of the graph. Each individual is a small bar with color coded according to probability of clustering in a particular group. Populations are ordered west to east
within each species.
lower than those of the other two species (14.9 ± 11.2 in significant predictors (Supplementary Table 9;
O. neimonggolica and 13.1 ± 9.94 in O. leptophylla, respectively; Figures 6B1–B3). We also did the multiple regression using
p = 0.0055; Supplementary Table 8). However, the percent aridity index instead of annual precipitation, and the results
of total vegetation cover, the percent of rocky ground, and were largely consistent (Supplementary Tables 10 and 11).
the percent of bare ground did not differ among species Among the predictive bioclimatic variables, annual precipitation
(p = 0.16–0.82; Supplementary Table 8). Similarly, in gave the highest correlation with longitude (Spearman’s rank
O. diversifolia, the leaf-shape phenotype effect was marginally test, r = 0.99, N = 12, p < 0.0001; Figure 6C2), followed
significant for slope (6.28 ± 4.77 for 1-leaflet phenotype, by isothermality (r = 0.71, p = 0.012; Figure 6C3), but no
3.89 ± 2.27 for 1–3 leaflets, and 4.41 ± 2.58 for 3 correlation between temperature seasonality/annual mean
leaflets; p = 0.076; Supplementary Table 8), but not for temperature and longitude was detected (p = 0.30/0.13;
the other three variables (p = 0.19–0.71; Figure 6C1).
Supplementary Table 8).
Macrohabitat Differentiation DISCUSSION
Across the whole range of O. diversifolia, the population-based
model revealed that the multiple regressions of weight means The adaptive function of leaf shape has been long debated,
of four leaflet-blade size related traits and selected bioclimatic and here, we contribute empirical evidence to this debate. Our
variables were significant with high predictive power (Multiple comprehensive analyses of leaf-shape variation, neutral genetic
R2 = 0.788–0.969, p < 0.01 in all the cases; Table 2). The best structure, micro- and macrohabitat in O. diversifolia, and two
two predictors for weight mean of early/mature leaf length close relatives revealed three major findings. First, we found
were temperature seasonality and isothermality, which explained significant clinal variation of leaf shape in O. diversifolia across
42.3/35.3% and 41.1/38.5% of the total variance, respectively, its distribution range in Nei Mongol, China. The three phenotypes
followed by annual precipitation that explained 10.3/5.0% also differ in leaflet-blade size, with phenotypes with more
(Table 2A). However, the best predictor of early/mature leaf leaflets having smaller leaflet blades. Second, compared with
width was annual precipitation that alone explained 52.8/49.0% O. neimonggolica and O. leptophylla, the genetic differentiation
of the total variance, followed by temperature seasonality and of populations in O. diversifolia at putatively neutral markers
isothermality (annual mean temperature for early leaf width), is relatively low, and there seems to be a lack of population
which explained 4.3/24.5% and 25.6/23.4%, respectively genetic structure. Third, the clinal pattern of leaf-shape variation
(Table 2A; Figures 6A1–A3). The remaining variables were in O. diversifolia could be largely explained by three macroclimatic
not significant predictors (p = 0.13–0.99). variables, temperature seasonality, annual precipitation, and
The individual-based model yielded largely congruent isothermality. The three phenotypes of O. diversifolia also differ
results with moderate predictive power (Multiple R2 = 0.282– slightly in one microhabitat variable, the slope. These results
0.457, p < 0.0001 in all the cases; Table 2B). For early/ indicate that the spatial pattern of leaf-shape variation in
mature leaf length, the three variables explained most of O. diversifolia is likely to result from natural selection driven
the variation were the same as those in population-based by abiotic environmental factors. We discuss these results below
model; while for early/mature leaf width, two variables, and also used our results to tentatively explain the spatial
temperature seasonality and annual precipitation, were patterns of the three species.
Frontiers in Plant Science | www.frontiersin.org 11 August 2021 | Volume 12 | Article 681962Wang et al. Leaf-Shape Cline in Oxytropis diversifolia
Natural Selection and the Leaf-Shape
Standardized coefficients estimated for the macroclimatic variables are shown. PV1, percentage of variation explained by temperature seasonality; PV2, percentage of variation explained by annual precipitation; and PV3, percentage of
Cline in O. diversifolia
Value of pWang et al. Leaf-Shape Cline in Oxytropis diversifolia A1 A2 A3 B1 B2 B3 C1 C2 C3 FIGURE 6 | (A1–B3) Partial regression plots showing effects of predictive macroclimatic variables on mature leaf width of O. diversifolia. (A1–A3) Population-based model (N = 12); (B1–B3) Individual-based model (N = 213). PV1, percentage of variation explained by temperature seasonality; PV2, percentage of variation explained by annual precipitation; and PV3, percentage of variation explained by isothermality. (C1–C3) Scatterplots of temperature seasonality, annual precipitation, and isothermality against longitude in 22 Oxytropis populations. Yellow circles, O. neimonggolica; green circles, O. diversifolia; and blue circles, O. leptophylla. Light grey shaded parts indicate a significant cline in O. diversifolia (coefficients of Spearman’s rank test were shown, *p < 0.05; ***p < 0.001). rare variants and hence are often interpreted as indicating Potential Selective Agents Acting on Leaf rapid population expansion. The “star-like” pattern of haplotype Shape of O. diversifolia network is also indicative for such event (Figure 3B; reviewed Our environmental association analysis provided some cues in Allcock and Strugnell, 2012). We thus expect a reverse about potential selective agents on leaf shape in O. diversifolia. westward colonization to harsher environments for the We found that the clinal variation in leaf shape could remaining 11 populations (dry Stipa grasslands toward semi- be tentatively explained by three geographically varying desert regions), and natural selection could play a role during macroclimatic variables: temperature seasonality, annual this process. precipitation, and isothermality. In general, 1-leaflet plants with Frontiers in Plant Science | www.frontiersin.org 13 August 2021 | Volume 12 | Article 681962
Wang et al.                                                                                                      Leaf-Shape Cline in Oxytropis diversifolia

relatively larger leaflet-blade size predominate in regions with             O. diversifolia (Figures 1A,D). O. neimonggolica was characterized
higher annual precipitation but lower temperature seasonality                by the 1-leaflet feature when first recognized as a new species
and isothermality, while 1–3 leaflet and 3-leaflet plants with               (Chang and Zhao, 1981), while O. diversifolia was characterized
reduced leaflet-blade size are more frequent in drier regions                by 3 leaflets and the phenotypes of 1 leaflet, 1–3 leaflets were
with pronounced temperature seasonality and isothermality.                   not reported (see Flora of China, Zhu et al., 2010). Our genetic
These results fit the ecophysiological predictions well. Concerning          results confirmed the species status of these two, but the phenotypic
the thermoregulation theory, boundary layer thickness increases              description of O. diversifolia must be formally revised in the future.
with effective leaf size, specifically mean length of a leaf in                  Because the distributional patterns of O. diversifolia and
the direction of the wind (Givnish, 1979; Nobel, 2005). Lineage-             O. neimonggolica are different from that of O. diversifolia and
specific genetic or developmental constraints may make                       O. leptophylla (allopatric vs. parapatric), we tentatively provide
reductions in effective leaf size via lobed or compound leaves               different explanations. For the allopatric pair of O. neimonggolica
more likely in some lineages, and via simple reductions in                   and O. diversifolia, the Hetao Plain (the region from Bayannuur
entire leaf size in others. Here, in O. diversifolia, leaf dissection        to Baotou with relatively low altitude; Figure 1G) seems to
did result in smaller leaf divisions, especially leaf length is              be a natural gap separating them. The Hetao Plain is a fertile
reduced (Figures 2A,B), and thus, thinner boundary layer is                  floodplain with good irrigation, and it is intensively farmed.
possible, which can prevent the leaf from readily overheating,               Consequently, the Hetao Plain might act as a barrier which
maintain warmer leaves in cold conditions, and enable plant                  could impede gene flow and facilitate genetic divergence between
survival in places with greater temperature change. Meanwhile,               the two species. We noticed that, although 1-leaflet phenotype
dissected leaves can also have advantages in dry environments                is nearly fixed in all populations of O. neimonggolica, population
if leaf width is reduced, via better water supply and lower                  divergence at both markers still exists (Supplementary Table 5;
hydraulic resistance (Givnish, 1979; Nicotra et al., 2011). In               Figure 5; probably due to the west–east geographic separation
our study, plants with more leaflets did have reduced leaf                   in Helan Mountains), indicating stabilizing selection may
width (Figures 2C,D), and much of the variance among                         maintain the 1-leaflet phenotype in this species. The parapatric
populations could be explained by annual precipitation (Table 2;             O. diversifolia and O. leptophylla only meet close to the longitude
Figures 6A2,B2).                                                             of 110°E (Figure 1G), where hybridization between them
    Our results are consistent with two previous studies using               occurred. The morphological and genetic analyses of hybrid
reciprocal transplant experiments at a reduced geographical                  swarms indicate a potential outcome of introgression between
scale to test for the adaptive feature of leaf shape (Ferris and             species (Wang et al., unpubl. Res.), and it would be interesting
Willis, 2018; Richards et al., 2019), both of which found                    to test whether leaf-shape polymorphism in O. diversifolia was
dissected leaves performed better in dry environments. However,              obtained through introgression from O. leptophylla. It was
unlike the consistent adaptation to drought, previous studies                suggested that adaptive divergence could make the hybrid zone
found that lobed/dissected leaves are likely adaptive in either              typically a tension zone, and the transition from one lineage
particularly hot or cold habitats. For example, lobed/dissected              to another could show a narrow cline (Barton and Hewitt,
leaves were frequently found in the warmer low-altitude regions              1985; Barton and Gale, 1993). We therefore suspect that there
(Achillea millefolium, Gurevitch, 1988; the Senecio-hybrid zone,             might be strong natural selection maintaining the sharp transition
Brennan et al., 2009); meanwhile, analysis of latitudinal leaf-              between the two species.
shape cline revealed increased lobing/dissection in northern                     Although we can tentatively explain the spatial pattern of
cooler environments (I. hederacea, Campitelli and Stinchcombe,               these three species, it is still confusing that the general trend
2013; Acer ginnala, Zhu et al., 2015). Our result is thus the                of leaf-shape variation at the interspecies level is opposite to
first to highlight the potential importance of temperature                   that observed at the intraspecies level. With decreasing water
variability instead of mean temperature in the evolution of                  availability from east to west, leaflet production increases within
complex leaves. Further reciprocal transplant experiment would               O. diversifolia while decreasing among species. We suspect
be helpful to directly test the fitness consequences of those                there might be some uninvestigated factors (e.g., soil chemistry)
different macroclimatic environments.                                        driving interspecific patterns of leaf-shape variation. Polyploidy
                                                                             may also be considered to explain leaf-shape variation at intra-
                                                                             and interspecific level. For example, three main cytotypes (di-,
Species Status and the Spatial Pattern of                                    tetra-, and hexaploids) of Senecio carniolicus (Asteraceae) and
the Three Oxytropis Species                                                  the diploid S. incanus differ in leaf dissection (Suda et al.,
From our interspecies analyses, we revealed that the three                   2007; Flatscher et al., 2015). But the information of ploidy-
Oxytropis species had significantly distinct leaf morphologies               level variation is currently not available in our system.
and exhibit substantial neutral genetic differentiation from                 Furthermore, because the evolution of leaf shape is a function
one another (interspecific differentiation > intraspecific                   of both phylogenetic history and adaptation to contemporary
differentiation). These results indicate that these taxa are                 environmental conditions (Givnish, 1987; Nicotra et al., 2011),
independently evolving units and should be recognized as separate,           interspecific leaf-shape evolution needs to be further investigated
good species. This conclusion is particularly important for the              through more detailed phylogeographic analyses and placed
species pair O. neimonggolica and O. diversifolia. The morphology            in a phylogenetic context. The genus Oxytropis is well known
of O. neimonggolica is much like the 1-leaflet phenotype of                  for recent rapid radiation in Asian mountains (Kholina et al.,

Frontiers in Plant Science | www.frontiersin.org                        14                                      August 2021 | Volume 12 | Article 681962
You can also read