Genetic Differentiation and Demographic Trajectory of the Insular Formosan and Orii's Flying Foxes
←
→
Page content transcription
If your browser does not render page correctly, please read the page content below
Journal of Heredity, 2021, 192–203
                                                                                                                doi:10.1093/jhered/esab007
                                                                                                                             Original Article
                                                                                                  Advance Access publication March 1, 2021

Original Article

Genetic Differentiation and Demographic
Trajectory of the Insular Formosan and Orii’s
Flying Foxes

                                                                                                                                                                          Downloaded from https://academic.oup.com/jhered/article/112/2/192/6155757 by guest on 02 November 2021
Kung-Ping Lin, Shu-Miaw Chaw, Yun-Hua Lo, Teruo Kinjo, Chien-Yi Tung,
Hsi-Chi Cheng, Quintin Lau, Yoko Satta, Masako Izawa, Shiang-Fan Chen,
and Wen-Ya Ko
From the Department of Life Sciences and Institute of Genome Sciences, National Yang Ming Chiao Tung University,
Taipei, Taiwan (Lin, Lo, and Ko); Biodiversity Research Center, Academia Sinica, Taipei, Taiwan (Chaw); Okinawa
Zoo and Museum, Okinawa, Japan (Kinjo); Cancer Progression Research Center, National Yang Ming Chiao Tung
University, Taipei, Taiwan (Tung); Endemic Species Research Institute, Nantou, Taiwan (Cheng); Department of
Evolutionary Studies of Biosystems, SOKENDAI (The Graduate University for Advanced Studies), Hayama, Japan
(Liu and Satta); Kitakyushu Museum of Natural History and Human History, Fukuoka, Japan (Izawa); and Center for
General Education, National Taipei University, New Taipei City, Taiwan (Chen).

Address correspondence to M. Izawa, S-F. Chen, and W-Y. Ko at the address above, or e-mail: izawa@sci.u-ryukyu.ac.jp;
schen@mail.ntpu.edu.tw; wenyako@gmail.com.
Received December 7, 2020; First decision January 11, 2021; Accepted February 24, 2021.

Corresponding Editor: William Murphy

Abstract
Insular flying foxes are keystone species in island ecosystems due to their critical roles in plant
pollination and seed dispersal. These species are vulnerable to population decline because of
their small populations and low reproductive rates. The Formosan flying fox (Pteropus dasymallus
formosus) is one of the 5 subspecies of the Ryukyu flying fox. Pteropus dasymallus formosus has
suffered from a severe decline and is currently recognized as a critically endangered population in
Taiwan. On the contrary, the Orii’s flying fox (Pteropus dasymallus inopinatus) is a relatively stable
population inhabiting Okinawa Island. Here, we applied a genomic approach called double digest
restriction-site associated DNA sequencing to study these 2 subspecies for a total of 7 individuals.
We detected significant genetic structure between the 2 populations. Despite their contrasting
contemporary population sizes, both populations harbor very low degrees of genetic diversity.
We further inferred their demographic history based on the joint folded site frequency spectrum
and revealed that both P. d. formosus and P. d. inopinatus had maintained small population
sizes for a long period of time after their divergence. Recently, these populations experienced
distinct trajectories of demographic changes. While P. d. formosus suffered from a drastic ~10-fold
population decline not long ago, P. d. inopinatus underwent a ~4.5-fold population expansion. Our
results suggest separate conservation management for the 2 populations—population recovery is
urgently needed for P. d. formosus while long-term monitoring for adverse genetic effects should
be considered for P. d. inopinatus.

Subject Area: Conservation Genomics and Biodiversity
Key words: Pteropodidae, conservation genetics, RADSeq, Taiwan, Ryukyu Islands

© The American Genetic Association. 2021.
                                                                                                                                                                    192
This is an Open Access article distributed under the terms of the Creative Commons Attribution-NonCommercial License (http://creativecommons.org/licenses/by-
nc/4.0/), which permits non-commercial re-use, distribution, and reproduction in any medium, provided the original work is properly cited. For commercial re-use,
please contact journals.permissions@oup.com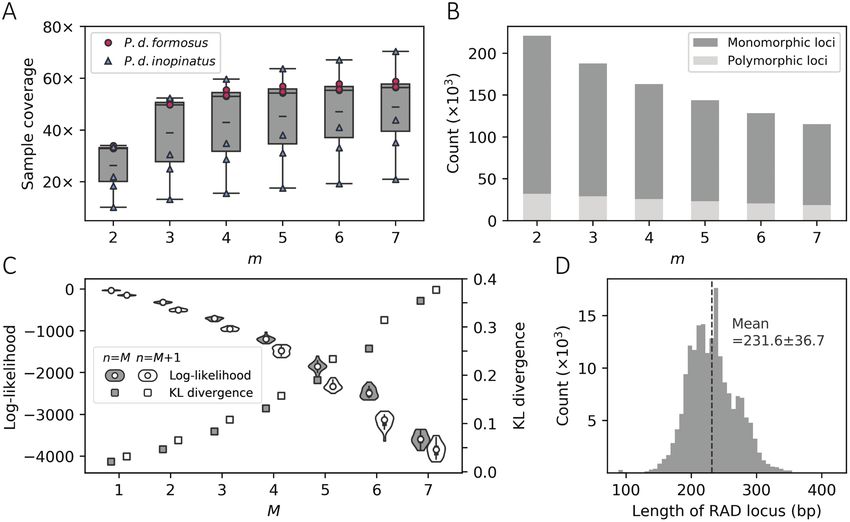
Journal of Heredity, 2021, Vol. 112, No. 2                                                                                                   193

Island species are often characterized by restricted geographic dis-           Early studies suggested that Formosan flying foxes are na-
tributions and small population sizes, which are considered to be          tive to Green Island, located in southeast of Taiwan (Kano 1929;
more prone to adverse genetic factors, such as low genetic diversity       Kuroda 1933). Individuals of P. d. formosus were also recorded
and inbreeding depression, than continental species (Ellstrand and         on the east coast of Taiwan but they were presumed to be solitary
Elam 1993; Frankham 1996, 1997, 2005). Both of these genetic fac-          without a stable and sustainable population. The population size of
tors can increase the extinction risks of the threatened island species.   P. d. formosus on Green Island was estimated to be up to a few
Loss of genetic diversity can result from inbreeding, population de-       thousand before a dramatic decline during the 1970s, which led to
cline, or restricted gene flow, and is known to reduce the long-term       a near extirpation of the population on the island with only a few
evolutionary potential of a species (Frankham et al. 1999; Frankham        individuals observed over the last 2 decades (Lin and Pei 1999; Chen
et al. 2002). Inbreeding was shown to have deleterious effects on          et al. 2009). Overhunting was thought to be the main factor causing
multiple aspects of reproductive and survival characteristics in nat-      this population decline, combined with the effect of habitat loss due
urally outbreeding species (Lynch and Walsh 1998). Therefore, re-          to windbreak planting in the coastal region. Although the hunting
solving the magnitude of these genetic factors has been considered         pressure was greatly reduced after the implementation of a conser-

                                                                                                                                                      Downloaded from https://academic.oup.com/jhered/article/112/2/192/6155757 by guest on 02 November 2021
important for the development of conservation plans, especially for        vation law in 1983, the lost habitat (mostly Ficus species) has never
threatened insular species with limited gene flow and small popu-          recovered. Therefore, habitat abandonment by P. d. formosus could
lation size. In addition, defining diverged evolutionary units for a       also be responsible for the apparent disappearance of this popula-
threatened population is also considered critical to prevent potential     tion, especially since flying foxes are generally considered highly mo-
outbreeding depression in crosses between units (Frankham 2010).           bile species that are capable of long-range migrations and interisland
Thus, distinct evolutionarily significant units (ESUs) with significant    movements (Webb and Tidemann 1996; McConkey and Drake
genetic and ecological divergence in the wild need to be managed           2007; Brown et al. 2011; Roberts et al. 2012). For example, the
separately. To provide the above critical information for conserva-        Orii’s flying fox has been reported to be able to travel 50 km across
tion management, genomic data is especially useful as, by gathering        the sea between islands (Nakamoto et al. 2011). In 2004, a small but
numerous neutral loci, they can provide precise population genetics        stable population (~50 individuals) was newly recorded on Gueishan
estimates of genetic diversity, inbreeding level, and demographic in-      Island off the northeast coast of Taiwan (Wu 2010). However, the
dependence among the target populations (Allendorf et al. 2010;            origin of this newly established population is unclear since Gueishan
Funk et al. 2012).                                                         Island is geographically closer to Yaeyama Islands (inhabited by the
    Bats in the genus Pteropus of the family Pteropodidae are com-         Yaeyama flying fox) than to Green Island (Figure 1). Due to its small
monly known as flying foxes or fruit bats. Pteropus is primarily an        population size, severe population decline, and fragmented habitats,
insular genus with most species distributed on islands (Vincenot           the Formosan flying fox is listed as an Endangered Species by the
et al. 2017). Flying foxes are found in tropical and subtropical re-       Wildlife Conservation Act in Taiwan (Cheng et al. 2017). Thus, a
gions, ranging from islands in East Africa to the south-central            precise and detailed conservation policy for this endangered taxon
Pacific. In these island ecosystems, Pteropus spp. play critical roles     is urgently needed. In contrast, whether to treat P. d. formosus as a
in pollination and seed dispersal for both endemic plants and plants       distinct ESU from other populations on the Ryukyu Islands remains
of economic importance to humans (Cox et al. 1991; Fujita and              an obscure issue given their high migratory abilities.
Tuttle 1991). However, the populations of many Pteropus spp. are               Here, we applied double digest restriction-site associated DNA
declining due to human disturbances (Mickleburgh et al. 1992). The         sequencing (ddRADSeq) method to study the conservation genetics
major anthropogenic menaces to flying foxes include habitat loss           of P. d. formosus in Taiwan and P. d. inopinatus in the main island
caused by deforestation and urbanization, overhunting for bush-            of Okinawa. First, we assessed the adverse genetic factors of these
meat, and conflicts with fruit growers. Moreover, the consequences         2 populations by estimating their levels of nucleotide diversity and
of population decline in these species are expected to be exacerbated      inbreeding. Second, we evaluated whether these 2 populations should
by their generally low reproductive rates, long maturation times,          be treated as distinct ESUs and managed separately by uncovering
and small population sizes (Mickleburgh et al. 2009; Aziz et al.           the pattern of genetic structure between these 2 populations. We
2017). Hitherto, 7 of 65 flying fox species became extinct in the past     further inferred the hypothetical demographic model of these 2
200 years, and 34 of the remaining species are currently considered        populations based on their joint folded site frequency spectrum and
threatened, including Pteropus dasymallus, the Ryukyu flying fox,          revealed very different trajectories of their recent population history.
which has been classified as Vulnerable (Vincenot 2017).                   Our results can provide critical insights into the conservation man-
    The Ryukyu flying fox is indigenous to Taiwan, the Ryukyu              agement decisions of both P. d. formosus and P. d. inopinatus.
Islands, and several islands off the north coast of the Philippines
(Kinjo and Nakamoto 2015). There are 5 recognized subspecies of
P. dasymallus that can be distinguished by their geographical distri-      Materials and Methods
butions and by slight differences in coloration pattern (Yoshiyuki
1989). Among them, the Formosan flying fox (P. d. formosus) is the         Sample Collection, DNA Extraction, and RAD
most threatened subspecies and considered to be on the verge of ex-        Sequencing
tinction by the IUCN. Other subspecies include the Orii’s flying fox       We generated genome-wide single nucleotide polymorphism (SNP)
(P. d. inopinatus; near threatened) with a population size of ~5000        data from 7 individuals. Three individuals are P. d. formosus,
individuals on Okinawa Island (Funakoshi et al. 2006, 2012), the           an endangered population endemic to Taiwan, while 4 are
Yaeyama flying fox (P. d. yayeyama; near threatened) with a few            P. d. inopinatus, which inhabits Okinawa and has been considered
thousand individuals on Yaeyama Islands, and the Erabu flying              a stable population. The 3 P. d. formosus individuals, designated as
fox (P. d. dasymallus; critically endangered) and Daito flying fox         178, 617, and 690, were captured from Hualien (eastern Taiwan),
(P. d. daitoensis; critically endangered) on the Osumi Islands and         Green Island (an island offshore of eastern Taiwan), and the open
Daito Islands, respectively (Figure 1).                                    sea off the coast of Yilan (northeastern Taiwan), respectively. The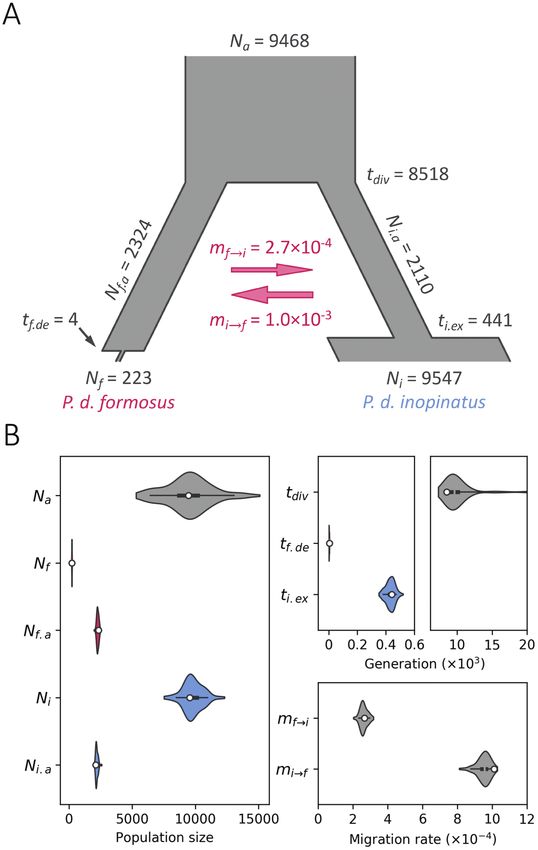
194 Journal of Heredity, 2021, Vol. 112, No. 2
Downloaded from https://academic.oup.com/jhered/article/112/2/192/6155757 by guest on 02 November 2021
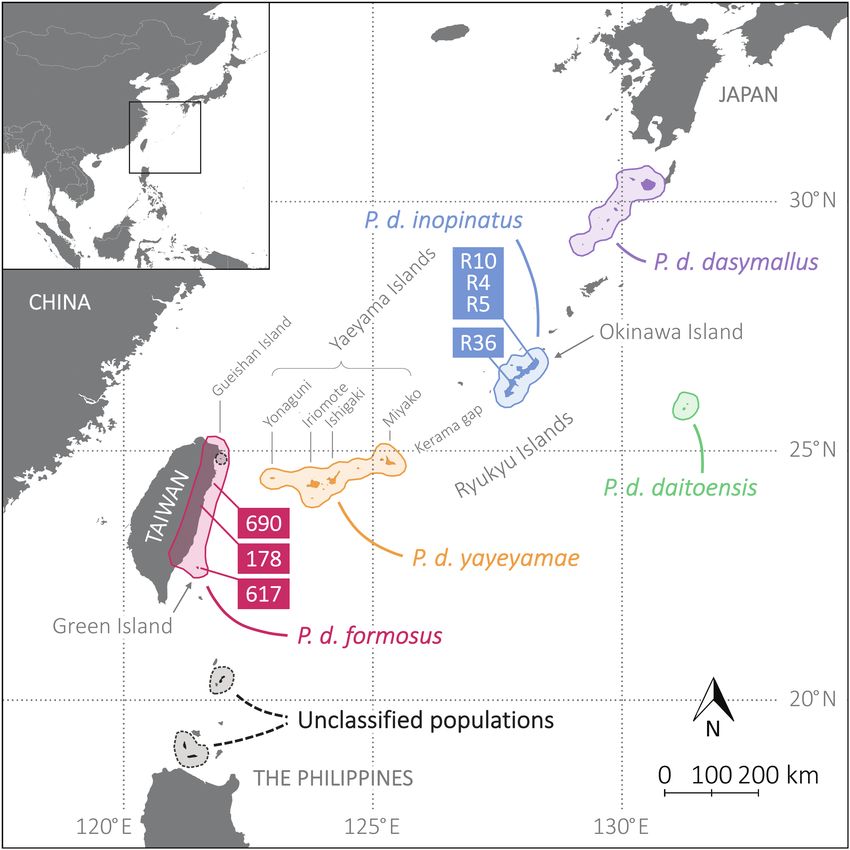
Figure 1. Geographic distribution of Pteropus dasymallus subspecies and sample locations. The geographic ranges of the 5 subspecies of P. dasymallus are
circled. These 5 subspecies include: Erabu flying fox (P. d. dasymallus), Daito flying fox (P. d. daitoensis), Orii’s flying fox (P. d. inopinatus), Yaeyama flying fox
(P. d. yayeyamae), and Formosan flying fox (P. d. formosus). The classification of P. dasymallus populations in the Gueishan Island and northern islands of
Philippines requires further investigation. The original geographic data was downloaded from the IUCN Red List website (Vincenot 2017) and edited by QGIS 3.4
(QGIS Development Team 2019). Three samples of P. d. formosus were collected from Taiwan and Green Island (designated as 178, 617, and 690). Four samples
of P. d. inopinatus were collected from Okinawa Island (designated as R10, R36, R4, and R5). See online version for full colors.
4 P. d. inopinatus individuals, designated as R10, R36, R4, and further incubation for a few hours was conducted depending on
R5, are captive individuals collected from the wild and kept at the lysis conditions.
University of the Ryukyus. The detailed sampling locations for all Considering that P. d. formosus and P. d. inopinatus are mor-
individuals are presented in Figure 1 and Supplementary Table S1. phologically similar taxa and that few genetic variants have been
For the 3 P. d. formosus individuals, frozen muscle tissues were discovered among P. dasymallus subspecies at mitochondrial loci
obtained from the Wildlife Cryobank of Taipei Zoo. For each of (Hidetoshi Ota, personal communication, 2010), we applied a
the 4 P. d. inopinatus individuals, skin samples were excised from genomic approach, double digest restriction-site associated DNA
the wing membranes using a biopsy punch (3 mm in diameter); sequencing (ddRADSeq) method, which is designed for sequencing
8 punches were collected per individual. All biopsies were pre- orthologous loci across individual genomes of the same or closely re-
served in Allprotect Tissue Reagent (Qiagen) and stored at −20 °C. lated species (Peterson et al. 2012). For a given individual genome, 2
Genomic DNA was extracted from samples using the DNeasy Blood restriction enzymes, EcoRI and MseI, were used to cleave the DNA.
and Tissue kit (Qiagen) following the manufacturer’s instructions. The cleaved DNA fragments were ligated with adaptors that con-
To better lyse the tissues, the wing membrane samples were incu- tain barcodes and sequences complementary to the PCR primers.
bated in buffer ATL and proteinase K at 56 °C for approximately After these ligated fragments were amplified by PCR, fragments with
17 hours. An additional 20 μL of proteinase K was then added and lengths between 250 base pairs (bp) and 450 bp were retained and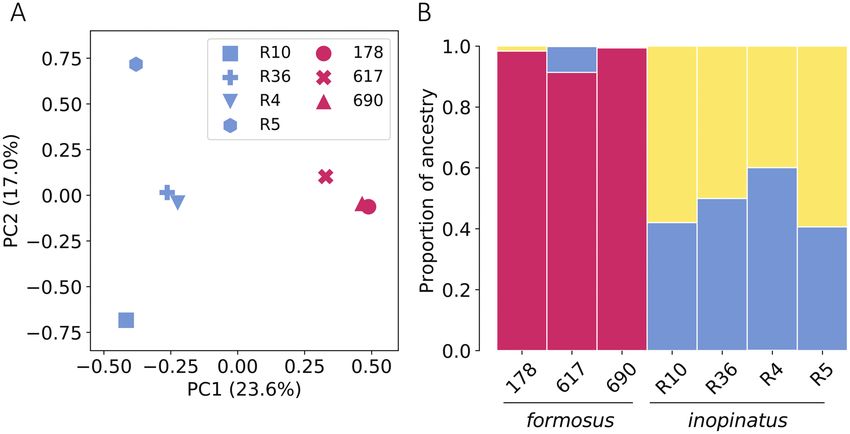
Journal of Heredity, 2021, Vol. 112, No. 2                                                                                                195

sent for paired-end sequencing. Sequencing was carried out using the     binomial distribution with the number of trials equivalent to read
Illumina HiSeqTM 2000 sequencing system in the core facility center      length and the success probability for each trial equivalent to SNP
of Genomics company in New Taipei City.                                  density. Subsequently, the likelihood estimate of the empirical distri-
                                                                         bution of the SNP number per read can be calculated based on the
                                                                         multinomial probability mass function,
Quality Controls and RADSeq Assembly
The demultiplexed paired-end sequence reads were processed with
                                                                                                                    l

SOAPnuke2 to discard low-quality reads and unwanted sequences                                                         qi xi
                                                                                                 L (x | q) = r! ·
(Chen et al. 2018). First, reads with correct barcodes were retained                                                      xi !
                                                                                                                    i=0
exclusively and their barcodes were trimmed. Reads without correct
restriction enzyme cleavage sites were subsequently removed from         where xi is the empirical number of reads with i SNPs observed,
the dataset. Low-quality reads were also removed if the proportions      qi is the binomial probability of observing i SNPs on an l-bp long
of base pairs with Phred quality scores lower than 15 were >40%          read (l = 87 in this study), and r is the total number of reads (i.e.,
or the proportions of unidentified base pairs were >10%. Next, we

                                                                                                                                                   Downloaded from https://academic.oup.com/jhered/article/112/2/192/6155757 by guest on 02 November 2021
                                                                         ∑xi). For each given pair of (M, n), we randomly sampled 100 000
removed the restriction enzyme cleavage sites from all remaining         reads 20 times from the assembly without replacement. The pair of
reads. The remaining forward reads were trimmed to 87 bp to ac-          (M, n) that gives the highest likelihood estimate is the parameter set
commodate the differences in sequence lengths caused by barcode          that fits best to the empirical distribution of SNP number across all
trimmings and restriction enzyme cleavage site removals.                 forward reads. In addition, Kullback–Leibler (KL) divergences were
    We performed paired-end RAD sequence assemblies using Stacks         also calculated to measure the similarity between the empirical dis-
2.2 (Catchen et al. 2011). This software consists of several core        tribution of the number of SNPs per read and the theoretical bino-
programs. The first program, ustacks, established “stacks,” the piles    mial distribution (Kullback and Leibler 1951). We also constructed
of reads with exact matches that serve as putative alleles, for each     an alternative likelihood estimator based on Watterson’s theoretical
individual by aligning the raw forward reads with each other. The        distribution of segregating sites under one panmictic population
minimum number of reads (read depth) that is required to start a         (Watterson 1975). All the parameter optimization procedures were
stack was governed by m. Next, similar stacks were aligned against       carried out using our custom Python scripts (available on request).
each other within each individual to form putative loci (pairs of pu-        Since SNPs with excessive heterozygosity across all individuals
tative alleles) if the number of mismatches between them was ≤ M         can result from misaligning reads of paralogous or repetitive loci,
(maximum number of allowed mismatches). The second program,              we applied the Hardy-Weinberg equilibrium (HWE) test to exclude
cstacks, was performed to align the putative loci across all 7 indi-     the assembled reads or SNPs that showed significant deviations from
viduals to synthesize a catalog with the maximum number of al-           HWE (P < 0.05). Two types of heterozygosity filters were applied
lowed mismatches defined by the parameter n. The putative loci           to the dataset to generate datasets for population genetics analyses
from all individuals were subsequently matched against the catalog       that rely on accurate nucleotide diversity estimates or only genetic-
to identify the unique loci combinations on each RAD locus across        ally unlinked SNPs. The heterozygosity filters were conducted using
all individuals; this procedure was conducted using the sstacks pro-     the R package HardyWeinberg (Graffelman and Camarena 2008;
gram. Thereafter, the reads from both ends were merged into contigs      Graffelman 2015).
using the gstacks program. Lastly, the genetic variants and assembled
contigs were called using the populations program. We executed the
                                                                         Nucleotide Diversity and Inbreeding Coefficient
above programs using a built-in pipeline, denovo_maps.pl, with dif-
ferent sets of m, M, and n; secondary read incorporations were dis-
                                                                         Estimations
abled and the deleveraging algorithm was enabled. Only sites that        We estimated genome-wide nucleotide diversity based on both pair-
were sequenced in all individuals were assembled to prevent sys-         wise differences and Watterson’s estimator for both P. d. formosus
tematic biases on population genetics statistics, including estimates    and P. d. inopinatus. For each estimate, the per-site nucleotide diver-
of nucleotide diversity and Tajima’s D (Arnold et al. 2013; Gautier      sity was calculated for each RAD locus. The mean and standard devi-
et al. 2013). RAD loci without correct matches with reverse reads        ation were then computed based on its empirical distribution across
were omitted from the remaining studies.                                 all RAD loci. Tajima’s D was also calculated using the R package
    Stacks was run multiple times to search for the optimal set of       pegas 0.12 (Paradis 2010) with parametric P-values constructed
assembled parameters (m, M, n). First, since m controls the starting     from the beta distribution (Tajima 1989a). Fixation indices were
read depth of each stack, a higher m is expected to give higher sample   calculated using GENEPOP 1.1.7 implemented in R (Raymond
coverage while resulting in fewer assembled loci and SNPs; this trend    and Rousset 1995; Rousset 2008). For comparison, we also com-
diminishes with increased m (Paris et al. 2017). We therefore plotted    puted the above summary statistics for the RADSeq data of 3 wide-
the distribution of sample coverage against different values of m        spread bat species (Lasiurus cinereus, L. borealis, and Lasionycteris
(while fixing M and n to 3). An optimal value of m was chosen if its     noctivagans) that were obtained from Sovic et al. (2016).
corresponding value was close to the plateau of sample coverage on
the inward curve. Next, we searched for the optimal values of M and      Genetic Structure Detection
n while fixing m to the previously determined value. We took a likeli-   We next performed both principal component analysis (PCA, con-
hood framework to search for the optimal M and n by incorporating        ducted using PLINK 1.9; Chang et al. 2015; Purcell and Chang
the observed SNP density estimated from the data. For each given         2020) and STRUCTURE 2.3.4 (Pritchard et al. 2000) to detect
pair of (M, n), the empirical per-site SNP density was calculated by     the genetic structure between P. d. formosus and P. d. inopinatus.
the total number of SNPs in all forward reads divided by the total       A subset of SNPs was generated by randomly selecting one SNP
number of base pairs of all forward reads. The distribution of the       from each locus to assure that these SNPs are genetically unlinked.
number of SNPs on each sequence read can be constructed using a          For PCA, a Kruskal-Wallis H test was further performed on the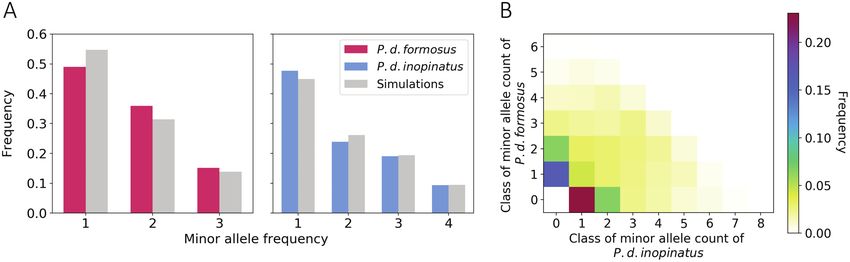
196                                                                                             Journal of Heredity, 2021, Vol. 112, No. 2

coordinates of the first principal component to detect the signifi-      obtained from each individual ranged from 0.91 Gb to 6.90 Gb
cance between 2 assigned groups. For STRUCTURE analysis, the             with an average of 4.82 Gb. The average number of clean reads
data-collecting period was set to 50 000 and the burn-in period          per genome was 47.28 million (M), ranging from 7.76 to 68.82
was set to 10 000, 30 000, 40 000, 40 000, and 40 000 for K = 1,         M. The detailed information for each individual genome is given
2, 3, 4, and 5, respectively, where K is the putative number of an-      in Supplementary Table S1. To determine the most suitable as-
cestral populations; these values were determined by observing the       sembly parameters in Stacks, we first plotted the sample coverage
trend of several summary statistics throughout the iterations of         against the parameter m (the minimum depth required to start a
the program (Pritchard et al. 2000). The best-fit K value was deter-     stack) as shown in Figure 2A. The sample coverage increased with
mined using the ΔK estimator (Evanno et al. 2005) and the built-in       m but gradually reached a plateau. In contrast, the total number
posterior probability of STRUCTURE. To calculate the ΔK esti-            of polymorphic loci and monomorphic loci decreased considerably
mator, we performed 20 repetitions for each given K value. We            with increased m (Figure 2B). Determining the suitable m value ap-
summarized the ancestral components of these 20 repetitions using        peared to become a trade-off between the coverage and the number
CLUMPP 1.1.2 (Jakobsson and Rosenberg 2007), for which the               of assembled loci. We set m = 3 to be our assembly parameter since

                                                                                                                                                   Downloaded from https://academic.oup.com/jhered/article/112/2/192/6155757 by guest on 02 November 2021
FullSearch algorithm was applied for K = 1 and 2 while the Greedy        its corresponding value on the curve begins to show a slower incre-
algorithm was applied for K = 3, 4, and 5. In addition, we also          ment of sample coverage. As a result, the average number of sample
quantified the degree of population differentiation between the 2        coverages among the 7 individuals was 38.49 (range 13.10–51.83;
populations using the ΦST estimator of the Analysis of Molecular         see also Supplementary Table S1) and the number of polymorphic
Variance (AMOVA) implemented in pegas 0.12. The P-value of the           loci was ~28 K (Supplementary Figure S1). Figure 2C shows the plot
ΦST estimator was calculated from 10 000 permutations.                   of log-likelihood estimates of the empirical distribution of SNPs per
                                                                         read based on different sets of (M, n) given m = 3. The highest likeli-
Demographic History Inference                                            hood estimate was found to be at M = 1 and n = 1 within the range
To infer the demographic history of the 2 P. dasymallus populations,     of M = 1–7 where n = M or M+1. A similar result was also observed
we compared the folded site frequency spectrum (fSFS) for each           using the KL divergence method: the similarity between the empir-
population with the simulated fSFS under the steady-state neutral        ical distribution of SNPs per read and the theoretical distribution
model. The simulated fSFS of an idealized Wright-Fisher population       based on the estimated SNP density also appeared to be the highest
was constructed from 1000 simulations generated by the coalescent        (i.e., the lowest value of KL divergence) at M = 1 and n = 1 (Figure
simulator MSMS with segregating sites set to the observed values in      2C). We also computed the log-likelihood estimates of the empir-
each population (Ewing and Hermisson 2010). We further applied           ical distribution of SNPs per read based on Watterson’s theoretical
fastsimcoal2 2.6 to infer the demographic history of P. d. formosus      distribution of segregating site, which resulted in the same optimal
and P. d. inopinatus based on the joint fSFS of these 2 populations      parameter set (Supplementary Figure S2). Consequently, the param-
(Excoffier and Foll 2011; Excoffier et al. 2013). A number of possible   eters for Stacks were set to M = 1, n = 1, and m = 3 for contig as-
demographic models were tested. These models begin with the sim-         semblies and SNP callings. Based on the above assembly parameters,
plest model (one population of constant population size over time),      we obtained 188,588 RAD loci for a total of 43,675,221 bp with
then toward several more realistic models to which population splits,    a mean locus length of 231.6 ± 36.7 bp (Figure 2D). Among them,
gene flow between split populations, and population size changes         32,935 SNPs were identified in 28,047 polymorphic RAD loci after
over time in the progeny populations were introduced. For a given        a series of quality control steps. The workflow of sequence assem-
model, the simulated joint fSFS was generated based on 100 000 co-       blies and quality controls is detailed in Supplementary Figure S1.
alescent simulations assuming the observed total sequence length.
The maximum number of cycles of the conditional maximization al-         Estimating Levels of Nucleotide Diversity,
gorithm (ECM) was set to 40 to search for the estimates that best-fit    Inbreeding, and Genetic Structure
the observed joint fSFS. This process was repeated 100 times and the     The Watterson’s estimator (θW) and the pairwise differences (θπ)
estimate with highest likelihood was selected to represent the model.    were estimated for P. d. formosus, P. d. inopinatus, and the pooled
To determine the model that fits our data best, all tested models were   population using 32,935 SNPs and 188,588 loci (Table 1). The es-
compared with each other through the Akaike Information Criterion        timates of Watterson’s θW appeared to be almost the same but con-
(AIC; Akaike 1974), calculated using a custom Python script. For         siderably low in both populations (2.14 × 10⁻⁴ and 2.13 × 10⁻⁴ per
the best-fit model, we performed 100 parametric bootstraps to con-       site for the formosus and inopinatus populations, respectively).
struct the confidence intervals (CIs) of each estimated demographic      Similar θπ values were also observed in the formosus (2.17 × 10⁻⁴)
parameter of interest. The mutation rate (μ) was set to 2.5 × 10⁻⁸       and inopinatus (2.09 × 10⁻⁴) populations. Both θW and θπ estimates
per generation per nucleotide site, which was estimated based on         increased slightly when the 2 populations were pooled (2.39×10⁻⁴
human genomic data (Nachman and Crowell 2000). We also re-               and 2.27 × 10⁻⁴, respectively). We further computed Tajima’s D for
peated all simulations by assuming a different mutation rate of 2.0 ×    the 2 populations separately. Although different signs of Tajima’s D
10–9 according to an estimate from a few introns in vespertilionid       were observed in the formosus (0.11) and inopinatus (−0.12) popu-
and miniopterid bats (Ray et al. 2008). The detailed workflow of all     lations, both estimates did not deviate from neutrality (P = 0.88 and
analyses can be found in Supplementary Figure S1.                        0.95, respectively). To estimate the level of inbreeding, we computed
                                                                         the fixation index (F) based on genetically unlinked SNPs (Table 1).
                                                                         Positive F values were observed in both populations in which the
Results
                                                                         average F of the formosus (0.12) was slightly higher than that of the
Determining the Optimal Parameters for RADSeq                            inopinatus (0.10).
Assembly                                                                     To evaluate the genetic structure between these 2 populations, we
We have successfully obtained the genomic sequence reads for all         performed PCA among all 7 individuals. As a result, the formosus and
7 sampled individuals using ddRADSeq. The total clean base pairs         inopinatus samples were clearly divided into 2 groups at PC1 (P = 0.03
Journal of Heredity, 2021, Vol. 112, No. 2 197
Downloaded from https://academic.oup.com/jhered/article/112/2/192/6155757 by guest on 02 November 2021
Figure 2. Determining the optimal assembly parameters of Stacks and the length distribution of restriction-site associated DNA (RAD) loci. (A) The sample
coverages under different values of m (the minimum read depth required to start a stack) with M (the maximum mismatches allowed within each individual)
and n (the maximum mismatches allowed between each pair of individuals) fixed to 3. The box plot summarizes the coverage of all 7 individuals while the
dash indicates the mean value. (B) The number of polymorphic loci and monomorphic loci under different values of m given M = n = 3. (C) The multinomial log-
likelihoods and KL divergences under various (M, n) values with m set to 3. (D) The distribution of the lengths of each assembled RAD locus without unidentified
nucleotides under the optimal assembly parameters (m = 3 and M = n = 1).
Table 1. Estimates of nucleotide diversity, fixation index, and Tajima’s D of 2 subspecies of Pteropus dasymallus
Group # Samples # SNPs Mean θW Mean θπ Mean F D
P. d. formosus 3 21106 2.14 × 10⁻⁴ 2.17 × 10⁻⁴ 0.12 0.11
P. d. inopinatus 4 24020 2.13 × 10⁻⁴ 2.09 × 10⁻⁴ 0.10 −0.12
All 7 32935 2.39 × 10⁻⁴ 2.27 × 10⁻⁴ 0.16 −0.21
θW, Watterson’s estimator; θπ, pairwise difference; F, fixation index; D, Tajima’s D.
using Kruskal-Wallis H test), while PC2 and PC3 reflected only the differences between them (Figure 4A). The fSFS of P. d. formosus pos-
variances of within-group individuals (Figure 3A and Supplementary sessed excessive intermediate-frequency alleles compared to the simu-
Figure S3). We also conducted STRUCTURE, a model-based analysis lated fSFS under the neutral model of constant population size over
for population substructure detection among these individuals and time (P = 10–62 using chi-square goodness of fit test), which is con-
Figure 3B illustrates the result at K = 3, which was the best-fit number sistent with the population decline that has been observed in the field
of putative ancestral populations (Supplementary Figure S4A and B). during the 1970s. In contrast, the fSFS of P. d. inopinatus carried ex-
Comparable to the result of PCA, explicit genetic structure was de- cessive low-frequency alleles in comparison with the simulated steady-
tected between the formosus and inopinatus populations in which state fSFS (P = 10–19), which is suggestive of a population expansion.
distinct patterns of ancestral components were observed between Since these 2 populations share a common ancestor, we further
them. In contrast, there was no evident genetic structure within each constructed a joint fSFS for our samples to infer their demographic
population. Similar patterns were also observed when STRUCTURE history, time of divergence, and the level of gene flow between popu-
was performed at K = 2–5 (Supplementary Figure S4C). The degree lations using fastsimcoal2 (Figure 4B). The joint fSFS separates
of genetic structure between these 2 populations was estimated to be private and shared variants of the 2 populations and increases the
0.178 based on the test statistic ΦST (AMOVA), revealing a consider- number of frequency classes. Consequently, the statistical power en-
able proportion of between-population variance among these indi- hances considerably for detecting population demography and can
viduals (P = 0.03; Table 2). thus be used to infer complex demographic events such as popula-
tion divergence and admixture. We performed fastsimcoal2 likeli-
hood estimations on a series of demographic models listed in Table
Inferring Demographic History 3 assuming μ = 2.5 × 10⁻⁸ per site per generation. To determine the
To uncover their demographic history, we first estimated the fSFS of best model, the Akaike weights (wi) of these models were calculated
P. d. formosus and P. d. inopinatus separately and detected significant and, as a result, Model F was the model that best-fit the observed198 Journal of Heredity, 2021, Vol. 112, No. 2
Downloaded from https://academic.oup.com/jhered/article/112/2/192/6155757 by guest on 02 November 2021
Figure 3. Principal component analysis (PCA) and STRUCTURE analysis for detecting genetic structure between Pteropus dasymallus formosus and
P. d. inopinatus. (A) PCA was performed with 3 P. d. formosus and 4 P. d. inopinatus samples. (B) STRUCTURE result of the 7 P. dasymallus samples by assuming
K = 3 where K is the number of ancestral populations. Both PCA and STRUCTURE were performed based on a total of 28,074 genetically unlinked SNPs from
the 7 samples. See online version for full colors.
Table 2. Analysis of molecular variance (AMOVA) results of Pteropus dasymallus formosus and Pteropus dasymallus inopinatus
df Sum of squares Variance components Variance % P-value
Between populations 1 15512.5 1929.2 17.8 0.03
Within populations 5 44490.1 8898.0 82.2
Total 6 60002.6 10827.2
joint fSFS among all models (wi ≈ 1.0), whereas the other models 2–300 times older, respectively, than those under the assumption of
fit the data significantly worse (wi ≤ 1.1×10⁻¹⁹; see Table 3). Model μ = 2.5 × 10⁻⁸ (Supplementary Table S3).
F assumed an ancestral population split into 2 progeny populations
(i.e., formosus and inopinatus) and introduced parameters that de-
scribe a recent population decline in P. d. formosus and a population Discussion
expansion in P. d. inopinatus, as well as gene flow between these
2 progeny populations (Figure 5A). Under Model F, the maximum Low Level of Genetic Diversity and High Degree of
likelihood estimate (MLE) of the ancestral effective population size Inbreeding in P. d. formosu and P. d. inopinatus
(Na) of the formosus and inopinatus populations was estimated to In this study, we have successfully applied ddRADSeq to uncover
be as large as 9,468 (Table 4). The effective population sizes dropped genetic variants from 3 P. d. formosus and 4 P. d. inopinatus indi-
to 2324 and 2110 for formosus (Nf.a) and inopinatu (Ni.a), respect- viduals. Given that both subspecies are protected by local conserva-
ively, after they split. The split time was dated to be 8518 gener- tion laws, it is difficult to obtain any new sample from the natural
ations ago. However, the formosus population experienced a very population. Nonetheless, we were able to obtain a sufficiently large
recent and severe decline 4 generations ago (tf.de), which led to its number of SNPs, which allowed us to obtain and compare several
low current population size (Nf) of 223. In contrast, the inopinatus key population genetics estimates between these 2 closely related
population went through a population expansion 441 generations populations. A very low level of nucleotide diversity (θW = 2.14 × 10–
ago (ti.ex) and the current effective population size (Ni) was estimated 4
per site) was detected in the formosus population (Table 1), which
to be 9547. The level of gene flow between the 2 populations was is ~10-fold lower than the mean θW of Lasiurus cinereus (2.57×10⁻³)
limited. The estimated migration rate from the inopinatus popula- and Lasiurus borealis (2.14 × 10⁻³), 2 widespread continental vesper-
tion to the formosus population was 1.0×10⁻³ (per generation) and tilionid bats in America (Sovic et al. 2016; also see Supplementary
that of the reverse direction was 2.7×10⁻⁴. The prior search ranges Table S4). Surprisingly, P. d. inopinatus, a larger population than
for these MLEs are provided in Supplementary Table S2. We further P. d. formosus, also harbors a similarly low level of nucleotide diver-
constructed the bootstrap distributions (Figure 5B) and computed sity (θW = 2.13 × 10⁻⁴). Tajima (1989b) pointed out that changes in
the 95% CIs for these parameters (Table 4). nucleotide polymorphism estimates are slow in response to popula-
We repeated all the simulations for inferring the demographic tion fluctuations under small sample sizes. The similarity in nucleo-
history with a different mutation rate (μ = 2.0 × 10⁻⁹) that was es- tide diversity between these 2 populations can be partially attributed
timated from 4 introns in vespertilionid and miniopterid bats (Ray to the small sample sizes in both populations. With a small number
et al. 2008), and found that Model F remained the fittest demo- of sample sizes, genetic variants with intermediate allele frequency
graphic scenario among all models tested. However, by assuming in a population are more likely to be sampled than those with low
a lower mutation rate, the estimated effective population sizes and allele frequency. Therefore, the nucleotide diversity estimates are less
dates of demographic events appeared to be 6–66 times larger and sensitive for detecting alteration in nucleotide diversity caused byJournal of Heredity, 2021, Vol. 112, No. 2 199
Downloaded from https://academic.oup.com/jhered/article/112/2/192/6155757 by guest on 02 November 2021
Figure 4. Folded site frequency spectra (fSFS) of Pteropus dasymallus formosus and P. d. inopinatus. (A) The fSFS of 3 P. d. formosus and 4 P. d. inopinatus
were inferred separately based on 21,106 and 24,020 SNPs, respectively. Both spectra were compared to the fSFS of 1000 coalescent simulations with constant
population size and the identical segregating sites of the observed fSFS. Chi-square goodness of fit test was performed on each fSFS; both spectra deviate
from the steady-state neutral model (P = 10–62 for P. d. formosus and P = 10–19 for P. d. inopinatus). (B) The joint fSFS of P. d. formosus and P. d. inopinatus were
constructed from 32,935 SNPs. The heatmap indicates the proportions of SNP counts across different joint frequency classes. See online version for full colors.
Table 3. Demographic model comparison of Pteropus dasymallus formosus and Pteropus dasymallus inopinatus
A B C D E F G H
Model illustration
Max logL −159797 −158076 −157991 −157982 −157991 −157936 −157984 −157982
Parameters 1 4 6 8 8 10 8 10
wi (AIC) ≈ 0.0 6.3 × 10–59 7.3 × 10⁻²³ 1.1 × 10⁻¹⁹ 1.9 × 10⁻²³ ≈ 1.0 2.1 × 10⁻²⁰ 1.9 × 10⁻²⁰
Model A illustrates a population with constant size from which samples of P. d. formosus and P. d. inopinatus were drawn randomly. The rest of models describe
one ancestral population split into 2 progeny populations (“f” represents P. d. formosus and “i” represents P. d. inopinatus). Models C–F and H introduce gene flow
(indicated by arrows) between the 2 progeny populations. Models D–H allow population size changes in at least one progeny population.
low-frequency alleles owing to recent change of population sizes. In is based only on a small sample size number. Therefore, additional
this study, we indeed detected signatures of recent population fluc- samples would be needed to confirm our estimates.
tuations in both populations based on the joint fSFS from which the
estimated population sizes are similar in both populations prior to
their recent demographic changes. Therefore, the estimates of nu- Distinct Recent Demographic History in
cleotide diversity could differ considerably between P. d. formosus P. d. formosus and P. d. inopinatus
and P. d. inopinatus with a larger sample size. We inferred the demographic history based on the joint fSFS of
Nucleotide diversity could be underestimated using ddRADSeq P. d. formosus and P. d. inopinatus by comparing the likelihood es-
due to allele dropout (ADO), that is, restriction enzymes fail to timates among several candidate models. The best-fit demographic
cleave their recognition sites because of mutations (Arnold et al. model appeared to be the population split model that assumes a recent
2013; Gautier et al. 2013; Cariou et al. 2016). However, the effects population decline in the formosus and a recent population expansion
of ADO are only significant when the sequence divergence is >2%, in the inopinatus irrespective of the underlying assumption of muta-
and can be mitigated by the use of complete sampling of genetic tion rates (Table 3). It is important to point out that MLEs for most
variants (Cariou et al. 2016). Therefore, our estimates of nucleotide parameters vary considerably with different mutation rates assumed in
diversity were most likely little affected by ADO. the model. Particularly, the current population size of P. d. formosus
Our estimated fixation index (F) revealed a considerable amount (Nf) becomes as large as 14 719 by assuming μ = 2.0×10⁻⁹, whereas Nf
of homozygosity departing from HWE in both populations (0.12 is only 223 when assuming μ = 2.5 × 10⁻⁸ (Table 4 and Supplementary
for the formosus and 0.10 for the inopinatus). Based on the results Table S3). The assumed mutation rate of 2.0 × 10⁻⁹ was based on
of PCA and STRUCTURE, we did not detect any obvious genetic the study of only 4 introns in several species of vespertilionid and
structure within each population (Figure 3). Therefore, the observed miniopterid bats (Ray et al. 2008), while the mutation rate of 2.5 × 10⁻⁸
excessive homozygosity in each population can be better explained was estimated from many pseudogenes across multiple chromosomes
as the outcome of inbreeding. Insular populations are known to be of human genomes. Given that estimates of the nuclear mutation rates
more inbred (and thus more prone to extinction) than mainland in Pteropodidae species are currently unavailable, we are slightly in
populations due to their smaller population sizes and founder effect favor of reporting the MLEs of demographic parameters under the
(Frankham 2008). In the present study, we detected rather high levels assumption of μ = 2.5 × 10⁻⁸ due to its genome-wide approach. We
of inbreeding in both P. d. formosus and P. d. inopinatus, suggesting consider that this higher mutation rate is a conservative approach for
that both populations might be vulnerable to the risk of inbreeding estimating the population size, which is also in good agreement with
depression. However, this concern of possible inbreeding depression the observed population status of P. d. formosus in the field.200 Journal of Heredity, 2021, Vol. 112, No. 2
Table 4. Maximum likelihood estimates of demographic param-
eters of Pteropus dasymallus formosus and Pteropus dasymallus
inopinatus based on Model F
Parameter MLE 95% CI
Na 9468 (6014, 13599)
Nf 223 (201, 266)
Nf.a 2324 (2107, 2427)
Ni 9547 (8118, 11405)
Ni.a 2110 (2025, 2381)
tdiv 8518 (7823, 16480)
tf.de 4 (1, 5)
ti.ex 441 (369, 493)
mf→ i 2.7×10⁻⁴ (2.2 × 10⁻⁴, 3.0 × 10⁻⁴)
Downloaded from https://academic.oup.com/jhered/article/112/2/192/6155757 by guest on 02 November 2021
m i→ f 1.0×10⁻³ (8.6 × 10⁻⁴, 1.0 × 10⁻³)
ago, which would be 28 years ago assuming a generation time of
7 years (Fox et al. 2008; Tidemann and Nelson 2011; Vincenot et al.
2017). The 95% CI spans from 7 years ago to 35 years ago, sup-
porting that the event likely occurred very recently (see Figure 5B
and Table 4). The magnitude of the decline was estimated to be ~10-
fold, dropping from 2324 (Nf.a) to 223 (Nf) individuals. Therefore,
it is more likely that the Green Island population did suffer from a
severe population decline rather than habitat abandonment based
on our findings. In contrast, we detected that P. d. inopinatus on
Okinawa Island may have experienced a recent population expan-
sion from 2,110 (Ni) to 9,547 (Ni.a) (a ~4.5-fold increase) based on
the MLEs of the observed fSFS. The time of this population expan-
sion was estimated to be 441 generations ago (~3 kya).
Our estimates also suggest that these 2 populations diverged
around 8,518 generations ago (~60 kya) with a 95% CI spanning
from ~55 kya to ~115 kya in the late Pleistocene (Figure 5 and Table
4). During that time, the widening Kerama Gap between Okinawa
Island and Yaeyama Islands likely served as a geographic barrier to
prevent gene flow between these 2 populations (Kizaki and Oshiro
Figure 5. The best-fit demographic model and estimates of demographic
parameters. (A) Demographic history and estimates of demographic 1977; Ota 1998). Our results are compatible with previous studies
parameters were inferred based on the observed joint fSFS of Pteropus of the divergence of amphibians, reptiles, and the elegant scops
dasymallus formosus and P. d. inopinatus by assuming the best-fit Model owl (Otus elegans) between the Central and Southern Ryukyus
F (Table 3) using fastsimcoal2. The maximum likelihood estimates (MLEs) (Ota 1998 2000; Hsu 2005), supporting that deep-sea channels,
of population size (N), demographic event times (t with unit of generation), such as the Kerama Gap, serve as effective geographic barriers to
and per-generation migration rate (m) are shown. Note that the times of
drive the genetic differentiation of island species, even for species
recent demographic events are not scaled to better demonstrate the changes
in the population sizes of P. d. formosus and P. d. inopinatus. (B) Bootstrap
with high migration ability like flying foxes. After the divergence of
distributions and quantiles for each demographic parameter. Parametric P. d. formosus and P. d. inopinatus, both populations suffered from
bootstraps were performed 100 times based on Model F. Their distributions population declines and had been maintained at relatively small
and 5%, 25%, 50%, 75%, and 95% quantiles are shown. The white dot population sizes for a long period of time, which might have led to
represents the MLEs of each parameter. All inferred demographic parameters their present low levels of nucleotide diversity.
are labeled as: Na = population size of the common ancestral population of
It should be noted that our inferences of demographic model
the formosus (f) and inopinatus (i); Nf.a = the ancestral population size of
the formosus; Ni.a = the ancestral population size of the inopinatus; Nf = the
and parameter estimates are based on the joint fSFS of a rela-
current population size of the formosus; Ni = the current population size of tively small number of samples (n) in both populations (2n = 6 and
the inopinatus; tdiv = the time of the divergence of the 2 population; tf.de = the 8 for P. d. formosus and P. d. inopinatus, respectively). Although
time of a recent decline in the formosus; ti.ex = the time of a recent expansion Beichman et al. (2018) noted that recent changes in population size
in the inopinatus; mf→i = migration rate from the formosus to inopinatus; are relatively difficult to capture by SFS-based methods with small
mi→f = migration rate from the inopinatus to formosus.
sample sizes, theoretical studies have shown that the configuration
of SFS is sensitive to subtle changes in population genetic parameters
Lin and Pei (1999) reported that P. d. formosus was once abun- (e.g., effective population size, Ne) and the power of detecting such
dant on Green Island (the major habitat of formosus) but could be changes in SFS depends more on the number of SNPs rather than on
barely sighted after the 1970s. However, it is unclear whether the the sample size (Akashi 1999). In the study by Akashi (1999), the
population on Green Island actually declined or this habitat was number of haplotypes used in the simulations can be as small as 5 for
simply abandoned. In this study, our best-fit demographic model sug- successfully detecting changes in SFS with 2500 nucleotide sites. By
gested a very recent population decline in the formosus population. analyzing ~30 000 SNPs, Robinson et al. (2014) also showed that a
The MLE for the time of population collapse (tf.de) is 4 generations small sample size (as low as 3 individuals) is sufficient to detect theJournal of Heredity, 2021, Vol. 112, No. 2 201
correct model of recent population decline and to accurately esti- et al. 2012). Nevertheless, our results provide strong evidence of
mate the decline time. genetic structure between the formosus and inopinatus populations
Although the small sample sizes in our study may have potentially with limited gene flow between them (Table 2). The migration rate
reduced the statistical power to distinguish between the competing from the inopinatus to formosus (mi→f = 1.0 × 10⁻³ per generation) is
demographic models (causing false negative outcomes), we found that about 3 times higher than that of the reverse direction (mf→i = 2.7 ×
the best model appears to fit significantly better than the remaining 10–4; see Figure 5 and Table 4). Similarly, by analyzing microsatellite
models (Table 3). This suggests that the effects of the underlying and mitochondrial loci, Chen et al. (2021) also suggested that the
demographic events (in both populations) on the observed SFS were formosus is genetically differentiated from the inopinatus. Therefore,
strong and, therefore, allowed us to determine the best model. Finally, based on our molecular evidence, P. d. formosus and P. d. inopinatus
the validity of our inferred model and MLEs could also suffer from perhaps should be treated as distinct ESUs and managed separately
biased samplings due to small sample sizes. While our samples in in terms of conservation. In contrast, P. d. formosus individuals from
both populations were collected from different locations and time Green Island and the eastern coast of Taiwan could be managed to-
points (Figure 1), future studies will focus on collecting more individ- gether since there is no apparent genetic structure within them.
Downloaded from https://academic.oup.com/jhered/article/112/2/192/6155757 by guest on 02 November 2021
uals from each of the 5 P. dasymallus subspecies populations. The Yaeyama flying fox (P. d. yayeyamae) inhabiting Yaeyama
Since the key parameters assumed during the RADSeq assembly Islands and Miyako Islands between Taiwan and Okinawa Island is the
could potentially bias population genetics statistics (Harvey et al. geographically closest P. dasymallus subspecies to P. d. formosus. Chen
2015; Mastretta-Yanes et al. 2015; Shafer et al. 2017), we also ex- et al. (2021) observed strong population substructure between the
plored other combinations of assembly parameter sets (m, M, n) in yayeyamae and inopinatus but nonsignificant differentiation between
Stacks, including the optimal parameters determined by the pro- the yayeyamae and formosus. Taki et al. (2020, unpublished data) de-
cedure of Paris et al. (2017). Subsequently, we repeated all coalescent tected genetic differentiations among the 3 yayeyamae populations
simulations (using fastsimcoal2) to infer the demographic history of inhabiting Yaeyama Islands: Miyako, Ishigaki-Taketomi-Kohama-
both populations. As a result, Model F remained the best-fit demo- Iriomote, and Yonaguni (from east to west). Among them, the Yonaguni
graphic scenario under the assembly parameters of m = 3, M = 2, population, which is geographically closest to Taiwan (~110 km apart),
and n = 3 (referred to as m3M2n3 hereafter; Supplementary Table showed the highest differentiation from the other 2 yayeyamae popula-
S5). Most inferred MLEs were also comparable between the 2 op- tions. Therefore, it is possible that the formosus population is also gen-
timal parameter sets with differences in the range of 0.64–2.29-fold etically distinct from the yayeyamae populations inhabiting the islands
changes (Supplementary Figure S5), except for the time of population of Miyako, Ishigaki, Taketomi, Kohana, and Iriomote. Future studies
decline in P. d. formosus (tf.de). The difference in tf.de was as large as should focus on elucidating the levels of genetic structure between P. d.
11.8-fold (tf.de = 4 and 47 for m3M1n1 and m3M2n3, respectively; formosus and these yayeyamae populations.
see Table 4 and Supplementary Tabe S2). In either case, we consider In conclusion, we have revealed critical information for the con-
that the population of P. d. formosus experienced a recent population servation of the endangered Formosan flying fox and the Orii’s flying
decline. We also tested the sensitivity of the estimates of nucleotide fox. Pteropus dasymallus formosus suffers from low genetic diver-
diversity, inbreeding coefficient, and between-populations differenti- sity and high inbreeding pressure, likely resulting from its long-term
ation (ΦST) under these 2 assembly parameter sets. These parameters small population history; the situation was exacerbated by a drastic
remained robust using different assembly parameters. The detailed and very recent population decline. Conservation acts for its popula-
results are provided in Supplementary Figures S6 and S7. tion recovery are urgently needed. Habitat should be preserved and
recovered on Green Island as well as the eastern coast of Taiwan. In
Strong Genetic Structure Between P. d. formosus contrast, P. d. inopinatus is a relatively stable population with recent
and P. d. inopinatus growth. However, the current population bears low genetic diver-
Our results from PCA and STRUCTURE analyses provided evidence sity and inbreeding pressure. Long-term monitoring for the potential
of genetic structure between the formosus and inopinatus populations adverse consequences of these genetic factors should be considered.
Outcrossing between P. d. formosus and P. d. inopinatus should be
(Figure 3). AMOVA also detected significant between-population
prevented before conducting any further studies assessing the degree
variance (Table 3). Particularly, the results of STRCUTURE showed
of outbreeding depression between these subspecies.
distinct patterns of genetic ancestries for individuals between these
2 populations, while little individual variation was observed within
each population (Figure 3B). The evidence of genetic structure re- Supplementary Material
mained robust regardless of the number of ancestral populations as-
Supplementary material is available at Journal of Heredity online.
sumed in STRUCTURE (Supplementary Figure S4C). In Figure 3B,
it is interesting to point out that, while STRUCTURE assigned only
one major ancestry to the individuals of P. d. formosus, 2 major ances- Funding
tries were assigned to all 4 individuals of P. d. inopinatus. However, This work was supported by the grants funded by the Forestry
the observed pattern of mixed ancestry in the P. d. inopinatus indi- Bureau, Council of Agriculture, Taiwan (107-9.1-SB-17(1), 108-9.1-
viduals is not necessarily the outcome of population admixture, but SB-30); and the Ministry of Science and Technology, Taiwan (MOST
may also result from shared ancestries with other populations that 107-2621-B-305-001) to WYK and partially supported by the grant
are closely related to P. d. inopinatus. Under this scenario, the pro- Academia Sinica 23-23 to SMC.
portion of mixed ancestries for a given individual genome reflects the
phylogenetic distance rather than admixture fraction of populations
(Lawson et al. 2018). To unravel the most likely demographic scen- Acknowledgments
ario resulting in the observed mixed ancestry, more samples from the We thank the Okinawa Zoo and Museum Foundation, University of the
other neighboring subspecies populations should be included and Ryukyus, Japan, and Taipei Zoo, Taiwan, for providing samples. We also
tested with methods specific for detecting admixtures (e.g., Patterson thank Dr. Tetsuo Denda for laboratory support and the technical services202 Journal of Heredity, 2021, Vol. 112, No. 2
and support provided by Dr. Tze-Tze Liu from the Genomics Center for Chen S-F, Juan C-H, Rossiter S, Kinjo T, Fukui D, Kawai K, Tsang SM,
Clinical and Biotechnological Applications of Cancer Progression Research Veluz MJ, Sakurai H, Jang-Liaw N-H, et al. 2021. Population gen-
Center, National Yang-Ming University. We acknowledge the great sup- etic structure of the insular Ryukyu flying fox, Pteropus dasymallus.
port from the National Core Facility for Biopharmaceuticals (NCFB, Biotropica. 00:1–12.
MOST 108-2319-B-492-001) and National Center for High-performance Cox PA, Elmqvist T, Pierson ED, Rainey WE. 1991. Flying foxes as strong
Computing (NCHC) of National Applied Research Laboratories interactors in South Pacific island ecosystems: a conservation hypothesis.
(NARLabs) in Taiwan for providing computational and storage resources. Conserv Biol. 5:448–454.
Finally, we are immensely grateful to the valuable comments provided by Ellstrand NC, Elam DR. 1993. Population genetic consequences of small
Prof. Shou-Hsien Li from National Taiwan Normal University, Taiwan, and population size: implications for plant conservation. Annu Rev Ecol Syst.
Drs. John Wang and Jen-Pan Huang from the Biodiversity Research Center, 24:217–242.
Academic Sinica, Taiwan. Evanno G, Regnaut S, Goudet J. 2005. Detecting the number of clusters of in-
dividuals using the software STRUCTURE: a simulation study. Mol Ecol.
14:2611–2620.
Conflict of Interest Ewing G, Hermisson J. 2010. MSMS: a coalescent simulation program
Downloaded from https://academic.oup.com/jhered/article/112/2/192/6155757 by guest on 02 November 2021
including recombination, demographic structure and selection at a single
The authors declare that there is no conflict of interest.
locus. Bioinformatics. 26:2064–2065.
Excoffier L, Dupanloup I, Huerta-Sánchez E, Sousa VC, Foll M. 2013. Ro-
Data Availability bust demographic inference from genomic and SNP data. PLoS Genet.
9:e1003905.
Raw demultiplexed sequences are deposited in NCBI Sequence Read Excoffier L, Foll M. 2011. fastsimcoal: a continuous-time coalescent simulator
Archive (SRA) with the accession number of PRJNA713511. The of genomic diversity under arbitrarily complex evolutionary scenarios.
assembled ddRADSeq loci and SNPs used in this study are avail- Bioinformatics. 27:1332–1334.
able in Dryad Digital Repository at https://doi.org/10.5061/dryad. Fox S, Luly J, Mitchell C, Maclean J, Westcott DA. 2008. Demographic indica-
msbcc2fxh. tions of decline in the spectacled flying fox (Pteropus conspicillatus) on the
Atherton Tablelands of northern Queensland. Wildl Res. 35:417.
Frankham R. 1996. Relationship of genetic variation to population size in
References wildlife. Conserv Biol. 10:1500–1508.
Akaike H. 1974. A new look at the statistical model identification. IEEE Trans Frankham R. 1997. Do island populations have less genetic variation than
Autom Control. 19:716–723. mainland populations? Heredity (Edinb). 78:311–327.
Akashi H. 1999. Inferring the fitness effects of DNA mutations from poly- Frankham R. 2005. Genetics and extinction. Biol Conserv. 126:131–140.
morphism and divergence data: statistical power to detect directional se- Frankham R. 2008. Inbreeding and extinction: island populations. Conserv
lection under stationarity and free recombination. Genetics. 151:221–238. Biol. 12:665–675.
Allendorf FW, Hohenlohe PA, Luikart G. 2010. Genomics and the future of Frankham R. 2010. Challenges and opportunities of genetic approaches to
conservation genetics. Nat Rev Genet. 11:697–709. biological conservation. Biol Conserv. 143:1919–1927.
Arnold B, Corbett-Detig RB, Hartl D, Bomblies K. 2013. RADseq underesti- Frankham R, Briscoe DA, Ballou JD. 2002. Introduction to conservation gen-
mates diversity and introduces genealogical biases due to nonrandom etics. Cambridge: Cambridge University Press.
haplotype sampling. Mol Ecol. 22:3179–3190. Frankham R, Lees K, Montgomery ME, England PR, Lowe EH, Briscoe DA.
Aziz SA, Clements GR, McConkey KR, Sritongchuay T, Pathil S, 1999. Do population size bottlenecks reduce evolutionary potential? Anim
Abu Yazid MNH, Campos-Arceiz A, Forget PM, Bumrungsri S. 2017. Conserv. 2:255–260.
Pollination by the locally endangered island flying fox (Pteropus Fujita MS and Tuttle MD. 1991. Flying foxes (Chiroptera: Pteropodidae):
hypomelanus) enhances fruit production of the economically important threatened animals of key ecological and economic importance. Conserv
durian (Durio zibethinus). Ecol Evol. 7:8670–8684. Biol. 5:455–463.
Beichman AC, Huerta-Sanchez E, Lohmueller KE. 2018. Using genomic data Funakoshi K, Osawa Y, Osawa K. 2006. Distribution of the Ryukyu flying-fox
to infer historic population dynamics of nonmodel organisms. Annu Rev (Pteropus dasymallus inopinatus) on islands adjacent to Okinawa Island,
Ecol Evol Syst. 49:433–456. with special reference to their ecology on Yoron Island. Honyuyui Kagaku
Brown VA, Brooke A, Fordyce JA, McCracken GF. 2011. Genetic analysis of (Mammalian Science) 46:29–34.
populations of the threatened bat Pteropus mariannus. Conservation Gen- Funakoshi K, Osawa Y, Osawa K. 2012. First record of the Orii’s flying-fox,
etics 12:933–941. Pteropus dasymallus inopinatus on Okinoerabu-jima Island in Kagoshima
Cariou M, Duret L, Charlat S. 2016. How and how much does RAD-seq bias Prefecture, Japan, with special reference to their inhabitation. Honyurui
genetic diversity estimates? BMC Evol Biol. 16:240. Kegaku (Mammalian Science) 52:179–184.
Catchen JM, Amores A, Hohenlohe P, Cresko W, Postlethwait JH. 2011. Funk WC, McKay JK, Hohenlohe PA, Allendorf FW. 2012. Harnessing gen-
Stacks: building and genotyping Loci de novo from short-read sequences. omics for delineating conservation units. Trends Ecol Evol. 27:489–496.
G3 (Bethesda). 1:171–182. Gautier M, Gharbi K, Cezard T, Foucaud J, Kerdelhué C, Pudlo P, Cornuet JM,
Chang CC, Chow CC, Tellier LC, Vattikuti S, Purcell SM, Lee JJ. 2015. Estoup A. 2013. The effect of RAD allele dropout on the estimation of
Second-generation PLINK: rising to the challenge of larger and richer genetic variation within and between populations. Mol Ecol. 22:3165–
datasets. GigaScience. 4:7. 3178.
Cheng H-C, Changchien L-W, Lin R-S, Yang C-H, Chang S-W. 2017. The Red Graffelman, J. 2015. Exploring diallelic genetic markers: the HardyWeinberg
List of Terrestrial Mammals of Taiwan, 2017. Taiwan: Endemic Species package. J Stat Soft. 64:1–23.
Research Institute and Forestry Bureau, Council of Agriculture, Executive Graffelman J, Camarena JM. 2008. Graphical tests for Hardy-Weinberg equi-
Yuan, Nantou. librium based on the ternary plot. Hum Hered. 65:77–84.
Chen S-F, Chen S-L, Li Z-L, Lin H-C, Chang, M.-H. 2009. A survey of terres- Harvey MG, Judy CD, Seeholzer GF, Maley JM, Graves GR, Brumfield RT.
trial vertebrates on Green Island. Journal of National Park 19:1–22. 2015. Similarity thresholds used in DNA sequence assembly from short
Chen Y, Chen Y, Shi C, Huang Z, Zhang Y, Li S, Li Y, Ye J, Yu C, Li Z, et al. reads can reduce the comparability of population histories across species.
2018. SOAPnuke: a MapReduce acceleration-supported software for in- PeerJ. 3:e895.
tegrated quality control and preprocessing of high-throughput sequencing Hsu Y-C. 2005. Molecular ecology of elegant scops owl (Otus elegans) (Doc-
data. GigaScience. 7:1–6. toral dissertation). Taipei (Taiwan): National Taiwan University.You can also read