UC Davis UC Davis Previously Published Works
←
→
Page content transcription
If your browser does not render page correctly, please read the page content below
UC Davis
UC Davis Previously Published Works

Title
Exploration of the Yield Potential of Mesoamerican Wild Common Beans From Contrasting
Eco-Geographic Regions by Nested Recombinant Inbred Populations.

Permalink
https://escholarship.org/uc/item/19c660c9

Authors
Berny Mier Y Teran, Jorge Carlos
Konzen, Enéas R
Palkovic, Antonia
et al.

Publication Date
2020

DOI
10.3389/fpls.2020.00346

Peer reviewed

 eScholarship.org                            Powered by the California Digital Library
                                                             University of California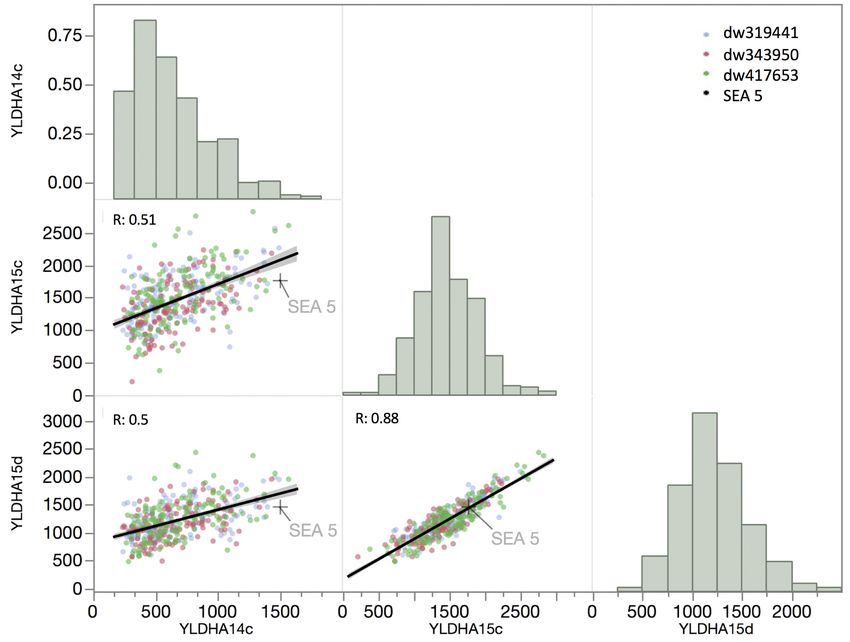
ORIGINAL RESEARCH
                                                                                                                                                   published: 03 April 2020
                                                                                                                                             doi: 10.3389/fpls.2020.00346

                                             Exploration of the Yield Potential of
                                             Mesoamerican Wild Common Beans
                          Edited by:
                         Petr Smıkal,
                                             From Contrasting Eco-Geographic
           Palackı University, Czechia       Regions by Nested Recombinant
                       Reviewed by:
                       Kirstin E. Bett,
 University of Saskatchewan, Canada
                                             Inbred Populations
                     Juan M. Osorno,
                                             Jorge Carlos Berny Mier y Teran 1† , Enéas R. Konzen 2†‡ , Antonia Palkovic 1 , Siu M. Tsai 2
       North Dakota State University,
                        United States
                                             and Paul Gepts 1* †
                  *Correspondence:           1
                                               Department of Plant Sciences, University of California, Davis, Davis, CA, United States, 2 Cell and Molecular Biology
                          Paul Gepts         Laboratory, Centro de Energia Nuclear na Agricultura, Universidade de São Paulo, Piracicaba, Brazil
                 plgepts@ucdavis.edu
                           † ORCID:
                                             Genetic analyses and utilization of wild genetic variation for crop improvement in
      Jorge Carlos Berny Mier y Teran
     orcid.org/0000-0003-3709-9131           common bean (Phaseolus vulgaris L.) have been hampered by yield evaluation
                    Enéas R. Konzen          difficulties, identification of advantageous variation, and linkage drag. The lack of
     orcid.org/0000-0001-5176-7410
                          Paul Gepts         adaptation to cultivation conditions and the existence of highly structured populations
     orcid.org/0000-0002-1056-4665           make association mapping of diversity panels not optimal. Joint linkage mapping
                  † Presentaddress:          of nested populations avoids the later constraint, while populations crossed with a
                  Enéas R. Konzen,
                                             common domesticated parent allow the evaluation of wild variation within a more
 Universidade Federal do Rio Grande
 do Sul, Campus Litoral Norte, Imbeì,        adapted background. Three domesticated by wild backcrossed-inbred-line populations
                                Brazil       (BC1 S4 ) were developed using three wild accessions representing the full range of
                   Specialty section:
                                             rainfall of the Mesoamerican wild bean distribution crossed to the elite drought tolerant
         This article was submitted to       domesticated parent SEA 5. These populations were evaluated under field conditions
                       Plant Breeding,       in three environments, two fully irrigated trials in two seasons and a simulated terminal
               a section of the journal
            Frontiers in Plant Science       drought in the second season. The goal was to test if these populations responded
         Received: 31 October 2019           differently to drought stress and contained progenies with higher yield than SEA 5, not
          Accepted: 09 March 2020            only under drought but also under water-watered conditions. Results revealed that the
           Published: 03 April 2020
                                             two populations derived from wild parents of the lower rainfall regions produced lines
                             Citation:
                Berny Mier y Teran JC,
                                             with higher yield compared to the domesticated parent in the three environments, i.e.,
  Konzen ER, Palkovic A, Tsai SM and         both in the drought-stressed environment and in the well-watered treatments. Several
     Gepts P (2020) Exploration of the       progeny lines produced yields, which on average over the three environments were 20%
 Yield Potential of Mesoamerican Wild
    Common Beans From Contrasting            higher than the SEA 5 yield. Twenty QTLs for yield were identified in 13 unique regions
  Eco-Geographic Regions by Nested           on eight of the 11 chromosomes of common bean. Five of these regions showed at least
     Recombinant Inbred Populations.
              Front. Plant Sci. 11:346.
                                             one wild allele that increased yield over the domesticated parent. The variation explained
        doi: 10.3389/fpls.2020.00346         by these QTLs ranged from 0.6 to 5.4% of the total variation and the additive effects

Frontiers in Plant Science | www.frontiersin.org                                     1                                                 April 2020 | Volume 11 | Article 346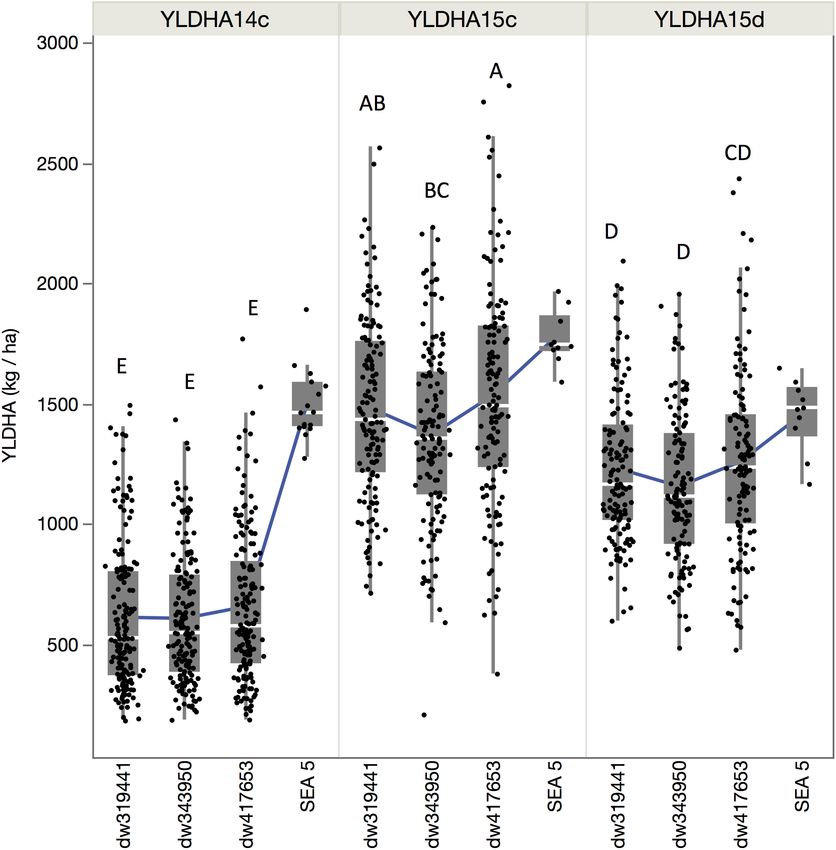
Berny Mier y Teran et al.                                                                                          Yield Increase Deploying Wild Variation

                                             ranged from −164 to 277 kg ha−1 , with evidence suggesting allelic series for some
                                             QTLs. Our results underscore the potential of wild variation, especially from drought-
                                             stressed regions, for bean crop improvement as well the identification of regions for
                                             efficient marker-assisted introgression.
                                             Keywords: common bean, crop wild relative, eco-geographic adaptation, nested backcrossed inbred
                                             populations, quantitative trait loci, yield

INTRODUCTION                                                                   shape of seeds and plant architecture are highly polygenic and
                                                                               dispersed throughout the genome (Park et al., 2000; McClean
Among pulses, common bean (Phaseolus vulgaris L.; 2n = 2x = 22)                et al., 2002; Checa and Blair, 2008; Schmutz et al., 2014).
plays an important nutritional and economical role (Broughton                  Introgressions between market classes or gene pools have
et al., 2003; Gepts et al., 2008). The yields of pulses are usually            focused mostly on transferring disease resistance, modifying
lower than those of cereals, mainly because their production                   growth habit, and introducing drought resistance (Kelly, 2001;
is located in more marginal cultivation niches, produce more                   Acosta-Gallegos et al., 2007; Beebe, 2012; Porch et al., 2013;
energy-dense seeds and the cost of association with nitrogen                   Dohle et al., 2019).
fixing rhizobia (Sinclair and Vadez, 2012). Production is also                     The use of wild variation has been even more limited.
constrained by biotic and abiotic factors, drought being one of                Wild variation has been identified as a source of resistance
the main causes of yield reduction and crop failure in beans                   to bruchids (Kornegay et al., 1993; Osborn et al., 2003,
(Singh, 2001; Beebe et al., 2013; Ramirez-Cabral et al., 2016).                2006), common bacterial blight (Beaver et al., 2012), web
Furthermore, drought severity is likely to increase due to the                 blight (Beaver et al., 2012) and white mold (Mkwaila et al.,
effects of climate change (Prudhomme et al., 2014). Increasing                 2011). However, it is possible that beneficial wild variation
crop yield and resilience is an essential goal of crop breeding and            for highly quantitative important traits, like grain yield and
cultivar development, as well as a direct advantage to farmers                 drought adaptation, is not present the domesticated forms due
and, ultimately, to consumers (Kissoudis et al., 2016). Several                to early genetic bottlenecks (Gepts et al., 1986; Tanksley and
strategies to improve yield include maximizing nitrogen fixation,              McCouch, 1997; Acosta-Gallegos et al., 2007). For example,
photosynthesis and partitioning to grain, as well as minimizing                within the Mesoamerican gene pool, a single domestication
water deficit impacts (Monteith and Moss, 2006; Zhu et al., 2010;              event originated in only one of the three genetically and
Sinclair and Vadez, 2012).                                                     geographically distinct groups of wild common beans (Kwak
    Common bean is one of the five domesticated species among                  et al., 2009; Ariani et al., 2018). Although domesticated forms
∼80 wild Phaseolus species, all originating in the American                    expanded to areas of those non-domesticated, wild groups,
continent (Freytag and Debouck, 2002; Delgado-Salinas et al.,                  and can outcross with the wild relatives, gene flow has been
2006). Wild common bean originated in Mexico and was                           found highly asymmetrical, introgressing more regions from the
dispersed by at least two long-distance movements to Ecuador                   domesticated to the wild types (Papa and Gepts, 2003). Therefore,
and northern Peru (some 500,000 years ago) and the southern                    diversity unique to the non-domesticated groups might not be
Andes (southern Peru, Bolivia, and northwestern Argentina;                     present in the domesticates. This is supported by a strong genetic
some 100,000 years ago) leading to two additional gene pools                   diversity bottleneck, especially during the Mesoamerican bean
in the Andes (Bitocchi et al., 2012; Rendón-Anaya et al., 2017;                domestication (Gepts et al., 1986; Sonnante et al., 1994; Schmutz
Ariani et al., 2018; Gepts, 2019). Common bean was domesticated                et al., 2014). Previous efforts in genetic analyses in common bean
independently within two of the three gene pools (Southern                     using wild by domesticated crosses include: (a) two populations
Andes and Mesoamerica), followed by divergence into six                        with the same Andean domesticated cultivar (ICA Cerinza)
genetically distinct races (Kwak and Gepts, 2009). Mesoamerican                crossed to a wild type from Colombia (Blair et al., 2006) and
beans were presumably domesticated in Western Mexico while                     to one from northern Mexico (Blair and Izquierdo, 2012); (b)
Andean beans were domesticated in northern Argentina and                       a population resulting from a cross of Midas (an Andean snap
southern Bolivia (Kwak et al., 2009; Rodriguez et al., 2016).                  bean), and a wild type from central Mexico G12873 (Koinange
Within the domesticated Mesoamerican gene pool, the larger-                    et al., 1996); and (c) a population involving Peruvian accessions
seeded races ‘Jalisco’ and ‘Durango’ are distributed in the sub-               both originating in the Andean gene pool (Singh et al., 2019). In
humid and semi-arid highlands, respectively, in Central and                    the first two efforts, genomic regions carrying a positive-effect
Northern Mexico, while the small-seeded race Mesoamerica is                    allele for yield from the wild parent were detected in the wild
distributed in the lowlands from southern Mexico to northeast                  accession from a high rainfall area in Colombia (Blair et al., 2006),
Brazil (Singh et al., 1991). Within each race, there are thousands             but not in the accession from a low rainfall region in northern
of landrace types, as well as fewer, but established, commercial               Mexico (Blair and Izquierdo, 2012).
market classes (Gentry, 1969; Singh et al., 1991; Moghaddam                        In the present investigation, the development of three
et al., 2016). In common bean breeding, the variation included                 backcrossed-inbred-line populations in a nested design is
in the breeding programs is mostly constrained within market                   described, as is their evaluation under drought pressure in
classes and within races, as the inheritance of color, size, and               field conditions followed by a QTL analysis of grain yield.

Frontiers in Plant Science | www.frontiersin.org                           2                                          April 2020 | Volume 11 | Article 346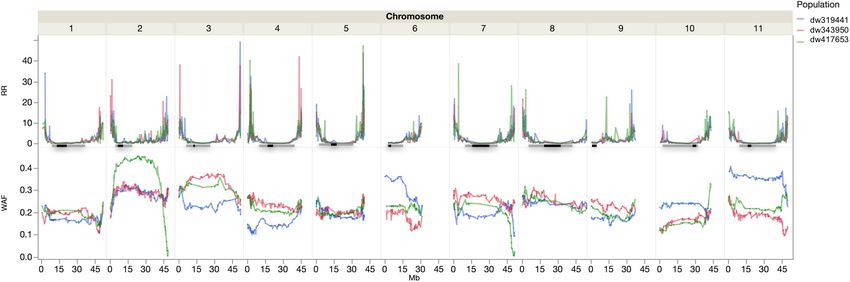
Berny Mier y Teran et al.                                                                                           Yield Increase Deploying Wild Variation

The populations result from the cross between three wild                  way as follows: (1) SEA 5 was crossed to the wild accession using
Mesoamerican accessions originating from areas with different             SEA 5 as the male parent; (2) The F1 plant was then used as
levels of precipitation/evapotranspiration to the same elite              the male parent crossed back to SEA 5 plants to obtain at least
breeding line, also of Mesoamerican origin. The nested design             250 BC1 seeds; (3) Each BC1 seed was scarified before planting
allows the sampling of more diversity than single biparental              and allowed to self in the greenhouse; (4) BC1 S1:2 families were
populations, increases the power and mapping resolution,                  grown in the field in the summer months (June–September, short
but most importantly allows the testing of genetic effects                night/long day photoperiod) planting ∼50 seeds per family,
among accessions in similar genetic backgrounds (Yu et al.,               to allow selection against photoperiod sensitivity. Seeds from
2008; Garin et al., 2017). Our two-fold hypothesis is that:               a randomly chosen plant from each family were harvested;
(1) The three wild accessions have different adaptations to               (5) The plants were grown in the greenhouse for two more
rainfall/evapotranspiration regimes; and (2) Some of these                cycles using single-seed-descent to obtain 220, 237, and 238
contrasting adaptation mechanisms were not included into the              BC1 S4 plants from the dw319441, dw417653, and dw343950
domesticated gene pool during domestication.                              populations, respectively.

                                                                          Trial Design and Phenotyping
MATERIALS AND METHODS                                                     The populations were evaluated under field conditions in 2014
                                                                          and 2015 at the Plant Sciences Field Facility on the University
Parental Materials and Population                                         of California, Davis, campus (38.53◦ N, 121.78◦ W). The soil
Development                                                               type of the site belongs to the Yolo series, a member of
Three populations were established, which resulted from a cross           fine-silty loam, mixed, non-acid, thermic Mollic Xerofluvents,
of the Mesoamerican elite breeding line SEA 5 with three wild             considered well-drained, with slow to medium runoff and
accessions from the Mesoamerican gene pool. SEA 5 (PI 613166;             moderate permeability2 . The seeding was carried out on the 8th
Number and DOI of the CIAT gene bank: G51502, doi: 10.                    of June in 2014 and on the 9th of June in 2015. The plants were
18730/PHA81) was obtained at the International Center for                 harvested on the 22–26th of September in 2014 and the 14–25th
Tropical Agriculture (CIAT, Cali, Colombia) from an interracial           of September in 2015. In 2014, the populations were evaluated
(Durango × Mesoamerica) double cross (BAT 477/San Cristobal               only under full irrigation, using furrow water delivery as needed,
83//Guanajuato 31/Rio Tibagi) within the Mesoamerican gene                in four irrigations. In 2015, a terminal drought water regime
pool (Singh et al., 2001). SEA 5 was selected for high productivity       was added. Terminal drought was simulated by withdrawing
under drought, has an indeterminate inclined growth habit IIb,            irrigation in the last two of the four irrigations of the full irrigated
photoperiod neutrality, resistance to Fusarium root rot and Bean          treatment. Plants received water only from irrigations as there
Common Mosaic Virus (I gene), but shows susceptibility to                 were no rain events during the experiments. The agricultural
anthracnose, common bacterial blight and rust (Singh et al.,              management was according to standard practices in California
2001; Terán and Singh, 2002). SEA 5 develops a vigorous and               (Long et al., 2010).
deep root system (Polania et al., 2017), has a high capacity of               In both years, the RILs were planted in un-replicated fashion
photoassimilate remobilization (Polania et al., 2016; Rao et al.,         and SEA 5 in replicated fashion (eight replicates) according to
2017), and a high capacity for nitrogen fixation under drought            a modified augmented design (Lin and Poushinsky, 1985). The
(Devi et al., 2012).                                                      field was divided in blocks and planted with a main check in the
   Three wild accessions within the Mesoamerican wild gene                middle of each block, as well as two to three secondary checks
pool (Ariani et al., 2018; Berny Mier y Teran et al., 2019a) were         randomly distributed within each block. In 2014, 30 blocks of 3
chosen to maximize genetic variation and annual precipitation of          plots × 9 plots were used and, in 2015, 21 blocks of 5 plots × 5
their collection site. From North to South and along a gradient           plots per treatment were used. UCD 9634, a pink-seeded breeding
of increasing temperature and rainfall, the wild accessions               line, was included in both years as the main check due its high
included PI 319441 (G10022, DOI: 10.18730/JRH59), collected               yield and stability. In 2014, Tio Canela 75 (Rosas et al., 2010),
in the state of Durango, Mexico (104.47◦ N, 24.24◦ W, mean                Matterhorn (Kelly et al., 1999), and Flor de Mayo Eugenia (Acosta
annual temperature: 18◦ C, mean annual precipitation: 588 mm),            Gallegos et al., 2010) were included as secondary checks. In 2015,
PI 417653 (G12910, DOI: 10.18730/PGEK4) from Guanajuato,                  a small, black-seeded line L88-63 (Frahm et al., 2004) was added
Mexico (101.72◦ W, 20.62◦ N, 19.4◦ C, 733 mm) and PI 343950               as a check. The experimental unit was a plot of 60 plants grown
from Huehuetenango, Guatemala (91.82◦ N, 15.68◦ W, 23.5◦ C,               in a row of 6 m-long rows and 0.76 m between rows (density of
1600 mm). The seeds were obtained from the National Plant                 131,578 plants per hectare). In 2014, 230, 238, and 237 progeny
Germplasm System (NPGS) of the USDA at the Western Regional               lines of the dw319441, dw417653, and dw343950 populations,
Plant Introduction Station in Pullman, WA, United States.                 respectively, were grown.
Climatic conditions of each collection site were extracted from               There was a bimodal distribution in days to flowering
the WorldClim database1 (Hijmans et al., 2005).                           (Figure 1) with a smaller set of lines that showed late flowering.
   The three populations (henceforth called dw319441,                     These later genotypes were not used for further evaluation
dw417653, and dw343950) were developed in an identical                    and genotyping, as a wide variation in phenology can be a
1                                                                         2
    www.worldclim.org                                                         https://soilseries.sc.egov.usda.gov

Frontiers in Plant Science | www.frontiersin.org                      3                                                April 2020 | Volume 11 | Article 346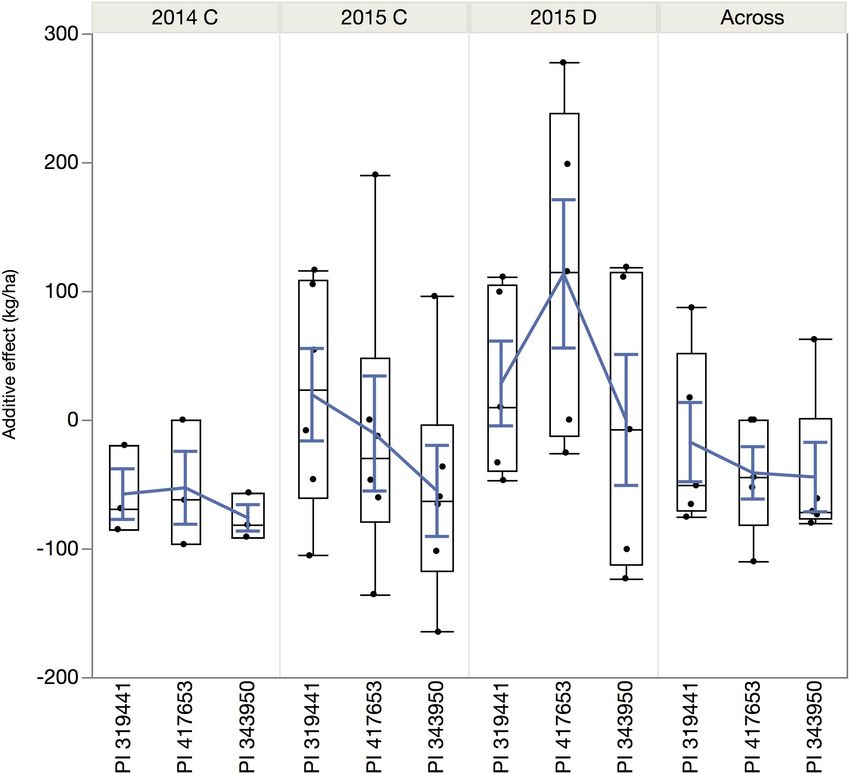
Berny Mier y Teran et al.                                                                                                         Yield Increase Deploying Wild Variation

  FIGURE 1 | Distribution of flowering time among populations and SEA 5 in 2014. The highlighted accessions in the later part of the distribution were not planted in
  2015 to minimize the effect of phenology.

confounding effect (Pinto et al., 2010), especially in the case of                     for discontinuous variation, and g is the random genotypic
late flowering and maturity, which are negatively correlated with                      effect (Malosetti et al., 2017; Rodríguez-Álvarez et al., 2018).
yield in beans (Klaedtke et al., 2012; Berny Mier y Teran et al.,                      The genotype was considered as a random effect in both years
2019b). The final analyses used 171, 170, and 165 lines from the                       and irrigation treatment as a fixed effect in the second year.
dw319441, dw417653, and dw343950 populations, respectively.                            An analysis of variance was carried out as a linear mixed
   Grain yield was measured per experimental plot and                                  model using population, environment, and their interaction as
extrapolated to kilograms per hectare. Flowering time was taken                        fixed effects, and genotype within population as random effects.
when at least 50% of the plot had an open flower. Seed weight was                      The evaluations in 2014 under full irrigation, in 2015 under
evaluated in random subsample of 100 seeds.                                            terminal drought and full irrigation were considered as separate
                                                                                       environments. The statistical analyses were performed with JMP
Statistical Analyses                                                                   (SAS Institute Inc., 2016). The Drought Susceptibility Index
To adjust for within-field spatial variation, a two-dimensional                        (DSI) calculated from the two irrigation treatments in 2015 as
tensor product was used, i.e., the penalized splines (P-splines)                       (1 – Y ds /Y ns )/1 – (X ds /X ns ), where Y ds and Y ns are yields in
method with the package SpATS (Rodríguez-Álvarez et al., 2018)                         drought stress and no stress environments, respectively, and
in R (R Development Core Team, 2018). Briefly, the method                              X ds and X ns are the overall yield under drought stress and
fits the mixed model y = Xβ + Xs βs + Zs s + Zu u + Zg g + e,                          no stress treatments, respectively (Fischer and Maurer, 1978;
where β and βS are vectors that include the intercept and                              Beebe et al., 2013).
check cultivar effect as fixed term, XS is the design matrix,
Xs βs and Zs s are fixed and random components of the mixed                            Genotyping
model, respectively, s is the vector of random spatial effects,                        The BC-RILs, parents, and F1 hybrids were genotyped with the
u is a random row and column effect sub-vector accounting                              BARCBean6K_3 BeadChip platform of 5,398 SNP markers (Song

Frontiers in Plant Science | www.frontiersin.org                                   4                                                 April 2020 | Volume 11 | Article 346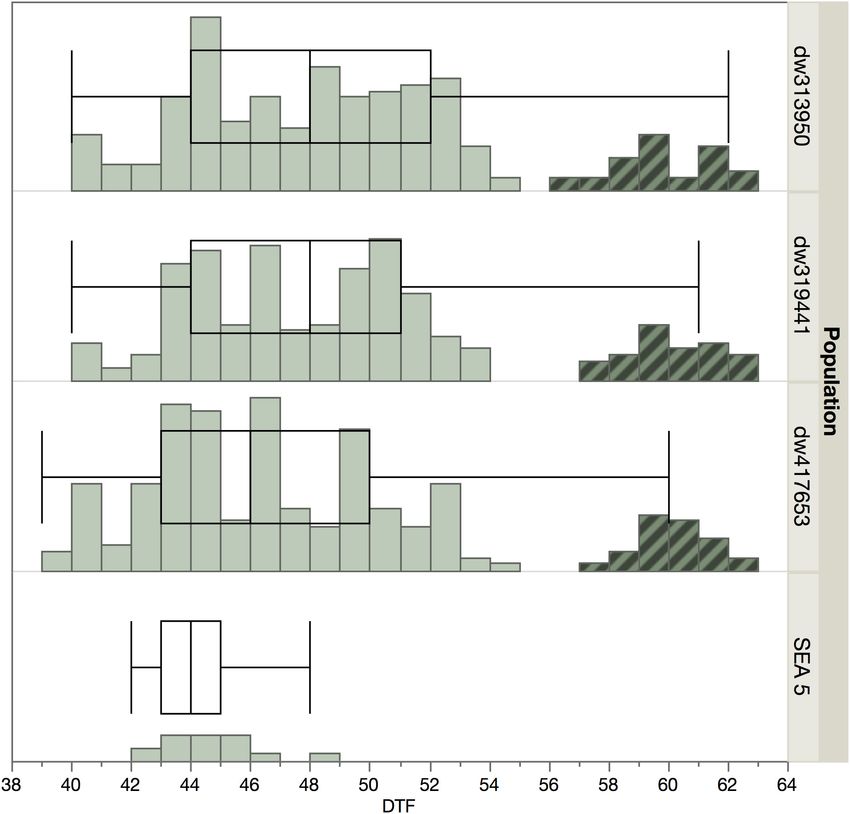
Berny Mier y Teran et al.                                                                                              Yield Increase Deploying Wild Variation

et al., 2015) at the Genome Center at the University of California-       TABLE 1 | Descriptive statistics and analysis of variance for yield (kg ha−1 ) for
Davis. After filtering in GenomeStudio Module v1.8.4 (Illumina            three backcrossed inbred lines and the recurrent parent evaluated in
                                                                          three environments.
Inc., San Diego, CA, United States), SNP calling was performed
with the software’s cluster algorithm, with subsequent manual             RIL                                       Mean                               1082.3
adjustments and a quality control with a 0.15 Gencall score cutoff.                                                 Min                                469.1
The markers were filtered for less than 10% missing data and                                                        Max                                1987.2
polymorphism between parents, verified with the F1 hybrids.               SEA 5                                     Mean                               1575.7
                                                                          F-values                                  Population                         5.7**1
Map Construction                                                                                                    Environment                      1672.5***
Linkage maps were constructed for each population in R (R                                                           PxE                                 3.6**
Development Core Team, 2018) using the package asMAP                      Population mean                           dw319441                         1084.1 AB
(Taylor and Butler, 2017). Genetic distances were determined                                                        dw417653                          1137.1 A
using the Kosambi function (Kosambi, 1944). The recombination                                                       dw343950                          1024.1 B
fraction was estimated with qtl (Wu et al., 2003). A consensus            Environmental means                       2014C3                            624.5 C2
map, combining results for the three individual maps, was                                                           2015C                             1434.0 A
developed with LPmerge (Endelman and Plomion, 2014), with                                                           2015D                             1186.7 B
the linkage maps of the three populations constructed without             1 Significance  codes: ***
Berny Mier y Teran et al. Yield Increase Deploying Wild Variation
FIGURE 2 | Quantile boxplot and overall mean (green line) of the yield of the three populations and recurrent parent for the three environments: fully irrigated in 2014
(YLDHA14c), fully irrigated in 2015 (YLDHA15c), and terminal drought in 2015 (YLDHA15c). Averages not connected with the same letter are significantly different
according to the Tukey-Kramer HSD test (P < 0.05).
Correlations Among Traits and Jointly, there were 2,201 polymorphic markers between the wild
Distribution accessions and SEA 5 and 1,858 markers shared among the
three wild accessions. The trends in recombination rate were
The correlation of yield between the 2014 and 2015 well-
similar across populations. Higher recombination rates were
watered treatments and the 2015 terminal drought treatment was
observed in the distal parts of all the chromosomes, except on
relatively low, with an R of 0.51 and 0.5, respectively (Figure 3),
chromosome Pv06 where higher recombination was observed
but the correlation between drought and well-watered conditions
from the middle to the distal portion and chromosome Pv09
in 2015 was higher (R = 0.88). The overall distributions of yield
where higher recombination was located in the second and fourth
among the RILs in the first year and in 2015 under drought were
quarter of the chromosome (Figure 4).
not normally distributed (P < 0.001, Shapiro–Wilks test) but
The wild allele frequency was variable between and within
were skewed toward the low- yielding side of the distribution,
chromosomes. After one backcross to the domesticated parent,
while the distribution of yield in well-watered plots in 2015 was
one would expect an average frequency of 0.25 of the wild
normally distributed (P = 0.17).
parent. The average frequency was 0.23 across chromosomes,
with a range of 0.17 to 0.4, in Pv01 and Pv02, respectively.
Molecular Linkage Map and QTL The populations had similar frequencies across chromosomes;
Analyses however, within chromosomes there were differences among
Polymorphism, Recombination Rate and Allele populations. For example, in Pv02, compared to the other two
Frequency populations, the dw417653 population showed higher wild allele
There were 1554, 1404, and 1499 polymorphic markers between frequency in the central region but very low frequencies at
SEA 5 and PI 343950, PI 417563, and PI 419441, respectively. the chromosomal ends. In Pv10, the P319441 population had
Frontiers in Plant Science | www.frontiersin.org 6 April 2020 | Volume 11 | Article 346Berny Mier y Teran et al. Yield Increase Deploying Wild Variation
TABLE 2 | Progeny, backcross-inbred lines with highest yields (kg ha−1 ) across the three environments [fully irrigated in 2014 (YLDHA14), fully irrigated in 2015 (YLDHA15c), and terminal drought in 2015 (YLDHA15d)].
higher wild allele frequency than the other populations. In some
2015 (drought-stressed)
Rank
chromosome regions, all three populations showed a lower than
2
5
3
4
1
6
expected wild allele frequency, like in the distal region of Pv01.
There were two regions with markedly low wild allele frequency,
the region mentioned before in Pv02 and another region in Pv07,
both at the end of the chromosomes.
YLDHA15d
2379
1956
2063
1993
2437
1455
+49%
Consensus Molecular Linkage Map
The consensus map was built with 721 markers and had a genetic
length of 925 cM (Table 3). Per chromosome, there were on
Rank
2015 (well-watered)
average 66 markers, an average length of 84 cM, and an average
1
3
5
4
2
6
spacing of 1.3 cM. The average maximum spacing was 9 cM, while
the largest interval was 14 cM in Pv01. Through a comparison of
YLDHA15c
+50% the range of the markers on each chromosome and their physical
2824
2610
2527
2566
2756
1773
position according to the G19833 reference genome version 2.1
(Schmutz et al., 2014), the genetic map spanned 510,318,067 bp,
number of days to flowering.
which represents 99% of the sequenced genome. The coverage
ranged from 96.5% of Pv06 to 99.7% of Pv08.
Rank
2014 (well-watered)
5
1
3
4
6
2
Identification of Additive QTLs and Their Distribution
on the Molecular Linkage Map
YLDHA14
QTL analyses were performed for grain yield in each
−12%
1286
1572
1463
1461
1500
824
environment, consisting of 2 years grown in full irrigation,
2 DTF,
terminal drought in the second year, and the average yield across
environments. The same analysis was conducted for the DSI
100-seed weight (g).
calculated from the drought and well-watered conditions in 2015
Average over the three environments
(Table 4 and Figure 5). Significance thresholds for LOD scores,
calculated by permutations for each environment, were 3.7
Rank
(environment 2014), 3.6 (2015c), and 3.6 (2015d). LOD scores
1
2
3
4
5
6
for averages across environments had a threshold of 4.7. The
1 100SW,
threshold LOD score for DSI was 12.1. Twenty QTLs had LOD
scores about the respective thresholds. They were distributed on
eight chromosomes. These included three QTLs in 2014, five in
Yield values in bold represent yields that are significantly higher than those of the control.
2015c, six in 2015d, five for the average across environments,
YLDHAave
and one for DSI.
+20%
1987
1889
1866
1856
1856
1576
The magnitude of these QTLs ranged from 0.6% to 5.4% with
an outlier at 38% (for DSI on chromosome 9, observed in the
dw319441 and dw343950 populations). The allelic effects of the
chromosome regions marked by these QTLs varied considerably
DTF2
among the three accessions between negative and positive values.
46
42
43
48
54
47
The most negative value (−164.8 kg ha−1 ) was for yield QTL
Difference between best progeny lines and SEA 5 yields
Pv07.55 in 2015, inherited from PI 343950. The largest positive
allelic effect (277.4 kg ha−1 ) was observed in well-watered
100SW1
2015 conditions and was inherited from PI 417653. Overall,
20
20
20
15
18
24
the average allele effect of PI 343950 was the lowest in all
environments and in the mean across environment (Figure 6
and Table 4). In contrast, the allele effect of PI 319441 was
p53-235
p53-114
p41-262
p53-36
p53-65
SEA 5
higher than that of PI 417653 in 2014 and 2015, both under
Lines
full irrigation, while the average allele effect of PI 417653 was
higher than that of PI 319441 under drought in 2015. In
addition, the allele effects across genotypes were relatively higher
under drought than under full irrigation in 2015. The average
QTL significance interval was about 0.8 Mbp, ranging between
Population
dw417653
dw319441
dw417653
0.07 Mbp (on Pv08) and 2.18 Mbp (on Pv01). Many but not all
Control
QTL intervals appeared to be located toward the extremities of
the chromosomes (Table 4).
Frontiers in Plant Science | www.frontiersin.org 7 April 2020 | Volume 11 | Article 346Berny Mier y Teran et al. Yield Increase Deploying Wild Variation
FIGURE 3 | Matrix of trait frequency distribution (diagonal), joint distribution and correlation coefficient (lower triangle) of yield evaluated in 2014 under full irrigation
(YLDAH14c) and in 2015 under full irrigation and terminal drought (YLDAH15c and YLDAH15d, respectively). Traits. The mean of SEA 5 is showed as plus (+) sign.
DISCUSSION Multiparent populations have several advantages over
biparental populations for genetic studies: an increase in allelic
Population Development and diversity, sample size at a specific locus (increasing the power of
detection), and mapping resolution (Garin et al., 2017; Holland,
Segregation Distortion
2015). Various schemes for multiparent populations have been
The main objective of the investigation was to survey eco-
proposed; they are mostly divided into two groups: intermating
geographic adaptive variation in wild beans as a source of
of many parental lines and interconnected biparental populations
novel alleles to increase productivity, as well as to test if these
(Fouilloux and Bannerot, 1988; Cavanagh et al., 2008; Buckler
alleles have differential expression under drought constraints.
et al., 2009; Holland, 2015). Here, three populations were
A resource commonly used for genetic studies are diversity developed from domesticated by wild crosses using an elite
panels, which allow a large sample of the variation to be tested domesticated breeding parent, selected for drought tolerance,
and higher genetic resolution to be obtained. Prior to this study, as the common parent and three wild accessions from a range
a panel of wild accessions of the Mesoamerican gene pool was of rainfall conditions from the driest part of the distribution in
evaluated in a greenhouse setting revealing phenotypic variation Durango, northern Mexico, to a high-rainfall region in highland
in root and shoot traits, as well as genomic regions controlling Guatemala. A domesticated genotype as the common parent
these traits (Berny Mier y Teran et al., 2019a). However, these allows for comparison of QTLs contributed by the different wild
studies are limited by the confounding effects of population genotype relative to each other and to those of the domesticated
structure and relatedness, as well as low power of detection of rare parent. Domesticated × wild nested populations have been
alleles (Anderson et al., 2011; Bazakos et al., 2017). Population developed in maize (Liu et al., 2016) and barley (Schnaithmann
structure is even more geographically constrained in wild bean et al., 2014; Maurer et al., 2015; Nice et al., 2016). In all cases, the
populations than in its domesticated forms, as dispersal and populations were developed after one to four backcrosses to the
intercrossing between wild populations are limited compared domesticated parent.
with domesticated populations (Papa and Gepts, 2003; Zizumbo- Inbred-backcrossed lines facilitate QTL detection (Kaeppler,
Villarreal et al., 2005). In addition, some wild forms, including 1997) as the lines are more homogeneous and their interaction
in common bean, are not adapted to cultivated conditions, with other traits can be defined more precisely. For example,
due to their profuse and extended climbing growth habit and the benefit of earliness as an escape for terminal drought can
photoperiod sensitivity (Acosta-Gallegos et al., 2007). be better assessed in this type of population after measuring
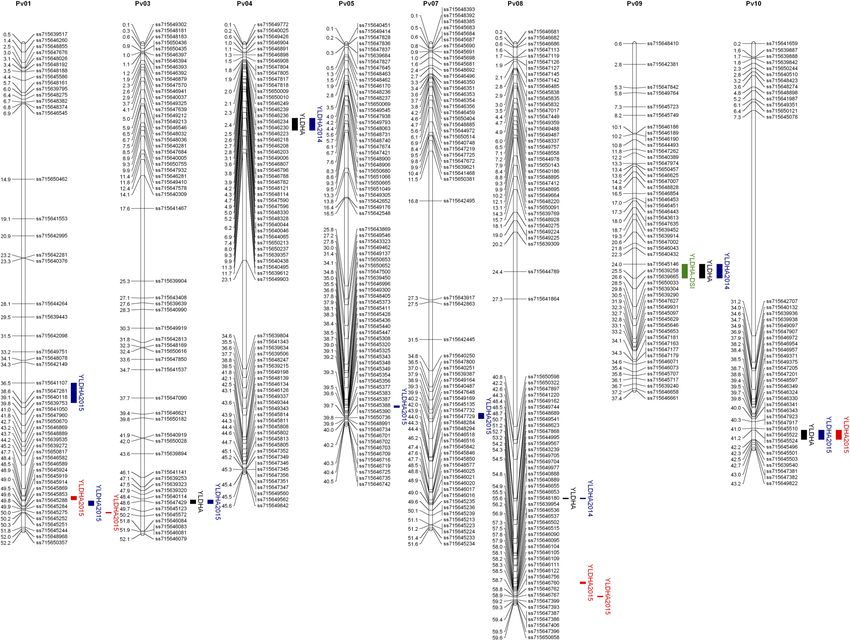
Frontiers in Plant Science | www.frontiersin.org 8 April 2020 | Volume 11 | Article 346Berny Mier y Teran et al. Yield Increase Deploying Wild Variation FIGURE 4 | Recombination rate (RR, cM Mb−1 ) and wild allele frequency (WAF) of the three wild by domesticated populations. The horizontal lines represent the approximate location of the pericentromere (gray) and centromere (black) according to Schmutz et al. (2014). earliness and yield under different irrigation regimes (Beebe The average wild allele frequency in our populations was et al., 2014; Polania et al., 2017). In addition, if superior 0.23, very close to the expected frequency of 0.25 in a lines are identified in domesticated × wild inbred backcross biparental population with a single backcross. Allele frequencies populations, few or no additional backcrosses are needed for significantly different from the expected frequency can be breeding use (Tanksley and Nelson, 1996). However, if a due to genetic mechanisms of segregation distortion, selection trait is controlled epistatically by one or more loci without against photoperiod sensitivity and late flowering, or unintended independent additive effect in the wild, it will be more difficult selection. Processes that lead to segregation distortion include to identify such epistatic interactions in backcross populations gametic incompatibility, genetic load, and asymmetric allelic (Tanksley and Nelson, 1996; Kaeppler, 1997; Johnson and inheritance in heterozygotes (Bodénès et al., 2016; Lyttle, 1991) Gepts, 2002). Only one backcross generation was used to limit besides the selection applied to the populations during their the loss of detection power of the effect of wild alleles as development. Genomic regions of low wild allele frequency were every added backcross decreases the number of alleles from found in various chromosomes. In Pv01, an area of low frequency the wild parent and, hence, the power of QTL detection in all three populations was found around the 48 Mb position. (Kaeppler, 1997). The low frequency of wild alleles is likely due to the presence Nested populations have been developed and used to study of a photoperiod sensitivity gene, Ppd, identified in this region an array of traits in maize (Buckler et al., 2009; Wu et al., 2016; (Koinange et al., 1996; Kwak et al., 2008; Weller et al., 2019) Xiao et al., 2016), soybean (Song et al., 2017), rice (Fragoso and selected against during population development (Figure 1). et al., 2017), barley (Saade et al., 2016), wheat (Bajgain et al., Segregation distortion in this region has also been found in two 2016), and common bean (Hoyos-Villegas et al., 2016), among biparental wild by domesticated common bean populations (Blair others. While wild by domesticated nested populations exist et al., 2006; Blair and Izquierdo, 2012). in maize (Liu et al., 2016) and barley (Schnaithmann et al., At least two other photoperiod loci have been identified, but 2014; Maurer et al., 2015; Nice et al., 2017), ours is the first have not been mapped as yet: the locus Hr, which is recessive domesticated by wild nested population in common bean. and hypostatic to Ppd (Gu et al., 1998; Kwak et al., 2008) and Besides the beneficial alleles for yield, these three populations the locus Tip, which is also recessive and increases earliness at could be of great use as breeding material and for future cooler temperatures in long daylength (White et al., 1996). Tip evaluations as the domesticated parent and the wild accessions might be allelic to either Ppd or Hr (White et al., 1996). Other can be polymorphic for other potentially useful traits. In regions controlling quantitatively photoperiod sensitivity have evaluations of wild germplasm, PI 319441 was found to have been located on Pv03 and Pv04 (Wallach et al., 2018). high sulfur amino acid content in the seed and a high degree There were other regions almost devoid of wild alleles at the of protein hydrolysis after cooking (Montoya et al., 2008), a end of chromosome Pv02 in one population (dw417653) and at high content in polyphenols (Espinosa-Alonso et al., 2006), a the end of Pv07 in two populations (dw319441 and dw417653). high iron concentration (Blair et al., 2013) and, thus, could Distortion in the latter region was also observed by Blair et al. be used as a source for improved nutrition. PI 417653 had (2006). In contrast, some regions in Pv02 and Pv11 showed a wild a high root efficiency ratio (total P content: root area) in allele frequency of 0.4, that is, higher than the expected wild allele low nitrogen conditions (Araújo et al., 1998), a high level frequency after a single backcross. Nevertheless, although QTL of resistance to cucumber mosaic virus (Griffiths, 2002), and analyses assume low segregation distortion, including distorted medium tolerance to salinity during early vegetative growth markers does not necessarily increase false positives or bias the (Bayuelo-Jiménez et al., 2002). effect and position, especially in large populations (Xu, 2008). Frontiers in Plant Science | www.frontiersin.org 9 April 2020 | Volume 11 | Article 346
Berny Mier y Teran et al. Yield Increase Deploying Wild Variation
Genome coverage
Field Evaluation
The three populations were evaluated under field conditions
99.0%
99.6%
99.6%
99.4%
99.1%
96.5%
99.6%
99.7%
98.2%
99.4%
99.2%
99.0%
in 2 years under optimal irrigation conditions. In the second
% year, a terminal drought stress was imposed by withdrawing the
final two irrigations. Thus, the three populations were tested
in a total of three environments. The analysis of variance
Recombination distance
showed a significant effect of population, environment, and
their interaction, for yield production. The environmental effect
was larger than the population and interaction effects. The
Kb/cM
527.5
478.4
543.9
567.0
465.0
501.1
558.1
616.9
548.5
749.7
576.8
557.5
overall yield in 2014 was almost half that of 2015 and the
correlation between treatments was higher between drought and
full irrigation in 2015, than between full irrigation in 2014
and full irrigation in 2015 and drought in 2015. This might
be explained by the effect of hot weather experienced during
Physical length
flowering in 2014. In addition, terminal drought resulted in a
510,318,067
51,667,873
48,837,784
52,079,296
45,702,526
40,436,838
30,857,464
51,531,012
59,454,868
36,792,277
43,003,768
49,954,361
marked 17% yield reduction relative to the irrigated treatment.
bp
Nevertheless, the ranks of the populations within environments
were similar. The dw417653 population was higher-yielding than
the dw319441 populations, which, in turn, was higher-yielding
52,165,138
49,033,712
52,141,173
45,793,192
40,526,191
31,379,071
51,592,532
59,613,870
37,374,817
43,194,406
50,005,757
than the dw343950 population.
Physical range
bp
The wild parent of the latter population originated in the
warmest and wettest climate (23.5◦ C, 1600 mm) of the three wild
parental lines, suggesting that variation for increased productivity
497,265
195,928
521,607
159,002
582,540
190,638
61,877
90,666
89,353
61,520
51,396
can be found in drier and cooler areas. However, the wild parent
bp
of population dw417653, which had the highest yield, originated
in a slightly warmer (19.4◦ C vs. 18◦ C) and wetter (733 mm
Maximum spacing
vs. 588 mm) environment as the second-ranked population (PI
319441). Thus, there may not be a linear relationship between the
13.6
11.4
10.2
13.4
cM
6.0
5.6
6.8
7.4
9.5
5.6
9.3
9.0
aridity of the environment of origin and the ability to increase
yields in domesticated × wild crosses. Other factors may play
a role in addition to aridity adaptation, such genetic distance
between the wild accession and the domesticated gene pool.
Average spacing
Marker cM−1
PI 417653 (G12910) has been implicated in the Mesoamerican
TABLE 3 | SNP distribution among the linkage groups/chromosomes of the consensus map.
domestication of common bean (Kwak et al., 2009).
1.9
0.9
1.7
1.1
1.2
1.3
1.4
1.2
1.3
1.3
1.4
1.3
Map Development and Joint Linkage
QTL Analysis
Length of linkage groups
A consensus map from the three populations was built, which
was adequately dense for joint linkage analysis and subsequent
102.1
924.7
QTL mapping (Table 3). Furthermore, the map covered 99% of
98.0
95.8
80.6
87.0
61.6
92.3
96.4
67.1
57.4
86.6
84.1
cM
the G19833 reference genome (Schmutz et al., 2014). Through
joint linkage mapping, 20 QTLs for grain yield were identified
in the individual environments (year and irrigation regime),
the overall grain yield across environments, and the drought
susceptibility index calculated from the drought effect in the
Number of markers
second year. Among the 20 QTLs, there were 13 non-overlapping
QTLs. Two QTLs on chromosome Pv01 at 76 and 81 cM were
65.5
111
721
52
58
74
75
48
65
82
52
44
60
tightly linked genetically and physically and had similar additive
effect patterns among wild alleles. It is possible, therefore,
that they are the same QTL. On the same chromosome, a
QTL was mapped at the 72 cM position; however, the pattern
of additive effects was reversed from that at the 76 and
Chromo-some
81 cM positions, suggesting a different QTL. On Pv07, QTLs
at the 78 and 87 cM positions had different additive effect
Average
patterns for two of three parental loci suggesting these two
Total
10
11
QTLs are distinct.
1
2
3
4
5
6
7
8
9
Frontiers in Plant Science | www.frontiersin.org 10 April 2020 | Volume 11 | Article 346Frontiers in Plant Science | www.frontiersin.org
Berny Mier y Teran et al.
TABLE 4 | Summary of the QTL analysis for yield (kg ha−1 ) and drought susceptibility index (DSI) evaluated in three environments (2014 and 2015 under full irrigation, and 2015 under terminal drought).
Chromo-some Position Year1 Treatment LOD PVE2 Additive effect (kg ha−1 ) relative to SEA 5 Confidence interval Potentially overlapping
(cM) score QTLs3
PI 319441 PI 417653 PI 343950 Marker Position (Mbp)
1 45 2015 Well-watered 3.8 1.8 −8.3 −135.5 −36.5 ss715641107 ss715647281 36.46 38.63
1 72 2015 Drought 4.6 1.0 99.4 0.0 111.0 ss715646589 ss715645924 48.52 48.90 Trapp et al. (2016)
1 76 2015 Well-watered 5.7 4.6 54.3 190.3 −59.7 ss715645914 ss715645869 48.99 49.48
1 81 2015 Drought 6.0 4.8 −47.0 277.4 −7.4 ss715645252 ss715645251 50.22 50.30
3 72 Mean 6.1 3.5 87.2 0.0 62.4 ss715639323 ss715639320 47.53 47.95
3 72 2015 Well-watered 5.2 1.7 105.2 0.0 96.0 ss715639323 ss715639320 47.53 47.95
4 33 Mean 4.8 1.9 −51.0 −44.5 −61.1 ss715650237 ss715639357 7.97 9.30 Blair et al. (2006)
4 33 2014 Well-watered 3.9 3.5 −85.1 −62.3 −56.6 ss715650237 ss715639357 7.97 9.30
5 68 2015 Well-watered 4.5 1.3 −105.4 −60.4 −65.7 ss715645447 ss715645308 38.52 38.72 Trapp et al. (2016)
11
7 55 2015 Well-watered 8.0 2.6 −46.3 −12.7 −164.8 ss715640487 ss715647648 39.30 39.94 Hoyos-Villegas et al. (2016)
8 54 Mean 7.6 5.4 −75.4 −110.0 −73.5 ss715649162 ss715649744 48.44 48.51
8 54 2014 Well-watered 4.6 4.7 −19.7 −96.7 −81.6 ss715649162 ss715649744 48.44 48.51
8 78 2015 Drought 6.7 2.4 111.0 198.6 118.7 ss715646502 ss715646515 57.32 57.55
8 87 2015 Drought 7.9 1.9 −33.2 115.2 −123.3 ss715646762 ss715646767 58.78 58.94
9 33 2015 DSI 20.9 38.0 0.6 0.0 0.4 ss715645146 ss715639258 23.96 25.49 Mukeshimana et al. (2014),
Berny Mier y Teran et al.
(2019b)
9 33 Mean 6.1 3.2 −65.5 0.0 −80.1 ss715645146 ss715639258 23.96 25.49
9 33 2014 Well-watered 4.1 4.1 −68.8 0.0 −90.9 ss715645146 ss715639258 23.96 25.49
10 46 Mean 5.1 2.8 17.2 −52.5 −71.1 ss715645524 ss715645496 41.21 42.15 Hoyos-Villegas et al. (2016)
10 46 2015 Well-watered 3.6 3.2 116.4 −46.7 −102.0 ss715645524 ss715645496 41.21 42.15
Yield Increase Deploying Wild Variation
10 46 2015 Drought 3.8 0.6 10.0 −25.6 −100.5 ss715645524 ss715645496 41.21 42.15
April 2020 | Volume 11 | Article 346
1 Mean: average of the three treatments. 2 Percentage of variation explained. 3 For further explanations, see the section “Discussion.”Berny Mier y Teran et al. Yield Increase Deploying Wild Variation
FIGURE 5 | Joint chromosomal linkage map and QTLs for grain yield (YLDHA, kg ha- 1 ) and drought susceptibility index (DSI). The bars in blue represent the
environments under full irrigation, red for terminal drought, black for the mean yield, and green for DSI. The position in the chromosome are the physical positions of
the markers in Mbp and plotted with MapChart (Voorrips, 2002).
From the 20 QTLs, three were detected in 2014, five in 2015 the lowest average additive effect. Conversely, the average allelic
under full irrigation, six in 2015 under terminal drought, five in effects of the accessions from the drier habitats were higher: PI
the overall average across environments and one for DSI. From 319441 alleles in both 2014 and 2015, both under full irrigation,
these, four QTLs were unique to 2015C and three to 2015D. whereas PI 417653 alleles were higher under drought in 2015.
The variation explained by the QTLs ranged from 0.6 to 5.4%, The overall allele effect of PI 319441 was higher than that of
expected for a highly polygenic trait such as yield (Johnson and PI 417653 in 2014 and 2015, both under full irrigation, while
Gepts, 2002; Blair et al., 2006). For all QTLs that were expressed the average allele effect of PI 417653 was higher than that of
in different environments, the additive effects were of similar PI 319441 under drought in 2015. This suggest that drought
sign, suggesting that there were no tradeoffs between years or tolerance could be a driver of local adaptation. Some traits,
treatments. Although for most QTLs the effect of the wild alleles like deeper rooting, water use efficiency, earliness in flowering
showed the same sign, for some, e.g., Pv08.87, the allele of PI and maturity (Berny Mier y Teran et al., 2019a), might be also
417653 had a positive effect (115 kg ha−1 ) while the alleles of PI beneficial under cultivation if growing seasons are shorter. Berny
343950 and PI 319441 had a negative effect (−123 kg ha−1 and Mier y Teran et al. (2019a) observed that PI 417653, the wild
−33 kg ha−1 , respectively). This observation suggests that this accession with the strongest allelic effects under drought, has
QTL consists of an allelic series at one locus or represents several, deeper roots and the fastest early growth (Days to the V3 stage)
linked loci (Buckler et al., 2009). The detection of allelic series is compared to the other two wild accessions. On the contrary, high
one of the advantages of nested populations compared with bi- rainfall conditions could increase selection pressure toward more
allelic variation in genome-wide association of diversity panels or vigorous vegetative growth and higher disease resistance.
other multiparent populations (Brachi et al., 2011). There are two previously published wild by domesticated yield
Furthermore, within and across environments, the alleles of QTL analyses. Blair et al. (2006) evaluated a cross between a
PI 343950, the wild population from the wettest location, had domesticated Andean cultivar (ICA Cerinza) and a wild type
Frontiers in Plant Science | www.frontiersin.org 12 April 2020 | Volume 11 | Article 346Berny Mier y Teran et al. Yield Increase Deploying Wild Variation FIGURE 6 | Quantile boxplot and overall mean (blue line) of the additive effect of the alleles of the wild accessions in comparison to the reference allele from SEA 5, the shared domesticated parent. from Guatemala (G24404). They found nine QTLs for grain Two domesticated by domesticated mapping populations have yield, with four of them having the wild allele increasing the been developed using SEA 5 (Briñez et al., 2017; Mukeshimana trait. A QTL on Pv04 overlapped with our findings, which was et al., 2014). The latter found three QTLs for yield, with one QTL detected in 2014 and as average across the three environments at Pv09 (SY9.1, confidence interval of 25.1–27.1 Mb) overlapping (Table 4). Their confidence interval was 0.4 to 9.5 Mbp while with our findings (Mukeshimana et al., 2014). The allele of SEA the QTL identified in this study was located within a 7.9 to 5 had a negative effect compared to a parental line of the Andean 9.3 Mbp interval (Table 4). However, the additive effect of the gene pool, while SEA 5 had a positive effect when compared to G24404 accession was positive while the alleles from the three the wild types in the present study. Briñez et al. (2017) developed wild sources in our study had a negative effect. It is possible a population based on SEA 5 crossed to an Andean accession. that the allele from the Andean gene pool in ICA Cerinza They found two QTLs for grain yield, which did not overlap with had a relatively smaller effect than that of SEA 5 and the wild our findings. Within other published QTL analyses for yield, our accessions. Blair and Izquierdo (2012) evaluated a population of findings overlapped with QTLs found by Trapp et al. (2016) in the same domesticated cultivar (ICA Cerinza) crossed to G10022 Pv01 (SY1.1) and Pv05 (SY5.1), by Hoyos-Villegas et al. (2016) in (PI 319441), one of the parents of the nested populations studied Pv07 (SY7.4) and Pv10 (SY10.1), and by Berny Mier y Teran et al. here. They found one QTL on Pv05, with the domesticated allele (2019b) in Pv09. The latter QTL also overlapped with the SY9.1 having the positive effect. This QTL did not overlap with Pv05.68 QTL found by Mukeshimana et al. (2014). of the current investigation. By comparing the current results From the 13 non-overlapping QTLs in this study, five had with our previous evaluation of a panel of wild germplasm (Berny at least one wild allele with a significant positive additive effect. Mier y Teran et al., 2019a), the QTL in Pv10 located in the The allele of PI 417653 at Pv01.81 had the largest effect (277 kg interval of 41.2 to 42.1 Mb was situated near a SNP at 38.3 Mb ha−1 ), detected under drought in 2015. PI 417653 was the only associated with total biomass in the wild panel. This QTL showed parent that had effects close to zero, in three of the 13 QTLs. This a positive additive effect on yield resulting from one parental wild parent is part of the putative Mesoamerican domestication allele (PI 417653) but a negative effect from the other two parents, center of common bean in west-central Mexico and is, therefore, suggesting that this genomic location might be involved in local the closest genetically to the domesticated parent of the three adaptation within the wild germplasm. wild populations used in this study (Kwak et al., 2009). This Frontiers in Plant Science | www.frontiersin.org 13 April 2020 | Volume 11 | Article 346
Berny Mier y Teran et al.                                                                                        Yield Increase Deploying Wild Variation

observation suggests that the ancestor of this wild population               categorized as DREB2 genes, which are normally involved in
contributed yield alleles to the Mesoamerican domesticated                   responses to abiotic stresses such as caused by water deficit
gene pool or that it could harbor an introgression from the                  (Konzen et al., 2019).
domesticated gene pool (Papa and Gepts, 2003; Papa et al., 2005).

Putative Candidate Genes for QTLs                                            CONCLUSION
The QTLs detected in this study encompass genomic regions with
high number of genes, in general. For example, the statistical               Our original hypothesis was that wild P. vulgaris populations
significance region of the QTL at Pv09.33, which was detected in             from drier areas would be better sources of yield-enhancing
the 2014 well-watered treatment and for DSI, ranges from 24.43               genes in a domesticated line than those from more humid areas.
to 25.98 Mb in version 2.1 of the common bean reference genome               We showed here that this is indeed the case. However, we also
deposited in Phytozome3 . Within this region, 105 distinct gene              showed that these same wild populations from drier areas also
models have been identified. Their annotation (obtained from                 increased yields under well-watered conditions. On average, the
PFAM4 and PANTHER5 ; see Supplementary Table S1) reveals                     superior progeny lines from arid wild beans increased yield by
genes implicated in a variety of cellular processes and molecular            around 20%. Taken together, various wild genomic regions were
functions, such as response to stress, oxidative response, signal            identified that had positive effects on yield under well-watered
transduction, protein ubiquitination, chromosome modification,               and drought-stress conditions. Our results have the potential
histone modification, metal ion binding, and RNA processing.                 to make future introgressions assisted with markers faster and
For example, within this QTL region, Phvul.009G164600.1 was                  more efficient. The alleles with positive (and negative) effects
annotated as a serine carboxypeptidase, which was described                  help explain the transgressive segregation found in this study
as involved in oxidative stress in rice (Liu et al., 2008).                  and underscore the potential of wild variation to improve the
Phvul.009G169400.2 is related to callose synthase, involved in               productivity of domesticated beans. Future work is needed to
callose deposition, a functional category that was also described            validate the QTLs with a positive effect on yield introgressed
by Recchia et al. (2018), in an experiment with BAT477 under                 in different domesticated genetic (Des Marais et al., 2013; Shen
drought and well-watered conditions, in the presence or absence              et al., 2018). Variation within some QTLs in the magnitude of the
of arbuscular mycorrhizal fungi. Moreover, this QTL region also              effect or sign of the effect suggest allelic series associated with a
contained members of a leucin-rich repeat family. This group                 range of phenotypic variation. This variation could be the basis
of genes belongs a larger protein family of receptor-like kinases,           to local adaptation (Buckler et al., 2009; Kronholm et al., 2012).
playing important roles in stress resistance (Ye et al., 2017), a            In addition, further sampling of the wild variation is warranted
category also found by Recchia et al. (2018) in common bean.                 (Stich, 2009), as well as evaluation in wetter and more humid
However, because the genomic significance region of a low-                   conditions than in the field site in California.
heritability trait like yield is so large, an exhaustive list of gene
models for each QTL identified in this study becomes quite long
as illustrated in Supplementary Table S1. It is difficult to focus
                                                                             DATA AVAILABILITY STATEMENT
on likely candidate gene models without further experimentation,
                                                                             The datasets generated for this study can be found in Dryad https:
which falls beyond the scope of this work.
                                                                             //doi.org/10.25338/B8FW3M.
   An alternative approach is to map genes with a putative
role in drought-tolerance and examine to what extent they
co-segregate with QTLs. Genome-wide categorizations have                     AUTHOR CONTRIBUTIONS
been published for a few families in common bean, such as
aquaporins (AQP) (Ariani and Gepts, 2015) and Dehydration                    JB and PG designed the experiments. JB, AP, and EK carried
Responsive Element-Binding (DREB) genes (Cortés et al., 2012;                out the field trial and genotyping. JB analyzed the data and
Konzen et al., 2019). AQPs play important roles as water                     drafted the manuscript. JB, EK, AP, ST, and PG contributed to
channel proteins in plants. The AQP gene PvPIP1;1 is located                 and edited the manuscript.
near a QTL detected under drought in 2015 on chromosome
Pv01, with a distance of approximately 120 Kbp from marker
ss715645251. Two transcription factors belonging to the DREB                 FUNDING
gene family, traditionally characterized as involved in abiotic
stress responses such as drought, were located within a specific             Funding was provided by the Agriculture and Food Research
QTL. Phvul.001G136100 is located within the QTL at Pv01.45,                  Initiative (AFRI) Competitive Grant (2013-67013-21224) from
a QTL detected in the 2015 well-watered treatment and                        the USDA National Institute of Food and Agriculture (NIFA).
Phvul.003G241700 is located at Pv03.72, a QTL detected in the
well-watered treatment in 2015. Both genes were previously
                                                                             ACKNOWLEDGMENTS
3
  https://phytozome.jgi.doe.gov/pz/portal.html
4
  https://pfam.xfam.org/                                                     We would like to thank the crew at the Plant Sciences
5
  http://pantherdb.org/                                                      Field Facility for assistance in the field experiments. Thanks

Frontiers in Plant Science | www.frontiersin.org                        14                                          April 2020 | Volume 11 | Article 346
Berny Mier y Teran et al. Yield Increase Deploying Wild Variation
to Laura Gaminño, Jamily Ramos de Lima, Arthur Martins SUPPLEMENTARY MATERIAL
Almeida Bernardeli, Poliana Silva Rezende, Bruno Lima Martins,
Guilherme Coelho Portilho, Higor Da Costa Ximenes de Souza, The Supplementary Material for this article can be found online
Mayara Rocha, Adam Yang, Ninh Khuu and the rest of the Gepts at: https://www.frontiersin.org/articles/10.3389/fpls.2020.00346/
Lab for the help during planting, harvest, and sample processing. full#supplementary-material
REFERENCES Blair, M. W., and Izquierdo, P. (2012). Use of the advanced backcross-QTL method
to transfer seed mineral accumulation nutrition traits from wild to Andean
Acosta Gallegos, J. A., Jiménez Hernández, Y., Sánchez García, B. M., Mendoza cultivated common beans. Theor. Appl. Genet. 125, 1015–1031. doi: 10.1007/
Hernández, F. M., Herrera Hernández, M. G., Salinas Pérez, R. A., et al. (2010). s00122-012-1891-x
Flor de Mayo Eugenia, nueva variedad de frijol para riego y temporal en el Blair, M. W., Izquierdo, P., Astudillo, C., and Grusak, M. A. (2013). A
centro de México. Rev. Mex. Ciencias Agrícolas 1, 751–757. legume biofortification quandary: variability and genetic control of seed coat
Acosta-Gallegos, J. A., Kelly, J. D., and Gepts, P. (2007). Prebreeding in common micronutrient accumulation in common beans. Front. Plant Sci. 4:275. doi:
bean and use of genetic diversity from wild germplasm. Crop Sci. 47, S–44. 10.3389/fpls.2013.00275
doi: 10.2135/cropsci2007.04.0008IPBS Bodénès, C., Chancerel, E., Ehrenmann, F., Kremer, A., and Plomion, C. (2016).
Anderson, J. T., Willis, J. H., and Mitchell-Olds, T. (2011). Evolutionary genetics of High-density linkage mapping and distribution of segregation distortion
plant adaptation. Trends Genet. 27, 258–266. doi: 10.1016/j.tig.2011.04.001 regions in the oak genome. DNA Res. 23, 115–124. doi: 10.1093/dnares/dsw001
Araújo, A. P., Teixeira, M. G., and de Almeida, D. L. (1998). Variability of traits Brachi, B., Morris, G. P., and Borevitz, J. O. (2011). Genome-wide association
associated with phosphorus efficiency in wild and cultivated genotypes of studies in plants: the missing heritability is in the field. Genome Biol. 12:232.
common bean. Plant Soil 203, 173–182. doi: 10.1023/A:1004398930218 doi: 10.1186/gb-2011-12-10-232
Ariani, A., and Gepts, P. (2015). Genome-wide identification and characterization Briñez, B., Perseguini, J. M. K. C., Rosa, J. S., Bassi, D., Gonçalves, J. G. R., Almeida,
of aquaporin gene family in common bean (Phaseolus vulgaris L.). Mol. Genet. C., et al. (2017). Mapping QTLs for drought tolerance in a SEA 5 x AND 277
Genomics 290, 1771–1785. doi: 10.1007/s00438-015-1038-2 common bean cross with SSRs and SNP markers. Genet. Mol. Biol. 40, 813–823.
Ariani, A., Berny Mier Teran, J. C., and Gepts, P. (2018). Spatial and temporal scales doi: 10.1590/1678-4685-gmb-2016-0222
of range expansion in wild Phaseolus vulgaris. Mol. Biol. Evol. 35, 119–131. Broughton, W. J., Hernández, G., Blair, M., Beebe, S., Gepts, P., and Vanderleyden,
doi: 10.1093/molbev/msx273 J. (2003). Beans (Phaseolus spp.) – model food legumes. Plant Soil 252, 55–128.
Bajgain, P., Rouse, M. N., Tsilo, T. J., Macharia, G. K., Bhavani, S., Jin, Y., et al. doi: 10.1023/A:1024146710611
(2016). Nested association mapping of stem rust resistance in wheat using Buckler, E. S., Holland, J. B., Bradbury, P. J., Acharya, C. B., Brown, P. J., Browne,
genotyping by sequencing. PLoS ONE 11:e0155760. doi: 10.1371/journal.pone. C., et al. (2009). The genetic architecture of maize flowering time. Science (80-.)
0155760 325, 714–718. doi: 10.1126/science.1174276
Bayuelo-Jiménez, J. S., Debouck, D. G., and Lynch, J. P. (2002). Salinity tolerance Cavanagh, C., Morell, M., Mackay, I., and Powell, W. (2008). From mutations to
in Phaseolus species during early vegetative growth. Crop Sci. 42, 2184–2192. MAGIC: resources for gene discovery, validation and delivery in crop plants.
doi: 10.2135/cropsci2002.2184 Curr. Opin. Plant Biol. 11, 215–221. doi: 10.1016/j.pbi.2008.01.002
Bazakos, C., Hanemian, M., Trontin, C., Jiménez-Gómez, J. M., and Loudet, O. Checa, O. E., and Blair, M. W. (2008). Mapping QTL for climbing ability and
(2017). New strategies and tools in quantitative genetics: how to go from the component traits in common bean (Phaseolus vulgaris L.). Mol. Breed. 22,
phenotype to the genotype. Annu. Rev. Plant Biol. 68, 435–455. doi: 10.1146/ 201–215. doi: 10.1007/s11032-008-9167-5
annurev-arplant-042916-040820 Cortés, A. J., This, D., Chavarro, C., Madriñán, S., and Blair, M. W. (2012).
Beaver, J. S., Zapata, M., Alameda, M., Porch, T. G., and Rosas, J. C. (2012). Nucleotide diversity patterns at the drought-related DREB2 encoding genes in
Registration of PR0401-259 and PR0650-31 dry bean germplasm lines. J. Plant wild and cultivated common bean (Phaseolus vulgaris L.). Theor. Appl. Genet.
Regist. 6, 81. doi: 10.3198/jpr2011.05.0283crg 125, 1069–1085. doi: 10.1007/s00122-012-1896-5
Beebe, S. (2012). Common bean breeding in the tropics. Plant Breed. Rev. Vol. 36, Delgado-Salinas, A., Bibler, R., and Lavin, M. (2006). Phylogeny of the genus
357–426. doi: 10.1002/9781118358566 Phaseolus (Leguminosae): a recent diversification in an ancient landscape. Syst.
Beebe, S. E., Rao, I. M., Blair, M. W., and Acosta-Gallegos, J. A. (2013). Phenotyping Bot. 31, 779–791. doi: 10.1600/036364406779695960
common beans for adaptation to drought. Front. Physiol. 4:35. doi: 10.3389/ Des Marais, D. L., Hernandez, K. M., and Juenger, T. E. (2013). Genotype-by-
fphys.2013.00035 environment interaction and plasticity: exploring genomic responses of plants
Beebe, S. E., Rao, I. M., Devi, M. J., and Polania, J. (2014). Common beans, to the abiotic environment. Annu. Rev. Ecol. Evol. Syst. 44, 5–29. doi: 10.1146/
biodiversity, and multiple stresses: challenges of drought resistance in tropical annurev-ecolsys-110512-135806
soils. Crop Pasture Sci. 65:667. doi: 10.1071/CP13303 Devi, M. J., Sinclair, T. R., Beebe, S. E., and Rao, I. M. (2012). Comparison of
Berny Mier y Teran, J. C., Konzen, E. R., Medina, V., Palkovic, A., Ariani, common bean (Phaseolus vulgaris L.) genotypes for nitrogen fixation tolerance
A., Tsai, S. M., et al. (2019a). Root and shoot variation in relation to to soil drying. Plant Soil 364, 29–37. doi: 10.1007/s11104-012-1330-4
potential intermittent drought adaptation of Mesoamerican wild common bean Dohle, S., Berny Mier y Teran, J. C., Egan, A., Kisha, T., and Khoury, C. K.
(Phaseolus vulgaris L.). Ann. Bot. 124, 917–932. doi: 10.1093/aob/mcy221 (2019). “Wild beans (Phaseolus L.) of North America,” in North American Crop
Berny Mier y Teran, J. C., Konzen, E. R., Palkovic, A., Tsai, S. M., Rao, I. M., Wild Relatives: Important Species, Vol. 2, eds S. L. Greene, K. A. Williams,
Beebe, S., et al. (2019b). Effect of drought stress on the genetic architecture C. K. Khoury, M. B. Kantar, and L. F. Marek (Cham: Springer International
of photosynthate allocation and remobilization in pods of common bean Publishing), 99–127. doi: 10.1007/978-3-319-97121-6_4
(Phaseolus vulgaris L.), a key species for food security. BMC Plant Biol. 19:171. Endelman, J. B., and Plomion, C. (2014). LPmerge: an R package for merging
doi: 10.1186/s12870-019-1774-2 genetic maps by linear programming. Bioinformatics 30, 1623–1624. doi: 10.
Bitocchi, E., Nanni, L., Bellucci, E., Rossi, M., Giardini, A., Zeuli, P. S., et al. 1093/bioinformatics/btu091
(2012). Mesoamerican origin of the common bean (Phaseolus vulgaris L.) is Espinosa-Alonso, L. G., Lygin, A., Widholm, J. M., Valverde, M. E., and Paredes-
revealed by sequence data. Proc. Natl. Acad. Sci. U.S.A. 109, E788–E796. doi: Lopez, O. (2006). Polyphenols in wild and weedy Mexican common beans
10.1073/pnas.1108973109 (Phaseolus vulgaris L.). J. Agric. Food Chem. 54, 4436–4444. doi: 10.1021/
Blair, M. W., Iriarte, G., and Beebe, S. (2006). QTL analysis of yield traits in jf060185e
an advanced backcross population derived from a cultivated Andean x wild Fischer, R., and Maurer, R. (1978). Drought resistance in spring wheat cultivars.
common bean (Phaseolus vulgaris L.) cross. Theor. Appl. Genet. 112, 1149–1163. I. Grain yield responses. Aust. J. Agric. Res. 29:897. doi: 10.1071/AR97
doi: 10.1007/s00122-006-0217-2 80897
Frontiers in Plant Science | www.frontiersin.org 15 April 2020 | Volume 11 | Article 346You can also read