Enhanced hippocampal type II theta activity AND altered theta architecture in mice lacking the Cav3.2 T type voltage gated calcium channel - Nature

Page created by Javier Woods
 
CONTINUE READING
Enhanced hippocampal type II theta activity AND altered theta architecture in mice lacking the Cav3.2 T type voltage gated calcium channel - Nature
www.nature.com/scientificreports

                OPEN             Enhanced hippocampal type II
                                 theta activity AND altered theta
                                 architecture in mice lacking
                                 the ­Cav3.2 T‑type voltage‑gated
                                 calcium channel
                                 Muhammad Imran Arshaad1, Magdalena Elisabeth Siwek1, Christina Henseler1,
                                 Johanna Daubner1, Dan Ehninger2, Jürgen Hescheler3, Agapios Sachinidis3, Karl Broich4,
                                 Anna Papazoglou1 & Marco Weiergräber1*

                                 T-type ­Ca2+ channels are assumed to contribute to hippocampal theta oscillations. We used
                                 implantable video-EEG radiotelemetry and qPCR to unravel the role of ­Cav3.2 ­Ca2+ channels in
                                 hippocampal theta genesis. Frequency analysis of spontaneous long-term recordings in controls
                                 and ­Cav3.2−/− mice revealed robust increase in relative power in the theta (4–8 Hz) and theta-alpha
                                 (4–12 Hz) ranges, which was most prominent during the inactive stages of the dark cycles. Urethane
                                 injection experiments also showed enhanced type II theta activity and altered theta architecture
                                 following ­Cav3.2 ablation. Next, gene candidates from hippocampal transcriptome analysis of
                                 control and ­Cav3.2−/− mice were evaluated using qPCR. Dynein light chain Tctex-Type 1 (Dynlt1b) was
                                 significantly reduced in ­Cav3.2−/− mice. Furthermore, a significant reduction of GABA A receptor δ
                                 subunits and GABA B1 receptor subunits was observed in the septohippocampal GABAergic system.
                                 Our results demonstrate that ablation of ­Cav3.2 significantly alters type II theta activity and theta
                                 architecture. Transcriptional changes in synaptic transporter proteins and GABA receptors might be
                                 functionally linked to the electrophysiological phenotype.

                                 Abbreviations
                                 AS	Active state
                                 CA	Cornu ammonis
                                 CNRQ	Calibrated normalized relative quantity
                                 DAG	Diacylglycerole
                                 DC	Dark cycle
                                 DHP	Dihydropyridine
                                 EC	Entorhinal cortex
                                 GABA	Gamma-aminobutyric acid
                                 GPCR	G-protein coupled receptor
                                 GT	Genotype
                                 HVA	High voltage-activated
                                 i.p.	Intraperitoneal
                                 LC	Light cycle
                                 LTP	Long-term potentiation
                                 LVA	Low voltage-activated

                                 1
                                  Experimental Neuropsychopharmacology, Federal Institute for Drugs and Medical Devices (Bundesinstitut für
                                 Arzneimittel und Medizinprodukte, BfArM), Kurt‑Georg‑Kiesinger‑Allee 3, 53175 Bonn, Germany. 2Molecular and
                                 Cellular Cognition, German Center for Neurodegenerative Diseases (Deutsches Zentrum für Neurodegenerative
                                 Erkrankungen, DZNE), Sigmund‑Freud‑Str. 27, 53127 Bonn, Germany. 3Institute of Neurophysiology, University
                                 of Cologne, Faculty of Medicine, Robert‑Koch‑Str. 39, 50931 Cologne, Germany. 4Federal Institute for Drugs and
                                 Medical Devices (Bundesinstitut für Arzneimittel und Medizinprodukte, BfArM), Kurt‑Georg‑Kiesinger‑Allee 3,
                                 53175 Bonn, Germany. *email: Marco.Weiergraeber@bfarm.de

Scientific Reports |   (2021) 11:1099               | https://doi.org/10.1038/s41598-020-79763-4                                             1

                                                                                                                                         Vol.:(0123456789)
www.nature.com/scientificreports/

                                            mAChR	Muscarinic acetylcholine receptor
                                            MS/DBB	Medial septum/diagonal band of Broca
                                            MS	Medial septum
                                            MVA	Mid voltage-activated
                                            NAS	Non-active state
                                            PKC	Protein kinase C
                                            PSD	Power spectrum density
                                            qPCR	Quantitative polymerase chain reaction
                                            REM	Rapid eye movement
                                            R-type	“Resistant” type ­Ca2+ channel
                                            SEM	Standard error of the mean
                                            SK	Small-conductance potassium channel
                                            TM	Transmitter
                                            T-type	“Transient” type ­Ca2+ channel
                                            VGCC​	Voltage-gated ­Ca2+ channel

                                              Hippocampal theta oscillations of species specific frequency are of major significance in various cognitive and
                                              behavioral processes, such as arousal, attention, exploratory behavior, voluntary locomotion, learning and mem-
                                              ory, sensorimotor processing and REM s­ leep1–6. Anatomically, the minimal substrate for triggering and perpetu-
                                              ation of theta activity turned out to be the hippocampus and the medial septum-diagonal band of Broca (MS/
                                              DBB)7–9. The exact locality determination of the theta generator turned out to be challenging and both extrahip-
                                              pocampal and intrahippocampal hypotheses are under d          ­ iscussion10. Nowadays, the so-called septal pacemaker-
                                              hippocampal follower model is widely accepted, based on studies by Hangya et al. who showed that a subgroup of
                                              GABAergic medial septum (MS) neurons operates as the pacemaker structure by forwarding rhythmic activity
                                              on hippocampal pyramidal cells and ­interneurons11. Based on the dualistic theory of theta oscillations, one can
                                              distinguish between atropine-insensitive type I and atropine-sensitive type II theta a­ ctivity12–14. However, the
                                              molecular, electrophysiological, and behavioral characteristics of hippocampal theta oscillations are still poorly
                                             ­understood12,15,16. Atropine-sensitive type II theta oscillations occur, i.a., during alert immobility and urethane
                                              induced ­anesthesia12,13,17,18. They can be triggered by stimulation of muscarinic type 1/3 (­ M1/M3) G-protein
                                              coupled receptors (GPCR), initializing the muscarinic signal transduction cascade via the G protein q/11 alpha
                                              subunit (Gαq/11), phospholipase C β1/4 (PLCβ1/4), inositol trisphosphate (­ InsP3), diacylglycerole (DAG), C           ­ a2+ and
                                                                         14,19
                                              protein kinase C (PKC) . Various downstream effects of this cascade, potentially associated with the devel-
                                              opment of atropine-sensitive type II theta oscillations, have been s­ uggested14. Importantly, inactivation of hip-
                                              pocampal PLCβ1 or septal PLCβ4 resulted in total loss or major mitigation of synchronized theta ­oscillations19,20.
                                              Based on their cellular and subcellular expression pattern and functional contribution to dendritic resonance
                                              phenomena, voltage-gated ­Ca2+ channels (VGCCs) represent key components in theta genesis though the exact
                                              mechanisms remain to be ­determined21,22. One VGCC entity proven to be involved in theta genesis is the high-
                                              to mid voltage-activated (HVA, MVA) ­Cav2.3 R-type ­Ca2+ ­channel14,23–25. Tai et al. early suggested that ­M1/M3
                                              muscarinic acetylcholine receptor (mAChR) activation via carbachol can trigger synchronized hippocampal
                                              theta oscillations through the G ­ q/11, PLCβ1, and PKC-mediated stimulation of C        ­ av2.3 R-type V  ­ GCCs26–29. Impor-
                                              tantly, theta oscillatory activity is also sensitive to divalent heavy metal ions such as nickel (­ Ni2+) which potently
                                              blocks ­Cav2.3 ­Ca2+ ­channels26,30. Notably, low micromolar concentrations of N          ­ i2+ also substantially inhibit low
                                              voltage-activated (LVA) T-type VGCCs. Thus, it remained unclear how and to which extend LVA T-type ­Ca2+
                                              channels are involved in theta genesis. Three subtypes of T-type channels have been cloned, i.e., C               ­ av3.1 (α1G),
                                            ­Cav3.2 (α1H) and ­Cav3.3 (α1I)31,32. They are widely expressed throughout the brain and serve the internal fine
                                              tuning of intracellular C ­ a2+ homeostasis, gene regulation and neuronal e­ xcitability33–37. Furthermore, T-type
                                            ­Ca2+ channels are involved in action potential generation, C        ­ a2+-dependent low-threshold currents and related
                                              rhythmic burst-firing patterns, neurotransmitter release and synaptic p          ­ lasticity31,33,38. They are also involved in
                                              several other physiological processes including sleep architecture, body weight maintenance and regulation of
                                              ­pain39–42. Disruption of T-type VGCCs has been associated with a number of neuropsychiatric disorders such
                                              as epilepsy, insomnia, depression, schizophrenia, Parkinson’s disease and chronic pain ­syndromes38. Recently,
                                              Gangadharan et al. investigated theta activity in global ­Cav3.1−/− mice and mice with specific knockdown of the
                                            ­Cav3.1 gene in the MS, focusing on potential neural mechanisms underlying exploratory behavior. Selective
                                             ­Cav3.1 inactivation in the MS augmented object exploration, whereas global ­Cav3.1 inactivation resulted in both
                                              enhanced-object and open-field e­ xploration43. Notably, only type II hippocampal theta was enhanced in the MS
                                              knockdown animals, whereas both type I and type II theta rhythms were increased in global ­Cav3.1−/− mice. This
                                              specific effect is potentially related to a strong increase in excitability of septohippocampal GABAergic neurons
                                              and a shift from the burst to the tonic firing p­ attern43. Importantly, other T-type C     ­ a2+ channels also exhibit strong
                                              expression in the septohippocampal system, particularly C     ­ av3.2 which is co-expressed with C       ­ av3.1 and sometimes
                                              even expressed at higher levels in structures related to theta g­ enesis44. In general, immunoreactivity for C            ­ av3.2
                                              is more prominent in the brain than for C     ­ av3.1. In the hippocampus, strong reactivity for C         ­ av3.2 was detected
                                              in pyramidal neurons and interneurons with a complex spatial distribution pattern on the dendritic/somatic
                                              level and the septohippocampal network level in ­general44. The expression pattern of ­Cav3.2 suggests a complex
                                              involvement in theta genesis. Previous studies have shown that C       ­ av3.2 ­Ca2+ channels are crucial for hippocampal
                                              long-term potentiation (LTP), cued-context fear conditioning tasks and passive avoidance ­strategies45. Deletion
                                              of ­Cav3.2 was further reported to promote anxiety-related behavior, to impair learning and memory and to cause
                                              reduced sensitivity to ­psychostimulants46. The present study was carried out to unravel the role of ­Cav3.2 T-type

          Scientific Reports |   (2021) 11:1099 |                   https://doi.org/10.1038/s41598-020-79763-4                                                               2

Vol:.(1234567890)
www.nature.com/scientificreports/

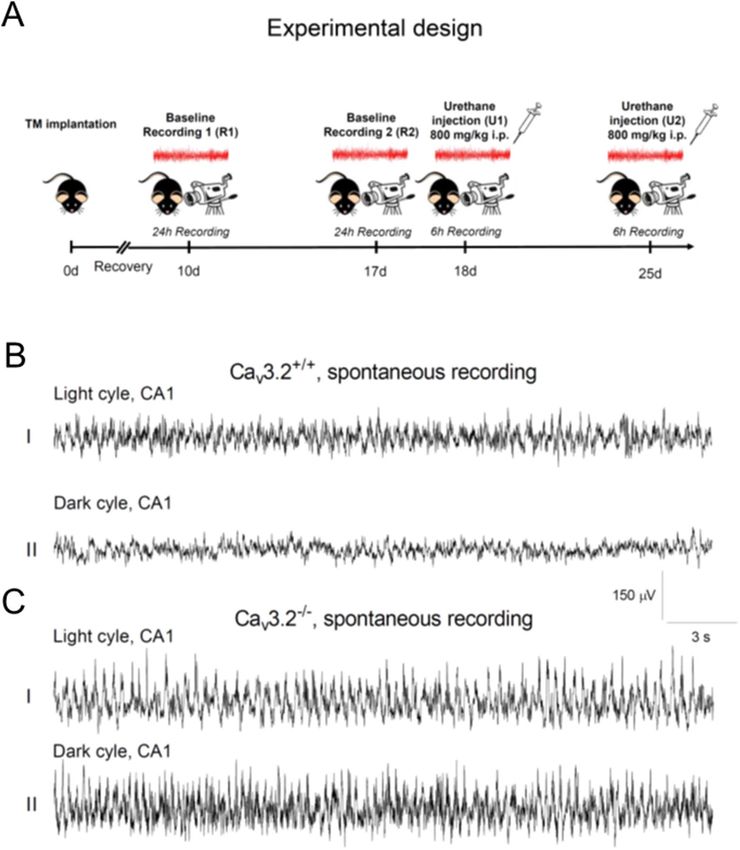
                                  Figure 1.  Experimental design and hippocampal EEG recordings from C        ­ av3.2+/+ and ­Cav3.2−/− mice. (A)
                                  Experimental design including EEG radiofrequency transmitter (TM) implantation (day 0), a 10 days recovery
                                  period, two 24 h EEG long-term recordings (R1 at day 10, R2 at day 17) and two 6 h EEG recordings following
                                  urethane injection (800 mg/kg i.p., U1 at day 18, U2 at day 25). (B,C) Representative 30 s EEG traces from the
                                  CA1 region for the light (BI,CI) and dark cycle (BII,CII) R1 long-term recording from ­Cav3.2+/+ (B) and C    ­ av3.2
                                  deficient mice (C). Note that ­Cav3.2−/− mice display prominent theta/alpha activity compared to C    ­ av3.2+/+
                                  animals, particularly during the inactive state (see “Results” section). Scale: y-axis, 150 μV; x-axis, 3 s.

                                  ­Ca2+ channels in initiation, maintenance, and modulation of hippocampal theta oscillations and the underlying
                                   molecular and electrophysiological mechanisms.

                                  Results
                                  Experimental design and representative EEG traces from ­Cav3.2+/+ and ­Cav3.2−/− mice. Cav3.2+/+
                                  and ­Cav3.2 deficient mice were implanted with a radiofrequency transmitter at day 0. After a 10 days recovery
                                  period, the first 24 h baseline recording (R1) was carried out, followed by a second 24 h long-term recording on
                                  day 17 (R2) (Fig. 1A). Both recordings were analyzed for activity, temperature and relative EEG power for the
                                  individual frequency bands. Subgroup specific analysis, including circadian rhythmicity (light/dark cycle), activ-

Scientific Reports |   (2021) 11:1099 |                https://doi.org/10.1038/s41598-020-79763-4                                                         3

                                                                                                                                                  Vol.:(0123456789)
www.nature.com/scientificreports/

                                            ity state and genotype was also performed. Following baseline recordings, type II theta oscillations were induced
                                            pharmacologically by injection of urethane (800 mg/kg i.p., U1, U2) (Fig. 1A).
                                                Representative 30 s EEG recordings from the CA1 hippocampal area of both ­Cav3.2+/+ and ­Cav3.2−/− mice
                                            are displayed in Fig. 1B,C. Recordings from ­Cav3.2+/+ mice show, i.a., typical large irregular amplitude (LIA)
                                            activity, e.g., during the light cycle (Fig. 1BI) whereas there is a general enhancement in EEG frequency during
                                            the dark cycle (Fig. 1BII). In ­Cav3.2 deficient mice, theta and alpha activity is enhanced, particularly during the
                                            non-active dark cycle (Fig. 1CII, see also Figs. 5B,C and 7B,C below).

                                            Activity profile in ­Cav3.2+/+ and ­Cav3.2−/− mice. The mean activity for the dark cycle (DC, 12 h) and
                                            light cycle (LC, 12 h) of the first (R1) and second (R2) 24 h long-term recording was analyzed for both geno-
                                            types. Note that activity parameters provided by the telemetry system represent relative counts in the horizontal
                                            plane. Mice are nocturnal animals with predominant activity and locomotion in the DC. Consequently, C           ­ av3.2+/+
                                            exhibit significantly increased activity during DC1 compared to LC1 (0.070 ± 0.010 (DC1) vs. 0.039 ± 0.003
                                            (LC1), p = 0.0084). The same holds true for ­Cav3.2−/− mice (0.078 ± 0.008 (DC1) vs. 0.042 ± 0.005 (LC1),
                                            p = 0.0034) (Fig. 2A). No significant changes were observed between both genotypes for either DC1 or LC1.
                                            Importantly, the same circadian architecture in locomotion was observed for the second 24 h baseline record-
                                            ing (R2). Again, C­ av3.2+/+ mice displayed increased relative activity in DC2 compared to LC2 (0.066 ± 0.007
                                            (DC2) vs. 0.037 ± 0.006 (LC2), p = 0.0104). The same holds true again for C    ­ av3.2−/− mice (0.075 ± 0.007 (DC2) vs.
                                            0.048 ± 0.011 (LC2), p = 0.0382) (Fig. 2B). In summary, both genotypes showed a comparable circadian activity
                                            profile which is important for interpretation of results from relative EEG power analysis outlined below.
                                                The activity profile was also analyzed post urethane injection for 6 h (U1, U2). As becomes apparent in
                                            Fig. 2C, no significant alterations between both genotypes could be detected (U1, 0.014 ± 0.003 (­ Cav3.2+/+) vs.
                                            0.018 ± 0.004 ­(Cav3.2−/−), p = 0.4433; U2, 0.019 ± 0.004 ­(Cav3.2+/+) vs. 0.016 ± 0.002 (­ Cav3.2−/−), p = 0.5281). Note
                                            that urethane does not only induce hippocampal type II theta oscillations but also hypolocomotion based on
                                            its anti-glutamatergic ­effects47.

                                            Temperature profile in ­Cav3.2+/+ and ­Cav3.2−/− mice. Besides biopotentials and activity, the TA10ETA-
                                            F20 transmitter is capable of recording body temperature. The latter were averaged for the DC and LC for both
                                            genotypes. As expected, temperature values in ­Cav3.2+/+ and ­Cav3.2−/− mice mimicked those results obtained
                                            for activity (Figs. 2A,B, 3A,B). As mice are nocturnal animals, both genotypes exhibited significant temperature
                                            increase during the DC1 compared to the LC1 of baseline recording R1 (­ Cav3.2+/+: 35.12 ± 0.13 °C (DC1) vs.
                                            34.55 ± 0.11 °C (LC1), p < 0.0001; ­Cav3.2−/−: 34.70 ± 0.24 °C (DC1) vs. 34.04 ± 0.25 °C (LC1), p = 0.0006) (Fig. 3A).
                                            No significant differences were observed within the DC1 and LC1 between both genotypes. These findings again
                                            mirror the results obtained from the activity study (Fig. 2), pointing out that no significant alterations in activ-
                                            ity architecture exists between C ­ av3.2+/+ and ­Cav3.2−/− mice. Temperature analysis of R2 confirmed results from
                                            R1 with a significant increase in DC2 compared to LC2 in both genotypes ­(Cav3.2+/+: 34.80 ± 0.18 °C (DC2) vs.
                                            34.04 ± 0.16 °C (LC2), p = 0.0002; ­Cav3.2−/−: 34.60 ± 0.28 °C (DC2) vs. 33.94 ± 0.26 °C (LC2), p < 0.0001) (Fig. 3B).
                                                Similar to the activity results post urethane injections, no alterations were observed in temperature profile
                                            in U1 (33.11 ± 0.31 °C (­ Cav3.2+/+) vs. 32.91 ± 0.36 °C (­ Cav3.2−/−), p = 0.6853) and U2 (32.88 ± 0.33 °C (­ Cav3.2+/+)
                                            vs. 32.87 ± 0.40 °C ­(Cav3.2−/−), p = 0.9809) (Fig. 3C).

                                            FFT based frequency analysis from spontaneous EEG long‑term recordings in ­Cav3.2+/+ and
                                            ­Cav3.2−/−. In both ­Cav3.2+/+ and ­Cav3.2 deficient mice, two 24 h long-term (baseline) EEG recordings (R1,
                                            R2) from the CA1 region were carried out at day 10 and day 17 post implantation of the TA10ETA-F20 transmit-
                                            ter (Fig. 1A). This regime guarantees a recovery period of 10 days, sufficient for the animals to regain standard
                                            physiological parameters, i.a., in CNS electrophysiology and circadian ­patterns48. Subsequently, an FFT based
                                            EEG frequency analysis was performed distinguishing between the LC and DC as well as the non-active (inac-
                                            tive) state (NAS) and active state (AS). EEG power values are presented as relative values (%).

                                             EEG power analysis of R1/R2 during the active state of the light cycle. Relative EEG power analysis during
                                             the LC, active state (AS) of R1 showed a significant change in σ (4.143 ± 0.279% ­(Cav3.2+/+) vs. 5.300 ± 0.286%
                                            ­(Cav3.2−/−), p = 0.0118) (Fig. 4C). No significant alterations were observed for δ1, δ2, α, θ1, θ2, β2, β3 and the γ
                                             frequency bands in R1 (Fig. 4A–E).
                                                 Analysis of the second baseline recording (R2) however, revealed a significant alteration in relative α and σ
                                             power (α, 11.481 ± 1.925% (­ Cav3.2+/+) vs. 18.258 ± 2.341% (­ Cav3.2−/−), p = 0.0421; σ, 4.090 ± 0.472% ­(Cav3.2+/+)
                                             vs. 5.398 ± 0.356% ­(Cav3.2−/−), p = 0.0441) (Supplementary Fig. 1B,C). No significant differences were observed
                                             for δ1, δ2, θ1, θ2, β1, β2, β3 and the various γ frequency bands (Supplementary Fig. 1A,B,D,E).

                                            EEG power analysis of R1/R2 during the non‑active state of the light cycle. Relative EEG power analysis during
                                            the LC, non-active state (NAS) of R1 revealed significant changes in θ2, α and σ (θ2, 34.928 ± 3.521% ­(Cav3.2+/+)
                                            vs. 45.252 ± 1.730% ­(Cav3.2−/−), p = 0.0197; α, 13.033 ± 1.309% ­(Cav3.2+/+) vs. 17.795 ± 0.794% ­        (Cav3.2−/−),
                                                                                 +/+                             −/−
                                            p = 0.007; σ, 6.208 ± 0.684% ­(Cav3.2 ) vs. 8.039 ± 0.383% ­(Cav3.2 ), p = 0.0348) in ­Cav3.2 deficient mice com-
                                            pared to ­Cav3.2+/+ (Fig. 5B,C). No significant differences could be detected for δ1, δ2, θ1, β1, β2, β3, and the vari-
                                            ous γ frequency bands between both genotypes for R1 (Fig. 5A,B,D,E). The results obtained from R1 resembled
                                            those obtained from R2 EEG recordings. Significant alterations between both genotypes were detected again in
                                            R2 for the θ2 and α relative power (θ2, 34.707 ± 4.035% ­(Cav3.2+/+) vs. 46.247 ± 1.594% ­(Cav3.2−/−), p = 0.0187;
                                            α, 12.671 ± 1.622% ­(Cav3.2+/+) vs. 18.189 ± 0.718% ­(Cav3.2−/−), p = 0.0077) (Supplementary Fig. 1B,C). No sig-
                                            nificant alterations were found for δ1, δ2, θ1, σ, β1, β2, β3, and the various γ frequency bands (Supplementary

          Scientific Reports |   (2021) 11:1099 |                 https://doi.org/10.1038/s41598-020-79763-4                                                        4

Vol:.(1234567890)
www.nature.com/scientificreports/

                                               A                                   R1 (DC, LC) Cav3.2+/+ vs. Cav3.2-/-
                                                                          0.10                                             **
                                                                                             **

                                      Mean Activity [Relative Counts]
                                                                          0.08

                                                                          0.06

                                                                          0.04

                                                                          0.02

                                                                          0.00
                                                                                 +/+ DC1          +/+ LC1        -/- DC1        -/- LC1

                                               B                                   R2 (DC, LC) Cav3.2+/+ vs. Cav3.2-/-
                                                                          0.10
                                                                                                                           *
                                       Mean Activity [Relative Counts]

                                                                          0.08
                                                                                              *

                                                                          0.06

                                                                          0.04

                                                                          0.02

                                                                          0.00
                                                                                 +/+ DC2          +/+ LC2        -/- DC2        -/- LC2

                                     C                                                U1, U2, Cav3.2+/+ vs. Cav3.2-/-
                                                                         0.030
                                 Mean Activity [Relative Counts]

                                                                         0.025

                                                                         0.020

                                                                         0.015

                                                                         0.010

                                                                         0.005

                                                                         0.000
                                                                                 +/+ U1            -/- U1        +/+ U2          -/- U2

                                     Figure 2.  Activity profile in ­Cav3.2+/+ and ­Cav3.2−/− mice. Activity profile of ­Cav3.2+/+ and ­Cav3.2−/− mice during
                                     the light cycle (LC1) and dark cycle (DC1) for the first (R1, A) and second (LC2, DC2, R2, B) 24 h long-term
                                     recording. Both genotypes exhibit significantly increased motor activity during the DC compared to the LC in
                                     both long-term recordings (R1, R2) resembling the nocturnal behavioral characteristics of mice. No differences
                                     were observed between both genotypes, neither in R1 nor in R2. (C) Activity values following both urethane
                                     injections (U1, U2, 800 mg/kg i.p. each) exhibiting no significant differences within and between the genotypes.
                                     Compared to (A) and (B), mean activity values are reduced as the multi-target drug urethane does not only
                                     induce hippocampal type II theta activity but also acts as a sedative due to its antagonistic effects at glutamate
                                     receptors. Note that mean activity data represent averaged relative counts from 2 s epochs.

Scientific Reports |   (2021) 11:1099 |                                                    https://doi.org/10.1038/s41598-020-79763-4                       5

                                                                                                                                                      Vol.:(0123456789)
www.nature.com/scientificreports/

                                             A                                   R1 (DC, LC) Cav3.2+/+ vs. Cav3.2-/-
                                                                       36.0

                                                                       35.5             ***
                                                                                                                   ***
                                                                       35.0

                                                    Temperature [°C]
                                                                       34.5

                                                                       34.0

                                                                       33.5

                                                                       33.0

                                                                       32.5

                                                                       32.0
                                                                              +/+ DC1         +/+ LC1    -/- DC1         -/- LC1

                                             B                                   R2 (DC, LC) Cav3.2+/+ vs. Cav3.2-/-
                                                                       36.0

                                                                       35.5
                                                                                        ***                        ***
                                                                       35.0
                                                  Temperature [°C]

                                                                       34.5

                                                                       34.0

                                                                       33.5

                                                                       33.0

                                                                       32.5

                                                                       32.0
                                                                              +/+ DC2         +/+ LC2    -/- DC2         -/- LC2

                                             C                                  U1, U2, Cav3.2+/+ vs. Cav3.2-/-
                                                                 33.50

                                                                 33.25
                                           Temperature [°C]

                                                                 33.00

                                                                 32.75

                                                                 32.50

                                                                 32.25

                                                                 32.00
                                                                              +/+ U1          -/- U1     +/+ U2          -/- U2

                                             Figure 3.  Temperature profile of C ­ av3.2+/+ and C
                                                                                                ­ av3.2−/− mice during the light cycle (LC) and dark cycle (DC) for the first (R1,
                                             A) and second (R2, B) 24 h long-term recording. Significantly increased motor activity during the DC (Fig. 2A,B) correlates
                                             with the circadian pattern of temperature profile in both genotypes during R1 and R2 recordings exhibiting significant
                                             differences as well. Note that the TA10ETA-F20 radiofrequency transmitters are placed subcutaneously and that averaged
                                             subcutaneous temperature values do not reflect body core temperature. However, under controlled environmental conditions,
                                             subcutaneous temperature profiles reliably parallel body core values. (C) Temperature values following both urethane
                                             injections (U1, U2, 800 mg/kg i.p. each) exhibited no significant differences within and between both genotypes. Compared to
                                             (A) and (B), mean temperature values are reduced due to hypolocomotion following urethane injection.

          Scientific Reports |   (2021) 11:1099 |                                       https://doi.org/10.1038/s41598-020-79763-4                                              6

Vol:.(1234567890)
www.nature.com/scientificreports/

                                                                                           R1 / LC / AS                                                           Cav3.2+/+
                                                                                                                                                                  Cav3.2-/-
                          A                                                                              B
                                               30                                                                                45
                                                                                                                                 40
                                               25
                          rel. EEG Power [%]                                                                                     35

                                                                                                           rel. EEG Power [%]
                                               20                                                                                30
                                                                                                                                 25
                                               15
                                                                                                                                 20
                                               10                                                                                15
                                                                                                                                 10
                                                5
                                                                                                                                  5
                                                0                                                                                 0
                                                               1                       2                                                       1                         2

                         C                                                                               D
                                               20                                                                                20

                                                                                                            rel. EEG Power [%]
                          rel. EEG Power [%]

                                               15                                                                                15

                                               10                                                                                10
                                                                                      *
                                                5                                                                                 5

                                                0                                                                                 0
                                                                                                                                           1                  2               3

                          E 15
                          rel. EEG Power [%]

                                               10

                                               5

                                               0
                                                         low               mid                high                               ripples       fast ripples

                                                Figure 4.  EEG power analysis during the active light cycle state (24 h long-term recording R1) in C
                                                                                                                                                   ­ av3.2+/+
                                                and ­Cav3.2−/− mice. Relative EEG power (%) for both genotypes is displayed for the individual frequency ranges
                                                (A–E). A significant change was observed for σ.

                                                Fig. 2A–E). Overall, these findings point to an increase in type II theta activity in ­Cav3.2−/− mice, as the latter is
                                                most prominent during alert immobility in the non-active state.

Scientific Reports |   (2021) 11:1099 |                              https://doi.org/10.1038/s41598-020-79763-4                                                                    7

                                                                                                                                                                              Vol.:(0123456789)
www.nature.com/scientificreports/

                                                                                                                                                                    Cav3.2+/+
                                                                                                 R1 / LC / NAS
                                                                                                                                                                    Cav3.2-/-

                                   A                                                                                    B                                                       *
                                                          30                                                                                    50
                                                                                                                                                45
                                                          25                                                                                    40

                                                                                                                         rel. EEG Power [%]
                                    rel. EEG Power [%]
                                                                                                                                                35
                                                          20
                                                                                                                                                30
                                                          15                                                                                    25
                                                                                                                                                20
                                                          10                                                                                    15
                                                                                                                                                10
                                                           5
                                                                                                                                                 5
                                                           0                                                                                     0
                                                                            1                       2                                                    1                      2

                                   C                                                                                     D
                                                          25                                                                                    20
                                                                         **
                                                          20
                                    rel. EEG Power [%]

                                                                                                                           rel. EEG Power [%]
                                                                                                                                                15

                                                          15
                                                                                                   *                                            10
                                                          10

                                                                                                                                                 5
                                                           5

                                                           0                                                                                     0
                                                                                                                                                     1              2               3

                                   E 10
                                                          8
                                     rel. EEG Power [%]

                                                          6

                                                          4

                                                          2

                                                          0
                                                                      low               mid               high                    ripples            fast ripples

                                                              Figure 5.  EEG power analysis during the non-active light cycle state (24 h long-term recording R1) in C   ­ av3.2+/+
                                                              and ­Cav3.2−/− mice. Relative EEG power (%) for both genotypes is displayed for the individual frequency ranges
                                                              (A–E). Significant alterations were observed for the θ2, α and σ frequency ranges (B,C). Changes in relative
                                                              theta/theta-alpha power in C ­ av3.2−/− mice during the NAS point to functional alterations in type II theta activity.

                                                              EEG power analysis of R1/R2 during the active state of the dark cycle. Relative EEG power analysis in ­Cav3.2+/+
                                                              and ­Cav3.2−/− mice revealed no significant differences in δ1, δ2, θ1, θ2, α, σ, β1, β2, β3, and the γ frequency bands

          Scientific Reports |   (2021) 11:1099 |                                  https://doi.org/10.1038/s41598-020-79763-4                                                           8

Vol:.(1234567890)
www.nature.com/scientificreports/

                                                                                     R1 / DC / AS                                                             Cav3.2+/+
                                                                                                                                                              Cav3.2-/-
                          A 30                                                                            B                     50
                                                                                                                                45
                                               25
                          rel. EEG Power [%]

                                                                                                           rel. EEG Power [%]
                                                                                                                                40
                                               20                                                                               35
                                                                                                                                30
                                               15                                                                               25
                                                                                                                                20
                                               10                                                                               15
                                                5                                                                               10
                                                                                                                                 5
                                                0                                                                                0
                                                                1                         2                                                    1                 2

                          C 25                                                                            D                     20
                          rel. EEG Power [%]

                                                                                                           rel. EEG Power [%]
                                               20
                                                                                                                                15

                                               15
                                                                                                                                10
                                               10

                                                                                                                                5
                                                5

                                                0                                                                               0
                                                                                                                                           1             2           3

                         E 12
                          rel. EEG Power [%]

                                               10
                                                8
                                                6
                                                4
                                                2
                                                0
                                                          low                mid                 high                            ripples       fast ripples

                                                 Figure 6.  EEG power analysis during the active dark cycle state (24 h long-term recording R1) in C   ­ av3.2+/+ and
                                                ­Cav3.2−/− mice. Relative EEG power (%) for the ­Cav3.2+/+ and ­Cav3.2−/− is displayed for the individual frequency
                                                 ranges (A–E). No significant alterations were detected.

                                                during R1 at the DC in the AS (Fig. 6). As for baseline recording R1, no alterations were observed for the other
                                                frequency bands (Supplementary Fig. 3).

                                                 EEG power analysis of R1/R2 during the non‑active state of the dark cycle. Relative EEG power analysis of
                                                 the dark cycle, non-active state of R1 exhibited a significant increase in θ2, α and σ in C        ­ av3.2−/− mice com-
                                                                                                   +/+                              −/−
                                                 pared to controls (θ2, 33.344 ± 3.553% ­(Cav3.2 ) vs. 42.415 ± 2.047% ­(Cav3.2 ), p = 0.0441; α, 12.878 ± 1.458%
                                                ­(Cav3.2+/+) vs. 17.287 ± 1.063% ­(Cav3.2−/−), p = 0.0284; σ, 5.762 ± 0.543% ­(Cav3.2+/+) vs. 7.214 ± 0.338% (­ Cav3.2−/−),
                                                 p = 0.0395) (Fig. 7B,C). No significant alterations were observed for δ1, δ2, θ1, β1, β2, β3, and the γ frequency bands

Scientific Reports |   (2021) 11:1099 |                               https://doi.org/10.1038/s41598-020-79763-4                                                              9

                                                                                                                                                                         Vol.:(0123456789)
www.nature.com/scientificreports/

                                                                                                               R1 / DC / NAS                                                      Cav3.2+/+
                                                                                                                                                                                  Cav3.2-/-

                                    A                        30
                                                                                                                            B 50                                                     *
                                                                                                                                                    45
                                    rel. EEG Power [%]       25

                                                                                                                            rel. EEG Power [%]
                                                                                                                                                    40
                                                             20                                                                                     35
                                                                                                                                                    30
                                                             15                                                                                     25
                                                                                                                                                    20
                                                             10                                                                                     15
                                                                  5                                                                                 10
                                                                                                                                                     5
                                                                  0                                                                                  0
                                                                                 1                         2                                                       1                  2

                                   C                        25
                                                                                 *
                                                                                                                           D 20
                                                            20

                                                                                                                               rel. EEG Power [%]
                                      rel. EEG Power [%]

                                                                                                                                                    15

                                                            15
                                                                                                          *                                         10
                                                            10

                                                                                                                                                     5
                                                                  5

                                                                  0                                                                                  0
                                                                                                                                                               1            2             3

                                      E 10
                                                                  8
                                             rel. EEG Power [%]

                                                                  6

                                                                  4

                                                                  2

                                                                  0
                                                                            ow                 mid                high                               ripples       fast ripples

                                                                  Figure 7.  EEG power analysis during the non-active dark cycle state (24 h long-term recording R1) in C    ­ av3.2+/+
                                                                  and ­Cav3.2−/− mice. Relative EEG power (%) for ­Cav3.2+/+ and ­Cav3.2−/− animals is displayed for the individual
                                                                  frequency ranges (A–E). In ­Cav3.2−/− mice, significant increases were observed in θ2, α and σ relative power
                                                                  (B,C). These alterations point to a functional involvement of ­Cav3.2 in type II theta activity.

                                                                  (Fig. 7A,B,D,E). Similar results were detected in the second baseline recording R2. A statistical increase in rela-
                                                                  tive EEG power was again detected in θ2 (33.516 ± 4.177% ­(Cav3.2+/+) vs. 44.078 ± 1.882% ­(Cav3.2−/−), p = 0.0370)
                                                                  and α (12.586 ± 1.675% ­(Cav3.2+/+) vs. 18.159 ± 1.030% ­(Cav3.2−/−), p = 0.0132). No significant changes occurred
                                                                  in δ1, δ2, θ1, σ1, β1, β2, β3 and the γ frequency bands (Supplementary Fig. 4A–E). These findings again point to an
                                                                  increase in type II theta activity in ­Cav3.2−/− mice, likely to be related to alert immobility in the non-active state.

          Scientific Reports |   (2021) 11:1099 |                                       https://doi.org/10.1038/s41598-020-79763-4                                                            10

Vol:.(1234567890)
www.nature.com/scientificreports/

                                       In summary, a consistent finding from EEG power analysis turned out to be an increase in θ2 and α activity
                                   during the non-active state of both the light and dark cycles of R1 and R2 in the in ­Cav3.2 deficient animals. This
                                   alteration in the hippocampal CA1 theta/alpha band resembles those findings observed for ­Cav3.1 knock-out
                                  ­mice43.

                                    EEG power analysis in ­Cav3.2+/+ and ­Cav3.2−/− mice following urethane administration. Ure-
                                    thane is a multi-target drug that exerts sedative/hypnotic effects leading to hypolocomotion. At higher dosages
                                    (~ 2 g/kg i.p.), urethane is used to induce slow-wave sleep. In our study, lower dosages of urethane were used
                                    (800 mg/kg i.p.) to induce hippocampal type II theta o       ­ scillations47. Baseline recordings from the CA1 region
                                                  +/+                             −/−
                                    from ­Cav3.2 mice (Fig. 8AI) and C     ­ av3.2 animals (Fig. 8BI) display characteristic LIA activity. Urethane is
                                    capable of inducing type II theta activity in ­Cav3.2+/+ mice (Fig. 8AII) and even more prominent in ­Cav3.2 defi-
                                    cient animals (Fig. 8BII).
                                        Similar to our studies of spontaneous long-term EEG recordings, we performed relative power analysis of
                                    post urethane EEGs (U1, U2) in both genotypes at day 18 and day 25 post transmitter implantation. The first
                                    urethane administration resulted in significant relative power increase in θ2 and α (θ2, 33.424 ± 3.807% ­(Cav3.2+/+)
                                    vs. 44.941 ± 1.447% ­(Cav3.2−/−), p = 0.0134; α, 10.353 ± 1.232% ­(Cav3.2+/+) vs. 14.615 ± 0.623% ­(Cav3.2−/−),
                                    p = 0.0080) (Fig. 8D,E). No significant alterations were observed for δ1, δ2, θ1, σ, and the various β and γ fre-
                                    quencies (Fig. 8C–G). Similar to the results obtained from spontaneous EEG recordings, predominately in the
                                    dark, non-active phase, ­Cav3.2−/− mice exhibited an increase in the theta/alpha range.
                                        To confirm these results, a second urethane injection was carried out at day 25 post transmitter implan-
                                    tation. Again, significant increases in relative power were monitored for θ1, θ2 and α frequency bands (θ1,
                                    24.426 ± 3.129% ­(Cav3.2+/+) vs. 31.973 ± 1.308% ­(Cav3.2−/−), p = 0.0429; θ2, 33.650 ± 3.574% ­(Cav3.2+/+) vs.
                                    46.371 ± 1.274% ­(Cav3.2−/−), p = 0.0047; α, 10.204 ± 1.020% ­(Cav3.2+/+) vs. 15.180 ± 0.597% ­(Cav3.2−/−), p = 0.0008)
                                    (Supplementary Fig. 5B,C).
                                        As for both 24 h long-term EEG recordings, the urethane studies (U1, U2) clearly confirm an increase in θ2
                                    and α activity in the CA1 hippocampal area in C     ­ av3.2 deficient mice.
                                        In order to get a closer insight into the hippocampal theta/alpha architecture of ­Cav3.2+/+ and ­Cav3.2−/− mice,
                                    we analyzed power spectrum density (PSD) plots for theta/alpha peak frequencies. Representative PSD plots for
                                    both genotypes from the baseline and post-urethane state are depicted in Fig. 9A. Notably, the peak frequency
                                    was increased in ­Cav3.2−/− mice under baseline conditions (6.598 ± 0.300 Hz ­(Cav3.2+/+) vs. 7.676 ± 0.108 Hz
                                  ­(Cav3.2−/−), p = 0.0045, Fig. 9B). The same held true for the post urethane peak frequency (5.134 ± 0.279 Hz
                                   ­(Cav3.2+/+) vs. 6.081 ± 0.279 Hz (­ Cav3.2−/−), p = 0.0324, Fig. 9C).
                                        These findings indicate that there is not only an increase in theta/alpha activity in ­Cav3.2−/− mice but also a
                                    shift in theta peak frequency and thus in global theta architecture.

                                  Transcriptional alterations in the hippocampus of ­Cav3.2 deficient mice. To gain insight into the
                                   mechanisms of theta/alpha augmentation in ­Cav3.2−/− mice, we performed qPCR analysis of gene candidates
                                   (Table 1). These genes were previously detected in a transcriptome analysis from the hippocampi of C       ­ av3.2+/+ and
                                          −/−      49                        −/−
                                  ­Cav3.2 ­mice . Importantly, ­Cav3.2 mice exhibited a significant decrease in transcript levels for dynein light
                                   chain Tctex-Type 1 (Dynlt1b) by a fold change (FC) of − 5.208 (p = 0.0002) (Fig. 10B, Table 2).
                                      As the dynein related transportome complex is involved in the transport of GABA receptors, we expanded our
                                   qPCR study including the GABA A receptor delta subunit (Gabrd), GABA A receptor gamma subunit (Gabrg2),
                                   GABA B1 receptor subunit (Gabbr1) and the GABA B2 receptor subunit (Gabbr2). In ­Cav3.2−/− mice, a significant
                                   decrease was observed for Gabrd (FC, − 1.385; p = 0.015; Fig. 10H, Table 2) and Gabbr1 (FC, − 1.105, p = 0.010,
                                   Fig. 10J, Table 2). These findings correlate with the decrease in dynein light chain Tctex-Type 1 transcripts sug-
                                   gesting an overall reduction in the GABA receptor transportome complex and synaptic/extrasynaptic GABA
                                   receptor density in the hippocampus, particularly in the hippocampal interneurons.
                                      To exclude that other T-type VGCCs contribute to the theta/alpha phenotype in ­Cav3.2 deficient mice, we also
                                   checked for compensatory alterations in C      ­ av3.1 and C­ av3.3 ­Ca2+ channel transcripts. Notably, no changes were
                                   observed between both genotypes, which further stresses the idea that the theta/alpha alterations in transgenic
                                   mice are due to C  ­ av3.2 ablation itself (Fig. 10, Table 2).

                                  Discussion
                                   VGCCs play a key role in the generation of theta oscillations in dendrites of hippocampal pyramidal c­ ells12,
                                   associated with various movement related ­behaviors50, learning tasks and memory ­processing51,52. The septohip-
                                   pocampal circuitry involved in theta genesis acquires innervation from various brain regions to code motor and
                                   sensory information p   ­ rocessing6,50,53, and can trigger the regulation of theta/alpha waves in relation to specific
                                   behavioral conditions. Recently, Gangadharan et al. reported that ablation of ­Cav3.1 VGCCs results in increased
                                   theta activity probably based on tonic inhibition of hippocampal GABAergic interneurons via septal GABAergic
                                   interneurons. The latter was hypothesized to disinhibit hippocampal pyramidal neurons and to cause increased
                                   theta ­activity43.
                                       Although ­Cav3.1 is prominently expressed in the septohippocampal system, the expression of C         ­ av3.2 clearly
                                  ­predominates34,44. Therefore, we investigated the role of ­Cav3.2 in the generation and architecture of theta/alpha
                                   activity in C­ av3.2 deficient mice. Previous studies had suggested a complex phenotype upon C         ­ av3.2 ablation
                                   including, i.a., impaired memory formation and elevated a­ nxiety46. Decreased memory function in C      ­ av3.2−/− mice
                                   was originally described using two hippocampal recognition settings, i.e., the novel object recognition (NOR)
                                   and spatial object recognition (SOR) testing. The C     ­ av3.2−/− mice did not exhibit preference for the novel or the
                                   relocated object compared to wild type animals. Importantly, this altered response was not due to an impairment

Scientific Reports |   (2021) 11:1099 |                 https://doi.org/10.1038/s41598-020-79763-4                                                       11

                                                                                                                                                     Vol.:(0123456789)
www.nature.com/scientificreports/

                                                                                                    Urethane 1                                                  Cav3.2+/+
                                                                                                                                                                Cav3.2-/-
                                                                                                                                                            *
                                            C                       40                                      D                       50
                                                                    35                                                              45
                                                                                                                                    40
                                                                                                              rel. EEG Power [%]
                                               rel. EEG Power [%]

                                                                    30
                                                                                                                                    35
                                                                    25                                                              30
                                                                    20                                                              25
                                                                    15                                                              20
                                                                                                                                    15
                                                                    10
                                                                                                                                    10
                                                                     5                                                               5
                                                                     0                                                               0
                                                                               1               2                                                1           2

                                            E                       20     **                               F                       20
                                               rel. EEG Power [%]

                                                                                                               rel. EEG Power [%]

                                                                    15                                                              15

                                                                    10                                                              10

                                                                     5                                                               5

                                                                     0                                                               0
                                                                                                                                            1           2         3

                                            G                       14

                                                                    12
                                               rel. EEG Power [%]

                                                                    10

                                                                     8

                                                                     6

                                                                     4

                                                                     2

                                                                     0
                                                                         low          mid          high      ripples                     fast ripples

                                            Figure 8.  Frequency analysis in C­ av3.2+/+ and ­Cav3.2−/− mice following urethane (800 mg/kg i.p.) injection
                                            (U1). (A) CA1 EEG traces (30 s) from ­Cav3.2+/+ and ­Cav3.2−/− mice. Prior to urethane injection, baseline
                                            recordings (AI,BI) display characteristic large irregular activity (LIA). Following urethane administration
                                            (AII,BII), the EEG exhibits prominent theta oscillations in C­ av3.2−/− mice (BII). Scale: y-axis, 200 μV; x-axis,
                                            3 s. (C–G) Relative EEG power (%) for ­Cav3.2+/+ and ­Cav3.2−/− mice is displayed for the individual frequency
                                            ranges (A–E). Urethane which is used to induce atropine sensitive type II theta oscillations, caused a significant
                                            increase in θ2 and α relative EEG power (D,E).

          Scientific Reports |   (2021) 11:1099 |                                  https://doi.org/10.1038/s41598-020-79763-4                                               12

Vol:.(1234567890)
www.nature.com/scientificreports/

                                  A             1 10 -5                                                                        Cav3.2+/+ Baseline
                                                                                                                                Cav3.2+/+ Urethane
                                                                                                                                Cav3.2-/- Urethane
                                                8 10 -6
                                                                                                                                Cav3.2-/- Baseline

                                  Voltage (V)
                                                6 10 -6

                                                4 10 -6

                                                2 10 -6

                                                      0
                                                           0   1                      2   3   4   5   6   7   8   9   10 11 12 13 14 15 16
                                                                                                      Frequency (Hz)

                                                                                                          Baseline
                                                      B
                                                                                      8
                                                                                                             **
                                                                                      7
                                                                Peak Frequency [Hz]

                                                                                      6
                                                                                      5
                                                                                      4
                                                                                      3
                                                                                      2
                                                                                      1
                                                                                      0
                                                                                              Cav3.2+/+                 Cav3.2-/-

                                                     C                                8
                                                                                                          Urethane
                                                                                      7                      *
                                                               Peak Frequency [Hz]

                                                                                      6
                                                                                      5
                                                                                      4
                                                                                      3
                                                                                      2
                                                                                      1
                                                                                      0
                                                                                              Cav3.2+/+                Cav3.2-/-

                                  Figure 9.  Altered theta architecture in ­Cav3.2−/− mice. (A) Power spectrum density (PSD) plots obtained from
                                  representative 30 s EEG traces from baseline and post urethane states from both genotypes. (B,C) PSD plots
                                  from the baseline (B) and post urethane state (C) were analyzed for peak frequencies in the range of 0–16 Hz.
                                  Under both baseline and post urethane conditions, C  ­ av3.2−/− mice exhibited a significant increase in theta peak
                                  frequencies.

                                  of the exploratory ­drives46. Interestingly, the spatial working memory remained unaltered in ­Cav3.2 deficient
                                  mice. The same held true for motor skill learning. Furthermore, behavioral studies in the elevated plus maze
                                  and open field test strongly underlined a functional implication of ­Cav3.2 VGCCs in anxiety-related ­behaviors46.
                                      Given these findings and the fact that C­ av3.2 VGCC expression outnumbers C    ­ av3.1 expression in the septohip-
                                  pocampal ­system44, we analyzed the role of ­Cav3.2 in theta genesis and theta architecture relevant for memory
                                  formation. Using implantable EEG radiotelemetry from the hippocampal CA1 region and frequency analysis,
                                  we elaborated that ­Cav3.2 ­Ca2+ channels substantially contribute to atropine-sensitive type II theta oscillations
                                  and modulate theta architecture. Thus, this is the first direct functional link between C   ­ av3.2 VGCCs and rodent
                                  theta oscillation in vivo. Importantly, the significant increase in θ2 and α relative EEG power was observed dur-
                                  ing the NAS of the LC as well as the DC of R1 and R2 and also U1 and U2. The NAS is characterized, i.a., by
                                  alert immobility, a physiological state known to exhibit hippocampal type II theta activity. Consequently, theta
                                                 ­ av3.2−/− mice are likely to be related to atropine-sensitive type II theta. These findings are further
                                  alterations in C
                                  confirmed by our urethane injections studies. Pharmacodynamically, urethane serves as a multi-target drug with
                                  both agonistic and antagonistic effects on various ligand- and voltage-gated ion channels. Whereas muscarinic
                                  and nicotinic AChRs, GABA A receptors, and glycine receptors are stimulated upon urethane injection, NMDA
                                  and AMPA receptors are ­inhibited54,55. Urethane is known to induce type II theta activity and C        ­ av3.2−/− mice

Scientific Reports |   (2021) 11:1099 |                                                   https://doi.org/10.1038/s41598-020-79763-4                     13

                                                                                                                                                     Vol.:(0123456789)
www.nature.com/scientificreports/

                                             Gene        Forward primer (5′–3′)                Reverse primer (5′–3′)
                                             Htr2ca      CGG​TTC​AAT​TCG​CGG​ACT​AAGG​         GGT​CAT​TGA​GCA​CGC​AGG​TAGT​
                                             Dynlt1ba    GAA​GAA​CGG​TGC​TGG​GTT​ACAC​         CAG​ATG​GAC​AGT​CCG​AAG​GTAC​
                                             Atp5a       CCT​ACA​GCT​ATT​CAG​AGT​GTG​AAA​      AAA​ACC​ACA​TCC​ACA​CCT​CAGTG​
                                             Nnata       GTG​GTG​GAG​GAA​GAG​GGT​TAAG​         CAC​ATT​TTG​GGG​AGG​GCT​TTCG​
                                             Gabrdb      TCA​AAT​CGG​CTG​GCC​AGT​TCCC​         GCA​CGG​CTG​CCT​GGC​TAA​TCC​
                                             Gabrg2b     ACT​TCT​GGT​GAC​TAT​GTG​GTGAT​        GGC​AGG​AAC​AGC​ATC​CTT​ATTG​
                                             Gabbr1a     CGT​GGG​ACT​TTT​CTA​TGA​GACCG​        GAA​CCA​GTT​GTC​AGC​ATA​CCACC​
                                             Gabbr2      GGA​ACA​CTG​CGA​AAA​CAC​CC            ACC​GAA​CAA​CAT​GAG​GAG​CC
                                             Cacna1ga    GAC​CAT​GTG​GTC​CTC​GTC​ATCA​         TTT​CAG​CCA​GGA​AGA​CTG​CCGT​
                                             Cacna1ia    GTC​TTC​ACC​AAG​ATG​GAC​GACC​         ACT​TCG​CAC​CAG​TCA​GGC​TTGT​
                                             Llph        TGT​TGT​CTC​TCA​GGT​GAA​GCAT​         CCC​CGT​CCA​CTC​TGA​GGA​TA
                                             Hprtc       GCT​GGT​GAA​AAG​GAC​CTC​T             CAC​AGG​ACT​AGA​ACA​CCT​GC
                                             Actbb       GTC​CAC​ACC​CGC​CAC​CAG​TTCG​         ATG​CCG​GAG​CCG​TTG​TCG​AC

                                            Table 1.  Sequences of primer pairs used for qPCR. a OriGene Technologies; bMendu S.K. et al., PLoS One.
                                            2012;7(8):e42959; cWeiergräber M. et al., Basic Res Cardiol. 2005 Jan;100(1):1–13.

                                             again revealed an increase in the relative EEG power in the theta/alpha band and the theta peak frequencies
                                             in this pharmacological setting. Notably, motor activity can have an important impact on theta I/theta II dis-
                                             tribution. It is thus important to stress that both C   ­ av3.2+/+ and C­ av3.2−/− mice display characteristic circadian
                                             activity profiles. No differences in activity were observed between both genotypes indicating that alterations in
                                             the hippocampal θ2 and α band are not related to alterations in locomotion. It should be noted that besides the
                                             consistent changes in the θ2 and α frequency bands in R1, R2, U1 and U2, inconsistent alterations were observed
                                              for α and σ bands during the LC of the AS in R1 and R2 and for θ1 in U1 and U2. No changes were detected for
                                              the AS of the DC in R1 and R2.
                                                  Anxiety related behavior is another aspect that might influence hippocampal type II theta activity associated
                                              with alert immobility. Anxiety analysis in ­Cav3.2−/− mice using the light/dark conflict test/context56 and sponta-
                                              neous exploratory behavior analysis via open field test and the elevated-plus maze (EPM) suggested increased
                                              anxiety in ­Cav3.2−/− mice not associated with repetitive and compulsive ­behaviors46. Importantly, these results
                                              contrast with a previous study from Choi et al. pointing out a lack of anxiety-related behavior in C          ­ av3.2−/− mice
                                             using the light/dark conflict ­test57. This apparent discrepancy might be due to the genetic background of the
                                            ­Cav3.2−/− ­mice58 and the behavioral procedure used in the two ­studies43,56,57,59–61. Also, increased anxiety does not
                                             necessarily coincide with an increase in theta activity. Ablation of the septal PLCβ4 isoform for example caused
                                             attenuated type II theta rhythm but increased ­anxiety14,19,62. Thus, θ2 and α alterations in ­Cav3.2 deficient mice
                                             do not seem to be attributable to potential changes in anxiety levels.
                                                  Next, we investigated the molecular mechanisms underlying the theta/alpha related changes in C           ­ av3.2−/− mice.
                                              In general, VGCCs are crucial for LTP, learning and memory f­ unctions63–66. Disruption of T-type C             ­ a2+ channel
                                             activity was shown to severely change the induction and maintenance of LTP in the hippocampus, visual cortex
                                             and ­cerebellum45,67,68. Furthermore, T-type C  ­ a2+ channels interfere with the neurotransmitter release machinery
                                             and modulate synaptic ­transmission69–71. Recently, Gangadharan et al. found that ­Cav3.1−/− mice exhibit increased
                                              type II theta activity. This increase was related to a shift in the firing pattern of septal GABAergic interneurons
                                              from the burst mode to the tonic mode. LVA T-type ­Ca2+ channels are known to mediate low-threshold ­Ca2+
                                             spikes and burst a­ ctivity72–74. Thus, ablation of C­ av3.1 resulted in tonic inhibition of hippocampal GABAergic
                                             interneurons via projecting septal GABAergic interneurons. Subsequent perisomatic disinhibition of hippocam-
                                             pal pyramidal neurons was supposed to enhance theta activity in C        ­ av3.1−/− ­mice43,75,76. Given the fact, that C
                                                                                                                                                                     ­ av3.2
                                             expression outnumbers the expression of C     ­ av3.1 in the septohippocampal s­ ystem44, we hypothesized that C        ­ av3.2
                                             ablation causes a similar sequence of septal GABAergic tonic inhibition and disinhibition of pyramidal cells as
                                             observed in C ­ av3.1−/− mice. To confirm this mechanism of action in C       ­ av3.2−/− mice, we had a closer look at the
                                              functional aspects of the septohippocampal system once again. We first investigated the outcomes of our previ-
                                              ous transcriptome analysis from the hippocampus of C        ­ av3.2+/+ and C­ av3.2−/− ­mice49. qPCR analysis revealed a
                                             significant reduction in dynein light chain Tctex-Type 1 (Dynlt1b) in C         ­ av3.2−/− mice. The dynein light chain is
                                              part of a GABA receptor transportome complex mediating the translocation of GABA receptors to the subsyn-
                                              aptic or extrasynaptic m ­ embrane77–79. This was a first indication that the GABAergic system is indeed altered in
                                              the septohippocampal system of ­Cav3.2 deficient mice. Therefore, we next analyzed transcript levels of GABA A
                                              and GABA B receptors. In ­Cav3.2−/− mice, transcript levels for the GABA A receptor δ subunit and the GABA ­B1
                                             receptor subunit were significantly reduced. These findings strongly support our GABA hypothesis of enhanced
                                             θ2/α activity in C­ av3.2−/− mice, as GABA A receptor-mediated inhibition within the CNS occurs by fast synaptic
                                              transmission and sustained tonic ­inhibition80,81. As observed in dentate gyrus granule cells and thalamic neurons,
                                              extrasynaptically located GABA A receptors that contain, e.g., δ subunits, mediate tonic current that is relevant
                                              for neuronal/interneuronal excitability in response to ambient GABA c­ oncentrations82–84. On the other hand,
                                             GABA B1-subunit containing receptors can be detected within dendritic spines and mediate slow postsynaptic
                                             ­inhibition85,86.

          Scientific Reports |   (2021) 11:1099 |                  https://doi.org/10.1038/s41598-020-79763-4                                                            14

Vol:.(1234567890)
www.nature.com/scientificreports/

                                                                                                                                       Cav3.2+/+
                                                                                                                                       Cav3.2-/-

                          A                                Atp5                              B                   Dynlt1b

                                                                                                                       ***

                                     1                                                         1
                             CNRQ

                                                                                       CNRQ
                                  0.1                                                        0.1

                                                          Htr2c                                                      Llph
                         C                                                                  D

                                                                                               1
                            CNRQ

                                                                                       CNRQ
                                     1

                                  0.1                                                        0.1

                          E                                Nnat                              F                  Cacna1g

                                     1                                                         1
                            CNRQ

                                                                                       CNRQ

                                  0.1                                                        0.1
                                  Figure 10.  qPCR analysis of candidate genes obtained from hippocampal transcriptome data in C    ­ av3.2+/+
                                   and ­Cav3.2−/− mice. Hippocampal transcriptome experiments were carried out previously. The following gene
                                  candidates potentially relevant for hippocampal theta oscillations were analyzed using qPCR: (A) ATP synthase,
                                  ­H+ transporting, mitochondrial F0 complex, subunit G (Atp5), (B) dynein light chain Tctex-Type 1 (Dynlt1b),
                                   (C) 5-hydroxytryptamine receptor 2C (Htr2c), (D) LLP homolog, long-term synaptic facilitation (Aplysia)
                                   (Llph), (E) Neuronatin (Nnat), (F) ­Cav3.1 (Cacna1g), (G) ­Cav3.3 (Cacna1i), (H) GABA A receptor delta subunit
                                  (Gabrd), (I) GABA A receptor gamma subunit (Gabrg2), (J) GABA B1 receptor subunit (Gabbr1), (K) GABA
                                   B2 receptor subunit (Gabbr2). A significant decrease in transcript levels was observed for Dynlt1b, Gabrd and
                                   Gabbr1 in ­Cav3.2−/− mice (B,H,J).

Scientific Reports |   (2021) 11:1099 |               https://doi.org/10.1038/s41598-020-79763-4                                               15

                                                                                                                                           Vol.:(0123456789)
www.nature.com/scientificreports/

                                                                                                                                                     Cav3.2+/+
                                                                                                                                                     Cav3.2-/-

                                   G                            Cacna1i                                 H                       Gabrd
                                                                                                                                  *

                                            1                                                              1
                                   CNRQ

                                                                                                   CNRQ
                                           0.1                                                          0.1

                                       I                        Gabrg2                                    J                    Gabbr1
                                                                                                                                      *
                                            1                                                              1

                                                                                                   CNRQ
                                   CNRQ

                                           0.1                                                          0.1

                                    K                           Gabbr2

                                            1
                                   CNRQ

                                           0.1
                                            Figure 10.  (continued)

                                                Importantly, we have no indication from our own microarray analysis or qPCR studies that there are compen-
                                            satory transcriptional alterations of the other T-type ­Ca2+ channels, i.e., ­Cav3.1 and ­Cav3.3, in the hippocampus
                                            of ­Cav3.2−/− mice. Thus, the changes observed seem to be solely attributable to C  ­ av3.2 ablation itself.
                                                In summary, our qPCR findings might support the hypothesis that both postsynaptic and extrasynaptic
                                            GABA receptors are decreased upon tonic inhibition of hippocampal interneurons and that diminished plasma
                                            membrane density is due to an impaired dynein/GABA receptor containing transportome complex. Additional
                                            synaptic transporter studies and patch-clamp recordings in hippocampal slices are necessary to directly prove
                                            a potential septohippocampal disinhibition in ­Cav3.2−/− mice. It should also be noted that hippocampal fre-
                                            quency characteristics can be age and gender ­specific87–89. We decided to use males in our study to avoid any
                                            potential interference with the estrous cycle in females. Hierarchical fights as a potential source of variability

          Scientific Reports |   (2021) 11:1099 |                https://doi.org/10.1038/s41598-020-79763-4                                                  16

Vol:.(1234567890)
www.nature.com/scientificreports/

                                             Cav3.2−/−/Cav3.2+/+
                                   Gene      Fold change    p-value
                                   Atp5      − 1.155        0.161
                                   Dynlt1b   − 5.208        0.00016
                                   Htr2c     1.477          0.065
                                   Nnat      1.094          0.798
                                   Gabrd     − 1.385        0.015
                                   Gabrg2    − 1.092        0.130
                                   Gabbr1    − 1.105        0.010
                                   Gabbr2    − 1.088        0.083
                                   Cacna1g   1.018          0.798
                                   Cacna1i   − 1.168        0.130
                                   Llph      − 1.211        0.105

                                  Table 2.  Fold changes of selected microarray gene candidates from Cav3.2+/+ and Cav3.2−/− hippocampi.
                                  CNRQ values are normalized to a calibrator (see “Materials and methods” section) and statistically evaluated
                                  using the Mann–Whitney test in qBase plus software.

                                  in ­males89, are not relevant in our experimental settings as transmitter implanted mice are housed individually
                                  post implantation.
                                      Our study is the first one to prove that C
                                                                               ­ av3.2 ablation results in increased atropine sensitive type II theta
                                  activity and altered theta architecture in the CA1 region. We hypothesize that tonic inhibition of hippocampal
                                  GABAergic interneurons and subsequent disinhibition of pyramidal cells due to C     ­ av3.2 ablation might result in
                                  compensatory changes in the GABAergic system. These imply both the downregulation of the dynein containing
                                  GABA receptor transporter/trafficking complex and GABA A and B receptor complexes themselves. Notably,
                                  compensatory changes in other neuronal cell types and circuitries affecting the septohippocampal network can-
                                  not be excluded in the gobal C  ­ av3.2 knockout used in our study. Recently, Dinamarca et al.90 have shown that
                                  GABA B receptors (GBR) form complexes with amyloid precursor protein (APP). This GBR/APP complex is
                                  supposed to stabilize APP at the surface membrane and to reduce proteolysis from APP to Aβ. Impaired GABA
                                  receptor trafficking and GBR expression in C  ­ av3.2−/− mice might therefore alter APP stability in these animals.
                                  Future studies will be necessary to unravel the potential functional interdependence between T-type VGCCs,
                                  the GABAergic system and APP and its relevance in the aetiopathogenesis of Alzheimer’s disease.

                                  Methods
                                  Study animals. In this study, C
                                                                ­ av3.2+/− embryos (kindly provided by Kevin Campbell via MMRCC-Mutant
                                  Mouse Resource & Research Centers) were re-derived with C57BL/6J mice. All genotypes were obtained using
                                  random intra-strain mating. In total, eight ­Cav3.2+/+ mice (all ♂, mean age: 124 ± 1 days) and eight ­Cav3.2−/−
                                  animals (all ♂, mean age: 129 ± 4 days) were analyzed electroencephalographically. Experimental animals were
                                  housed in clear Macrolon cages type II in groups of 3–4 with ad libitum access to drinking water and standard
                                  food pellets. Mice were maintained under controlled environmental conditions using the ventilated cabinet
                                  Model 9AV125P (Tecniplast, Germany) and the UniProtect cabinet (Bioscape, Germany) with the following
                                  settings: ambient temperature 21 ± 2 °C, relative humidity 50–60%, and conventional 12 h/12 h light/dark cycle
                                  starting at 5:00 a.m.
                                      All animal experiments were carried out in accordance with the guidelines of the German council on animal
                                  care and experimental protocols were approved by the local institutional and national committee on animal
                                  care (State Agency for Nature, Environment and Consumer Protection; Landesamt für Natur, Umwelt und
                                  Verbraucherschutz, LANUV, Germany, AZ-Nr. 87-51.04.2010.A321). All animal experimentation was further
                                  conducted in line with the National Institute of Health Guide for the Care and Use of Laboratory Animals (NIH
                                  Publications No. 80-23) revised 1996 or the UK Animals (Scientific Procedures) Act 1986 and associated guide-
                                  lines, or the European Communities Council Directive of 24th November 1986 (86/609/EEC) and September
                                  22nd, 2010 (2010/63/EU). Specific effort was made to reduce the number of experimental animals and their
                                  suffering (3R strategy).

                                  Pre‑surgical management of experimental animals and transmitter implantation. For pre-
                                  surgical preparation of experimental animals including selection of mouse lines, age and gender, anesthesia,
                                  temperature support, pain management, etc. please refer to our detailed ­descriptions91,92. Further details on the
                                  transmitter implantation are provided in Refs.91–93.

                                  Intrahippocampal electrode placement for electrohippocampal recordings. For intracerebral,
                                  deep EEG recordings from the hippocampal CA1 region, the differential electrode of the TA10ETA-F20 trans-
                                  mitter (Data Science International, DSI, USA), technical specifications: weight 3.9 g, volume 1.9 cc, input voltage
                                  range ± 2.5 mV, channel bandwidth (B) 1–200 Hz, nominal sampling rate (f) 1000 Hz (f = 5 B), temperature oper-
                                  ating range 34–41 °C, warranted battery life 4 months, on–off mechanism magnetically actuated) was positioned

Scientific Reports |   (2021) 11:1099 |                  https://doi.org/10.1038/s41598-020-79763-4                                                17

                                                                                                                                               Vol.:(0123456789)
www.nature.com/scientificreports/

                                            at the following stereotaxic coordinates: (+)-lead, caudal − 2 mm, lateral of bregma 1.5 mm (right hemisphere),
                                            and dorsoventral (depth) 1.5 mm. The epidural reference electrode was positioned on the surface of the cerebel-
                                            lar cortex at the following stereotaxic coordinates: (−)-lead, bregma − 6 mm and lateral of bregma 1 mm (right
                                            hemisphere). For intracerebral recordings, the sensing lead of the transmitter was mechanically clipped to the
                                            deep ­electrode91–93. Notably, the deep tungsten electrodes (FHC, USA) are encapsuled with epoxylite with an
                                            impedance of 50–100 kΩ (measured at 1000 Hz) and a shank diameter of 250 μm. Epidural and intracerebral
                                            electrodes were fixed using glass ionomer cement (Kent Dental, Kent Express Ltd., UK) and the scalp was closed
                                            using over-and-over sutures (Ethilon, 6-0). Due to the body surface/body volume ratio, mice are highly suscepti-
                                            ble to hypothermia. Thus, supplemental warmth was given to the animals during the entire period of anesthesia/
                                            surgical procedure and the first two days post implantation using a heating pad. A detailed description of the
                                            stereotaxic EEG electrode placement and transmitter implantation was previously given by Weiergräber and
                                            ­colleagues91,92,94. For peri- and post-operative pain management, carprofen (5 mg/kg, Rimadyl, Parke-Davis/
                                            Pfizer, Germany) was injected subcutaneously. Mice were given 10 days to fully recover after surgery. This recov-
                                            ery period was determined by the finding that no alterations in basic physiological/behavioral parameters such
                                            as water and food uptake, locomotion, surface and body core temperature, etc. could be detected between radi-
                                            otransmitter-implanted, non-implanted, and sham-operated mice 10 days post ­surgery48.

                                            Confirmation of EEG electrode placement. To confirm that electrodes were positioned in the exact
                                            CA1 target area, brains were extirpated post mortem and fixed in 4% formaldehyde solution. Afterwards, brains
                                            were cut to 60 μm slices using a Vibroslice Tissue Cutter EMS 5000-MZ (Campden Instruments Limited, UK).
                                            Brain slices were stained with hematoxylin/eosin to visualize the branch canal (Supplementary Fig. 6). Mice in
                                            which EEG electrodes were not placed correctly in the defined target region were removed from the subsequent
                                            analysis.

                                            Radiotelemetric EEG data acquisition. In each experimental animal, the first 24 h baseline recording
                                            (R1) from the CA1 hippocampal region (electrohippocampogram) was obtained at day 10 post surgery.
                                                This recovery period is based on the observation that 10 days post surgery no differences in physiological
                                            parameters between transmitter implanted, non-implanted, and sham-operated animals could be d           ­ etected48,95.
                                                A second 24 h long-term baseline recording (R2) was conducted at day 17 post implantation to check whether
                                            potential alterations in relative EEG frequency range power are robust over time or whether there are develop-
                                            mental ­changes96–98 (Fig. 1A).
                                                In addition, two EEG recordings were performed following urethane injection (U1, U2) with 800 mg/kg i.p.
                                            (Sigma, Germany, freshly dissolved in 0.9% NaCl) at day 18 and 25 after implantation, respectively.
                                                CA1 intrahippocampal EEG data were acquired using the Dataquest ART 4.2 software (Data Sciences Inter-
                                            national, DSI, USA). Note that EEG data were sampled at a nominal rate of 1000 Hz with no a priori filter cutoffs.
                                            Based on the Shannon-Nyquist theorem and limit, EEG frequency analysis was carried out up to 500 Hz (upper
                                            gamma range)99.
                                                Besides biopotentials (such as EEG), the TA10ETA-F20 transmitter also provides temperature and activity
                                            data. As the transmitter was placed in a subcutaneous pouch on the back of the experimental animal in our
                                            setting, the recorded subcutaneous temperature values do not represent body core values. However, subcutane-
                                            ous temperature data were shown to correlate with body core temperature under environmentally controlled
                                            conditions and can thus be compared within and between the individual ­genotypes91–93,100,101. Further note,
                                            that activity data are provided by the telemetry system in relative values (relative activity). These relative data
                                            represent activity in the horizontal plane and integrate trip distance, velocity and acceleration. Our EEG-activity
                                            correlation is based on a binary system with activity = 0 for the inactive state and activity > 0 for the active state.
                                            For details see a­ lso91.

                                            Analysis of electrohippocampographic EEG recordings. EEG data were exported to NeuroScore
                                             3.2.9306-1 (Data Sciences International, DSI, USA) for further Fast-Fourier Transformation (FFT) based
                                             frequency analysis in the range of 0.5–500 Hz, including the following distinctive frequency bands: delta 1
                                             (δ1, 0.5–4 Hz), delta 2 (δ2, 1–4 Hz), theta 1 (θ1, 4–8 Hz), theta 2 (θ2, 4–12 Hz), alpha (α, 8–12 Hz), sigma (σ,
                                             12–16 Hz), beta 1 (β1, 12–30 Hz), beta 2 (β2, 16–24 Hz), beta 3 (β3, 16–30 Hz), gamma low (γlow, 30–50 Hz),
                                             gamma mid (γmid, 50–70 Hz), gamma high (γhigh, 70–100 Hz), gamma ripples (γripples, 80–200 Hz), and gamma
                                             fast ripples (γfast ripples, 200–500 Hz)91–93. Note that we have included also a broader theta frequency band (theta-
                                             alpha band, θ2) in our analysis, based on the complex functional interdependence of hippocampal oscillatory
                                            ­activity12,13,102–104.
                                                 For FFT based analysis, the duration of the individual EEG epochs was determined as 2 s91–93. Mean relative
                                             EEG power (%) of the individual frequency ranges was calculated for the individual circadian stages, i.e., two
                                             dark cycles (DC1, DC2, 12 h each) and two light cycles (LC1, LC2, 12 h each), and 6 h post urethane 1 and 2
                                             injection phases (U1, U2). Potential EEG artefacts were identified by both manual inspection of the EEG and
                                             the automated artefact detection tool of Neuroscore and were eliminated for EEG relative power a­ nalysis91,92,94.
                                                 Relative activity counts and temperature data were also analyzed for baseline (R1, R2) and post urethane
                                             recordings (U1, U2) mentioned above. Importantly, activity data (active state, i.e., activity units > 0, or inactive
                                             state, i.e., activity units = 0) during the conventional 12 h/12 h light/dark cycle (starting at 5:00 a.m.) were cor-
                                             related with the relative EEG power of the individual frequency bands from the hippocampal CA1 deflection.
                                                 Data were statistically analyzed and displayed as mean ± SEM. Statistics for FFT based frequency analysis were
                                             performed using multiple Student’s t-test, corrected for multiple comparison using the Holm-Sidak approach

          Scientific Reports |   (2021) 11:1099 |                https://doi.org/10.1038/s41598-020-79763-4                                                     18

Vol:.(1234567890)
You can also read