Diversity in olfactory bulb size in birds reflects allometry, ecology, and phylogeny - mediaTUM
←
→
Page content transcription
If your browser does not render page correctly, please read the page content below
ORIGINAL RESEARCH
                                                                                                                                              published: 29 July 2015
                                                                                                                                      doi: 10.3389/fnana.2015.00102

                                             Diversity in olfactory bulb size in
                                             birds reflects allometry, ecology, and
                                             phylogeny
                                             Jeremy R. Corfield1,2* , Kasandra Price1 , Andrew N. Iwaniuk 2 , Cristian Gutiérrez-Ibáñez3 ,
                                             Tim Birkhead4 and Douglas R. Wylie 1
                                             1
                                              Department of Psychology, University of Alberta, Edmonton, AB, Canada, 2 Department of Neuroscience, University of
                                             Lethbridge, Lethbridge, AB, Canada, 3 Lehrstuhl für Zoologie, Technische Universität München, Freising-Weihenstephan,
                                             Germany, 4 Department of Animal and Plant Sciences, University of Sheffield, Sheffield, UK

                                             The relative size of olfactory bulbs (OBs) is correlated with olfactory capabilities across
                                             vertebrates and is widely used to assess the relative importance of olfaction to a
                                             species’ ecology. In birds, variations in the relative size of OBs are correlated with some
                                             behaviors; however, the factors that have led to the high level of diversity seen in OB
                                             sizes across birds are still not well understood. In this study, we use the relative size
                                             of OBs as a neuroanatomical proxy for olfactory capabilities in 135 species of birds,
                                             representing 21 orders. We examine the scaling of OBs with brain size across avian
                                             orders, determine likely ancestral states and test for correlations between OB sizes
                                             and habitat, ecology, and behavior. The size of avian OBs varied with the size of the
                          Edited by:
                                             brain and this allometric relationship was for the most part isometric, although species
                         Luis Puelles,       did deviate from this trend. Large OBs were characteristic of more basal species and
         Universidad de Murcia, Spain
                                             in more recently derived species the OBs were small. Living and foraging in a semi-
                        Reviewed by:         aquatic environment was the strongest variable driving the evolution of large OBs in
                         Paul Manger,
      University of the Witwatersrand,       birds; olfaction may provide cues for navigation and foraging in this otherwise featureless
                          South Africa       environment. Some of the diversity in OB sizes was also undoubtedly due to differences
               Alino Martinez-Marcos,
       Universidad de Castilla, Spain
                                             in migratory behavior, foraging strategies and social structure. In summary, relative
                  *Correspondence:
                                             OB size in birds reflect allometry, phylogeny and behavior in ways that parallel that
                   Jeremy R. Corfield,       of other vertebrate classes. This provides comparative evidence that supports recent
Department of Psychology, University
                                             experimental studies into avian olfaction and suggests that olfaction is an important
      of Alberta, Biological Sciences
         Building, P-217, Edmonton,          sensory modality for all avian species.
                AB T6G 2E9, Canada
                                             Keywords: olfactory bulb, comparative neuroanatomy, olfaction, sensory ecology, avian ecology
                jr.corfield@gmail.com

             Received: 08 May 2015
             Accepted: 13 July 2015          Introduction
             Published: 29 July 2015
                                Citation:    The importance of olfaction to bird ecology and behavior has largely been underplayed. In
      Corfield JR, Price K, Iwaniuk AN,      fact, early ornithologists debated if birds had a sense of smell at all (Bang and Cobb, 1968;
         Gutiérrez-Ibáñez C, Birkhead T      Roper, 1999). However, recent interest in avian olfaction is demonstrating that birds have a
          and Wylie DR (2015) Diversity
                                             fully functional olfactory system and some species rely heavily on their sense of smell for
  in olfactory bulb size in birds reflects
    allometry, ecology, and phylogeny.
                                             many tasks. (see reviews Roper, 1999; Hagelin, 2007; Caro and Balthazart, 2010; Castro et al.,
               Front. Neuroanat. 9:102.      2010). Birds use olfaction in a wide range of contexts that parallel that of mammals and other
       doi: 10.3389/fnana.2015.00102         vertebrates, including: foraging (Stager, 1964; Wenzel, 1968; Grubb, 1972), predator avoidance

Frontiers in Neuroanatomy | www.frontiersin.org                                    1                                                 July 2015 | Volume 9 | Article 102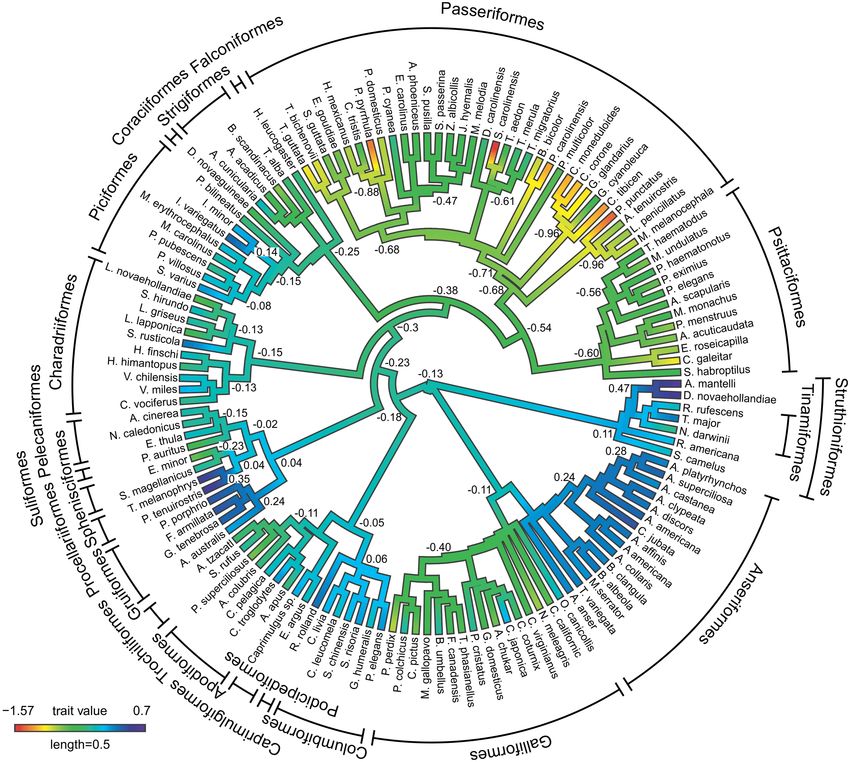
Corfield et al.                                                                                                             Olfactory bulb size in birds

(Amo et al., 2008, 2011; Roth et al., 2008; Zidar and Lovlie, 2012;          neural scaling patterns are driving the diversity in OB sizes in
Stanbury and Briskie, 2015), advertisement and mate selection                birds. However, the degree in which each of these variables has
(Balthazart and Schoffeniels, 1979; Balthazart and Taziaux,                   shaped the evolution of olfaction in birds in currently unknown.
2009; Caro and Balthazart, 2010; Amo et al., 2012; Whittaker                    Variations in the size of the OBs were first described in
et al., 2013; Caro et al., 2015), to discriminate conspecifics,               birds by Bang and Cobb (1968), who produced a data set of
consubspecifics, and sexes (Mihailova et al., 2014) and even for              OB ratio percentages (OB diameter/hemisphere diameter) in 108
territorial scent marking (Castro et al., 2010). To support these            species, which was obtained by measuring the greatest diameter
behaviors, sensitivities to odors in birds are comparable to that            of the OBs and hemispheres. They showed that the OB ratios
of some mammals (Stattleman et al., 1975; Snyder and Peterson,               ranged from over 37 in snow petrels (Pagodroma nivea) to less
1979; Smith and Paselk, 1986; Walker et al., 1986; Waldvogel,                than 5 in some Passeriformes, providing the first evidence that
1989; Clark et al., 1993).                                                   species difference in the size of OBs was functionally significant.
    The primary neural structures of the vertebrate forebrain                However, as noted by Corfield et al. (2014) and Caro et al.
involved in olfaction are the multi-layered olfactory bulbs (OBs).           (2015), the methods used in this study do not account for species
OBs vary considerable in relative size across vertebrates and                differences in brain morphology and are unlikely to provide an
in mammals and fishes this variation is not driven by the size                accurate estimate of OB size. Bang and Cobb (1968) also note that
of the rest of the brain; there is a high level of allometric                there were difficulties and inaccuracies associated with measuring
independence from the rest of the brain (Finlay and Darlington,              the “longest diameter” of organs that are not spherical. Although
1995; Finlay et al., 2001; Reep et al., 2007; Gonzalez-Voyer                 the OB measurements of Bang and Cobb (1968) have been used
et al., 2009; Yopak et al., 2010, 2015). Much of this variation              in several studies (Healy and Guilford, 1990; Zelenitsky et al.,
is correlated with an animal’s behavioral ecology, especially                2011), we developed a new data set using measurements from
those behaviors that require improved olfactory sensitivities.               histological sections, allowing for a more accurate examination
For example, larger OBs are found in nocturnal primates and                  of OB sizes across birds and for more species.
insectivores, reflecting their increased reliance on olfaction for               Using this new data set, we examine the size of OBs in
foraging and social interactions when vision is constrained under            135 species of birds, representing 21 different orders. We
low light levels (Barton et al., 1995). In birds, differences in              determine the scaling of the OBs with brain size, the effects of
foraging ecology, habitat, nesting strategy, diet, and activity              phylogeny, and diversification on OB sizes across a phylogeny
patterns have been correlated with variations in OB sizes (Bang,             and test for correlations of OB sizes with different habitats,
1971; Bang and Wenzel, 1985; Healy and Guilford, 1990; Hagelin,              ecology, and behavior. Variables such as migratory behavior and
2004; Hammock, 2005; Mackay-Sim and Royet, 2006; Buschhuter                  foraging strategies (habitat type and diet) were used because
et al., 2008; Corfield et al., 2014). This strong correlation                 there is evidence that these behaviors are mediated by olfaction
between olfactory mediated behaviors and relative OB sizes across            (e.g. Wenzel, 1968, 1971; Papi, 1982; Graves, 1992; Wallraff,
vertebrates has led to the suggestion that the size of OBs is a              2003; Bonadonna et al., 2006). There is also growing evidence
functional adaptation rather than a phylogenetic consequence                 that olfaction is widely used in social communication and
(e.g., Healy and Guilford, 1990; Gittleman, 1991; Barton et al.,             reproductive activities (see reviews Balthazart and Taziaux, 2009;
1995; Corfield et al., 2014; Yopak et al., 2015), although this has           Caro et al., 2015), therefore species were grouped by their mating
yet to be tested on a large scale among vertebrates (but see Yopak           system and social structure (group size, see below). With this suite
et al., 2010).                                                               of analyses, we demonstrate what factors have led to the diversity
    Although it is clear that variations in OB sizes in birds can            of OB sizes in extant birds and provide novel insight into the
be attributed to aspects of their behavioral ecology, there is also          potential importance of olfaction in different avian lineages.
a trend for more basal species, such as Apterygiformes (kiwi),
and Anseriformes (ducks), to have larger OBs (Bang and Cobb,
1968; Wenzel, 1971). This led to the conclusion that modern birds            Materials and Methods
(neornithines) were descended from ancestors that had a heavy
reliance on olfaction, and a shift away from olfaction resulted              Specimens
from visual and vestibular sensory enhancements associated with              Data on the size of olfactory bulbs was compiled from a total
flight (Wenzel, 1971; Alonso et al., 2004; Milner and Walsh,                  of 274 brains from 135 species of birds, which represent 21
2009). Indeed, recent evidence suggests that OB sizes initially              orders. Species were grouped into orders based on Hackett
increased during non-avian maniraptoriform evolution and                     et al. (2008). Specimens were obtained post-mortem from
then further increased during basal bird and early neornithine               conservation authorities, wildlife veterinarians, and museum
evolution (Zelenitsky et al., 2011).                                         staff. Since animals were not killed to conduct this study,
    Together with phylogeny, ecology, and behavior, the rules that           no university ethics approvals were required for this research.
govern the scaling of OBs with brain/body size are also likely               Additional data were compiled from the studies of Ebinger and
to be influencing the relative sizes of OBs. Indeed, the patterns             Lohmer (1987), Boire (1989), Rehkamper et al. (1991), Alma
of neural scaling can be an important determinant of the size                and Bee De Speroni (1992), Carezzano and Bee De Speroni
of specific brain regions (Herculano-Houzel, 2009; Ribeiro et al.,            (1995), Fernandez et al. (1997), Pistone et al. (2002), Mehlhorn
2014; Corfield et al., 2015). Therefore, it is clear that many factors,       et al. (2010), Corfield et al. (2011, 2012b, 2014, 2015), Gsell
including, but not limited to, phylogeny, ecology/behavior, and              (2012), Cunningham et al. (2013), and Gutierrez-Ibanez et al.

Frontiers in Neuroanatomy | www.frontiersin.org                          2                                           July 2015 | Volume 9 | Article 102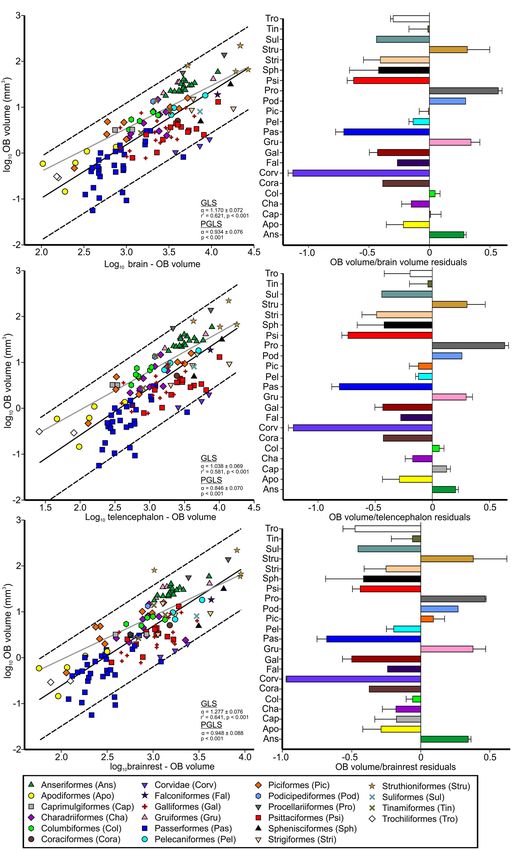
Corfield et al.                                                                                                            Olfactory bulb size in birds

(2014). Whole brain, telencephalon, and OBs sizes are included in            DMRE, Richmond Hill, ON, Canada) at 2.5× magnification.
Supplemental Table S1, which also includes the source, common                Brain, telencephalon, “brainrest” (which includes the brainstem,
names, and order for each species.                                           midbrain, thalamus, and cerebellum) and OB volumes were
   Because data is combined from multiple studies, each using                obtained directly from these images using ImageJ (1.47v, National
different fixation protocols, it is likely that some differential               Institutes of Health, USA). The border of the OB was defined
shrinkage between studies has occurred. To minimize this effect,              as the inner edge of the periventricular layer and the outer edge
we used only the relative size of a brain structure, as all regions of       of the olfactory fila and excluded the olfactory nerve. To obtain
a brain likely shrink by the same amount (Corfield et al., 2012a,             the volume of the OB, the cross-sectional area for each section
2014). Therefore, although the brain may have shrunk more in                 was added to obtain a single area, which was then multiplied
one study compared to another, the relative size of one structure            by the slice thickness (40 μm) and sampling interval. The
to another within each brain will likely be comparable between               number of sections containing the OB ranged from six sections
studies. Coefficients of variation (CV) values, based on the ratio             (spanning 240 μm) in hummingbirds (Trochiliformes) to 44 in
of log OB volume to log telencephalon volume, also suggested                 kiwi (spanning 1760 μm). To examine scaling relationships, we
that within species variation was low, ranging from 0.85 to 9.70%            plotted the log10 -transformed volume of the OBs against the
(n = 6 species). For example, in mallards (Anas platyrhynchos,               log10 -transformed; brain volume minus the volume of the OBs;
n = 4) the standard deviation was 6.5% of the mean, and in                   telencephalon volume minus the volume of the OBs; and the
ring-necked pheasant (Phasianus colchicus, n = 4) and turkey                 brainrest volume.
(Meleagris gallopavo, n = 4) the value was 6.0. The CV values                    Because phylogeny can significantly affect brain evolution
for these three species were calculated included measurements                (Harvey and Pagel, 1991), we first tested for phylogenetic signal
from Boire (1989), also suggesting that the variations between               using the phytools package in R (Revell, 2009; R Core Team,
studies was low. Further, Corfield et al. (2012a) found that for              2013) using Blomberg’s K (Blomberg et al., 2003). We found a
most species, the variation in OB measurements among studies is              significant phylogenetic signal for all variables (randomization
low and for species represented by more than one specimen, the               test, p > 0.001 for all variables); therefore, we used analyses
amount of intraspecific variation was low.                                    that accounted for phylogenetic effects. Phylogenetic trees were
                                                                             constructed based on Hackett et al. (2008) using Mesquite (v
Brain Processing                                                             2.75, Maddison and Maddison, 2011). Additional resolution
All specimens measured for this study were immersion-fixed in                 within orders were acquired for Passeriformes (Johansson
4% paraformaldehyde (PFA) in 0.1 M phosphate buffer saline                    et al., 2008), Corvidae (Ericson et al., 2005), Psittaciformes
(PBS) for at least 1 week and then cryoprotected in a 30% sucrose            (Wright et al., 2008), Anseriformes (Donne-Gousse et al., 2002),
solution in PBS until they sunk. Specimens were embedded in                  Galliformes (Wang et al., 2013), Charadriiformes (Mayr, 2011),
a 15% gelatin and 30% sucrose solution, placed into 4% PFA                   and Tinamiformes (Bertelli and Porzecanski, 2004).
overnight, and then into 20% sucrose until the block sank.                       Allometric equations were calculated using phylogenetic
The embedded brains were sectioned on a sliding freezing                     generalized least squares (PGLS) to account for phylogenetic
microtome at a thickness of 40 μm in the sagittal or coronal plane           relatedness (Garland and Ives, 2000; Garland et al., 2005). We
and sections collected in PBS with 0.01% sodium azide. Every                 applied three models of evolutionary change using the ape
second section was mounted onto gelatinized slides, dehydrated               (Paradis et al., 2004) and nlme (Pinheiro et al., 2014), packages
through a graded ethanol series, cleared in Hemo-D, stained                  in R: Brownian motion (BM), Pagel’s lambda (Pagel, 1999) and
with thionin acetate (Sigma–Aldrich) and coverslipped with                   Ornstein–Uhlenbeck (OU) (Lavin et al., 2008; Swanson and
Permount histological mounting medium (Fisher Scientific).                    Garland, 2009). Because the phylogeny was constructed from
                                                                             multiple sources, branch lengths were all set at 1, which provided
3D Modeling                                                                  adequately standardized branch lengths when checked using
For species shown in Figure 1, fiducial points were added to the              the procedures outlined in Garland et al. (1992). Unresolved
gelatin block during the embedding process to align sections for             nodes were treated as soft polytomies, with branch lengths
3D reconstructions (see details in Corfield et al., 2012b). In two            between internal nodes set to zero (Purvis and Garland, 1993).
species, Amazilia tzacatl and Scolopax rusticola, sections were              Allometric equations were based on standard statistics, and
aligned based on a template created from sections with fiducial               three evolutionary models were calculated for: (1) OB volume
points. Images of brain sections were aligned using the Alignslice           against brain volume minus OB volume; (2) OB volume against
module in AMIRA (v. 5.4.2, Visage Imaging, San Diego, CA,                    telencephalon volume minus OB volume, and (3) OB volume
USA). To create 3D reconstructions, the LabelField module in                 against brain volume minus telencephalon (brainrest). In order
AMIRA was used to segment out each brain region and the                      to test for differences in the relative size of the OB among avian
SurfaceGen module to create a 3D representation of the brain                 orders, we also ran regression models that included order as
and OBs.                                                                     a covariate. Akaike Information Criterion (AIC) was used to
                                                                             determine which model best fit the data, with the lowest AIC
Volumetric Measurements and Analysis                                         considered to be the best fit (Lavin et al., 2008). Models with AIC
Images of Nissl sections were taken using a Retiga EXi                       values that differed by less than 2 units can also be considered
FAST Cooled Mono 12-bit camera (Qimaging, Burnaby, BC,                       as having substantial support (Burnham and Anderson, 2002;
Canada) attached to a compound light microscope (Leica                       Duncan et al., 2007).

Frontiers in Neuroanatomy | www.frontiersin.org                          3                                          July 2015 | Volume 9 | Article 102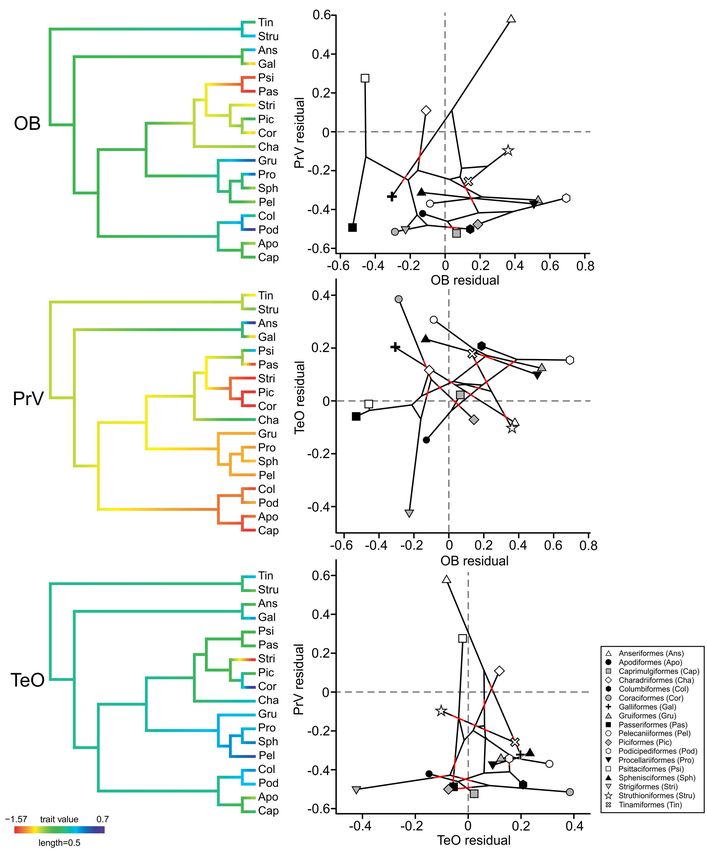
Corfield et al.                                                                                                                         Olfactory bulb size in birds

  FIGURE 1 | Gross morphology of the olfactory bulbs (OBs) in birds.             bar = 3 mm. (B) Coronal Nissl stained sections showing the OBs in four
  (A) Lateral view of 3D models of 12 representative avian species. Blue         representative avian species and illustrating the cytoarchitectural and cross
  denotes the OBs and models are organized from largest to smallest. Scale       species variation. Scale bar = 2 mm.

   To examine the scaling of the OBs with brain, telencephalon,                  their way home (e.g., Papi, 1976, 1982; Wallraff, 2004, 2013).
and brainrest, we also performed generalized least squares (GLS)                 Navigation by olfactory cues has been shown in many species
regressions using species means in JMP v. 10 (SAS Institute).                    ranging from swifts, Apus apus (Fiaschi et al., 1974), starlings,
Although GLS regression does not account for the relatedness                     Sturnus vulgaris (Wallraff et al., 1995), catbirds Dumetella
of species and treats species values as statistically independent                carolinensis (Holland et al., 2009), pigeons Columba livia
data points, it does allow for general scaling rules across birds                (Papi, 1976; Wiltschko and Wiltschko, 1992; Benvenuti and
to be established similar to those used extensively in mammals                   Ranvaud, 2004) and many seabirds (Gagliardo et al., 2013).
(Herculano-Houzel et al., 2014). GLS also provides bases from                    However, there is some skepticism with respect to olfactory
which to determine how phylogenetic relationships affect the                      mediated navigation (e.g., Gould, 2009; Jorge et al., 2009, 2010;
scaling of OBs.                                                                  Wiltschko, 2012; Blaser et al., 2013; Phillips and Jorge, 2014;
                                                                                 Wallraff, 2014), therefore determining if migration behavior
Ecological Categorization                                                        correlates with relatively large OBs might shed some light on
Ecological data was obtained for 135 species of birds and                        this argument. Larger OBs might give migratory species an
categorized on the basis of diet, migratory behavior, habitat,                   improved ability to decode and map patterns of odorants,
mating system, social structure, and flying capabilities (Cramp,                  allowing for example, locations to be mapped to olfactory
1994; del Hoyo et al., 2014).                                                    space, an aspect that is crucial for both short and long-distance
                                                                                 navigation (Jacobs, 2012). Migratory behavior was grouped
Migratory Behavior                                                               into three categories; (1) those that have regular seasonal
It has long been thought that olfaction plays some role in                       migration, normally traveling 1000s of kilometers between
navigation and homing in birds, whereby birds deduce positional                  breeding and wintering grounds. (2) those that have more
information from airborne odors carried by winds to find                          localized movement within an area, normally driven by seasonal

Frontiers in Neuroanatomy | www.frontiersin.org                              4                                                   July 2015 | Volume 9 | Article 102
Corfield et al. Olfactory bulb size in birds
changes in food supply. (3) those that are sedentary, residing (Fulica armillata and Porphyrio porphyrio melanotus), which
in a single location and normally maintaining a year round have poor flying abilities. This putative correlation may suggest
territory. that enhanced olfactory capabilities have evolved in species that
spend their entire life on or near the ground, although this has yet
Social Communication and Reproductive Behaviors to be tested on a large scale. We therefore categorized species by
Studies demonstrating the role of olfaction in sociality and their flying capabilities; (1) those that are flightless, having wings
reproduction in birds are growing and it is clear that in that are incapable of flight, (2) those with poor flight, spending
some species it plays an important role (see review, Balthazart most of the time on the ground, but are capable of short bursts of
and Taziaux, 2009; Caro and Balthazart, 2010; Caro et al., flight if disturbed or to reach roosts, (3) those that are aerial and
2015). For example; mate recognition has been demonstrated are capable of maintained flight.
in Antarctic prions (Pachyptila desolata, Bonadonna and Nevitt, To examine whether relative OB size varied significantly
2004), olfactory cues have been linked to reproductive behaviors with the behavioral categories, we used PGLS models with the
in mallards (Anas platyrhynchos, Balthazart and Schoffeniels, categories as covariates. For simplicity, we only show Pagel’s
1979; Caro and Balthazart, 2010) and the distinctive tangerine (1999) transformation as the evolutionary model, but the results
odor of crested auklets (Aethia cristatella) has been suggested were qualitatively the same when we applied other evolutionary
to play a social and reproductive role (Hagelin et al., 2003). As models. As before, AIC was used to determine which model
categories for social communication and reproductive behaviors best fit the data. Additionally, we used likelihood ratio tests to
we used: (1) social mating system, where birds were categorized compare the fit of each model against the null model (OB vs. brain
as monogamous (one mate during their lifetime) or polygamous volume).
(more than two mates), and (2) social complexity, where birds
were organized by group size, which is often used as a measure Visual and Tactile Brain Regions
of social complexity (Dunbar, 1995; Burish et al., 2004; Lehmann
It is clear from studies in fish and mammals that brain regions
and Dunbar, 2009). For social complexity, we categorized birds
compete with one another for their proportion of total brain
as: solitary (1 to 3 birds), covey (5 to 50 birds) or colonial (100s
mass (Jerison, 1973; Yopak et al., 2010). Although this has yet to
to 1000s of birds) following the scheme of Burish et al. (2004).
be tested in birds, it is possible that variation in OB sizes could
However, unlike Burish et al. (2004), we including breeding-
be as a result of the relative size of other sensory systems. For
ground gatherings in our assessment of group size; for example
example, owls have a massive thalamofugal visual pathway and
if a species is solitary for most of its life, but comes together to
large auditory nuclei, which may have resulted in their relativity
breed in groups of ∼1000, this species would be categorized as
small OBs, optic tectum (TeO) and principal sensory nucleus of
colonial. In species that gather in large groups or colonies, such
the trigeminal nerve (PrV) (Kubke et al., 2004; Iwaniuk et al.,
as most shorebirds and seabirds, chemosignals could be utilized
2006, 2008; Martin et al., 2007; Gutierrez-Ibanez et al., 2009).
for many behaviors including territoriality, attraction, individual,
Therefore, we measured the volumes of the PrV, and TeO, which
species, and kin recognition, hierarchical status, and mate-choice
receive projections from the beak (Dubbeldam, 1990) and retina
(see reviews Balthazart and Taziaux, 2009; Caro and Balthazart,
(Hunt and Webster, 1975), respectively, to determine whether
2010; Caro et al., 2015), therefore enhanced olfactory capabilities
relative OB sizes are correlated with the relative size of either of
might be expected in these species.
these brain regions. Measurements were obtained from the same
specimens that OB volumes were obtained and using the same
Foraging Strategies
method as outline above. We also included data from Gutierrez-
Olfaction is widely accepted to play a significant role in foraging
Ibanez et al. (2009, 2014) and Cunningham et al. (2013), giving us
and has been reported in a number of birds, including kiwi
data from 91 species in total. Phylogenetically corrected residual
(Apteryx australis, Wenzel, 1968, 1971), and vultures (Stager,
analysis was carried out for both PrV and TeO as above and
1964; Graves, 1992), and is also well documented in seabirds
species with positive residuals were categorized as having a large
(Grubb, 1972; Hutchison and Wenzel, 1980; Lequette et al., 1989;
brain region and those with negative as small.
Verheyden and Jouventin, 1994). We split foraging strategies
into two categories; diet and habitat type. For diet, species
were categorized into those that are carnivores, herbivores, Trait Mapping
insectivores, and piscivores. Habitat type was broadly defined as We use the contmap function of the phytools R package
either species that were (1) semi-aquatic, meaning they utilized (Revell, 2012) to visualize changes in the relative size of
the ocean, rivers, lakes, or wetlands for foraging, (2) aquatic, OBs through phylogeny. The contmap function maps a
meaning they spent most of their life in water, such as penguins, continuous trait, in this case the relative size of OB, onto
and (3) terrestrial, meaning that they live and forage almost the phylogeny by estimating the ancestral states at the
exclusively on land. internal nodes using maximum likelihood and interpolating
the states along each edge using Eq. 2 of Felsenstein (1985;
Flying Capabilities Revell, 2013). The relative size of OBs are expressed as the
In a recent study done by Corfield et al. (2014) some of the residuals of the best fitting PGLS model. Although we created
largest relative OB sizes were found in kiwi and emu (Dromaius plots for all three scaling variables, they were all nearly
novaehollandiae), both flightless and also two gruiform species identical and species values were all strongly correlated with
Frontiers in Neuroanatomy | www.frontiersin.org 5 July 2015 | Volume 9 | Article 102Corfield et al. Olfactory bulb size in birds
one another. Therefore only the plot for brain volume is OBs also significantly varied as a function of brain, telencephalon
shown. and brainrest volumes (p’s < 0.001, F’s = 184.940–237.581,
We also took the order averages of the relative size (expressed df = 1,134), and scaled with positive allometry (Figures 2A,C,E).
as the residuals of the best fitting PGLS model of each area The OBs scaled with brain volume (α = 1.170 ± 0.072,
against brain volume) of each sensory area (OB, PrV, and TeO) CI = 1.011–1.324, Figure 2A) and brainrest (α = 1.277 ± 0.076,
and used the fancyTree function of phytools (Revell, 2012) to CI = 1.126–1.458, Figure 2E) with positive allometry, suggesting
map each trait onto the phylogeny, as above. We also used this that the OBs gain volume faster than does the brainrest and
package to plot one trait against the other, while mapping the brain as a whole. The OBs scaled with the telencephalon close
phylogenetic relationship of orders. Phylogenetic relationships to isometry (α = 1.038 ± 0.069, CI = 0.883–1.183, Figure 2C).
are projected into the Cartesian space and are indicated by line Compared to a GLS approach, PGLS suggests that the OBs scaled
connections. For example, OB was plotted against the TeO, with with all three variables at a slower rate, with the telencephalon
lines collecting closely related species, such as galliforms and scaling at the slowest rate. This suggests that phylogenetic
Anseriformes. relationships among birds are effecting how the OBs scale with
brain size.
The r2 values for the OBs against brain, telencephalon, and
Results brainrest were 0.621, 0.581, and 0.64, respectively, suggesting that
some of variation in the volume of OBs cannot be explained by
OB Morphology brain, telencephalon, or brainrest volume.
There was considerable morphological variation in the relative
size and shape of OBs within and across orders (Figure 1). Scaling of the OB Within Orders
Perhaps the most divergent shape of the OBs is that of kiwi; Scaling of the OBs was examined individually for ducks
the OBs extend over the majority of the rostral telencephalon (Anseriformes), shorebirds (Charadriiformes), pigeons
and form an extensive cortex-like sheet (Figure 1, Corfield (Columbiformes), galliforms, songbirds (Passeriformes,
et al., 2014). A stalk-like or ‘pedunculated’ structure is typical with and without corvids and Cracticus tibicen), honey
of all other birds examined, although the shape and anatomical guides, woodpeckers, barbets, and toucan (Piciformes),
location differs among species, together with obvious relative parrots (Psittaciformes), and ratites + tinamous
size differences (see below). The telencephalon of the Eurasian (Struthioniformes + Tinamiformes) (Table 1). The volume
woodcock (Scolopax rusticola), for example, is pitched forward, of the OBs varied significantly as a function of the brain volume
likely due to their eyes being set far back in their head (Martin, in all orders (p < 0.05) except pigeons (p = 0.094, F = 4.776,
1994), resulting in a more ventrally placed OB. In all 33 songbird df = 1,5) and shorebirds (p = 0.164, F = 2.350, df = 1,9,
species examined, including corvids, the OBs are fused. An r2 = 0.227). In shorebirds, little of the variation in OB volumes
example of the OBs of the white-throated sparrow (Zonotrichia could be explained by brain volume (r2 = 0.227), whereas in
albicollis) is shown in Figure 1. The laminar organization of honey guides, woodpeckers, barbets, and toucan, most of the
OBs was highly conserved across the species examined in this variation could be explained by brain volume (r2 = 0.806).
study, including kiwi (Figure 1B). The external plexiform, mitral In most orders, the OBs scaled with brain, telencephalon, and
cell, internal plexiform, granule cell, and periventricular layers brainrest volume isometrically, more so than the relationship
were all visible in Nissl sections, although there were obvious across all species (Table 1). There were, however, some
differences in regards to the relative thickness and cell density of exceptions. In ducks, the OBs scale with negative allometry
layers. (Brain; α = 0.790 ± 0.135, Tel; α = 0.615 ± 0.142,
Brainrest; α = 0.787 ± 0.148), suggesting that the OBs gain
Scaling of the OB with Brain Size volume slower than the brain (especially the telencephalon)
Brain volumes ranged from 103.68 mm3 in pygmy swiftlets compared to that of other species. When all songbirds are
(Collocalia troglodytes) to 27006.26 mm3 in ostriches (Struthio included in the regression analysis, the OBs scale with brain,
camelus), constituting a 260-fold increase, whereas the volume telencephalon and brainrest volume with negative allometry
of the OBs varied from 0.06 mm3 in spotted pardalotes (Brain; α = 0.680 ± 0.174, Tel; α = 0.646 ± 0.159, Brainrest;
(Pardalotus punctatus) to 217.63 mm3 in emus, constituting α = 0.755 ± 0.205, Figure 3, Table 1). However, when corvids
a 3627-fold increase in size. When accounting for phylogeny, and the Australian magpie (Cracticus tibicen) are removed from
the volume of the OBs significantly varied as a function the analysis, the exponents shift to an isometric relationship
of brain, telencephalon, and brainrest volumes (p’s < 0.001, (Brain; α = 1.261 ± 0.315, Tel; α = 1.254 ± 0.286, Brainrest;
F’s = 3.98–39.00, Figures 2A,C,E). The OBs scaled with the α = 1.161 ± 0.356).
telencephalon with negative allometry (α = 0.846 ± 0.070,
Figure 2C), suggesting that the OBs gain volume slower than Species and Order Variations in OB Size
the telencephalon does. The exponent was closer to isometry Nearly all bird species fall inside of the 95% prediction intervals,
for the brain (α = 0.934 ± 0.076, Figure 2A) and brainrest suggesting that the OBs scale with brain size in a reasonably
(α = 0.948 ± 0.088, Figure 2E), indicative of a linear relationship predictable manner across birds (Figure 2). The only exceptions
where the OBs gain mass at the same rate as does the brainrest to this were kiwi, with hypertrophied OBs when regressed against
and brain as a whole. For GLS regressions, the volume of the brainrest, and some songbirds, which have hypotrophied OBs.
Frontiers in Neuroanatomy | www.frontiersin.org 6 July 2015 | Volume 9 | Article 102Corfield et al. Olfactory bulb size in birds FIGURE 2 | Relative size of the OBs in birds. Scatterplots of the broken lines the 95% prediction intervals and the gray lines the results from log-transformed volume of the OBs plotted as a function of either: (A) the the phylogenetic generalized least squares (PGLS) model. Symbols denote log-transformed brain volume minus the volume of the OBs, (C) the order as presented in legend. Bar graphs show the size of OBs relative to: log-transformed telencephalon volume minus the volume of the OBs or (E); (B); the brain, (D); the telencephalon; and (F) the brainrest, with bars the brainrest (brainstem, cerebellum, and thalamus) volume. The solid lines representing the order means (with SD) of the residuals derived from the indicate the results from the generalized least-squares (GLS) regression, the respective regressions. Frontiers in Neuroanatomy | www.frontiersin.org 7 July 2015 | Volume 9 | Article 102
Corfield et al.                                                                                                                              Olfactory bulb size in birds

Indeed, the residuals for the songbirds were the smallest of                           with the slightly larger OBs of magpie-larks (–0.48) likely a
all species examined in this study (Figures 2B,D,F). Parrots,                          derived trait.
penguins, owls, and galliforms were also characterized by small
OBs whereas ducks, seabirds, rails and ratites by large OBs                            Variation in OB Size in Relation to Ecology
(Figure 2).                                                                            Relative OB sizes were analyzed, while taking into consideration
    To further examine how phylogeny relates to variations                             phylogenetic relationships, to determine if variations in size
in OB sizes, we plotted the residuals of OB vs. brain (as a                            could be correlated with specific ecological variables (Figure 4).
continuous character) onto a phylogeny and determined likely                           The OB residuals for species that inhabited a semi-aquatic
ancestral states (Figure 3). In all ratites, the OBs have increased                    (median 0.25, mean 0.18) were mostly positive whereas the
in size from the predicted ancestral condition, with a further                         residuals in aquatic (median –0.44, mean –0.43) and terrestrial
increase in the ancestor of kiwi and emu (0.47). The OBs in                            (median –0.41, mean –0.40) species were mostly negative.
the three species of tinamou varied from large in the great                            A statistically significant effect was found for habitat (p = 0.008,
tinamou (Tinamous major, 0.28), to small in Darwin’s Nothura                           λ = 0.922), suggesting that semi-aquatic species have larger
(Nothura darwinii, –0.22). The OBs of all duck species have                            OBs than both aquatic and terrestrial species. The OB residuals
increased in size (0.19–0.45), however, OBs in the closely                             for species with a large PrV (median 0.30, mean 0.07) were
related galliforms are small and are reduced in size (–0.86–                           also mostly positive and larger than species with a small PrV
0.09) compared to the predicted ancestral condition. Rails and                         (median –0.14, mean –0.19), however, there was no statistically
seabirds are characterized by some of the largest OBs found in                         significant effect found for PrV size (p = 0.087, λ = 0.687).
this study (0.37–0.60), with pigeons, honey guides (Indicator sp.,                     Migratory (median –0.06, mean –0.01) and colonial (median
especially I. variegatus), Eurasian woodcock (Scolopax rusticola)                      0.14, mean 0.03) species and those that are flightless (median
and white-tufted grebe (Rollandia rolland) all characterized                           0.00, mean 0.07) and piscivorous (median –0.07, mean 0.02)
by moderately large OBs. Songbirds and parrots were clearly                            also appeared to have larger OBs than the other species in their
characterized by small OBs, with many instances where specific                          respective categories, however, there was also no statistically
species have undergone an even further reduction in OB sizes.                          significant effect found for any of these categorizes (movement;
For example; Eurasian bullfinch (Pyrrhula pyrrhula), white-                             p = 0.513, λ = 0.887, social structure; p = 0.253, λ = 0.890,
breasted nuthatch (Sitta carolinensis), Carolina chickadee (Poecile                    flight capabilities; p = 0.359, λ = 0.917, diet; p = 0.308,
carolinensis) and spotted pardalote have some of the smallest                          λ = 0.926).
relative OB sizes found in this study (–1.35, –1.57, –1.22, and –                         To explore whether the size of other brain regions that process
1.41, respectively). It appears that the common ancestor of                            sensory information may be contributing to variations in the
corvids (Corvus sp. and Garrulus glandarius), Australian magpies                       size of OBs, we used PGLS to test for correlations between the
and magpie-larks (Grallina cyanoleuca) had small OBs (–0.96),                          residuals of OBs and the PrV and TeO. There is a significant

TABLE 1 | Scaling of the olfactory bulbs (OBs) with brain, telencephalon, and brainrest for nine avian orders.

                   Ans            Cha              Col             Gal                 Pas-Corv            Pas              Pic               Psi                Stur

Brain volume
r2                 0.720          0.230            0.540           0.420               0.381               0.338            0.810             0.590              0.730
Slope              0.790          0.850            0.800           0.860               1.261               0.680            0.920             0.830              1.090
SE                 0.135          0.553            0.368           0.271               0.315               0.174            0.185             0.207              0.294
F                  34.000         2.350            4.770           10.170              15.989              15.317           24.930            16.070             13.770
p
Corfield et al. Olfactory bulb size in birds FIGURE 3 | Ancestral character estimates for OB volumes plotted onto was the relative size of OBs expressed as the residuals of the best fitting PGLS an avian phylogeny. This method uses ancestral character estimation to model of OBs against brain volume-OBs. The phylogeny is largely based on visualize historical character states for OB volumes (plotted as a continuous Hackett et al. (2008), with further resolution coming from other studies (see trait) along the branches of a tree (see methods, Revell, 2013). The trait mapped Materials and Methods). and negative correlation between the size of TeO and PrV Discussion (α = –0.217 ± 0.068, p = 0.002), suggesting that as one brain region increases in size the other decreases in size. No other Overall, the size of avian OBs varies predominately with the significant correlations were found (OB/PrV, α = 0.203 ± 0.115, size of the brain. This allometric relationship was for the most p = 0.079 or OB/TeO, α = –0.067 ± 0.062, p = 0.281), although part isometric; the OBs gain volume at the same rate as the there is some evidence to suggest a positive correlation between rest of the brain does, although there was some indication that OB and PrV size, mostly driven by ducks, which have a large PrV the OBs gain volume faster than does the brain as a whole. and also large OBs (Figure 5). Ducks had both larger PrV and A similar relationship has also been described in fish and some OB sizes compared to the closely related galliforms, whereas in mammals, although there is a tendency for a negative allometic galliforms the TeO was among the largest of any order. Parrots relationship; OBs gain mass slower than the rest of the brain and songbirds had similar small OB sizes and an average TeO, (Gittleman, 1991; Yopak et al., 2015). Another feature of the whereas parrots had a large PrV and songbirds a small PrV. OBs in mammals and fish is that they do not scale as tightly Seabirds, rails and grebes all had large OBs and TeO, whereas with brain size as other brain regions do and have a substantial their PrV was small. No orders had obvious enlargements to all level of allometric independence from the rest of the brain three brain regions. (Finlay and Darlington, 1995; Finlay et al., 2001; Reep et al., Frontiers in Neuroanatomy | www.frontiersin.org 9 July 2015 | Volume 9 | Article 102
Corfield et al. Olfactory bulb size in birds
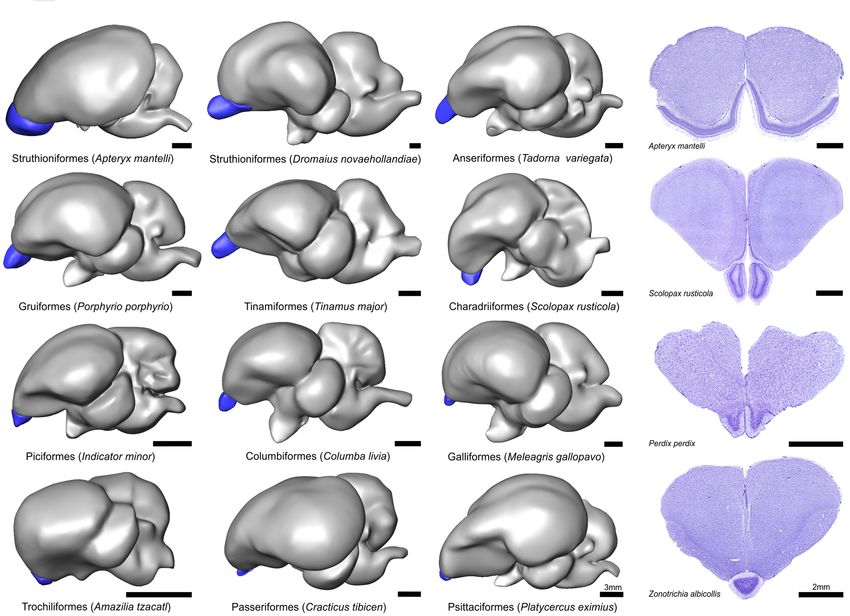
FIGURE 4 | Variation in OB sizes in relation to ecology and behavior. the second quartile and the error bars (‘whiskers’) are the first and third
Box and whisker plots show the variation in OB volumes among the different quartiles. The horizontal bar in each box represents the median, while the
ecology and behavior categories, as calculated from phylogenetically broken line indicates the mean. Asterisks indicate statistically significant
corrected residuals. For each ecological niche category, the ‘box’ represents differences (p < 0.05).
2007; Gonzalez-Voyer et al., 2009; Yopak et al., 2010, 2015). In have been inherited from early neornithines, where improved
birds too, not all of the variation in OB sizes can be explained olfaction evolved for more effective foraging and/or navigation
by brain size alone with r2 values that were between 0.58 and skills (Figure 3, Bang and Cobb, 1968; Wenzel, 1971; Zelenitsky
0.64 and the data widely scattered. Interestingly, r2 values for et al., 2011). A shift away from olfaction has then occurred in
some mammals (Carnivora = 0.80, primates = 0.56, bats = 0.85, more derived taxa during the evolution of visual and vestibular
insectivores = 0.83, Gittleman, 1991; Barton et al., 1995) and sensory enhancements association with flight (Wenzel, 1971;
fish (GLS = 0.73, PGLS = 0.69, Yopak et al., 2015) are generally Alonso et al., 2004; Milner and Walsh, 2009). Probably the most
higher than we show in birds, indicating that in birds the size of interesting feature in the evolution of OB sizes across birds is in
OBs is less dependent on the size of the rest of the brain than cases where sister taxa have diverged in OB sizes, namely between
it is in both mammals and fish. We suggest that much of this ducks and galliforms, penguins and seabirds, and honey guides
variation can be attributed to species differences in phylogeny, and woodpeckers. In these cases it is clear that there have been
habitat, sensory ecology, and behavior, as is the case in mammals opposing factors either driving the evolution of large or small
and fish (see below). OBs. In seabirds and honey guides, foraging based on olfactory
It should be noted that the study of Zelenitsky et al. (2011), cues has likely led to large OBs compared to their sister groups,
which analyzed the OB ratios of Bang and Cobb (1968), showed which forage using visual and tactile cues (see below, Isack and
that in birds the OBs are not correlated with body size and Reyer, 1989; Nevitt, 1999; Short and Horne, 2001; del Hoyo et al.,
virtually none of the variation in OB sizes is explained by body 2014). What evolutionary mechanisms have led to small OBs in
size (p = 0.26, r2 = 0.009). Why a significant correlation was galliforms is not obvious, however, in ducks large OBs may have
not found in Zelenitsky et al. (2011) could reflect the fact that evolved to utilize olfactory cues in a semi-aquatic environment
body size rather than brain size was used to examine allometric (see below). In addition to differences between taxa, there are
scaling, and also due to the methodological limitations of the also many instances where a single species within a taxa stands
Bang and Cobb data set (see Corfield et al., 2014; Caro et al., out as having either small or large OBs, such as the small OBs
2015). A study comparing the Bang and Cobb data set and the in spotted pardalotes and the large OBs in Eurasian woodcocks.
volumetric measurements obtained in the current study is indeed Such diversification in OBs size both among and within taxa
warranted to determine the validity of their methods. suggests that olfaction is highly adaptable, with increases and
Phylogenetic relationships and evolutionary history have decreases in olfactory capabilities evolving to meet the specific
undoubtedly been factors influencing the size of OBs in extant sensory demands of an ecological niche or a certain behavior.
birds (see Figure 3). It is apparent that OBs in more basal species, Of all of the ecological/behavioral variables that we tested, only
including ratites, ducks, pigeons, rails, and seabirds are generally habitat was significant; semi-aquatic species had significantly
large, whereas OBs have been reduced in more diverged taxa, larger OBs than terrestrial or aquatic species. Although a semi-
namely songbirds and parrots. Large OBs in these basal species aquatic habitat is a broad definition and indeed encompasses
Frontiers in Neuroanatomy | www.frontiersin.org 10 July 2015 | Volume 9 | Article 102Corfield et al. Olfactory bulb size in birds FIGURE 5 | Ancestral character estimates and residual plots for the and TeO) and are mapped onto the phylogeny based on Hackett et al. (2008). OBs, the principal sensory nucleus of the trigeminal nerve (PrV), and the (B) Plots showing each sensory area plotting against the other while indicating optic tectum (TeO). (A) Ancestral character estimates are plotted using the the phylogenetic relationship of species (black lines). Red lines have been added order averages for the relative size (expressed as the residuals of the best fitting to areas where the lines cross to allow for the tree branches to be more easily PGLS model of each area against brain volume) of each sensory area (OB, PrV, identified. habitats ranging from rivers, lakes, oceans and wetlands, shown in penguins (Spheniscidae), which use dimethyl sulfide these habitats may provide olfactory cues that are particularly as a behavioral cue to track upwind plankton blooms over long important for the birds that occupy them. Petrels, albatross, and distances (Culik, 2001; Cunningham et al., 2008; Wright et al., prions, for example, can detect and localize high prey abundance 2011). using the odors (dimethyl sulfide and pyrazines) produced by Interestingly, large relative OBs are not generally found phytoplankton when grazed by zooplankton as they forage out in semi-aquatic mammals and instead have smaller relative at sea (e.g., Grubb, 1972; Hutchison and Wenzel, 1980; Nevitt OBs compared to terrestrial mammals (see review Pihlström, et al., 1995; Nevitt, 2000; Nevitt and Haberman, 2003; Nevitt 2008). Relatively small OBs are found in otters (Mustelidae, and Bonadonna, 2005; Bonadonna et al., 2006; Dell’Ariccia and Radinsky, 1968; Gittleman, 1991), aquatic insectivores (Sánchez- Bonadonna, 2013). The same likely applies to other semi-aquatic Villagra and Asher, 2002), pinnipeds (Repenning, 1976; Reep and also aquatic species, however, to date this has only been et al., 2007) and also platypus (Ornithorhynchus anatinus) Frontiers in Neuroanatomy | www.frontiersin.org 11 July 2015 | Volume 9 | Article 102
Corfield et al.                                                                                                                       Olfactory bulb size in birds

(Pirlot and Nelson, 1978). Because early tetrapods evolved a                     not found in birds. However, there were instances of small OBs
new set of olfactory receptor molecules that were adapted                        in species with a large TeO and/or PrV. For example, parrots
to detecting airborne odors, mammals that moved back to                          have one of the largest PrV sizes of any bird and also some
an aquatic environment lacked the ability to detect scents                       of the smallest OBs, possibly indicating that increased beak
underwater (Freitag et al., 1995, 1998). Therefore in mammals,                   sensitivities (Gutierrez-Ibanez et al., 2009; Demery et al., 2011)
the use of olfaction in semi-aquatic and aquatic habitats is                     have led to reduced olfactory capabilities. As noted by Zelenitsky
limited and indeed in some aquatic mammals, such as toothed                      et al. (2011), the small OBs in parrots and also corvids could
whales (Odontocetes), OBs and nerves are essentially absent or                   have also resulted from the extra neural demands associated
greatly reduced (Edinger, 1955; Breathnach, 1960; Morgane and                    with their increased cognitive abilities (Emery, 2006). We do,
Jacobs, 1972; Pirlot and Kamiya, 1985; Cave, 1988; Ridgway,                      however, show a significant correlation between the size of PrV
1990; Oelschlager and Kemp, 1998; Manger, 2006). Birds too                       and TeO, suggesting that species with large PrV have small
are constrained by an ancestor that was adapted to detecting                     TeO and vise versa. This was particularly true in shorebirds,
airborne odors, and indeed species that are aquatic and forage                   where this neural trade off can be seen in difference in feeding
exclusively underwater, such as penguins and cormorants, have                    ecology; some species rely mostly on vision whereas others locate
some of the smallest relative OBs, second only to songbirds                      food with a tactile organ in their beak tips (Piersma, 2011;
(Figure 2). In these species, the opening of the external nares are              Cunningham et al., 2013). Therefore in birds, it is likely that
reduced, functionally closed or an epithelial nasal valve is present.            neural structures do compete for brain space, although OBs do
Although this is a necessary adaptation for diving underwater, it                appear to be more free to vary in size irrespective of the size of
greatly reduces airflow to the caudal nasal concha (Bang, 1971;                   other sensory structures, which is also true in fish (Yopak et al.,
Bang and Wenzel, 1985). An exception to this is, however, found                  2010, 2015).
in shearwater and diving ducks, which do not have reduced OBs,                      Overall, in birds it is clear that many factors have led to the
yet forage almost exclusively by diving.                                         diversity in OB sizes in birds. On the one hand, overall brain
    Given that semi-aquatic mammals and both aquatic mammals                     size is an important factor in shaping the size of the OBs and
and birds have poor olfactory capabilities, why then do many                     so too is an evolutionary history that points to an ancestor with
semi-aquatic birds have a good sense of smell? Certain aspects of                large OBs. On the other hand, habitat and behaviors such as
the behavioral ecology of birds, such as flight, have undoubtedly                 migration, foraging strategies, and social structure are playing a
allowed some birds to evolve chemosensitive adaptations to take                  role in driving enhancements to the olfactory system. In addition,
advantage of the olfactory cues in a semi-aquatic environment.                   the relative importance of other sensory regions needs to be
Indeed, in some semi-aquatic species an enlargement to the                       considered as there is competition for a limited amount of brain
olfactory system most certainly is a functional adaptation                       space. It can therefore be concluded that multiple factors have
associated with this habitat, providing cues for navigation (Jacobs,             in some way contributed to the diversity in OB sizes seen across
2012) and foraging in an otherwise featureless environment. The                  birds and that it is important to consider all of these variables
link between large relative OBs and a semi-aquatic environment                   before we can fully understand the mechanisms driving the
is hard to pinpoint in other species, including ducks, rails and                 evolution of olfaction. By examining the OB sizes across such
shorebirds. Indeed, based on the foraging behavior in these                      a diverse array of avian species we have helped to confirm that
species, and also the patterns observed in mammals, it would                     olfaction is indeed a functional sense in birds.
be predicted that they would have small OBs. One possibility
is that large OBs have not been driven solely by occupying a
semi-aquatic habitat, but are also due to a combination of other                 Acknowledgments
behaviors. For example in ducks, olfaction is utilized to determine
endocrine condition (Balthazart and Schoffeniels, 1979; Jacob                     Funding for this study was provided by Natural Sciences and
et al., 1979; Balthazart and Taziaux, 2009; Caro and Balthazart,                 Engineering Research Council of Canada (NSERC) Discovery
2010), could be used for determining hierarchical status when                    Grant (372237) and Accelerator Supplement (380284-2009) to
in colonials (Balthazart and Taziaux, 2009; Caro and Balthazart,                 AI, and NSERC grants to DW.
2010; Caro et al., 2015) or could be used to decode and map
patterns of odorants for long range migration (Jacobs, 2012).
    In addition to neural scaling, phylogeny and ecology/behavior,               Supplementary Material
competition for brain space is another factor that is possibly
causing variations in OB sizes among birds. Strong evidence of                   The Supplementary Material for this article can be found
an apparent tradeoff, where the size of the OBs is negativity                     online at: http://journal.frontiersin.org/article/10.3389/fnana.
or positively correlated with the size of the PrV or TeO was                     2015.00102

References                                                                       Alonso, P. D., Milner, A. C., Ketcham, R. A., Cookson, M. J., and Rowe, T. B.
                                                                                    (2004). The avian nature of the brain and inner ear of Archaeopteryx. Nature
Alma, S., and Bee De Speroni, N. (1992). Indices cerebrales y composicion           430, 666–669. doi: 10.1038/nature02706
  cuantativa encefalica en Athene cunicularia y Tyto alba. Facenas 9,            Amo, L., Aviles, J. M., Parejo, D., Pena, A., Rodriguez, J., and Tomas, G.
  19–37.                                                                            (2012). Sex recognition by odour and variation in the uropygial gland

Frontiers in Neuroanatomy | www.frontiersin.org                             12                                                 July 2015 | Volume 9 | Article 102
Corfield et al. Olfactory bulb size in birds secretion in starlings. J. Anim. Ecol. 81, 605–613. doi: 10.1111/j.1365-2656.2011. Clark, L., Avilova, K. V., and Bean, N. J. (1993). Odor thresholds in passerines. 01940.x Comp. Biochem. Physiol. A Comp. Physiol. 104, 305–312. doi: 10.1016/0300- Amo, L., Galvan, I., Tomas, G., and Sanz, J. J. (2008). Predator odour recognition 9629(93)90322-U and avoidance in a songbird. Funct. Ecol. 22, 289–293. doi: 10.1111/j.1365- Corfield, J. R., Birkhead, T. R., Spottiswoode, C. N., Iwaniuk, A. N., Boogert, N. J., 2435.2007.01361.x Gutierrez-Ibanez, C., et al. (2012a). Brain size and morphology of the brood- Amo, L., Visser, M. E., and Van Oers, K. (2011). Smelling out predators is innate in parasitic and cerophagous honeyguides (Aves: Piciformes). Brain Behav. Evol. birds. Ardea 99, 177–184. doi: 10.5253/078.099.0207 81, 170–186. doi: 10.1159/000348834 Balthazart, J., and Schoffeniels, E. (1979). Pheromones are involved in the Corfield, J. R., Wild, J. M., Parsons, S., and Kubke, M. F. (2012b). Morphometric control of sexual behaviour in birds. Naturwissenschaften 66, 55–56. doi: analysis of telencephalic structure in a variety of Neognath and Paleognath bird 10.1007/BF00369365 species reveals regional differences associated with specific behavioral traits. Balthazart, J., and Taziaux, M. (2009). The underestimated role of olfaction in avian Brain Behav. Evol. 80, 181–195. doi: 10.1159/000339828 reproduction? Behav. Brain. Res. 200, 248–259. doi: 10.1016/j.bbr.2008.08.036 Corfield, J. R., Eisthen, H. L., Iwaniuk, A. N., and Parsons, S. (2014). Anatomical Bang, B. G. (1971). Functional anatomy of the olfactory system in 23 specialisations for enhanced olfactory sensitivity in kiwi, Apteryx mantelli. Brain orders of birds. Acta Anat. 79, 1–76. doi: 10.1159/isbn.978-3-318- Behav. Evol. 84, 214–226. doi: 10.1159/000365564 01866-0 Corfield, J. R., Gsell, A. C., Brunton, D., Heesy, C. P., Hall, M. I., Acosta, Bang, B. G., and Cobb, S. (1968). Size of olfactory bulb in 108 species of birds. Auk M. L., et al. (2011). Anatomical specializations for nocturnality in a critically 85, 55–61. doi: 10.2307/4083624 endangered parrot, the Kakapo (Strigops habroptilus). PLoS ONE 6:e22945. doi: Bang, B. G., and Wenzel, B. M. (1985). “Nasal cavity and olfactory system,” in 10.1371/journal.pone.0022945 Form and Function in Birds, eds A. S. King and J. Mclelland (London: Academic Corfield, J. R., Long, B., Krilow, J. M., Wylie, D. R., and Iwaniuk, A. N. (2015). Press), 195–225. An uncoupling of the cellular scaling rules in the avian auditory system. Brain Barton, R. A., Purvis, A., and Harvey, P. H. (1995). Evolutionary radiation of visual Struct. Funct. doi: 10.1007/s00429-015-1064-1 [Epub ahead of print]. and olfactory brain systems in primates, bats and insectivores. Philos. Trans. R. Cramp, S. (1994). Handbook of the Birds of Europe, the Middle East and North Soc. Lond. B 348, 381–392. doi: 10.1098/rstb.1995.0076 Africa: The Birds of the Western Palearctic. Oxford: Oxford University Press. Benvenuti, S., and Ranvaud, R. (2004). Olfaction and homing ability of pigeons Culik, B. (2001). Finding food in the open ocean: foraging strategies in Humboldt raised in a tropical area of Brazil. J. Exp. Zool. 301A, 961–970. doi: penguins. Zoology 104, 327–338. doi: 10.1078/0944-2006-00038 10.1002/jez.a.123 Cunningham, G. B., Strauss, V., and Ryan, P. G. (2008). African penguins Bertelli, S., and Porzecanski, A. L. (2004). Tinamou (Tinamidae) systematics: a (Spheniscus demersus) can detect dimethyl sulphide, a prey-related odour. preliminary combined analysis of morphology and molecules. Ornitol. Neotrop. J. Exp. Biol. 211, 3123–3127. doi: 10.1242/jeb.018325 15(Suppl.), 1–8. Cunningham, S. J., Corfield, J. R., Iwaniuk, A. N., Castro, I., Alley, M. R., Blaser, N., Guskov, S. I., Meskenaite, V., Kanevskyi, V. A., and Lipp, H. P. (2013). Birkhead, T. R., et al. (2013). The anatomy of the bill tip of kiwi and associated Altered orientation and flight paths of pigeons reared on gravity anomalies: a somatosensory regions of the brain: comparisons with shorebirds. PLoS ONE GPS tracking study. PLoS ONE 8:e77102. doi: 10.1371/journal.pone.0077102 8:e80036. doi: 10.1371/journal.pone.0080036 Blomberg, S. P., Garland, T. Jr., and Ives, A. R. (2003). Testing del Hoyo, J., Elliott, A., Sargatal, J., Christie, D. A., and De Juana, E. (2014). for phylogenetic signal in comparative data: behavioral traits are Handbook of the Birds of the World Alive [Online]. Barcelona: Lynx Edicions. more labile. Evolution 57, 717–745. doi: 10.1111/j.0014-3820.2003.tb Available at: http://www.hbw.com [Accessed 22 October, 2014]. 00285.x Dell’Ariccia, G., and Bonadonna, F. (2013). Back home at night or out until Boire, D. (1989). Comparaison Quantitative De l’encéphale, De ses grandes morning? Nycthemeral variations in homing of anosmic Cory’s shearwaters in Subdivisions et des Relais Visuels, Trijemeaux et Acoustiques chez 28 Espèces a diurnal colony. J. Exp. Biol. 216, 1430–1433. doi: 10.1242/jeb.082826 d’oiseaux. Ph.D., thesis, Université de Montréal, Montréal, QC. Demery, Z. P., Chappell, J., and Martin, G. R. (2011). Vision, touch and object Bonadonna, F., Caro, S. P., Jouventin, P., and Nevitt, G. A. (2006). Evidence that manipulation in Senegal parrots Poicephalus senegalus. Proc. Biol. Sci. 278, blue petrel, Halobaena caerulea, fledglings can detect and orient to dimethyl 3687–3693. doi: 10.1098/rspb.2011.0374 sulfide. J. Exp. Biol. 209, 2165–2169. doi: 10.1242/jeb.02252 Donne-Gousse, C., Laudet, V., and Hanni, C. (2002). A molecular phylogeny of Bonadonna, F., and Nevitt, G. A. (2004). Partner-specific odor recognition in an anseriformes based on mitochondrial DNA analysis. Mol. Phylogenet. Evol. 23, Antarctic seabird. Science 306, 835. doi: 10.1126/science.1103001 339–356. doi: 10.1016/S1055-7903(02)00019-2 Breathnach, A. S. (1960). The cetacean central nervous system. Biol. Rev. 35, Dubbeldam, J. L. (1990). On the functional interpretation of quantitative 187–230. doi: 10.1111/j.1469-185X.1960.tb01414.x differences in forebrain organization – the trigeminal and visual- Burish, M. J., Kueh, H. Y., and Wang, S. S. (2004). Brain architecture and social system in birds. Neth. J. Zool. 40, 241–253. doi: 10.1163/156854289X complexity in modern and ancient birds. Brain Behav. Evol. 63, 107–124. doi: 00282 10.1159/000075674 Dunbar, R. I. M. (1995). Neocortex size and group size in primates: a test of the Burnham, K. P., and Anderson, D. R. (2002). Model Selection and Multimodel hypothesis. J. Hum. Evol. 28, 287–296. doi: 10.1006/jhev.1995.1021 Inference: A Practical Information-Theoretic Approach. New York: Springer- Duncan, R. P., Forsyth, D. M., and Hone, J. (2007). Testing the metabolic theory Verlag. of ecology: allometric scaling exponents in mammals. Ecology 88, 324–333. doi: Buschhuter, D., Smitka, M., Puschmann, S., Gerber, J. C., Witt, M., Abolmaali, 10.1890/0012-9658(2007)88[324:TTMTOE]2.0.CO;2 N. D., et al. (2008). Correlation between olfactory bulb volume and olfactory Ebinger, P., and Lohmer, R. (1987). A volumetric comparison of brains between function. Neuroimage 42, 498–502. doi: 10.1016/j.neuroimage.2008.05.004 greylag geese (Anser anser L.) and domestic geese. J. Hirnforsch. 28, 291–299. Carezzano, F. J., and Bee De Speroni, N. (1995). Composicion volumetrica Edinger, T. (1955). Hearing and smell in cetacean history. Monatsschrift für encefalica e indices cerebrales en tres aves de ambiente acuatico (Ardeidae, Psychiatrie und Neurologie 129, 37–58. doi: 10.1159/000139733 Podicipedidae, Rallidae). Facena 11, 75–83. Emery, N. J. (2006). Cognitive ornithology: the evolution of avian intelligence. Caro, S. P., and Balthazart, J. (2010). Pheromones in birds: myth or reality? J. Comp. Philos. Trans. R. Soc. Lond. B Biol. Sci. 361, 23–43. doi: 10.1098/rstb.2005.1736 Physiol. A 196, 751–766. doi: 10.1007/s00359-010-0534-4 Ericson, P. G. P., Jansén, A., Johansson, U. S., and Ekman, J. (2005). Inter- Caro, S. P., Balthazart, J., and Bonadonna, F. (2015). The perfume of reproduction generic relationships of the crows, jays, magpies and allied groups (Aves: in birds: chemosignaling in avian social life. Horm. Behav. 68, 25–42. doi: Corvidae) based on nucleotide sequence data. J. Avian Biol. 36, 222–234. doi: 10.1016/j.yhbeh.2014.06.001 10.1111/j.0908-8857.2001.03409.x Castro, I., Cunningham, S. J., Gsell, A. C., Jaffe, K., Cabrera, A., and Liendo, C. Felsenstein, J. (1985). Phylogenies and the comparative method. Am. Nat. 125, (2010). Olfaction in birds: a closer look at the kiwi (Apterygidae). J. Avian Biol. 1–15. doi: 10.1086/284325 41, 213–218. doi: 10.1111/j.1600-048X.2010.05010.x Fernandez, P., Carezzano, F., and Bee De Speroni, N. (1997). Analisis cuantitativo Cave, A. J. E. (1988). Note on olfactory activity in mysticetes. J. Zool. 214, 307–311. encefalico e indices cerebrales en Aratinga acuticaudata y Myiopsitta monachus doi: 10.1111/j.1469-7998.1988.tb04724.x de Argentina (Aves: Psittacidae). Rev. Chil. Hist. Nat. 70, 269–275. Frontiers in Neuroanatomy | www.frontiersin.org 13 July 2015 | Volume 9 | Article 102
You can also read