A Graph Gaussian Embedding Method for Predicting Alzheimer's Disease Progression with MEG Brain Networks
←
→
Page content transcription
If your browser does not render page correctly, please read the page content below
A Graph Gaussian Embedding Method for Predicting
                                           Alzheimer’s Disease Progression with MEG Brain Networks

                                               Mengjia Xu1 , David Lopez Sanz2 , Pilar Garces2 , Fernando Maestu2 , Quanzheng
                                                                                    Li3* , and Dimitrios Pantazis1*

                                               1
                                                   McGovern Institute for Brain Research, Massachusetts Institute of Technology,
arXiv:2005.05784v1 [q-bio.NC] 8 May 2020

                                                                                     Cambridge, MA 02139, USA
                                                   2
                                                       Department of Experimental Psychology, Complutense University of Madrid,
                                                                                          Madrid 28040, Spain
                                                   3
                                                       Department of Radiology, Harvard Medical School, Boston, MA 02114, USA
                                           *
                                               Corresponding author. Email: pantazis@mit.edu; li.quanzheng@mgh.harvard.edu

                                                                                                  Abstract

                                                           Characterizing the subtle changes of functional brain networks associated with the patho-
                                                        logical cascade of Alzheimer’s disease (AD) is important for early diagnosis and prediction of
                                                        disease progression prior to clinical symptoms. We developed a new deep learning method,
                                                        termed multiple graph Gaussian embedding model (MG2G), which can learn highly informa-
                                                        tive network features by mapping high-dimensional resting-state brain networks into a low-
                                                        dimensional latent space. These latent distribution-based embeddings enable a quantitative
                                                        characterization of subtle and heterogeneous brain connectivity patterns at different regions,
                                                        and can be used as input to traditional classifiers for various downstream graph analytic tasks,
                                                        such as AD early stage prediction, and statistical evaluation of between-group significant al-
                                                        terations across brain regions. We used MG2G to detect the intrinsic latent dimensionality
                                                        of MEG brain networks, predict the progression of patients with mild cognitive impairment
                                                        (MCI) to AD, and identify brain regions with network alterations related to MCI.

                                           Introduction
                                           Alzheimer’s disease (AD) is a progressive neurodegenerative disorder and the most common type of
                                           dementia [1]. It is characterized by the progressive destruction of axonal pathways, which leads to
                                           aberrant network changes at both anatomical and functional levels [2]. Mild cognitive impairment
                                           (MCI) is a key prodromal stage of AD and has a heterogeneous evolution pattern, i.e., 10-15% MCI
                                           patients may progress to AD or other types of dementia per year, whereas the others may remain
                                           stable or improve over time [3]. Thus, there is an urgent need to effectively identify progressive
                                           MCI (pMCI) and stable MCI (sMCI) populations during the early stages of AD. This could lead

                                                                                                       1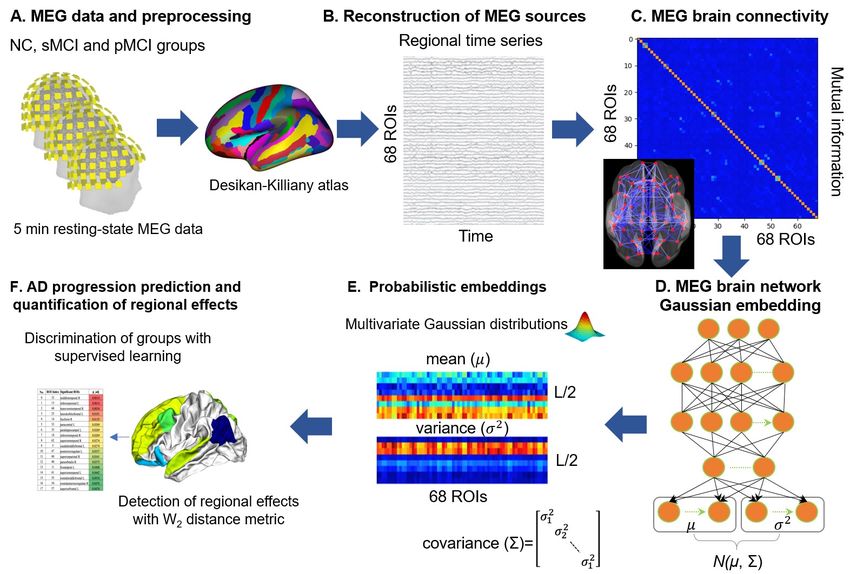
to a better understanding of the underlying heterogeneous pathogenesis of AD, provide insights
into the design of new clinical trials, and inform mechanistic-based therapeutic interventions.
      The first set of clinical criteria for MCI conversion prediction and diagnosis of AD focused on
symptoms and neurophysiological tests, such as the clinical dementia rating-CDR, mini-mental
state examination (MMSE) score, and Montreal Cognitive Assessment (MoCA) score [4]. How-
ever, the advent of biomarkers that measure pathological changes in vivo has provided new tools to
predict and understand the complex etiology of AD. The design of AD biomarkers has been largely
based on quantification of Aβ and Tau protein deposition levels, and assessment of neurodegener-
ation [5]. Aβ protein accumulation levels are measured by amyloid PET [6] or low cerebrospinal
fluid (CSF) Aβ42 [7]. Tau protein accumulation levels are measured by tau PET [8] or elevated
CSF phosphorylated tau (p-tau) [9]. Neurodegeneration is assessed by CSF total tau (t-tau) [10],
18
     F- fluorodeoxyglucose positron emission tomography (FDG-PET) [10], and atrophy on structural
MRI [11]. Additional information can be obtained by other biomarkers, such as the AD genetic
risk indicator apolipoprotein E (ApoE), which is coded by the APOE gene [12, 13].
      Despite these tremendous strides in biomarker technology, MRI and PET biomarkers are expen-
sive and PET scans involve exposure to radioactivity. CSF sampling requires a lumbar puncture,
which many patients find objectionable. As a result, patterns of Aβ, tau, and atrophy are typ-
ically identified just at the time when patients are diagnosed with dementia, when irreversible
neurodegeneration has occurred and medical intervention has less chance for success.
      A potential new biomarker is the disruption of functional brain networks measured by mag-
netoencephalography (MEG), which presents an additional key strength over fMRI for the pre-
surgical mapping [14]. MEG is non-invasive and offers excellent temporal resolution that allows
characterization of the subtle brain changes for different brain disorders (e.g., AD, epilepsy and
post-traumatic stress disorder), a major advantage over current biomarkers [15, 16, 17]. A further
advantage is that MEG captures the fields produced by intraneuronal currents, providing a more
direct index of neuronal activity than methods relying on metabolic responses (fMRI, FDG-PET)
[18, 19, 20]. Electrophysiological measures have already proven useful in tracking brain activity dis-
ruption in relation to other known AD pathologies, such as Aβ and tau deposits [21, 22]. Further,
synaptic dysfunction (and thus functional disruption) is an important biomarker shown to be more
tightly associated with the degree of cognitive impairment than Aβ plaques and tau tangles [23].
Hence, a MEG-based biomarker could provide a unique and more reliable indicator for synaptic
dysfunction evaluation during AD progression [24].
      To design a MEG-based AD biomarker, there is a need to develop methods that extract quanti-
tative information from MEG brain network data. Prior studies primarily focused on handcrafted,
domain-specific (ad-hoc) graph topological properties of brain networks constructed by MEG [25],
but also EEG [26], DTI [27], and structural MRI data [28]. However, inductive and automatic
network representation learning from raw MEG functional imaging data remains an open problem
for accurate AD diagnosis and prognosis. Recently, emerging graph embedding techniques (e.g.,
deepWalk [29], node2vec [30], Graph2Gauss [31], etc.) enabled automatic learning of hierarchi-
cal, heterogeneous and latent network representations from original complex and high-dimensional
graphs in irregular domains. Examples include social networks [32, 33], protein networks [34], and

                                                   2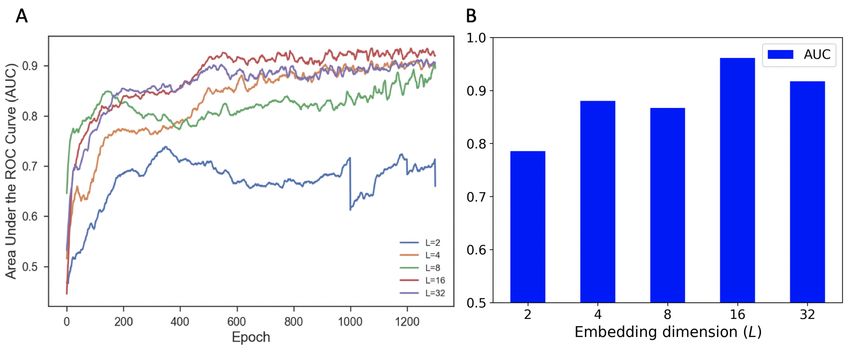
brain networks [35]. The resulting task-independent graph node embeddings can be used as latent
features for a variety of machine learning applications (e.g., link prediction, community detection,
node classification, etc.). Incorporating powerful graph representation learning methods in com-
plex human brain network applications could yield a novel and promising tool for characterization
of AD progression.
    In order to address the aforementioned problems, we developed a deep learning-based graph
Gaussian embedding method for identification and characterization of the early stages of AD using
eye-closed resting-state MEG data. First, we constructed subject-specific MEG brain networks
based on mutual information in alpha band for brain regions extracted from the Desikan-Killiany
atlas [36]. We then employed the multiple graph Gaussian embedding model (MG2G) [37] to learn
highly informative brain network embeddings (patterns) from the original high-dimensional MEG
brain networks. Thus, each brain region was represented as a multivariate Gaussian distribution (or
Gaussian embeddings) via two vectors, the mean and variance. These latent Gaussian embeddings
were subsequently input to multiple classifiers for supervised AD progression prediction. Last,
we used the Wasserstein metric [38] in the latent space to resolve brain regions with AD-related
effects.

Methods

Participants

MEG data for this study was collected from 76 MCI patients and 53 age-matched neurotypical
controls (NC) [15, 25]. All patients met the MCI core clinical criteria recommended by the National
Institute on Aging-Alzheimer Association (NIA-AA) [39], which are i) concern regarding a change
in cognition, ii) impairment in one or more cognitive domains, iii) preservation of independence in
functional abilities, and iv) non demented. In addition, MCI patients had signs of neuronal injury,
determined by reduced hippocampal volume measured by magnetic resonance imaging, and should
thus be considered “MCI due to AD” with an intermediate likelihood [39].
    The participant demographic characteristics are shown in Table 1. General inclusion criteria
were: age between 65 and 80, a modified Hachinski score ≤ 4, a short-form Geriatric Depression
Scale score ≤ 5, and T1 magnetic resonance imaging (MRI) within 12 months before the MEG
recordings without indication of infection, infarction, or focal lesions (rated by two independent
experienced radiologists). Exclusion criteria included a history of psychiatric or neurological dis-
orders other than MCI or AD. Patients were off medications that could affect MEG activity, such
as cholinesterase inhibitors, 48 h before recordings.
    The MCI patients were followed up for approximately 3 years after their MEG recording session,
and were further divided into two groups according to their clinical outcome: the stable MCI group
(sMCI, n = 48) comprising those patients that still fulfilled the diagnosis criteria of MCI at the
end of follow-up, and the progressive MCI group (pMCI, n = 28) comprising those patients that
met the criteria for probable AD [40].
    Patients were recruited from the Hospital Universitario San Carlos (Madrid, Spain), and neu-

                                                  3
Table 1: Detailed demographic characteristics of total participants (Madrid cohort).
Item NC (n = 53) MCI (n = 76)
Age (years) 69.6 ± 4.6 73.7 ± 5.1
Gender (female, %) 72 55
Education level 3.9 ± 1.1 2.6 ± 1.3
MMSE score 29.4 ± 0.75 26.6 ± 2.75
rotypical controls were primarily relatives of patients and/or volunteers from the same hospital.
All subjects gave a written informed consent and patients received payment for their participation.
The study was approved by the local ethics committee (Hospital Universitario San Carlos Ethics
Committee, Madrid) and conducted according to the principles of the Declaration of Helsinki.
MEG acquisition and preprocessing
Between 3 to 5 minutes of resting-state MEG data were acquired from each participant, depending
on subject’s cooperation and stillness, while participants were awake with their eyes closed. MEG
data was recorded using an Elekta Vectorview system (306-channel probe unit with 204 planar gra-
diometer sensors and 102 magnetometer sensors) at a sampling rate of 1000 Hz, filtered between 0.1
and 330 Hz. Prior to the MEG recording, a 3D digitizer (Fastrak, Polhemus, Colchester, Vermont,
USA) was used to register the locations of 3 anatomical landmarks (right and left preauricular
points and the nasion) and 4 head position indicator coils.
Raw MEG data was pre-processed with the Maxfilter software (Elekta, Stockholm) to perform
noise reduction with spatiotemporal filters [41, 42]. We used default parameters (harmonic expan-
sion origin in head frame = [0 0 40] mm; expansion limit for internal multipole base = 8; expansion
limit for external multipole base = 3; bad channels automatically excluded from harmonic expan-
sions = 7 s.d. above average; temporal correlation limit = .98; buffer length = 10 s). Intuitively,
Maxfilter first applied a spatial filter that separated the signal data from spatial patterns emanat-
ing from distant noise sources outside the sensor helmet. It then applied a temporal filter that
discarded components of the signal data with time series strongly correlated with the ones from the
noise data. The MEG data was then automatically scanned for ocular, muscle, and jump artifacts
using the Fieldtrip software [43], and band-pass filtered in the alpha band (8-12 Hz). Lastly, the
continuous resting-state MEG data was split into 2 seconds epochs.
Source reconstruction and connectivity analysis
To reconstruct MEG signals on the cortex, we first computed the forward model using an overlap-
ping spheres model (Huang et al., 1999). MEG cortical maps were then computed using a dynamic
statistical parametric mapping approach (dSPM) (Dale et al., 2000), and time series were derived
from 68 anatomical brain regions of interest (ROI) using the Desikan-Killiany atlas [36] (Fig. 1AB).
Source reconstruction analysis used the Brainstorm software [44].
Functional connectivity between every pair of ROIs was assessed using mutual information
(MI), which captures both linear and nonlinear dependencies [15]. This yielded a 68×68 functional
4brain connectivity matrix for each participant (Fig. 1C). Each subject-specific undirected MEG
functional brain network (or symmetric functional connectivity matrix) can be described by G =
(V, E), V is the set of 68 nodes, and E is the edge set with edge weights equal to the MI value
between the corresponding pairs of nodes.
Architecture of MG2G stochastic graph embedding model
In order to automatically learn multi-scale, nonlinear MEG brain network embeddings (or “pat-
terns”) in latent space from original high-dimensional MEG brain networks, yet maximally pre-
serving the structure properties for accurate AD progression prediction, we proposed to apply a
deep learning-based embedding method called multiple graph Gaussian embedding model (MG2G)
[37]. This model is a generalization of the Graph2Gauss architecture [31] to multiple graphs.
The architecture of the deep learning MG2G model is shown in Fig. 1D, and detailed information
is available in [37]. Briefly, the MG2G model learns non-linear node embeddings from original high-
dimensional brain networks into a stochastic latent space. In the latent space, each node is encoded
as Gaussian distributions with two different learned vectors (mean and variance), the mean vector
reflects the position of the node while the variance provides important uncertainty information.
Specifically, our model takes the computed undirected and weighted MEG brain networks
Xp ∈ RN ×N , p = 1, 2, ..., P (N is the number of brain regions, P is the number of subjects)
together as the input. Then, it learns the brain network vector-based encodings using a 3D
encoder, which maps the original MEG networks into an intermediate representation through
a sequence of hidden layers hki = ReLU (hk−1
i Wik + bk ), Wik ∈ RN ×D , bki ∈ RD (k denotes the index
of hidden layer). Here, due to the learning stability property of G2G model [31], we used a single
hidden layer (k = 1) of size D = 64 in our 3D model implementation. The outputs of MG2G
are node-wise low-dimensional multivariate Gaussian distributions Pi = N (µi , Σi ), i = 1, 2, ..., N
parameterized by the mean vector µi and the covariance Σi , where µi = hki Wµ + bµ ), Wµ ∈
RD×L/2 , bµ ∈ RL/2 ; the covariance matrix Σi is defined as a square matrix with variance σi as
its diagonal elements, where σi = elu(hki Wσ + bσ )), Wσ ∈ RD×L/2 , bσ ∈ RL/2 . Finally, all of the
parameters of our model including weights (Wik , Wµ , Wσ ) and biases (bk , bµ , bσ ) are learned by
minimizing the square-exponential loss function L = [E2pos + exp−Eneg ) ], where Epos and Eneg
P
refer to the Kullback–Leibler (KL) divergence energy of the generated node triplets [37] involving
positive node pairs and negative node pairs, respectively. In particular, we computed the shortest
distances between node pairs based on the edge weights and generated different hops. In order
to capture high-order proximity, we sampled valid triplet sets based on the obtained hops [37].
Lastly, the neural network was optimized by using the Adam algorithm in TensorFlow 1.14.0 [45]
with initial learning rate = 1e-3, maximum number of epochs = 1300 and number of hidden units
= 64.
MG2G model optimization with a link prediction task
Since the MG2G model is an unsupervised learning model, we carried out a “link prediction” exper-
iment to identify the optimal embedding dimension L that best preserves the network structure. In
5Figure 1: Schematic illustration of the graph Gaussian embedding method for predicting
Alzheimer’s disease progression using MEG brain networks. (A) 5 min resting-state MEG record-
ings were obtained for three population groups, neurotypical controls (NC), stable mild cognitive
impairment (sMCI) and progressive mild cognitive impairment (pMCI) patients. (B) MEG time
courses of 68 brain regions derived from the Desikan-Killiany atlas [36]. (C) Estimation of MEG
brain connectivity matrices using mutual information. (D) MG2G model for non-linear stochas-
tic MEG brain network embedding. (E) Stochastic node embedding output in the latent space
is a multivariate Gaussian distribution parameterized by a mean vector (µ) and variance vector
(σ) of size L/2. (F) AD progression prediction relied on the MEG Gaussian embedding features
to discriminate among population groups. Brain regions with significant AD-related effects were
detected using the 2-Wasserstein distance.
addition, link prediction enables us to assess the effectiveness and stability of the MG2G model in
representing the original MEG brain networks in a low-dimensional embedding space. Specifically,
the total edges/links in the adjacency matrices of the MEG brain networks were split into three
subsets: a training set (85%), a validation set (10%) and a test set (5%). The same number of
non-edge links were generated and added into the validation and test sets. Then, we first obtained
node-wise brain network stochastic embeddings by training the MG2G model with embedding
dimensions L equal to 2, 4, 8, 16 and 32, using the same model settings as described in Section D.
Based on the node-wise Gaussian embedding results, the probability of different links in the
validation and test sets could be predicted by computing the KL divergence scores between every
node pairs that constituted the sampled links in the validation and test sets. Finally, by evaluating
the performances of different link prediction models using different embedding sizes, we obtained
the optimal embedding dimension of the original high dimensional MEG brain network data.
6Application of traditional machine learning classifiers on network embed-
dings to predict AD
The MG2G model constructs effective network features by mapping high-dimensional MEG resting-
state networks into task-independent node-wise stochastic MEG brain network embeddings in a
latent space. These embeddings can then be used as features in traditional machine learning
classifiers to predict early stages of AD. To assess performance irrespective of a particular classifier,
we averaged the classification accuracy of ten popular classifiers available in the scikit-learn library
[46], namely “Nearest Neighbors”,“Linear SVM”, “RBF SVM”, “Gaussian Process”, “Decision Tree”,
“Random Forest”, “Neural Net”, “AdaBoost”, “Naive Bayes”, “QDA”. Each classifier was trained
using a 5-fold cross-validation strategy to distinguish between NC, sMCI, and pMCI patients.
Classification was 3-class, but also 2-class for the cases NC vs. sMCI, and sMCI vs. pMCI.
Detection of brain regions with AD-related effects using 2-Wasserstein
distance
The high dimensional and complex representational space of the original brain networks complicates
the quantification of distances between brain regions. However, the MG2G model yields network
embeddings that encode each node (brain region) in the low-dimensional space with the mean and
variance of a multivariate Gaussian distribution. One advantage of this representation is that one
can readily define the distance between brain regions using the 2-Wasserstein distance (W2 ), which
quantifies distances between Gaussian probability distributions:
2
2 1/2 1/2
W2 (Pi , Pj )2 = W2 (N (µi , Σi ), N (µj , Σj ))2 = kµi − µj k2 + Σi − Σj (1)
F
where Pi = N (µi , Σi ) and Pj = N (µj , Σj ) refer to the encoded multivariate Gaussian distributions
for nodes i and j; and µi , Σi are the mean and covariance of the node-wise normal distribution,
respectively, and F denotes the Frobenius norm.
To identify specific brain regions associated with significant AD-related effects, we compared
the W2 node distances between patients belonging to different versus same experimental groups.
We exemplify this for the NC versus sMCI comparison, but it applies equivalently to other group
comparisons. For each brain region separately, we first computed the W2 distances when i) one
subject is from the NC group and the other from the sMCI group (“between-group” distance); and
ii) when both subjects are from the same group (“within-group” distance, NC or sMCI). We then
defined the Group-wise ROI Cluster Index (GCI) as the averaged W2 -distance of the between-
minus within-pairs:
GCI = EiN C,jsM CI {W2 (Pi , Pj )2 } − Ei,jN C {W2 (Pi , Pj )2 }/2 − Ei,jsM CI {W2 (Pi , Pj )2 }/2 (2)
A positive GCI for a given brain region suggests network alterations between the NC and sMCI
groups. This is because the embeddings would tend to cluster in the same area in the latent space
for within-group subjects, but map to distant areas for between-group subjects.
7Statistical testing
We used non-parametric statistical inference that does not make assumptions on the distributions
of the data [47, 48]. Specifically, to assess the statistical significance of the GCI results for each
brain region, we performed permutation tests. Under the null hypothesis of no group effects, we
randomly exchanged the labels of the NC and sMCI subjects, each time recomputing a new cluster
index, GCI*, where (*) denotes a permutation sample. Repeating the permutation procedure 1000
times yielded an empirical distribution, which enabled us to estimate the p-value of the GCI of the
original data. We controlled for multiple comparison over the 68 brain regions using false discovery
rate (FDR) at a 0.05 level.
Results
Optimal embedding dimension of the MEG brain networks
To optimize the representation of MEG brain networks in the embedded space of the MG2G
model, we carried out a link prediction experiment. Link prediction is a common problem in
network science that aims to assess the ability to find missing links in a network. To this goal,
MEG brain networks were first computed for each subject by estimating the mutual information
(MI) in the alpha band between every pair of 68 cortical regions derived from the Desikan-Killiany
atlas[36] (Fig. 1ABC). Then, for the link prediction task, we held out a set of edges/non-edges
from the MEG networks before training the MG2G model with different embedding dimensions
(L=2, 4, 8, 16, 32).
The AUC (area under the ROC curve) results for the validation set are shown in Fig. 2A. Node
embeddings of dimension L = 16 achieved the best AUC performance. The worst performance was
for embeddings of dimension L = 2 because very low dimensional embeddings cannot sufficiently
capture the representational information of the original brain networks. Node embeddings of
L = 32 probably exceeded the latent dimension of the MEG networks and thus may have included
higher levels of noise, which reduced their performance to levels similar to the L = 4 case. The AUC
results for the test set are shown in Fig. 2B. Similar to the validation set results, the embedding
size L = 16 resulted in the best performance.
Prediction of AD progression using MEG network embeddings
The disruption of brain functional connectivity caused by early stages of AD could lead to subtle
alterations that are encoded in the MEG network embeddings. We tested this prediction by
applying the MG2G model, with embedding size L=16, to learn the low-dimensional Gaussian
distributed MEG brain network embeddings. We then input the embeddings to multiple traditional
machine learning classifiers (“Nearest Neighbors”,“Linear SVM”, “RBF SVM”, “Gaussian Process”,
“Decision Tree”, “Random Forest”, “Neural Net”, “AdaBoost”, “Naive Bayes”, “QDA”) available in
the scikit-learn library [46] to distinguish between NC, sMCI, and pMCI patients. To assess how
informative are the MG2G embeddings, we also compared the results obtained with the MG2G
method against another prevalent point vector-based graph embedding method, the node2vec [30].
8Figure 2: Performance of the MG2G brain network embedding model in a link prediction task for
different values of embedding size (L = 2, 4, 8, 16, 32). (A) Link prediction AUC results for the
validation dataset with increasing number of training epochs. (B) Link prediction AUC results for
the test dataset.
We assessed node2vec performance with different embedding sizes (L = 8, 16) and hyperparameters
(p and q values), which control the neighborhood exploration in node2vec.
The mean accuracy across the 10 traditional classifiers for each of the network embedding
methods are shown in Fig. 3. We evaluated performance in both 3-class and 2-class classification
tasks. MG2G achieved high performance with 82% 3-class classification, 93% 2-class NC vs.
sMCI classification, and 87% 2-class sMCI vs. pMCI classification. we note that node2vec had
consistently lower performance, with best results achieved when embedding size was L = 8, and
node neighbor sampling parameters p = 1 and q = 4. Overall, the stochastic MG2G graph
embedding method yielded highly informative features that learned the latent hierarchical and
non-linear MEG brain network patterns in AD early stages.
Brain regions with significant AD-related effects in the MEG network
embedding space
The MG2G model resulted in graph embeddings that represented every brain region (node) by a
multivariate Gaussian distribution in a latent space. To pinpoint AD-related MEG network alter-
ations in space, we assessed which brain regions had embeddings that were statistically different for
different population groups. This was accomplished by computing, for each node separately, the
embedding distance between every pair of patients using the 2-Wasserstein distance (W2 ). Then a
cluster index (GCI), defined as the difference of between-group minus within-group node distances,
assessed the extent to which different groups clustered in the latent space. A positive GCI for a
given brain region would suggest embeddings that are distant for patients of different experimental
groups, but nearby for patients of same experimental groups.
We found 34 brain regions with significantly positive GCI values between the NC and sMCI
groups (p < 0.05, permutation test, FDR corrected for multiple comparisons). The label, lobe
name, GCI value, and p-value of each brain region are listed in Table 2. A large proportion
9Figure 3: Mean accuracy for supervised classification of the NC, sMCI, and pMCI populations.
Accuracy is averaged across 10 popular traditional classifiers, when receiving as input the vector-
based MEG brain network embeddings obtained from the MG2G and node2vec models. Each
individual classifier was trained using a 5-fold cross-validation procedure. Pink color corresponds
to the MG2G method with embedding size L = 16, and the remaining colors correspond to the
node2vec method with different node neighbor sampling parameters (p = 1; q = 2, 4, 30) and
embedding sizes (L = 8, 16).
of the significant ROIs concentrated in the frontal and temporal lobes, with only a few in the
occipital and parietal lobes. Further, there was a hemispheric asymmetry with 20 ROIs in the
left compared to 14 ROIs in the right hemisphere. An equivalent analysis for the sMCI vs. pMCI
groups yielded 18 brain regions with significantly positive GCI values, encompassing mainly frontal,
temporal and parietal lobes (Table 3). Of these, 10 regions where in the left hemisphere with the
remaining 8 in the right hemisphere. The brain regions detected by the NC vs. sMCI and sMCI vs.
pMCI comparisons had only a partial overlap, with seven brain regions common in the two tables:
frontal pole R, parahippocampal L, lateral orbitofrontal L, pars orbitalis R, superior temporal L,
rostral middle frontal L, rostral anterior cingulate R. All brain regions with significant AD-related
effects are plotted in Fig. 4.
Discussion
In this study, we developed a deep learning-based method, called MG2G model, which auto-
matically learns low-dimensional stochastic MEG brain network embeddings from original high-
dimensional MEG brain network data. In the latent space, every brain region (ROI) was trans-
formed into a multivariate Gaussian distribution with features the mean and the variance vectors.
We showed that the embeddings in the latent space captured highly informative features that can
10Table 2: Brain regions with AD-related effects between NC and sMCI
No. ROI label Lobe name GCI value p value
1 superior temporal L Temporal 1.790 0.028
2 transverse temporal L Temporal 1.791 0.039
3 parahippocampal R Temporal 1.793 0.028
4 fusiform L Temporal 1.793 0.028
5 middle temporal L Temporal 1.794 0.028
6 entorhinal R Temporal 1.796 0.028
7 entorhinal L Temporal 1.797 0.026
8 inferior temporal L Temporal 1.798 0.017
9 parahippocampal L Temporal 1.798 0.025
10 temporal pole R Temporal 1.799 0.017
11 temporal pole L Temporal 1.805 0.017
12 isthmus cingulate L Parietal 1.793 0.028
13 supramarginal L Parietal 1.798 0.042
14 lateral occipital R Occipital 1.799 0.048
15 pars triangularis R Frontal 1.787 0.028
16 caudal middle frontal R Frontal 1.790 0.039
17 rostral anterior cingulate R Frontal 1.792 0.025
18 pars opercularis L Frontal 1.793 0.039
19 medial orbitofrontal R Frontal 1.794 0.017
20 pars orbitalis L Frontal 1.794 0.026
21 frontal pole L Frontal 1.795 0.017
22 superior frontal R Frontal 1.795 0.035
23 lateral orbitofrontal R Frontal 1.796 0.017
24 pars triangularis L Frontal 1.796 0.039
25 pars opercularis R Frontal 1.796 0.045
26 rostral middle frontal R Frontal 1.797 0.035
27 pars orbitalis R Frontal 1.798 0.017
28 lateral orbitofrontal L Frontal 1.798 0.025
29 frontal pole R Frontal 1.800 0.026
30 rostral middle frontal L Frontal 1.800 0.033
31 medial orbitofrontal L Frontal 1.801 0.017
32 rostral anterior cingulate L Frontal 1.803 0.026
33 insula L . 1.785 0.026
34 banks sts L . 1.796 0.028
be used to effectively predict AD progression from NC to sMCI to pMCI patients. Specifically,
using the network embeddings, an ensemble of 10 traditional machine classifiers was able to dis-
criminate the three populations groups with average performance 82% for 3-class classification,
11Table 3: Brain regions with significant AD-related effects between sMCI and pMCI
No. ROI label Lobe name GCI value p value
1 middle temporal R Temporal 1.794 0.001
2 transverse temporal R Temporal 1.799 0.003
3 fusiform R Temporal 1.789 0.013
4 parahippocampal L Temporal 1.791 0.027
5 inferior temporal R Temporal 1.798 0.027
6 superior temporal R Temporal 1.801 0.027
7 superior temporal L Temporal 1.786 0.044
8 inferior parietal L Parietal 1.806 0.001
9 posterior cingulate L Parietal 1.790 0.034
10 superior parietal R Parietal 1.801 0.034
11 lateral orbitofrontal L Frontal 1.793 0.012
12 paracentral L Frontal 1.796 0.027
13 caudal middle frontal L Frontal 1.799 0.027
14 pars orbitalis R Frontal 1.795 0.037
15 frontal pole L Frontal 1.787 0.041
16 rostral middle frontal L Frontal 1.800 0.048
17 rostral anterior cingulate R Frontal 1.787 0.048
18 superior frontal L Frontal 1.799 0.048
93% for 2-class NC vs. sMCI classification, and 87% for 2-class sMCI vs. pMCI classification.
Classification results achieved by the MG2G model were higher than the node2vec model [30], a
different deep-learning model that also learns feature representations from networks. This suggests
that the MG2G model can generate more informative MEG network representations in the latent
space than the popular node2vec model, at least in the case of predicting AD progression using
MEG data.
While some graph theoretic measures focus on nodes, such as node degree [49], the majority
of traditional brain network analysis methods detect anatomical or functional network alterations
either i) at global scale, such as the graph-theoretic measures of small-worldness, clustering coeffi-
cient, and transitivity [49], or ii) at specific network edges [15, 21, 50]. In contrast, a key advantage
of the MG2G model is that network embeddings provide a natural way to identify experimental
effects at the level of brain regions (network nodes) rather than brain connections (network edges).
Namely, network nodes are represented as vectors in the latent space, hence providing a direct way
to quantify node distances, and detect node-specific experimental effects akin to the GCI measure
defined in the current study.
The MG2G method learns the network embeddings in a completely unsupervised way. There-
fore, brain network data are summarized into a low-dimensional representation in an objective
way, which can be valuable for subsequent downstream tasks, such as link prediction or cluster-
ing. For example, a future study could investigate how brain networks of AD patients cluster in
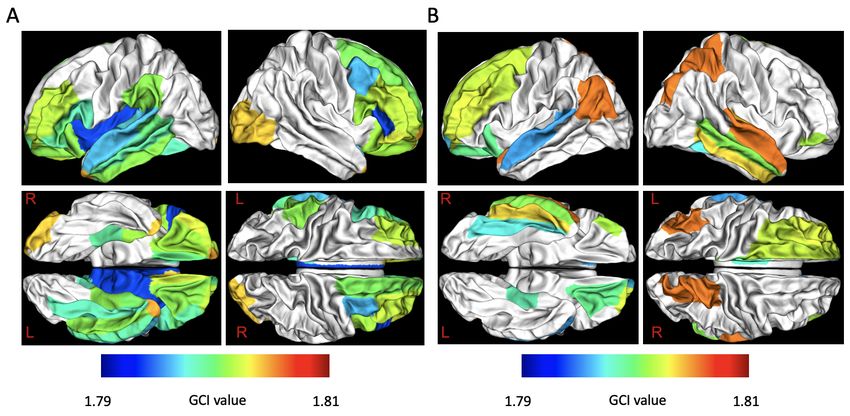
12Figure 4: Brain regions with significant MEG network alterations due to AD progression. Effects
were quantified with a positive GCI (p < 0.05, one-sided permutation test; FDR-corrected for
multiple comparisons). (a) NC vs. sMCI comparison. (b) sMCI vs. pMCI comparison.
the latent space, which may lead to an automatic detection of AD subtypes. Such investigation
would be timely, given that past literature has differentiated at least three AD subtypes (typical,
non-limbic, and limbic predominant) based on the distribution of the tau protein [51] or patterns
of brain atrophy [52].
Another advantage of our unsupervised approach is that we can leverage the benefits of deep-
learning in brain imaging datasets of small size. In fact, our method is the generalization of
Graph2Gauss [31], which learns the embedding of a single graph. In contrast, graph convolu-
tional networks [53], another family of deep-learning approaches tuned to graphs, are supervised
approaches and thus may necessitate much larger datasets to prevent overfitting.
Using our node-specific analysis in the latent space, we identified that the majority of brain
regions with AD-specific effects localized in the frontal and temporal lobes. This includes the
parahippocampal cortex, which is associated with visuospatial and episodic memory processing
and is consistent with profound memory deficits in AD [54]. The aberrant brain regions identified
when contrasting the NC, sMCI, and pMCI groups overlap with previous studies using different
imaging modality data, such as FDG-PET [55, 56], MRI [57], and fMRI [58]. For example, Lee et
al. [57] proposed a regional abnormality detection approach for AD diagnosis based on T1 MRI
data, and demonstrated that the sensorimotor cortex, temporal lobe and subcortical regions are
more closely related to prediction of MCI vs. NC and pMCI vs. sMCI. Additionally, two previous
FDG-PET-based AD progression studies [59, 60] investigated AD progression biomarkers through
evaluating the cerebral glucose metabolism changing patterns, with results indicating that pMCI
patients showed reduced cerebral glucose metabolitic rates in some distinct regions (i.e., inferior
parietal, posterior cingulate and medial temporal cortices) compared to sMCI patients who did
not progress to dementia.
AD has been commonly found to produce greater atrophy levels in the left compared to the right
hemisphere [61, 62], and particularly affecting medial temporal lobe structures such as hippocampus
13or parahippocampal cortex. These previous results seem to agree with those reported here, also
showing more AD-related regions in the left hemisphere, with particular differences in this regard
over temporal structures in the NC vs. sMCI comparison. Interestingly, some of the regions
showing AD-related effects in both comparisons have been commonly reported to be affected in
both the early and late stages of the disease and to play a particularly relevant role in network
disruption along the progression of this disease, which highlights the clinical relevance of the
present results. For instance, a recent work by Yu et al. [63] demonstrated that medial temporal
lobe contribution to network organization is disrupted among AD patients, which is in agreement
with parahippocampal alterations reported here. Furthermore, anterior cingulate connectivity
with other brain regions has been proven highly predictive for the conversion to AD [64], and its
functional connectivity patterns seem to be affected even earlier in the course of the disease in
older adults with subjective cognitive decline [65].
Regarding frontal regions, presenting clear AD-related effects in both groups, previous studies
from our group have shown an association of the local oscillatory activity (specifically in the alpha
band) and the level of amyloid-β accumulation [66], which support the relevance of alpha band
activity over these regions in the context of AD.
AD is a network-based (connectome) disease. The three earliest biomarkers of AD - tau tan-
gles, amyloid-β plaques, and synaptic dysfunction - are not randomly distributed in the brain;
rather they have characteristic spatial patterns that appear to follow large-scale brain systems or
connectivity networks. Consequently, the trajectory of tau, amyloid-β, and functional connectivity
networks in the early stages of AD could provide a potential disease biomarker with high diagnostic
power, enabling early detection and monitoring of disease progression. Thus, a future challenge is
to modify our MG2G method to jointly embed multimodal data of functional and protein brain
networks.
Conclusion
Using our MG2G stochastic graph embedding model, we mapped high-dimensional MEG resting-
state networks of MCI patients into node-wise stochastic network embeddings in a low-dimensional
latent space. These embeddings were then used as features in traditional machine learning clas-
sifiers to the downstream task of predicting early stages of AD. We achieved high performance
with 82% 3-class classification, 93% 2-class NC vs. sMCI classification, and 87% 2-class sMCI vs.
pMCI classification. We then identified specific brain regions with MCI-related effects, summarized
in Tables 2 and 3, by exploring group clustering patterns in the latent space derived from the
2-Wasserstein distance measure. Overall, our findings showed that the MG2G unsupervised graph
embedding model combined with traditional classifiers is effective in the downstream task of AD
prediction with MEG data, without the need of very large data sets that are typically required in
supervised deep-learning approaches.
14Acknowledgements
This work was supported by a J-Clinic for Machine Learning in Health at MIT grant award to
D.P.; National Institutes of Health award R01AG052653 to Q.L.; Spanish Ministry of Economy
and Competitiveness grant awards PSI2009-14415C03-01 and PSI2012-38375-C03-01 and Madrid
Neurocenter grant award B2017/BMD-3760 to F.M.; and the Spanish Ministry of Science, Inno-
vation and Universities, Juan de la Cierva-Formación grant award FJC2018-037401-I to D.L.S..
M.X. received partial support from NIH grant award U01 HL1163232.
References
[1] Philip Scheltens, Kaj Blennow, Monique M B Breteler, Bart de Strooper, Giovanni B Frisoni,
Stephen Salloway, and Wiesje Maria van der Flier. Alzheimer’s disease. The Lancet, 388:505–
517, 2016.
[2] Christopher W Lynn and Danielle S Bassett. The physics of brain network structure, function
and control. Nature Reviews Physics, 1(5):318–332, 2019.
[3] Christos Davatzikos, Priyanka Bhatt, Leslie M Shaw, Kayhan N Batmanghelich, and John Q
Trojanowski. Prediction of MCI to AD conversion, via MRI, CSF biomarkers, and pattern
classification. Neurobiology of aging, 32(12):2322–e19, 2011.
[4] S Hoops, S Nazem, AD Siderowf, JE Duda, SX Xie, MB Stern, and D Weintraub. Validity of
the MoCA and MMSE in the detection of MCI and dementia in Parkinson disease. Neurology,
73(21):1738–1745, 2009.
[5] Clifford R Jack, David A Bennett, Kaj Blennow, Maria C Carrillo, Howard H Feldman,
Giovanni B Frisoni, Harald Hampel, William J Jagust, Keith A Johnson, David S Knopman,
et al. A/T/N: an unbiased descriptive classification scheme for Alzheimer disease biomarkers.
Neurology, 87(5):539–547, 2016.
[6] William E Klunk, Henry Engler, Agneta Nordberg, Yanming Wang, Gunnar Blomqvist,
Daniel P Holt, Mats Bergström, Irina Savitcheva, Guo-Feng Huang, Sergio Estrada, et al.
Imaging brain amyloid in Alzheimer’s disease with Pittsburgh Compound-B. Annals of Neu-
rology: Official Journal of the American Neurological Association and the Child Neurology
Society, 55(3):306–319, 2004.
[7] Anne M Fagan, Catherine M Roe, Chengjie Xiong, Mark A Mintun, John C Morris, and
David M Holtzman. Cerebrospinal fluid tau/β-amyloid42 ratio as a prediction of cognitive
decline in nondemented older adults. Archives of Neurology, 64(3):343–349, 2007.
[8] Niklas Mattsson, Henrik Zetterberg, Oskar Hansson, Niels Andreasen, Lucilla Parnetti,
Michael Jonsson, Sanna-Kaisa Herukka, Wiesje M van der Flier, Marinus A Blankenstein,
Michael Ewers, et al. CSF biomarkers and incipient Alzheimer disease in patients with mild
cognitive impairment. JAMA, 302(4):385–393, 2009.
15[9] Katharina Buerger, Michael Ewers, Tuula Pirttilä, Raymond Zinkowski, Irina Alafuzoff,
Stefan J Teipel, John DeBernardis, Daniel Kerkman, Cheryl McCulloch, Hilkka Soininen,
et al. CSF phosphorylated tau protein correlates with neocortical neurofibrillary pathology in
Alzheimer’s disease. Brain, 129(11):3035–3041, 2006.
[10] Florent L Besson, Renaud La Joie, Loïc Doeuvre, Malo Gaubert, Florence Mézenge, Stéphanie
Egret, Brigitte Landeau, Louisa Barré, Ahmed Abbas, Meziane Ibazizene, et al. Cognitive
and brain profiles associated with current neuroimaging biomarkers of preclinical alzheimer’s
disease. Journal of Neuroscience, 35(29):10402–10411, 2015.
[11] John T O’Brien, Michael J Firbank, Karen Ritchie, Katie Wells, Guy B Williams, Craig W
Ritchie, and Li Su. Association between midlife dementia risk factors and longitudinal brain
atrophy: the prevent-dementia study. Journal of Neurology, Neurosurgery & Psychiatry,
91(2):158–161, 2020.
[12] Brian W Kunkle, Benjamin Grenier-Boley, Rebecca Sims, Joshua C Bis, Vincent Damotte,
Adam C Naj, Anne Boland, Maria Vronskaya, Sven J Van Der Lee, Alexandre Amlie-Wolf,
et al. Genetic meta-analysis of diagnosed Alzheimer’s disease identifies new risk loci and
implicates aβ, tau, immunity and lipid processing. Nature Genetics, 51(3):414–430, 2019.
[13] Philip B Verghese, Joseph M Castellano, and David M Holtzman. Apolipoprotein e in
alzheimer’s disease and other neurological disorders. The Lancet Neurology, 10(3):241–252,
2011.
[14] Xavier De Tiège, Daniel Lundqvist, Sándor Beniczky, Stefano Seri, and Ritva Paetau. Current
clinical magnetoencephalography practice across Europe: Are we closer to use MEG as an
established clinical tool? Seizure, 50:53–59, 2017.
[15] Fernando Maestú, Jose-Maria Peña, Pilar Garcés, Santiago González, Ricardo Bajo, Anto
Bagic, Pablo Cuesta, Michael Funke, Jyrki P Mäkelä, Ernestina Menasalvas, et al. A multi-
center study of the early detection of synaptic dysfunction in mild cognitive impairment using
magnetoencephalography-derived functional connectivity. NeuroImage: Clinical, 9:103–109,
2015.
[16] Christos Papadelis and Yu-Han Chen. Pediatric magnetoencephalography in clinical practice
and research. Neuroimaging Clinics, pages 239–248, 2020.
[17] Jing Zhang, J Don Richardson, and Benjamin T Dunkley. Classifying post-traumatic stress
disorder using the magnetoencephalographic connectome and machine learning. Scientific
Reports, 10(1):1–10, 2020.
[18] Matti Hämäläinen, Riitta Hari, Risto J. Ilmoniemi, Jukka Knuutila, and Olli V. Lounasmaa.
Magnetoencephalography—theory, instrumentation, and applications to noninvasive studies
of the working human brain. Reviews of Modern Physics, 65(2):413–497, 1993.
[19] Sheraz Khan and David Cohen. Using the magnetoencephalogram to noninvasively measure
magnetite in the living human brain. Human Brain Mapping, 40(5):1654–1665, 2019.
16[20] Sylvain Baillet. Magnetoencephalography for brain electrophysiology and imaging. Nature
Neuroscience, 20(3):327–339, 2017.
[21] L. Canuet, S. Pusil, M. E. Lopez, R. Bajo, J. A. Pineda-Pardo, P. Cuesta, G. Galvez, J. M.
Gaztelu, D. Lourido, G. Garcia-Ribas, and F. Maestu. Network disruption and cerebrospinal
fluid amyloid-beta and phospho-tau levels in mild cognitive impairment. Journal of Neuro-
science, 35(28):10325–10330, 2015.
[22] Milan Stoiljkovic, Craig Kelley, Bernardo Stutz, Tamas L Horvath, and Mihály Hajós. Al-
tered cortical and hippocampal excitability in TgF344-AD rats modeling alzheimer’s disease
pathology. Cerebral Cortex, 35(28):2716–2727, 2018.
[23] Kaj Blennow and Henrik Zetterberg. Biomarkers for alzheimer’s disease: current status and
prospects for the future. Journal of Internal Medicine, 284(6):643–663, 2018.
[24] Su Yang, Jose Miguel sanchez Bornot, KongFatt Wong-Lin, and Girijesh Prasad. M/EEG-
based bio-markers to predict the mild cognitive impairment and alzheimer’s disease: A re-
view from the machine learning perspective. IEEE Transactions on Biomedical Engineering,
66(10):2924–2935, 2019.
[25] Sandra Pusil, Stavros Dimitriadis, María Eugenia López, Ernesto Pereda, and Fernando
Maestú. Aberrant MEG multi-frequency phase temporal synchronization predicts conversion
from mild cognitive impairment-to-Alzheimer’s disease. NeuroImage: Clinical, 24(10):101972,
2019.
[26] D Surya and Subha D Puthankattil. Complex network analysis of MCI-AD EEG signals under
cognitive and resting state. Brain Research, page 146743, 2020.
[27] Yu Sun, Qiuhui Bi, Xiaoni Wang, Xiaochen Hu, Huijie Li, Xiaobo Li, Ting Ma, Jie Lu, Piu
Chan, Ni Shu, et al. Prediction of conversion from amnestic mild cognitive impairment to
Alzheimer’s disease based on the brain structural connectome. Frontiers in neurology, 9:1178,
2018.
[28] Marta Gomez-Sancho, Jussi Tohka, Vanessa Gomez-Verdejo, Alzheimer’s Disease Neuroimag-
ing Initiative, et al. Comparison of feature representations in MRI-based MCI-to-AD conver-
sion prediction. Magnetic resonance imaging, 50:84–95, 2018.
[29] Bryan Perozzi, Rami Al-Rfou, and Steven Skiena. Deepwalk: Online learning of social repre-
sentations. In Proceedings of the 20th ACM SIGKDD international conference on Knowledge
discovery and data mining, pages 701–710. ACM, 2014.
[30] Aditya Grover and Jure Leskovec. node2vec: Scalable feature learning for networks. In
Proceedings of the 22nd ACM SIGKDD international conference on Knowledge discovery and
data mining, pages 855–864. ACM, 2016.
[31] Aleksandar Bojchevski and Stephan Günnemann. Deep Gaussian embedding of graphs: Un-
supervised inductive learning via ranking. ICLR, 2018.
17[32] Yaqing Wang, Chunyan Feng, Ling Chen, Hongzhi Yin, Caili Guo, and Yunfei Chu. User
identity linkage across social networks via linked heterogeneous network embedding. World
Wide Web, 22(6):2611–2632, 2019.
[33] Baofang Hu, Hong Wang, Xiaomei Yu, Weihua Yuan, and Tianwen He. Sparse network
embedding for community detection and sign prediction in signed social networks. Journal of
Ambient Intelligence and Humanized Computing, 10(1):175–186, 2019.
[34] Sheng Wang, Edward Huang, Junmei Cairns, Jian Peng, Liewei Wang, and Saurabh Sinha.
Identification of pathways associated with chemosensitivity through network embedding. PLoS
Computational Biology, 15(3):e1006864, 2019.
[35] Gideon Rosenthal, František Váša, Alessandra Griffa, Patric Hagmann, Enrico Amico, Joaquín
Goñi, Galia Avidan, and Olaf Sporns. Mapping higher-order relations between brain structure
and function with embedded vector representations of connectomes. Nature communications,
9(1):1–12, 2018.
[36] Rahul S Desikan, Florent Ségonne, Bruce Fischl, Brian T Quinn, Bradford C Dickerson,
Deborah Blacker, Randy L Buckner, Anders M Dale, R Paul Maguire, Bradley T Hyman,
et al. An automated labeling system for subdividing the human cerebral cortex on MRI scans
into gyral based regions of interest. NeuroImage, 31(3):968–980, 2006.
[37] Mengjia Xu, Zhijiang Wang, Haifeng Zhang, Dimitrios Pantazis, Huali Wang, and Quanzheng
Li. Gaussian embedding-based functional brain connectomic analysis for amnestic mild cog-
nitive impairment patients with cognitive training. bioRxiv, page 779744, 2019.
[38] Victor M Panaretos and Yoav Zemel. Statistical aspects of Wasserstein distances. Annual
Review of Statistics and its Application, 6:405–431, 2019.
[39] Marilyn S Albert, Steven T DeKosky, Dennis Dickson, Bruno Dubois, Howard H Feldman,
Nick C Fox, Anthony Gamst, David M Holtzman, William J Jagust, Ronald C Petersen, et al.
The diagnosis of mild cognitive impairment due to Alzheimer’s disease: recommendations from
the National Institute on Aging-Alzheimer’s Association workgroups on diagnostic guidelines
for Alzheimer’s disease. Alzheimer’s & Dementia, 7(3):270–279, 2011.
[40] Guy M McKhann, David S Knopman, Howard Chertkow, Bradley T Hyman, Clifford R
Jack Jr, Claudia H Kawas, William E Klunk, Walter J Koroshetz, Jennifer J Manly, Richard
Mayeux, et al. The diagnosis of dementia due to alzheimer’s disease: recommendations from
the national institute on aging-alzheimer’s association workgroups on diagnostic guidelines for
alzheimer’s disease. Alzheimer’s & Dementia, 7(3):263–269, 2011.
[41] Samu Taulu, Matti Kajola, and Juha Simola. Suppression of interference and artifacts by the
signal space separation method. Brain Topography, 16(4):269–275, 2004.
[42] Samu Taulu and Juha Simola. Spatiotemporal signal space separation method for rejecting
nearby interference in MEG measurements. Physics in Medicine & Biology, 51(7):1759, 2006.
18[43] Robert Oostenveld, Pascal Fries, Eric Maris, and Jan-Mathijs Schoffelen. FieldTrip: open
source software for advanced analysis of MEG, EEG, and invasive electrophysiological data.
Computational Intelligence and Neuroscience, 2011, 2011.
[44] François Tadel, Sylvain Baillet, John C Mosher, Dimitrios Pantazis, and Richard M Leahy.
Brainstorm: a user-friendly application for MEG/EEG analysis. Computational Intelligence
and Neuroscience, 2011, 2011.
[45] Martín Abadi, Ashish Agarwal, Paul Barham, Eugene Brevdo, Zhifeng Chen, Craig Citro,
Greg S. Corrado, Andy Davis, Jeffrey Dean, Matthieu Devin, Sanjay Ghemawat, Ian Good-
fellow, Andrew Harp, Geoffrey Irving, Michael Isard, Yangqing Jia, Rafal Jozefowicz, Lukasz
Kaiser, Manjunath Kudlur, Josh Levenberg, Dandelion Mané, Rajat Monga, Sherry Moore,
Derek Murray, Chris Olah, Mike Schuster, Jonathon Shlens, Benoit Steiner, Ilya Sutskever,
Kunal Talwar, Paul Tucker, Vincent Vanhoucke, Vijay Vasudevan, Fernanda Viégas, Oriol
Vinyals, Pete Warden, Martin Wattenberg, Martin Wicke, Yuan Yu, and Xiaoqiang Zheng.
TensorFlow: Large-scale machine learning on heterogeneous systems, 2015. Software available
from tensorflow.org.
[46] Lars Buitinck, Gilles Louppe, Mathieu Blondel, Fabian Pedregosa, Andreas Mueller, Olivier
Grisel, Vlad Niculae, Peter Prettenhofer, Alexandre Gramfort, Jaques Grobler, Robert Lay-
ton, Jake VanderPlas, Arnaud Joly, Brian Holt, and Gaël Varoquaux. API design for machine
learning software: experiences from the scikit-learn project. In ECML PKDD Workshop:
Languages for Data Mining and Machine Learning, pages 108–122, 2013.
[47] Eric Maris and Robert Oostenveld. Nonparametric statistical testing of EEG- and MEG-data.
Journal of Neuroscience Methods, 164(1):177–190, August 2007.
[48] Dimitrios Pantazis, Thomas E. Nichols, Sylvain Baillet, and Richard M. Leahy. A comparison
of random field theory and permutation methods for the statistical analysis of MEG data.
NeuroImage, 25(2):383–394, April 2005.
[49] Mikail Rubinov and Olaf Sporns. Complex network measures of brain connectivity: Uses and
interpretations. NeuroImage, 52(3):1059 – 1069, 2010. Computational Models of the Brain.
[50] David López-Sanz, Ricardo Bruña, Pilar Garcés, María Carmen Martín-Buro, Stefan Walter,
María Luisa Delgado, Mercedes Montenegro, Ramón López Higes, Alberto Marcos, and Fer-
nando Maestú. Functional Connectivity Disruption in Subjective Cognitive Decline and Mild
Cognitive Impairment: A Common Pattern of Alterations. Frontiers in Aging Neuroscience,
9:109, April 2017.
[51] Melissa E Murray, Neill R Graff-Radford, Owen A Ross, Ronald C Petersen, Ranjan Duara,
and Dennis W Dickson. Neuropathologically defined subtypes of Alzheimer’s disease with
distinct clinical characteristics: a retrospective study. The Lancet Neurology, 10(9):785–796,
September 2011.
19[52] Jennifer L Whitwell, Dennis W Dickson, Melissa E Murray, Stephen D Weigand, Nirubol
Tosakulwong, Matthew L Senjem, David S Knopman, Bradley F Boeve, Joseph E Parisi,
Ronald C Petersen, Clifford R Jack, and Keith A Josephs. Neuroimaging correlates of patho-
logically defined subtypes of Alzheimer’s disease: a case-control study. The Lancet Neurology,
11(10):868–877, October 2012.
[53] Mingliang Wang, Chunfeng Lian, Dongren Yao, Daoqiang Zhang, Mingxia Liu, and Dinggang
Shen. Spatial-Temporal dependency modeling and network hub detection for functional MRI
analysis via convolutional-recurrent network. IEEE Transactions on Biomedical Engineering,
2019.
[54] Elissa M Aminoff, Kestutis Kveraga, and Moshe Bar. The role of the parahippocampal cortex
in cognition. Trends in Cognitive Sciences, 17(8):379–390, 2013.
[55] Jorge Sepulcre, Aaron P Schultz, Mert Sabuncu, Teresa Gomez-Isla, Jasmeer Chhatwal, Alex
Becker, Reisa Sperling, and Keith A Johnson. In vivo tau, amyloid, and gray matter profiles
in the aging brain. Journal of Neuroscience, 36(28):7364–7374, 2016.
[56] Jorge Sepulcre, Michel J Grothe, Federico d’Oleire Uquillas, Laura Ortiz-Terán, Ibai Diez,
Hyun-Sik Yang, Heidi IL Jacobs, Bernard J Hanseeuw, Quanzheng Li, Georges El-Fakhri,
et al. Neurogenetic contributions to amyloid beta and tau spreading in the human cortex.
Nature Medicine, 24(12):1910–1918, 2018.
[57] Eunho Lee, Jun-Sik Choi, Minjeong Kim, Heung-Il Suk, Alzheimer’s Disease Neuroimaging
Initiative, et al. Toward an interpretable Alzheimer’s disease diagnostic model with regional
abnormality representation via deep learning. NeuroImage, 202:116113, 2019.
[58] Seyed Hani Hojjati, Ata Ebrahimzadeh, Ali Khazaee, Abbas Babajani-Feremi, Alzheimer’s
Disease Neuroimaging Initiative, et al. Predicting conversion from MCI to AD using resting-
state fMRI, graph theoretical approach and SVM. Journal of Neuroscience Methods, 282:69–
80, 2017.
[59] L Mosconi, D Perani, S Sorbi, Karl Herholz, B Nacmias, Vjera Holthoff, Eric Salmon, J-C
Baron, MTR De Cristofaro, A Padovani, et al. MCI conversion to dementia and the APOE
genotype: a prediction study with FDG-PET. Neurology, 63(12):2332–2340, 2004.
[60] Davide Anchisi, Barbara Borroni, Massimo Franceschi, Nasser Kerrouche, Elke Kalbe, Bet-
tina Beuthien-Beumann, Stephano Cappa, Olaf Lenz, Stephan Ludecke, Alessandra Marcone,
et al. Heterogeneity of brain glucose metabolism in mild cognitive impairment and clinical
progression to Alzheimer disease. Archives of Neurology, 62(11):1728–1733, 2005.
[61] Markus Donix, Alison C Burggren, Maria Scharf, Kira Marschner, Nanthia A Suthana, Prabha
Siddarth, Allison K Krupa, Michael Jones, Laurel Martin-Harris, Linda M Ercoli, et al. APOE
associated hemispheric asymmetry of entorhinal cortical thickness in aging and Alzheimer’s
disease. Psychiatry Research: Neuroimaging, 214(3):212–220, 2013.
20[62] Christopher M Weise, Kewei Chen, Yinghua Chen, Xiaoying Kuang, Cary R Savage, Eric M
Reiman, Alzheimer’s Disease Neuroimaging Initiative, et al. Left lateralized cerebral glucose
metabolism declines in amyloid-β positive persons with mild cognitive impairment. NeuroIm-
age: Clinical, 20:286–296, 2018.
[63] Meichen Yu, Marjolein MA Engels, Arjan Hillebrand, Elisabeth CW Van Straaten, Alida A
Gouw, Charlotte Teunissen, Wiesje M Van Der Flier, Philip Scheltens, and Cornelis J Stam.
Selective impairment of hippocampus and posterior hub areas in Alzheimer’s disease: an
MEG-based multiplex network study. Brain, 140(5):1466–1485, 2017.
[64] María Eugenía López, Ricardo Bruna, Sara Aurtenetxe, José Ángel Pineda-Pardo, Alberto
Marcos, Juan Arrazola, Ana Isabel Reinoso, Pedro Montejo, Ricardo Bajo, and Fernando
Maestú. Alpha-band hypersynchronization in progressive mild cognitive impairment: a mag-
netoencephalography study. Journal of Neuroscience, 34(44):14551–14559, 2014.
[65] David López-Sanz, Ricardo Bruña, Pilar Garcés, María Carmen Martín-Buro, Stefan Walter,
María Luisa Delgado, Mercedes Montenegro, Ramón López Higes, Alberto Marcos, and Fer-
nando Maestú. Functional connectivity disruption in subjective cognitive decline and mild
cognitive impairment: a common pattern of alterations. Frontiers in Aging Neuroscience,
9:109, 2017.
[66] Akinori Nakamura, Pablo Cuesta, Alberto Fernández, Yutaka Arahata, Kaori Iwata, Izumi
Kuratsubo, Masahiko Bundo, Hideyuki Hattori, Takashi Sakurai, Koji Fukuda, et al. Elec-
tromagnetic signatures of the preclinical and prodromal stages of Alzheimer’s disease. Brain,
141(5):1470–1485, 2018.
21You can also read