Seven decades of chemotherapy clinical trials: a pan cancer social network analysis - Nature
←
→
Page content transcription
If your browser does not render page correctly, please read the page content below
www.nature.com/scientificreports
OPEN Seven decades of chemotherapy
clinical trials: a pan‑cancer social
network analysis
Xuanyi Li1,16, Elizabeth A. Sigworth1,16, Adrianne H. Wu2,16, Jess Behrens1,
Shervin A. Etemad1, Seema Nagpal3, Ronald S. Go4, Kristin Wuichet5, Eddy J. Chen6,
Samuel M. Rubinstein5, Neeta K. Venepalli7, Benjamin F. Tillman5, Andrew J. Cowan8,
Martin W. Schoen9, Andrew Malty3, John P. Greer5, Hermina D. Fernandes10, Ari Seifter7,
Qingxia Chen1, Rozina A. Chowdhery7, Sanjay R. Mohan5, Summer B. Dewdney11,
Travis Osterman5, Edward P. Ambinder12, Elizabeth I. Buchbinder13, Candice Schwartz7,
Ivy Abraham7, Matthew J. Rioth14, Naina Singh7, Sanjai Sharma15, Michael K. Gibson5,
Peter C. Yang6,16 & Jeremy L. Warner5,16*
Clinical trials establish the standard of cancer care, yet the evolution and characteristics of the social
dynamics between the people conducting this work remain understudied. We performed a social
network analysis of authors publishing chemotherapy-based prospective trials from 1946 to 2018
to understand how social influences, including the role of gender, have influenced the growth and
development of this network, which has expanded exponentially from fewer than 50 authors in 1946
to 29,197 in 2018. While 99.4% of authors were directly or indirectly connected by 2018, our results
indicate a tendency to predominantly connect with others in the same or similar fields, as well as an
increasing disparity in author impact and number of connections. Scale-free effects were evident,
with small numbers of individuals having disproportionate impact. Women were under-represented
and likelier to have lower impact, shorter productive periods (P < 0.001 for both comparisons), less
centrality, and a greater proportion of co-authors in their same subspecialty. The past 30 years were
characterized by a trend towards increased authorship by women, with new author parity anticipated
in 2032. The network of cancer clinical trialists is best characterized as strategic or mixed-motive,
with cooperative and competitive elements influencing its appearance. Network effects such as
low centrality, which may limit access to high-profile individuals, likely contribute to the observed
disparities.
The modern era of chemotherapy began in 1946, with publications describing therapeutic uses of nitrogen
mustard1,2. Over the next 70 years, the repertoire of available cancer treatments has expanded at an ever-increas-
ing pace. Chemotherapeutics have a notably low therapeutic index, i.e., the difference between a harmful and
beneficial dose or combination is often quite small3. Consequently, a complex international clinical trial apparatus
emerged in the 1970s to study chemotherapeutics in controlled settings, and prospective clinical trials remain the
gold standard by which standard of care treatments are e stablished4,5. Discoveries made by successive generations
have led to overall improvement in the prognosis of most c ancers6.
While social network analysis has been used to study patterns of co-authorship in scientific settings7,8, the
social component of clinical trial research is not well characterized. Little is known about how social factors have
shaped the progress of the field, as cancer care has become increasingly subspecialized, and how social network
1
Vanderbilt University, Nashville, TN, USA. 2Mount Holyoke College, South Hadley, MA, USA. 3Stanford University,
Palo Alto, CA, USA. 4Mayo Clinic, Rochester, MN, USA. 5Vanderbilt University Medical Center, 2220 Pierce Ave,
PRB 777, Nashville, TN 37232, USA. 6Massachusetts General Hospital, Harvard Medical School, Boston, MA,
USA. 7University of Illinois at Chicago, Chicago, IL, USA. 8University of Washington, Seattle, WA, USA. 9Saint Louis
University, St. Louis, MO, USA. 10University of North Dakota, Grand Forks, ND, USA. 11Rush University, Chicago,
IL, USA. 12Mount Sinai Medical Center, New York, NY, USA. 13Dana‑Farber Cancer Institute, Harvard Medical
School, Boston, MA, USA. 14University of Colorado, Denver, CO, USA. 15Sequoia Regional Cancer Center, Visalia,
CA, USA. 16These authors contributed equally: Xuanyi Li, Elizabeth A. Sigworth, Adrianne H. Wu, Peter C. Yang and
Jeremy L. Warner. *email: jeremy.warner@vumc.org
Scientific Reports | (2020) 10:17536 | https://doi.org/10.1038/s41598-020-73466-6 1
Vol.:(0123456789)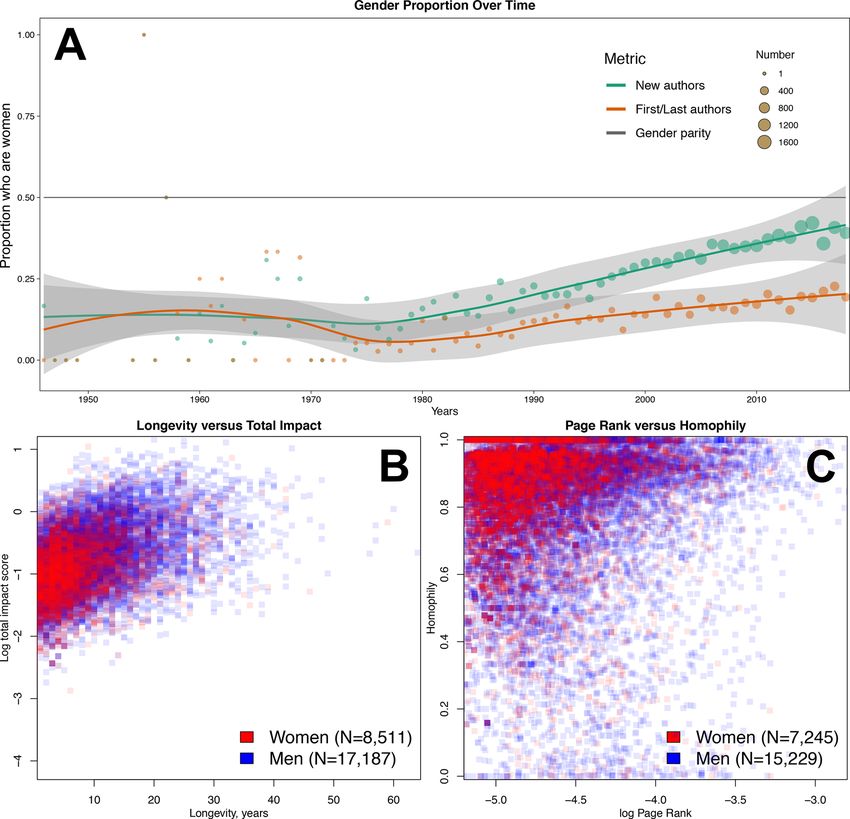
www.nature.com/scientificreports/
characteristics may reveal patterns of inclusiveness, exclusivity, and disparity. Prior literature has established
that women in academic medicine are expected to perform to higher standards yet receive less financial and
institutional support (e.g., grants, awards, salaries, opportunities for tenure) than men with the same qualifica-
tions do9–13. Women must also contend with structural biases against them throughout their careers; this can
manifest in gendered harassment and evaluations, questions of competence, lack of appropriate mentorship and
peer support, and other inhospitable working conditions where they are undervalued, if not actively e xcluded14.
Past work on co-authorship networks indicates that men are overrepresented in senior authorship roles, particu-
larly in high-impact journals and in fields where research is more costly, and accrue more citations than their
counterparts who are women15–19.
We hypothesized that the social network of cancer clinical trialists would be a “strategic” aka “mixed motive”
network, similar to those found in other areas of academic research displaying both collaborative and competitive
elements reflective of the pressures faced by clinial trialists; this type of social network may be especially prone
to preferential attachment, where authors with many co-authorship links are more likely to form new links or
strengthen existing ones than authors with few existing links20. This could contribute to a widening disparity
between authors with early access to resources through personal networks and authors in more socially disadvan-
tageous positions, e.g., those who come from low-income backgrounds or were the first in their family to attend
college21,22. These groups are more likely to include underrepresented minorities, e.g., women of color, who face
a number of discriminatory barriers in pursuing careers in medicine and medical r esearch11,23,24.
In this study, we analyzed the individual impact and collaborative relationships of cancer clinical trialists,
using co-authorship to define the edges, or links, of social networks. Our primary objective was to model the
social network and its dynamic development over time; secondary objectives were to examine the roles of sub-
specialization and gender in relation to metrics of productivity, such as individual author impact, longevity in
the field, position within the network, and similarity to co-authors (homophily).
Results
Baseline characteristics. N = 5599 of 6301 reviewed publications with an aggregate of N = 29,197 authors
met the inclusion criteria (CONSORT Figure S1). Cumulatively, most authors in the network (n = 22,761, 78%)
published at least one randomized trial, with n = 15,340 (52.5%) participating in the publication of a “positive”
trial (Table S2). Most of the included authors (n = 28,087, 96.2%) participated in the primary publication of a
clinical trial, while a smaller subgroup (n = 6,773, 23.2%) participated in the publication of updates. The most
common venues for publication were high-impact clinical journals: the Journal of Clinical Oncology (n = 1595,
28.5%), the Lancet family (n = 710, 12.7%), the New England Journal of Medicine (n = 495, 8.8%), and the Blood
family (n = 495, 8.8%). Co-authorship has changed in a non-linear fashion over time: the median number of
authors per publication increased from n = 6 in 1946 to n = 20 (IQR 16–25) in 2018 (Figure S2). Across subspe-
cialties, the median number of co-authors per publication varied somewhat, from a low of n = 10 (IQR 7–15) in
gynecologic oncology to a high of n = 16 (IQR 11–22) in dermatologic oncology.
Network dynamics. Authorship and co-authorship have grown by over 200-fold: in 1946 there were 12
authors & 30 co-authors; by 2018, there were cumulatively 29,197 authors & 697,084 co-authors (Fig. 1A).
Median longevity is < 1 year at all times, although the number of authors with multiple years in the field
grows substantially over time (Figure S3). A small number of individuals maintained the highest impact over
time—nearly 20 years each in the case of chemotherapy pioneers Sidney Farber and James F. Holland (Figure S4).
In any given year, most authors had a betweenness centrality of < 1% of the maximum; conversely, a very small
number of authors had an exceptionally high score, with 1% of authors accounting for 100% of the total in recent
years (Figure S5). Accordingly, an increasingly smaller proportion of authors were both very highly connected
and highly impactful; in 1970, the 10% highest-impact authors (n = 20) account for 21.4% of links and 54.9%
of impact; in 2018, the same proportion (n = 2920) account for 37.1% of links and 62.3% of impact. First/last
authorship has also become concentrated; in 2018 publications, 10% of authors had at least one such role, whereas
prior to 1980 it was on average > 25% (Figure S6).
The structure of the network changes considerably over time, from relatively dense and connected to sparse
and modular (Fig. 1B). The final network is very sparse (0.16% of possible links are present); nevertheless,
n = 29,029 (99.4%) authors are in a single connected component; the next-largest component comprises 14
authors. Each of the 13 cancer subspecialties developed at different rates, with clear influence of seminal events
in several subspecialties, e.g., the introduction of adjuvant therapy and tamoxifen for breast cancer, completely
new classes of drugs for plasma cell disorders, and immunotherapy for melanoma (Fig. 1C)25–31.
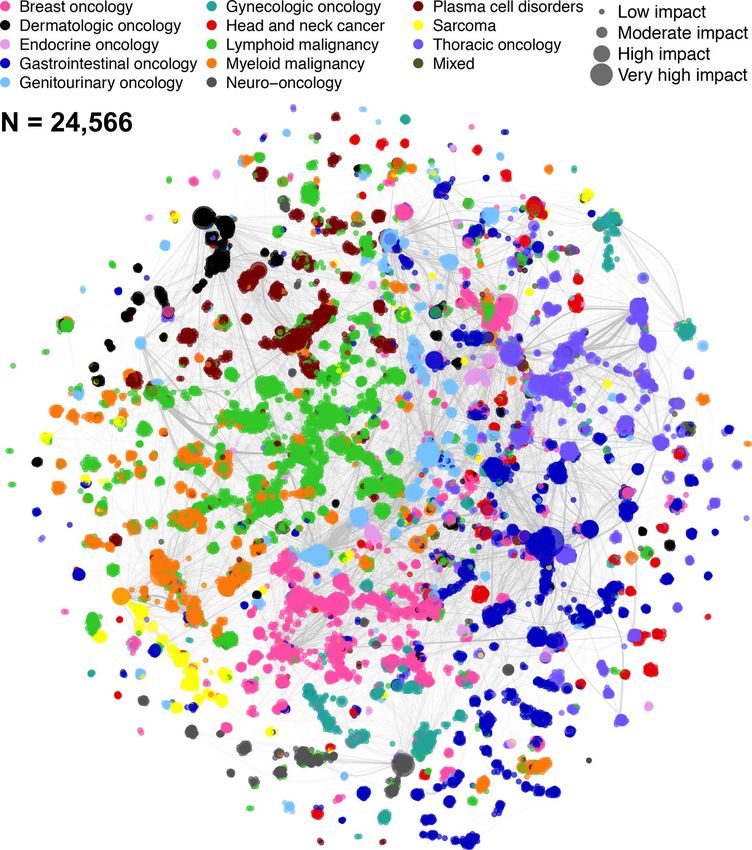
Network visualization and cumulative metrics. The final cumulative network visualization is shown
in Figs. 2 & S7. The impact score of authors is unevenly distributed, median 0.0532 (range 0–14.31); however, the
log-transformed impact scores approximate a normal distribution (Figure S8). Authors with longevity ≥ 1 year
who changed primary subspecialty at least once (n = 2330) had nearly twice the median impact and longevity
of those who remained in one subspecialty (n = 10,276), 0.25 (IQR 0.11–0.6) versus 0.14 (IQR 0.07–0.35) and
13 years (IQR 6–19) versus 7 years (IQR 3–12), respectively (P < 0.001 for both comparisons).
Cumulatively, subspecialized authors with calculable homophily (n = 24,560) have a median proportion of
co-authors sharing the same subspecialty of 88% (IQR 76–95%); 945,167 (71.4%) of these authors’ outlinks are
within-subspecialty. This is reflected by a high assortativity by subspecialty since the mid-1960s (Fig. 1B).
Gender disparities. The proportion of authors who are women remained at a nearly steady state of 15%
until 1980, when it began to gradually increase to a recent high of ~ 40%; over the same time period, the propor-
Scientific Reports | (2020) 10:17536 | https://doi.org/10.1038/s41598-020-73466-6 2
Vol:.(1234567890)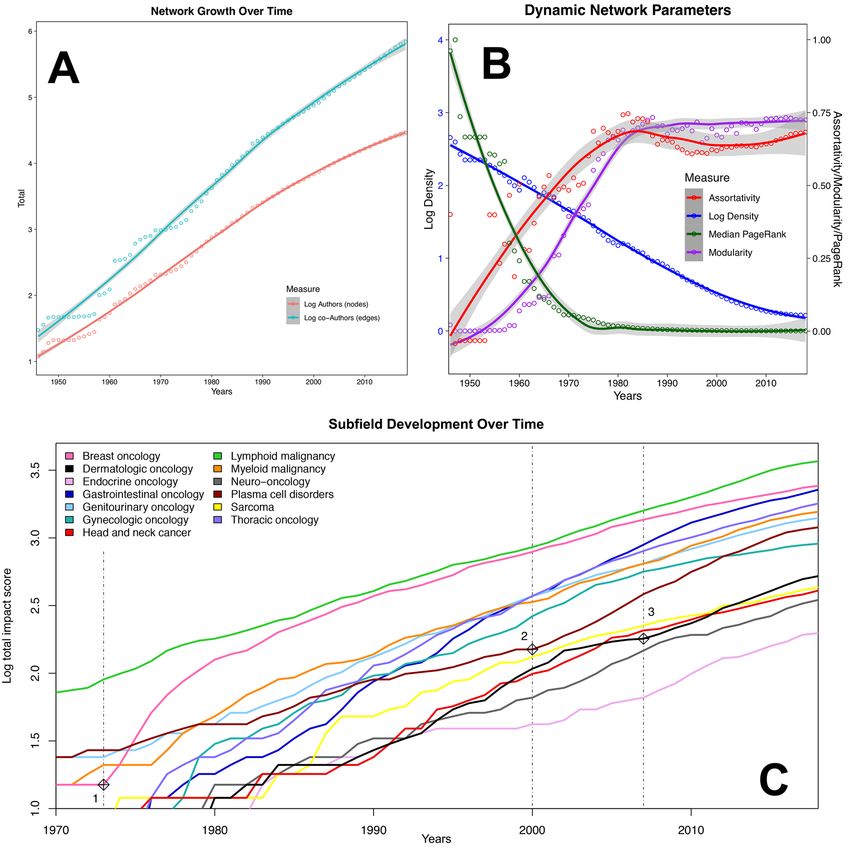
www.nature.com/scientificreports/
Figure 1. Network characteristics. (A) Cumulative growth in authorship and co-authorship over time have
both been nearly log-linear; (B) Network density decreases asymptotically from 45.5% in 1946 to 0.16% in 2018;
modularity follows a sigmoid pattern with a period of linear increase between 1960–80 followed by a plateau
at high modularity; assortativity rapidly increases in early decades; median normalized PageRank decreases
to a low plateau from the 1970s onward; (C) Subspecialties develop at different but broadly parallel rates, with
seminal events apparently preceding accelerations of individual subspecialties, e.g.,: (1) in the four years after
1973, combination therapy (AC25), adjuvant therapy26, and tamoxifen27 were introduced in breast cancer; (2)
thalidomide28 and bortezomib29 were reported to be efficacious for multiple myeloma; and (3) immunotherapy
(ipilimumab30,31) was introduced in the treatment of melanoma.
tion of women who were first/last authors rose much more slowly (Fig. 3A). Cumulatively, n = 17,187 men had a
statistically significantly higher median impact than n = 8511 women, 0.075 (IQR 0.032–0.22) versus 0.051 (IQR
0.022–0.133), P < 0.001; statistically significantly longer median longevity, one year (IQR 0–8) versus zero years
(IQR 0–5), P < 0.001; and higher median PageRank, 1.75 × 10⁻⁵ (IQR 1.01 × 10⁻⁵-3.68 × 10⁻⁵) versus 1.34 × 10⁻⁵
(IQR 8.74 × 10⁻⁶-2.51 × 10⁻⁵). For the n = 15,229 men and n = 7245 women with a calculable subspecialty homo-
phily, men and women had comparable median proportions of co-authors within the same primary subspecialty,
at 0.88 (IQR 0.75–0.95) and 0.89 (IQR 0.78–0.95) respectively. Gender homophily across the network over time
shows that men have consistently been more likely to collaborate with those of the same gender than women; in
the final network, median gender homophily among men was 0.77 (IQR 0.67–0.86) versus 0.26 (IQR 0.17–0.38)
among women. Scatterplots of longevity versus author impact score and PageRank versus homophily are shown
in Fig. 3B,C for the final cumulative network; prior years are shown in Figure S9 & S10. Histograms of gender
homophily across time are shown in Fig. 4.
Scientific Reports | (2020) 10:17536 | https://doi.org/10.1038/s41598-020-73466-6 3
Vol.:(0123456789)www.nature.com/scientificreports/
Figure 2. Final cumulative network visualization. The social network graph represents the cumulative field
of cancer research as of December 31, 2018, with all included published works since 1946 contributing to
authorship and co-authorship weights. Only authors assigned to a subspecialty are visualized; these account
for 84% of all authors in the database. This figure highlights various clustering trends by subspecialty, such as
the apparent sub-clusters of sarcoma research (yellow) and the two dominant clusters of breast cancer research
(pink). It is clear as well that certain subspecialties are more cohesive than others, such as the tightly clustered
dermatology (black) compared to the spread-out head and neck cancer authors (red).
Sensitivity analysis. Normalized score distributions did not change significantly, although modulation of
the trial design coefficient led to a bimodal peak (Figure S11). Correlation of assortativity and modularity was
high, ranging from 0.815–0.999 for the former and 0.981–0.999 for the latter (Table S3; Figure S12).
Discussion
The remarkable gains in the fields of hematology and oncology can be ascribed to the tireless work of numer-
ous trialists and the generosity of countless patient participants. As a result, systemic antineoplastics now stand
beside surgery and radiotherapy as a pillar of cancer care. Our analysis of clinical trialists as a social network,
particularly with respect to the density distribution of PageRank, reveals a mixed-motive network that differs
Scientific Reports | (2020) 10:17536 | https://doi.org/10.1038/s41598-020-73466-6 4
Vol:.(1234567890)www.nature.com/scientificreports/
Figure 3. Gender disparities in the network. (A) The network is overwhelmingly dominated by men until 1980,
when a trend towards increasing authorship by women begins to be seen; however, representation by women in
first/last authorship remains low; gray shaded lines are 95% confidence intervals of the LOESS curves; (B) Men
tend on average to have a longer productive period and to achieve a higher author impact score than women
(P < 0.001 for both comparisons); (C) Men tend on average to be more central and have more collaborations
outside of their subspecialty. Note that the homophily calculation requires a subspecialty assignment, which
explains the slightly lower numbers in (C) as compared to (B).
substantially from “collegial” and “friend-based” online social networks. While clinical trials are conducted
towards a collaborative goal—improved outcomes for all cancer patients—there are significant competitive pres-
sures. Examples of these pressures include resource limitations (e.g., funding and patients available for accrual),
the tension between prioritization of cooperative group versus industry-funded trials, personal motivations such
as academic promotion or leadership opportunities, and institutional reputation.
The emergence of formal and informal leaders in scientific networks has been shown to facilitate research as
well as create c lusters32. As Fig. 2 shows, there is a strong tendency for clustering based on subspecialty in the
complete network, although some subspecialties (e.g., lymphoid and myeloid malignancies) have many more
interconnections than others (e.g., sarcoma and neuro-oncology). Many of these clusters appear to be organized
around an individual or group of individuals who have high impact and centrality. As an organizational principle,
these individuals appear to rarely be in direct competition, but their presence is a clear indicator of scale-free
phenomena within the network. The facts that betweenness centrality follows a power law cumulative distribution
bolsters this theory. Scale-free phenomena, which are defined by a power law distribution of connectedness, are
very common in strategic networks, especially when they become increasingly sparse, as this network does33.
The two related theories for this network behavior are preferential attachment and fitness. The former observes
that those with impact tend to attract more impact; the latter postulates that such gains for the “fittest” come at
the expense of the “less fit”34. Seminal events (Fig. 1C) are likely a driver of preferential a ttachment35, and may
Scientific Reports | (2020) 10:17536 | https://doi.org/10.1038/s41598-020-73466-6 5
Vol.:(0123456789)www.nature.com/scientificreports/
Gender homophily across network by year
1950 1960 1970
6 80
4 20 60
40
2 10
20
0 0 0
0.00 0.25 0.50 0.75 1.00 0.00 0.25 0.50 0.75 1.00 0.00 0.25 0.50 0.75 1.00
1975 1980 1985
300
100 200
200
50 100 100
0 0 0
0.00 0.25 0.50 0.75 1.00 0.00 0.25 0.50 0.75 1.00 0.00 0.25 0.50 0.75 1.00
1990 1995 2000 Gender
400
400
Count
300 400 Women
300
200 200 200 Men
100 100
0 0 0 Undetermined
0.00 0.25 0.50 0.75 1.00 0.00 0.25 0.50 0.75 1.00 0.00 0.25 0.50 0.75 1.00
2005 2010 2015
800 1000
600
600 750
400 400 500
200 200 250
0 0 0
0.00 0.25 0.50 0.75 1.00 0.00 0.25 0.50 0.75 1.00 0.00 0.25 0.50 0.75 1.00
2016 2017 2018
1000 1200
750 900 900
500 600 600
250 300 300
0 0 0
0.00 0.25 0.50 0.75 1.00 0.00 0.25 0.50 0.75 1.00 0.00 0.25 0.50 0.75 1.00
Gender homophily
Figure 4. Gender homophily across the network by year. A value of one indicates co-authorship exclusively
with co-authors of the same gender, whereas a value of zero indicates co-authorship exclusively with co-authors
of another gender. Values among men trend higher than among women, indicating that men generally
collaborate more with men, as do women. The y-axis range changes across the years to reflect the rapidly
increasing size of the overall network.
partially explain why some authors change their primary subspecialty at least once over time (e.g., through a
“bandwagon” effect driven by the diffusion of ideas36). Given that these authors were observed to have nearly
twice the impact and longevity of their single subspecialty peers, this dynamic will be a focus of future study,
including calculation of the Q factor, a metric developed to quantify the ability of a scientist to “take advantage of
the available knowledge in a way that enhances (Q > 1) or diminishes (Q < 1) the potential impact p of a paper”37.
In the analysis of network dynamics (Fig. 1B), the field as a whole appears to emerge in the 1970s, which is also
when medical oncology and hematology were formally recognized through board certification. Measurements of
essimism38 of the late 1960s was captured by Sidney Farber:
field maturity are by their nature subjective, but the p
“…the anticancer chemicals, hormones, and the antibiotics…marked the beginning of the era of chemotherapy
of cancer, which may be described after 20 years as disappointing because progress has not been more rapid…”39.
These concerns prompted the US National Cancer Act of 1971, which was followed by the leveling of modularity
at a very high level from 1976 onwards, suggesting that the subspecialties generated in the 1970s have remained
stable. The assortativity by subspecialty has increased as well, with recent levels approximately twice those seen in
a co-authorship network of physicists20. While median PageRank has decreased markedly, indicating decreasing
influence for the average author, the distribution in 2018 is broadly right-skewed (Figure S13). These findings
reveal a high level of increasing exclusivity, suggesting that it is becoming progressively more difficult to join the
top echelon of the network. This has major implications for junior investigators’ mobility, and potentially for the
continued health of the network as a whole.
While there is much to be applauded in the continued success of translating research findings into the clinic,
we observed clear gender disparities within the cancer clinical trialist network: women have a statistically sig-
nificantly lower final impact score, shorter productive period, less centrality, and less collaboration with those
outside of their primary subspecialty. These findings are consistent with and build upon previous literature on
Scientific Reports | (2020) 10:17536 | https://doi.org/10.1038/s41598-020-73466-6 6
Vol:.(1234567890)www.nature.com/scientificreports/
the challenges facing women in pursuing and remaining in academic careers10,16,19,40. They are also consistent
with more recent gender disparity findings, such as those observed in research published on COVID-1941. Other
studies investigating the basis for such a gender gap have identified several layers of barriers to the advancement
of women in academic medicine. These include sexism in the academic environment, lack of mentorship, and
inequity with regards to resource allocation, salary, space, and positions of i nfluence42,43. Our study suggests that
additional network factors such as relatively low centrality, which indicates a lack of access to other individuals
of influence, and high homophily, which indicates a lack of access to new ideas and perspectives, also perpetuate
the gender gap—corroborating recent findings from graduate school social n etworks44.
It is somewhat encouraging that there has been a steady increase in the proportion of authorship by women
since 1980 (Fig. 3A). This increase is observed approximately a decade after the passage of Title IX of the US Civil
Rights Act in 1972. Given that the majority of authors in this network are clinicians, a partial explanation could
be that US-based women began to attend previously all-male medical schools in the early 1970s, completed their
training, and began to contribute to the network as authors approximately 10 years later. If the nearly linear trend
continues, we predict that gender parity for new authors entering the network will be reached by the year 2032,
26 years after US medical school enrollment approached p arity45. However, the proportion of first/last authors
who are women is growing much more slowly, and parity may not be reached for 50+ years, if at all. Given that
senior authorship is a traditional metric of scholarly productivity, it may be particularly difficult for clinical
trialists who are women to obtain promotion under the current paradigm. One possible solution is to increase
the role of joint senior authorship, which remains vanishingly rare in the clinical trials domain (Furman et al.
201446 is one of very few examples that we are aware of)—although this is predicated on the acceptance of these
roles by advancement and promotion committees. The field itself may also suffer from slow entry of new talent
and a lack of broad perspectives.
While the gender mapping algorithm and manual lookups are imperfect, our approach is consistent with
prior work in this area16,47. Unisex names posed a particular challenge48. It should be noted that we could not
account for all situations where an author changed their name (e.g., a person assumed their spouse’s surname);
this could have led to overestimation of representation by women and underestimation of impact, since this
practice is more common with women. It is also possible that an individual’s gender identity does not match the
gender assignment of their given name. Future work will include further analysis of gender disparities, factoring
in institutional affiliation and highest degree(s) obtained, which are both likely to have significant influence on
publication and senior a uthorship49,50.
There are several additional limitations to this work, starting with the fact that co-authorship is but one way to
measure social network interactions and this study reports results from published trials, which induces publica-
tion bias. Although HemOnc.org aims to be the most comprehensive resource of its kind, non-randomized trials
and randomized phase II trials are intentionally underrepresented, given that findings at this stage of investiga-
tion infrequently translate to practice-changing results (e.g., approximately 70% of oncology drugs fail during
phase II)51–53. The effect of any biases introduced by this underrepresentation is unclear, given the confounding
influence of publication bias, which may itself be subject to gender d isparity54. Some older literature which no
longer has practice-changing implications may have been overlooked.
During name disambiguation, some names could not be resolved, primarily because neither MEDLINE nor
the primary journal site contained full names. This effect is non-random, since certain journals do not publish
full names. The choice of coefficients and their relative weights was based on clinical intuition and consensus;
given that the “worth” of metrics such as first/last authorship is fundamentally qualitative, there must be some
degree of subjectivity when formulating a quantitative algorithm. While the sensitivity analysis demonstrated
that neither normalized author impact score distribution, assortativity, nor modularity are majorly changed by
variation in the trial design and author role coefficients, it remains possible that other combinations of coefficients
and relative weightings could lead to different results. Furthermore, our impact algorithm weighs heavily on
first and last authorship, but the definition of senior authorship has changed over time. For example, in the 1946
article by Goodman et al.2, the authors were listed in decreasing order of seniority (personal communication).
In general, the impact score used in this paper, although similar to others proposed in the academic literature,
is not validated and should be interpreted with caution. Finally, the majority of authors in this database publish
extensively, and their impact as measured here should not be misconstrued to reflect their contributions to the
cancer field more broadly.
In conclusion, we have described the first and most comprehensive social network analysis of the clinical
trialists involved in chemotherapy trials. We found emergent properties of a strategic network and clear indica-
tions of gender disparities, albeit with improvement in representation in recent decades. The network has been
highly modular and assortative for the past 40 years, with little collaboration across most subspecialties. As the
field pivots from an anatomy-based to a precision oncology paradigm, it remains to be seen how the network
will re-organize so that the incredible progress seen to date can continue.
Methods
Data source and curation process. All prospective trials of systemic antineoplastics published between
1946–2018 and referenced on HemOnc.org were considered for inclusion. HemOnc.org is the largest collabora-
tive wiki of chemotherapy drugs and regimens and has a formal curation p rocess55. In order for a reference to be
included on HemOnc.org, it generally must include at least one regimen meeting the criteria outlined here: https
://hemonc.org/wiki/Eligibility_criteria. As such, the majority of references on HemOnc.org are randomized
controlled trials (RCTs) or non-randomized trials with at least 20 participants and/or practice-changing implica-
tions. One of the main goals of HemOnc.org is creating a database of all standard of care systemic antineoplastic
therapy regimens. This is difficult as there is no universally accepted definition of standard of care except in a
Scientific Reports | (2020) 10:17536 | https://doi.org/10.1038/s41598-020-73466-6 7
Vol.:(0123456789)www.nature.com/scientificreports/
legal capacity. For example, the state of Washington, in its legislation on medical negligence, inversely defines the
standard of care as “exercis[ing] that degree of skill, care, and learning possessed at that time by other persons in
the same profession”. We currently employ four separate definitions that meet the threshold of standard of care:
1. The control arm of a phase III randomized controlled trial (RCT). By implication, this means that all phase
III RCTs with a control arm must eventually be included on the website.
2. The experimental arm(s) of a phase III RCT that provide(s) reasonable evidence (P-value less than 0.10) of
superior efficacy for an intermediate surrogate endpoint (e.g., PFS) or a strong endpoint (e.g., OS).
3. A non-randomized study that is either:
(i) The basis for a regulatory agency approval (e.g., the US Food and Drug Administration [FDA])
(ii) Recommended as a top-level regimen by the American Society of Clinical Oncology (ASCO), the
European Society for Medical Oncology (ESMO), or the National Comprehensive Cancer Network
(NCCN).
4. Any study (including case series and retrospective studies) that is specifically recommended by a member of
the HemOnc.org Editorial Board. All section editors of the Editorial Board with direct oversight of disease-
specific pages are board-eligible or board-certified physicians.
In order to identify new regimens and study references for inclusion on HemOnc.org, we undertake several
parallel screening methods:
1. PubMed search for (“Phase 3”[Title/Abstract] OR “Phase III”[Title/Abstract]) AND “neoplasms”[MeSH
Terms] AND Clinical Trial[ptyp] (annual; 2019 review currently underway)
2. PubMed email alert for “Clinical Trial, Phase III”[Publication Type] AND “Neoplasms”[Mesh] (subscription;
ongoing per PubMed alerting criteria)
3. Review of the eTOC of the following “top-tier” general medical and hematology/oncology journals (subscrip-
tion; ongoing per journal publication schedules):
(i) JAMA
(ii) The Lancet
(iii) The New England Journal of Medicine
(iv) Annals of Oncology
(v) Blood
(vi) JAMA Oncology
(vii) Journal of Clinical Oncology
(viii) The Lancet Haematology
(ix) The Lancet Oncology
4. Time permitting, review of the eTOC of other hematology/oncology journals, conference proceedings, and
e-mail alerts
5. Review of all freely available Cochrane Library Reviews under the topics “Cancer” and “Blood disorders”
(biennial; last completed: October 2018)
6. Review of all ASCO, ESMO, and NCCN clinical practice guidelines (biennial; last completed: December
2018)
7. Review of all studies cited on the FDA drug label (“package insert”) section 14 (CLINICAL STUDIES) for all
antineoplastic agents (ongoing for new approvals and new indications; review of all available existing labels
completed: September 2019)
8. Queries to all Editorial Board members (quarterly).
As part of the process of building HemOnc.org, we have also systematically reviewed all Lancet, JAMA, and
New England Journal of Medicine tables of contents from 1946 to December 31, 2018. In addition, the citations
of any included manuscript are hand-searched for additional citations. For any treatment regimen that has been
subject to randomized comparison, we additionally seek to identify the first instance in which such a regimen was
evaluated as an experimental arm; if no such determination can be made, we seek the earliest non-randomized
description of the regimen for inclusion on the website. In order or prioritization, phase III RCTs are added first,
then smaller RCTs such as randomized phase II, followed by non-randomized trials, followed by retrospective
studies or case series identified by our editorial board as relevant to the practice of hematology/oncology.
When a reference is added to HemOnc.org, bibliographic information including authorship is recorded. The
usually coincides with MEDLINE record details, although some older references in MEDLINE are capped at ten
authors and are manually completed based upon the publication of record. For trials that do not list individual
authors (e.g., The Elderly Lung Cancer Vinorelbine Italian Study G roup56), the original manuscript and appen-
dices are examined for a writing committee. If a writing committee is identified, the members of this committee
are listed as authors in the order that they appeared in the manuscript. If no writing committee is identified,
the chairperson(s) of the study group are listed as the first & last authors. If no chairpersons are listed, the cor-
responding author is listed as the sole author.
Scientific Reports | (2020) 10:17536 | https://doi.org/10.1038/s41598-020-73466-6 8
Vol:.(1234567890)www.nature.com/scientificreports/
Publications solely consisting of the evaluation of drugs not yet approved by the FDA or other international
approval bodies were not included. Trials that appeared in abstract form only, reviews, retrospective studies,
meta-analyses, and case reports were excluded, as were trials reporting only on local interventions such as sur-
gery, radiation therapy, and intralesional therapy. Non-antineoplastic trials (Table S1) and trials of supportive
interventions (e.g., antiemesis; growth factor support) were also excluded.
Disambiguation of author names. For each included publication, author names were extracted and dis-
ambiguated. Author names on HemOnc.org are stored in the MEDLINE LastName_FirstInitial (MiddleInitial)
format, which can lead to two forms of ambiguity: (1) the short form, e.g., Smith_J, can refer to two or more indi-
viduals, e.g., Julian and Jane Smith; (2) two short forms can refer to the same individual, e.g., Kantarjian_H and
Kantarjian_HM. Additionally, names can be misspelled and individuals can change their name over time (e.g.,
a person assumes their spouse’s surname). We undertook several steps to disambiguate names: (1) full first and
middle names, when available, were programmatically accessed through the NCBI PubMed e Utils57 application
programming interface; (2) when not available through MEDLINE, full first names were searched for on jour-
nal websites or through web search engines; (3) automatic rules were developed to merge likely duplicates; and
(4) some names were manually merged (e.g., misspellings: Benboubker_Lofti and Benboubker_Lotfi; alternate
forms: Rigal-Huguet_Francoise and Huguet-Rigal_Francoise; and subsumptions: Baldotto_Clarissa and Serodio
da Rocha Baldotto_Clarissa). Transformation algorithms are available upon request, and the full mapping table
is provided in Supplemental File 1.
Gender mapping. Once the name disambiguation step was complete, we mapped authors with full name
available to gender. We first mapped names to genders using US census data, which includes the relative frequen-
cies of given names by gender in the population of US birth from 1880 to 2017. We calculated the gender ratio
for names that appeared as both genders. For names with gender ratio > 0.9 for one gender (e.g., John, Rebecca),
we assigned the name to that gender. To expand gender mapping to include names that are more frequently
seen internationally (e.g., Jean, Andreas), we used a program that searches from a dictionary containing gender
information about names from most European countries as well as some Asian and Middle Eastern c ountries58.
For unmatched first names (e.g., Dana, Michele), we manually reviewed for potential gender assignment. For
some names that are masculine in certain countries and feminine in others (e.g., Andrea, Daniele, and Pascale
are masculine in Italy and feminine elsewhere), we mapped based on surnames. Finally, we performed manual
internet searches to look for photographs and pronouns used in online content such as faculty profiles, book
biographies, and professional social media accounts for the remaining unmapped full names associated with a
longevity of greater than one year.
A total of 25,698 (88%) authors were assigned to the categories of woman (N = 8511; 29.2%) or man
(N = 17,187; 58.9%). The gender of most of the people with unassigned names could not be determined because
they only appeared with initials (N = 2716; 9.3%) in the primary publication and MEDLINE. The remaining
N = 685 (2.3%) were ambiguously gendered names that could not be resolved through manual searching, and
were excluded in the gender-specific analyses. The full mapping table is provided in Supplemental File 2.
Author impact score. We considered existing metrics for measuring author impact59–62, but ultimately
proceeded with our own formulation given some of the unique considerations of prospective clinical trials and
their impact. Every author was assigned an impact score, using an algorithm calculated per manuscript using
four coefficients: (1) author role; (2) trial type; (3) citation score; (4) primary versus updated analysis. The coef-
ficients are multiplied to arrive at the score, and the total author impact score is summed across all of their
published manuscripts.
Author Role: First and last author roles are assigned a coefficient of three; middle authors are assigned a
coefficient of one. When joint authorship is denoted in a MEDLINE record, there is an additional attribute
“EqualContrib” that is set to “Y” (yes). We look for this during the parsing process and treat these authors as
first or last authors when the attribute is detected.
Trial Type: Any prospective trial with randomization is denoted as randomized and the authors of any manu-
script reporting on such a trial are assigned a coefficient of two. Non-randomized trials are assigned a coefficient
of one. For manuscripts that reported on more than one trial with mixed designs (i.e., one or more randomized
and one or more non-randomized trials), the randomized coefficient was used.
Citation Score: We programmatically obtained a snapshot of citation counts from Google Scholar from Sep-
tember 2019 and used unadjusted total citations as the citation score coefficient for the years 1946–2008. As more
recent publications are still accruing citations, raw citation count is not an appropriate measure of their impact.
Therefore, we have calculated a blended citation score for articles published between 2009–2018, adding the
phased in median citation count for the journal tier in which the article was published for the years 1946–2008
(see Tables S4 & S5 and Figure S14). The citations scores are normalized to the manuscript with the maximum
number of citations (Stupp et al. 2 00563, with 13,341 citations), such that the maximum citation score is one.
Primary Publications vs. Updates: The baseline coefficient is one. For updates, this score is multiplied by a
half-life decay coefficient; i.e., scores for the first update are multiplied by 50%; scores for the second update by
25%; and so forth. This rule is applied equally to updates and subgroup analyses. For manuscripts that reported
on pooled updates of more than one trial, the score was multiplied by the half-life coefficient corresponding to
the update that resulted in the maximum score.
See examples in Supplemental Methods.
Scientific Reports | (2020) 10:17536 | https://doi.org/10.1038/s41598-020-73466-6 9
Vol.:(0123456789)www.nature.com/scientificreports/
Subspecialty designation of each publication. Each publication was assigned to one of 13 disease-
specific cancer subspecialties based on the cancer(s) studied (Table S1). The majority of publications report on
a clinical trial carried out in one disease or several diseases mapping to the same subspecialty. For publications
studying diseases that map to more than one subspecialty, each author’s impact score for that publication was
divided evenly across the subspecialties. Several clinical trials employ a site-agnostic approach, e.g., to a “cancer
of unknown primary” or to biomarker-defined subsets of cancers (e.g., a basket t rial64); for these, impact across
subspecialties was split manually (Table S6).
Subspecialty designation based on authorship. Authors were eligible for assignment to a primary
subspecialty based on whether they were a first or last author at least once in the subspecialty, or whether they
had a cumulative impact of at least one standard deviation below the mean of the author impact score of all
authors in the subspecialty. Authors who met either of these criteria were assigned to a primary subspecialty
based on where the majority of their impact lay; if an author had equal impact in two or more subspecialties they
were assigned equally to the subspecialties. This assignment was recalculated on an annual basis if the author
had new publications, and primary subspecialty was re-assigned if a new subspecialty met either of the criteria
and the impact in that subspecialty was higher than in the previous primary subspecialty. Authors not meeting
either of these criteria were assigned a primary subspecialty of “None” and were not included in the homophily
analysis or the network visualization.
Author longevity. Author longevity was calculated as the interval between their first and final publication
in the database. Given that preparing and publishing results of clinical trials can take substantial time, authors
with first publications prior to 2016 and final ones in 2016 or 2017 had their final publication year adjusted to
2018.
Social network construction and metrics. A dynamic social network was created with nodes repre-
senting authors and links representing co-authorship. The dynamic social network was discretized by year and
the authors, scores, and links were cumulative (e.g., the 20th network was cumulative from 1946–1965). There-
fore, once an author is added to the network, they remain in the network, with their impact score cumulatively
increasing as they publish and remaining constant if publication activity ceases. The following temporal metrics
were calculated: (1) network density (the number of actual connections/links present divided by the total num-
ber of potential connections); (2) modularity65 by subspecialty (a measure of how strongly a network is divided
into distinct communities, in this case subspecialties, defined as the number of edges that fall within a set of
specified communities minus the number expected in a network with the same number of vertices and edges
whose edges were placed randomly); (3) a ssortativity66 by subspecialty (a measure of the preference of nodes in
a network to attach to others that are similar in a defined way, in this case the same subspecialty; assortativity is
positive if similar vertices tend to connect to each other, and negative if they tend to not connect to each other);
(4) betweenness centrality67 (a measure reflecting how important an author is in connecting other authors, cal-
culated as the proportion of times that an author is a member of the bridge that forms the shortest path between
any two other authors); (5) PageRank68 (another measure of centrality, this time considering the connection pat-
terns among each author’s immediate neighbors; its value for each author is the probability that a person starting
at any random author and randomly selecting links to other authors will arrive at the author); and (6) proportion
of co-authors sharing either the same primary subspecialty designation or the same gender (hereafter referred to
as homophily). Network density, modularity, and assortativity are calculated at the network level, while between-
ness centrality, PageRank, and homophily are calculated at the author (node) level. Further definitions of these
metrics are provided in the Supplemental Glossary.
All metrics incorporated the weighted co-authorship score, which takes into account each co-author’s impact
modified by the number of authors of an individual publication. For each pairwise collaboration, as defined
by co-authorship on the same manuscript, a co-authorship score was calculated and used as the edge weight;
duplicated edges were allowed to reflect the fact that weights could be distributed in a non-even fashion (e.g.,
two co-authors could be middle authors on a lower-impact publication as well as senior authors on a separate
high-impact publication). This score was first calculated by multiplying the individual authors’ manuscript-
specific impact scores together. In order to acknowledge the role of middle authors in large multi-institutional
studies, this preliminary score was divided by the total number of authors on the manuscript. This has the effect
of decreasing the weight of any individual co-authorship relationship in a paper with many authors, while allow-
ing the overall weight of the neighborhood consisting of all co-authorship connections to increase linearly with
the number of authors (see examples in Supplemental Methods).
In order to visualize the final cumulative network, layout was determined using the distributed recursive graph
algorithm69. Nodes were sized by author impact score rank and colored by primary subspecialty designation.
Edge width was determined by the weighted co-authorship score.
Statistical analysis. Non-independent network metrics including growth, density, assortativity, modu-
larity, and PageRank are reported descriptively with medians and interquartile ranges (IQR). Gender propor-
tion over time was fit with locally estimated scatterplot smoothing (LOESS) regression using default settings
of degree = 2 with smoothing parameter/span α = 0.7570. For the final cumulative network, the independent
variables author impact score and longevity were compared (1) between genders and (2) by whether the author
changed subspecialties over time; only those authors with longevity ≥ 1 year were included in the second com-
parison. These comparisons were made with the two-sided Wilcoxon rank sum test; P value < 0.05 was consid-
ered statistically significant.
Scientific Reports | (2020) 10:17536 | https://doi.org/10.1038/s41598-020-73466-6 10
Vol:.(1234567890)www.nature.com/scientificreports/
Sensitivity analysis. To determine whether the scoring algorithm was robust to modifications, we con-
ducted a sensitivity analysis where the author role and trial design coefficients were varied by ± 67% and ± 50%,
respectively. Normalized density distributions for the final cumulative network under each permutation were
calculated, and temporal assortativity and modularity were compared to baseline with Pearson’s correlation coef-
ficient.
Conference presentation. A version of this manuscript is posted on the medRxiv preprint server, accessi-
ble here: https://www.medrxiv.org/content/10.1101/19010603v1. A very early version of the work was presented
in poster format at the 2018 Visual Analytics in Healthcare workshop (November 2018). There are no other prior
presentations.
Data availability
ataverse71.
The datasets generated and analyzed in this study are available at Harvard D
Received: 3 January 2020; Accepted: 17 September 2020
References
1. Gilman, A. & Philips, F. S. The biological actions and therapeutic applications of the B-chloroethyl amines and sulfides. Science
103, 409–436 (1946).
2. Goodman, L. S. & Wintrobe, M. M. Nitrogen mustard therapy; use of methyl-bis (beta-chloroethyl) amine hydrochloride and tris
(beta-chloroethyl) amine hydrochloride for Hodgkin’s disease, lymphosarcoma, leukemia and certain allied and miscellaneous
disorders. J. Am. Med. Assoc. 132, 126–132 (1946).
3. Einhorn, L. H. General principles of cancer chemotherapy. Conn. Med. 40, 159–168 (1976).
4. Gehan, E. A. & Schneiderman, M. A. Historical and methodological developments in clinical trials at the National Cancer Institute.
Stat Med9, 871–880; discussion 903–906 (1990).
5. DeVita, V. T. & Chu, E. A history of cancer chemotherapy. Cancer Res. 68, 8643–8653 (2008).
6. Siegel, R. L., Miller, K. D. & Jemal, A. Cancer statistics, 2019. CA Cancer J. Clin. 69, 7–34 (2019).
7. Bales, M. E. et al. Associating co-authorship patterns with publications in high-impact journals. J. Biomed. Inform. 52, 311–318
(2014).
8. Biglu, M.-H., Abotalebi, P. & Ghavami, M. Breast cancer publication network: profile of co-authorship and co-organization.
Bioimpacts 6, 211–217 (2016).
9. Wennerås, C. & Wold, A. Nepotism and sexism in peer-review. Nature 387, 341–343 (1997).
10. Shen, H. Inequality quantified: Mind the gender gap. Nat. News 495, 22 (2013).
11. Leslie, S.-J., Cimpian, A., Meyer, M. & Freeland, E. Expectations of brilliance underlie gender distributions across academic dis-
ciplines. Science 347, 262–265 (2015).
12. van der Lee, R. & Ellemers, N. Gender contributes to personal research funding success in The Netherlands. Proc. Natl. Acad. Sci.
USA 112, 12349 (2015).
13. Oliveira, D. F. M., Ma, Y., Woodruff, T. K. & Uzzi, B. Comparison of national institutes of health grant amounts to first-time male
and female principal investigators. JAMA 321, 898–900 (2019).
14. Penny, M., Jeffries, R., Grant, J. & Davies, S. C. Women and academic medicine: a review of the evidence on female representation.
J. R. Soc. Med. 107, 259–263 (2014).
15. Jagsi, R. et al. The ‘gender gap’ in authorship of academic medical literature–a 35-year perspective. N. Engl. J. Med. 355, 281–287
(2006).
16. Larivière, V., Ni, C., Gingras, Y., Cronin, B. & Sugimoto, C. R. Bibliometrics: Global gender disparities in science. Nat. News 504,
211 (2013).
17. Bendels, M. H. K., Müller, R., Brueggmann, D. & Groneberg, D. A. Gender disparities in high-quality research revealed by Nature
Index journals. PLoS ONE 13, e0189136 (2018).
18. Bendels, M. H. K. et al. The gender gap in highest quality medical research—A scientometric analysis of the representation of
female authors in highest impact medical journals. Dtsch. Med. Wochenschr. 143, e85–e94 (2018).
19. Huang, J., Gates, A. J., Sinatra, R. & Barabási, A.-L. Historical comparison of gender inequality in scientific careers across countries
and disciplines. Proc. Natl. Acad. Sci. USA 117, 4609 (2020).
20. Newman, M. E. J. The structure of scientific collaboration networks. PNAS 98, 404–409 (2001).
21. Gulati, R., Nohria, N. & Zaheer, A. Strategic networks. Strateg. Manag. J. 21, 203–215 (2000).
22. Cornwell, E. Y. & Cornwell, B. Access to expertise as a form of social capital: an examination of race- and class-based disparities
in network ties to experts. Sociol. Perspect. 51, 853–876 (2008).
23. Metcalf, H., Russell, D. & Hill, C. Broadening the science of broadening participation in STEM through critical mixed methodolo-
gies and intersectionality frameworks. Am. Behav. Sci. https://doi.org/10.1177/0002764218768872 (2018).
24. Golden, S. H. (2019) The perils of intersectionality: racial and sexual harassment in medicine. J. Clinical Investigation129, 3465.
25. Jones, S. E., Durie, B. G. & Salmon, S. E. Combination chemotherapy with adriamycin and cyclophosphamide for advanced breast
cancer. Cancer 36, 90–97 (1975).
26. Fisher, B. et al. 1-Phenylalanine mustard (L-PAM) in the management of primary breast cancer. A report of early findings. N. Engl.
J. Med.292, 117–122 (1975).
27. Kiang, D. T. & Kennedy, B. J. Tamoxifen (antiestrogen) therapy in advanced breast cancer. Ann. Intern. Med. 87, 687–690 (1977).
28. Singhal, S. et al. Antitumor activity of thalidomide in refractory multiple myeloma. N. Engl. J. Med. 341, 1565–1571 (1999).
29. Orlowski, R. Z. et al. Phase I trial of the proteasome inhibitor PS-341 in patients with refractory hematologic malignancies. J. Clin.
Oncol. 20, 4420–4427 (2002).
30. Weber, J. S. et al. Phase I/II Study of Ipilimumab for Patients With Metastatic Melanoma. JCO 26, 5950–5956 (2008).
31. Hodi, F. S. et al. Improved survival with ipilimumab in patients with metastatic melanoma. N. Engl. J. Med. 363, 711–723 (2010).
32. Long, J. C., Cunningham, F. C., Wiley, J., Carswell, P. & Braithwaite, J. Leadership in complex networks: the importance of network
position and strategic action in a translational cancer research network. Implement Sci 8, 122 (2013).
33. Hu, M.-B. et al. A unified framework for the pareto law and Matthew effect using scale-free networks. Eur. Phys. J. B 53, 273–277
(2006).
34. Kong, J. S., Sarshar, N. & Roychowdhury, V. P. Experience versus talent shapes the structure of the Web. PNAS 105, 13724–13729
(2008).
35. Albert, R. & Barabási, A.-L. Topology of evolving networks: local events and universality. Phys. Rev. Lett. 85, 5234–5237 (2000).
36. Granovetter, M. Threshold models of collective behavior. Am. J. Sociol. 83, 1420–1443 (1978).
Scientific Reports | (2020) 10:17536 | https://doi.org/10.1038/s41598-020-73466-6 11
Vol.:(0123456789)www.nature.com/scientificreports/
37. Sinatra, R., Wang, D., Deville, P., Song, C. & Barabási, A.-L. Quantifying the evolution of individual scientific impact. Science 354,
aaf5239 (2016).
38. Hiatt, H. H. Cancer chemotherapy–present status and prospects. N. Engl. J. Med. 276, 157–166 (1967).
39. Farber, S. Chemotherapy in the treatment of Leukemia and Wilms’ tumor. JAMA 198, 826–836 (1966).
40. Rochon, P. A., Davidoff, F. & Levinson, W. Women in academic medicine leadership: has anything changed in 25 years?. Acad.
Med. 91, 1053–1056 (2016).
41. Muric, G., Lerman, K. & Ferrara, E. COVID-19 amplifies gender disparities in research. arXiv:2006.06142 [physics] (2020).
42. Yedidia, M. J. & Bickel, J. Why aren’t there more women leaders in academic medicine? The views of clinical department chairs.
Acad. Med. 76, 453–465 (2001).
43. Jagsi, R. et al. The “gender gap” in authorship of academic medical literature—a 35-year perspective. N. Engl. J. Med. 355, 281–287
(2006).
44. Yang, Y., Chawla, N. V. & Uzzi, B. A network’s gender composition and communication pattern predict women’s leadership success.
PNAS 116, 2033–2038 (2019).
45. Distribution of Medical School Graduates by Gender. The Henry J. Kaiser Family Foundationhttps://www.kff.org/other/state-indic
ator/medical-school-graduates-by-gender/ (2018).
46. Furman, R. R. et al. Idelalisib and rituximab in relapsed chronic lymphocytic leukemia. N. Engl. J. Med. 370, 997–1007 (2014).
47. Helmer, M., Schottdorf, M., Neef, A. & Battaglia, D. Gender bias in scholarly peer review. eLife 6, e21718 (2017).
48. Pudaruth, S., Singh, U. & Ramnial, H. Name-centric gender inference using data analytics. In 2016 3rd International Conference
on Soft Computing Machine Intelligence (ISCMI) 124–127 (2016). doi:https://doi.org/10.1109/ISCMI.2016.44.
49. Wanner, R. A., Lewis, L. S. & Gregorio, D. I. Research productivity in academia: a comparative study of the sciences, social sciences
and humanities. Sociol. Educ. 54, 238–253 (1981).
50. Kaufman, R. R. & Chevan, J. The gender gap in peer-reviewed publications by physical therapy faculty members: a productivity
puzzle. Phys. Ther. 91, 122–131 (2011).
51. Ioannidis, J. P. A. et al. Comparison of evidence of treatment effects in randomized and nonrandomized studies. JAMA 286,
821–830 (2001).
52. Kola, I. & Landis, J. Can the pharmaceutical industry reduce attrition rates?. Nat. Rev. Drug Discov. 3, 711–716 (2004).
53. Ioannidis, J. P. A. Contradicted and initially stronger effects in highly cited clinical research. JAMA 294, 218–228 (2005).
54. Engqvist, L. & Frommen, J. G. Double-blind peer review and gender publication bias. Anim. Behav. 76, e1–e2 (2008).
55. Warner, J. L., Cowan, A. J., Hall, A. C. & Yang, P. C. HemOnc.org: A collaborative online knowledge platform for oncology profes-
sionals. J. Oncol. Pract. 11, e336–e350 (2015).
56. The Elderly Lung Cancer Vinorelbine Italian Study Group. Effects of vinorelbine on quality of life and survival of elderly patients
with advanced non-small-cell lung cancer. J. Natl. Cancer Inst. 91, 66–72 (1999).
57. Entrez Web Service API. http://www.ncbi.nlm.nih.gov/entrez/query/static/esoap_help.html.
58. https://www.heise.de/ct/ftp/07/17/182/. Accessed 30 Sept 2020.
59. Hunt, R. Trying an authorship index. Nature 352, 187–187 (1991).
60. Ioannidis, J. P. A. Measuring Co-Authorship and Networking-Adjusted Scientific Impact. PLoS ONE 3, e2778 (2008).
61. Patel, V. M. et al. How has healthcare research performance been assessed? A systematic review. J. R. Soc. Med. 104, 251–261 (2011).
62. Crispo, E. A new index to use in conjunction with the h-index to account for an author’s relative contribution to publications with
high impact. J. Assoc. Inf. Sci. Technol. 66, 2381–2383 (2015).
63. Stupp, R. et al. Radiotherapy plus concomitant and adjuvant temozolomide for glioblastoma. N. Engl. J. Med. 352, 987–996 (2005).
64. Janiaud, P., Serghiou, S. & Ioannidis, J. P. A. New clinical trial designs in the era of precision medicine: an overview of definitions,
strengths, weaknesses, and current use in oncology. Cancer Treat. Rev. 73, 20–30 (2019).
65. Newman, M. E. J. Modularity and community structure in networks. Proc. Natl. Acad. Sci. USA 103, 8577–8582 (2006).
66. Newman, M. E. J. Assortative mixing in networks. Phys. Rev. Lett. 89, 208701 (2002).
67. Freeman, L. C. A set of measures of centrality based on betweenness. Sociometry 40, 35–41 (1977).
68. Brin, S. & Page, L. The anatomy of a large-scale hypertextual web search engine. In Computer Networks and Isdn Systems 107–117
(1998).
69. Martin, S. B., Brown, W. M., Klavans, R. & Boyack, K. W. DrL: distributed recursive (graph) layout. J. Graph Algorithms Appl. 20,
172–188 (2008).
70. Cleveland, W. S. & Devlin, S. J. Locally weighted regression: an approach to regression analysis by local fitting. J. Am. Stat. Assoc.
83, 596–610 (1988).
71. Warner, J. Replication Data for: Seven Decades of Chemotherapy Clinical Trials: A Pan-Cancer Social Network Analysis. doi:https
://doi.org/10.7910/DVN/T6UEKZ.
Acknowledgements
This work was supported by the Vanderbilt Initiative for Interdisciplinary Research (J.B.); NIH grants P30
CA068485 (J.L.W.), T32 CA009515 (A.J.C.), T32 HG008341 (S.M.R.), U01 CA231840 (K.W. and J.L.W.), U24
CA194215 (E.A.S. and Q.C.); and NSF grant #1757644 (A.H.W.). We thank Ja Young Kwon, MD, PhD (Yonsei
University College of Medicine) and David Y. Suh, BA (Vanderbilt University School of Medicine) for their
assistance with Korean name gender mapping. We also thank Harry Hochheiser, PhD (University of Pittsburgh),
Allison H. Schachter, PhD (Vanderbilt University), Philip Walker, MLIS, MSHI (Vanderbilt University), and
Yaomin Xu, PhD (Vanderbilt University) for their review and/or suggestions, and all of the current and former
HemOnc.org editorial board members for their contributions to the site. No compensation has been received
by any of the persons listed here.
Author contributions
A.H.W., P.C.Y., and J.L.W. conceived and designed the study. A.H.W. and J.L.W. developed and implemented the
name disambiguation algorithms. X.L. developed and implemented the automated gender mapping algorithms.
A.M. developed and implemented the citation count algorithm. E.A.S., J.B., Q.C., and J.L.W. contributed to the
network analysis. X.L., A.H.W., S.A.E., S.N., R.S.G, K.W., E.J.C., S.M.R., N.K.V., B.F.T., and A.J.C. contributed
to manual gender mapping. S.N, R.S.G., E.J.C., S.M.R., N.K.V, B.F.T., A.J.C., M.W.S., J.P.G., H.D.F., A.S., R.A.C.,
S.R.M., S.B.D., T.J.O., E.P.A., E.I.B., C.S., I.A., M.J.R., N.S., S.S., and M.G. contributed clinical content expertise.
X.L., A.H.W., E.A.S., and J.L.W. wrote the main manuscript text, with input from all authors. J.L.W. and E.A.S.
prepared Figs. 1–3. All authors contributed intellectual content during the drafting and revisioning of the work
and approved the final version. J.L.W. had full access to all the data in the study and had final responsibility for the
integrity of the data, the accuracy of the data analysis, and the decision to submit for publication. X.L. (Vanderbilt
Scientific Reports | (2020) 10:17536 | https://doi.org/10.1038/s41598-020-73466-6 12
Vol:.(1234567890)You can also read