YouTube Traffic Monitoring and Analysis - by Georgios Dimopoulos - May 2012
←
→
Page content transcription
If your browser does not render page correctly, please read the page content below
TECHNICAL UNIVERSITY OF CATALONIA
                     BARCELONATECH

 YouTube Traffic Monitoring and
           Analysis

                               by
                  Georgios Dimopoulos

        A thesis submitted in fulfillment for the degree of
Master of Science in Information and Communication Technologies
                             (MINT)

                           May 2012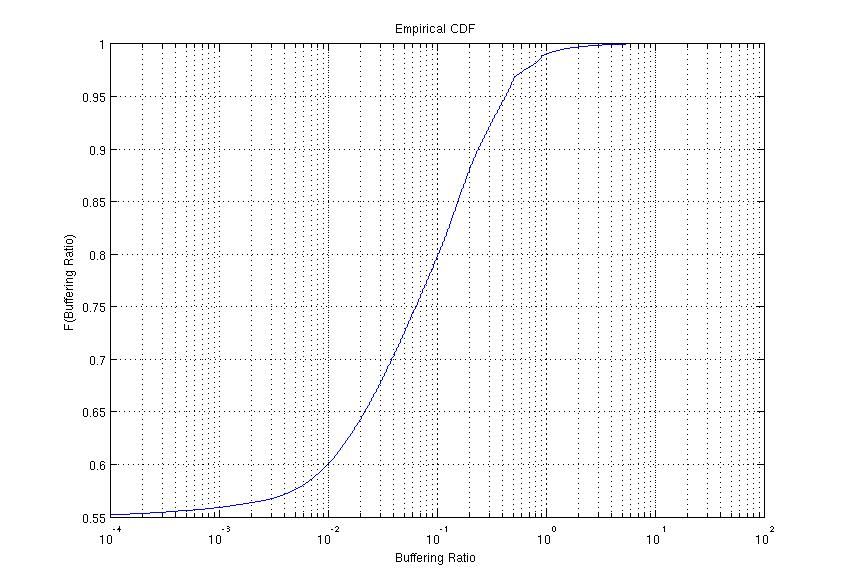
Declaration of Authorship
I, Georgios Dimopoulos, declare that this thesis titled, ‘YouTube Traffic Monitor-
ing and Analysis’ and the work presented in it are my own. I confirm that:

      This work was done wholly or mainly while in candidature for a research
       degree at this University.

      Where any part of this thesis has previously been submitted for a degree or
       any other qualification at this University or any other institution, this has
       been clearly stated.

      Where I have consulted the published work of others, this is always clearly
       attributed.

      Where I have quoted from the work of others, the source is always given.
       With the exception of such quotations, this thesis is entirely my own work.

      I have acknowledged all main sources of help.

      Where the thesis is based on work done by myself jointly with others, I have
       made clear exactly what was done by others and what I have contributed
       myself.

                                          i
TECHNICAL UNIVERSITY OF CATALONIA BARCELONATECH

                                Abstract

       Master of Science in Information and Communication Technologies

                             by Georgios Dimopoulos

       In this thesis, the YouTube service and the traffic generated from its us-
age was analyzed. The purpose of this study was to identify the information in
the monitored traffic that could be used as metrics or indicators of the progress
of individual video sessions. For this purpose, a tool was developed to perform
YouTube traffic measurements by means of passive network monitoring. The tool
was designed to obtain information regarding the delays introduced in YouTube
video sessions, as well as statistical parameters generated during the video play-
back. Subsequently, the tool was used to perform long duration measurements in
the UPC campus network. The analysis of the obtained data set created from the
measurements, gave fruit to interesting results concerning how these parameters
affect the progress of the video sessions. Moreover, the results of this study will
be used to further research the correlation of the studied parameters with users’
quality of experience.

Directors:
Pere Barlet-Ros, Josep Sanjuas-Cuxart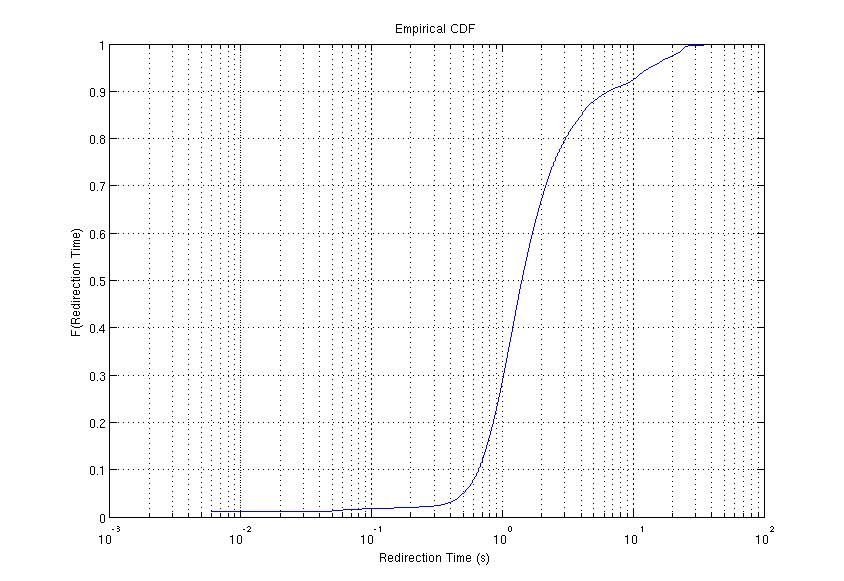
Acknowledgements
       I would like to extend my gratitude towards the people who have helped
me during the completion of this thesis. More specifically, my appreciation goes
out to my advisors Pere Barlet-Ros and Josep Sole Pareta and co-advisor Josep
Sanjuas-Cuxart. Their support and knowledgeable guidance were of paramount
importance for completing my thesis.

                                       iii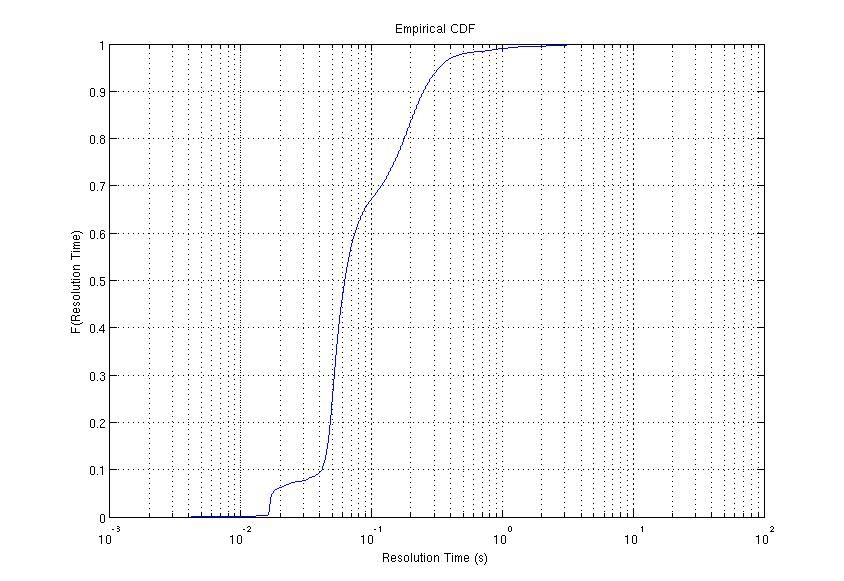
List of Figures
2.1 YouTube HTTP traffic. . . . . . . . . . . . . . . . . . . . . . . . . . 10
2.2 Download rates for different resolutions of same video. . . . . . . . 15
3.1 Delays with regards to HTTP and TCP events. . . . . . . . . . . . 20
3.2 YouTube HTTP traffic chronogram. . . . . . . . . . . . . . . . . . . 21
3.3 The three hash tables used in the module. . . . . . . . . . . . . . . 27
4.1 Interconnection of the monitoring station “pinot”. . . . . . . . . . . 31
4.2 Initiation Delay vs. Watch Time. . . . . . . . . . . . . . . . . . . . 33
4.3 Resolution Delay vs. Watch Time. . . . . . . . . . . . . . . . . . . . 33
4.4 Redirection Delay vs. Watch Time. . . . . . . . . . . . . . . . . . . 34
4.5 Buffering Ratio vs. Watch Time. . . . . . . . . . . . . . . . . . . . 34
4.6 Download Rate vs. Watch Time. . . . . . . . . . . . . . . . . . . . 34
4.7 Empirical CDF of the Initiation Delay. . . . . . . . . . . . . . . . . 36
4.8 Empirical CDF of the Redirection Delay. . . . . . . . . . . . . . . . 36
4.9 Empirical CDF of the Resolution Delay. . . . . . . . . . . . . . . . 36
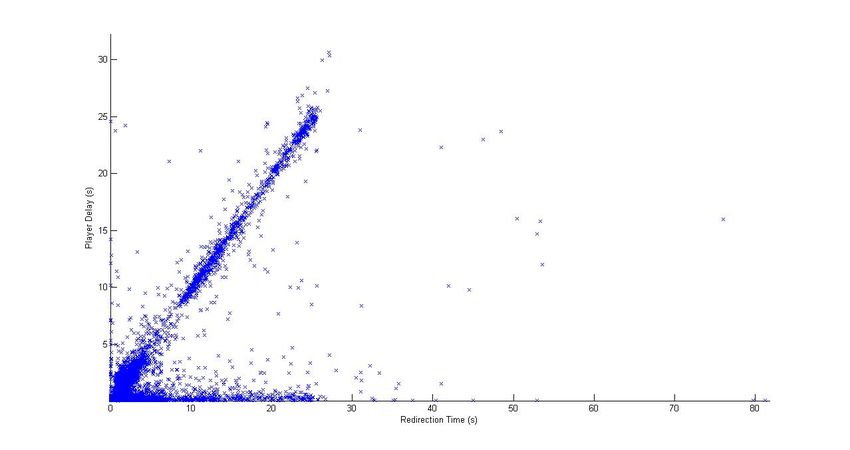
4.10 Empirical CDF of the Buffering Ratio. . . . . . . . . . . . . . . . . 36
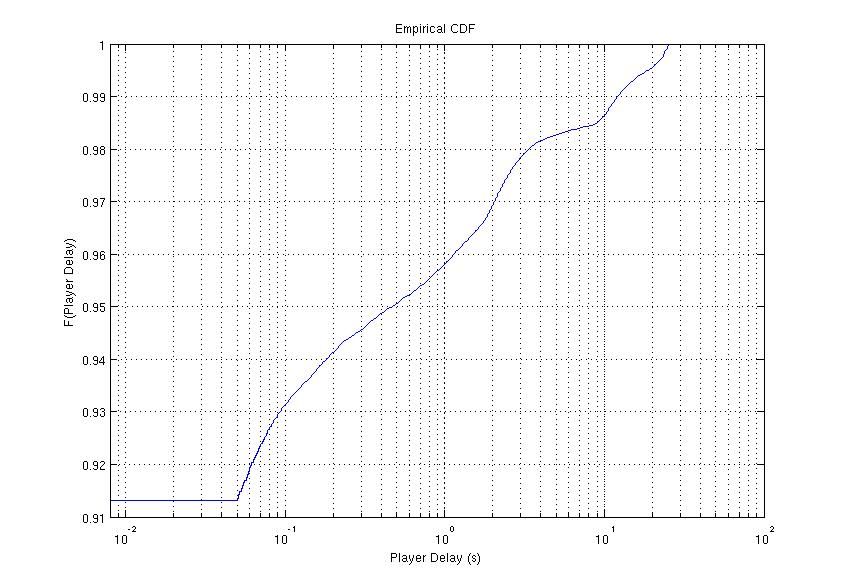
4.11 Empirical CDF of the Playback Delay. . . . . . . . . . . . . . . . . 36
4.12 Empirical CDF of Download Rate for fmt = 18. . . . . . . . . . . . 39
4.13 Empirical CDF of Download Rate for fmt = 22. . . . . . . . . . . . 39
4.14 Empirical CDF of Download Rate for fmt = 34. . . . . . . . . . . . 39
4.15 Empirical CDF of Download Rate for fmt = 35. . . . . . . . . . . . 39
4.16 Empirical CDF of Download Rate for fmt = 37. . . . . . . . . . . . 39
4.17 Initiation Delay vs. Playback Delay scatter plot. . . . . . . . . . . . 40
4.18 Resolution Delay vs. Playback Delay scatter plot. . . . . . . . . . . 40
4.19 Redirection Delay vs. Playback Delay scatter plot. . . . . . . . . . . 40
4.20 Buffering Ratio vs. Download Rate. . . . . . . . . . . . . . . . . . . 40
iv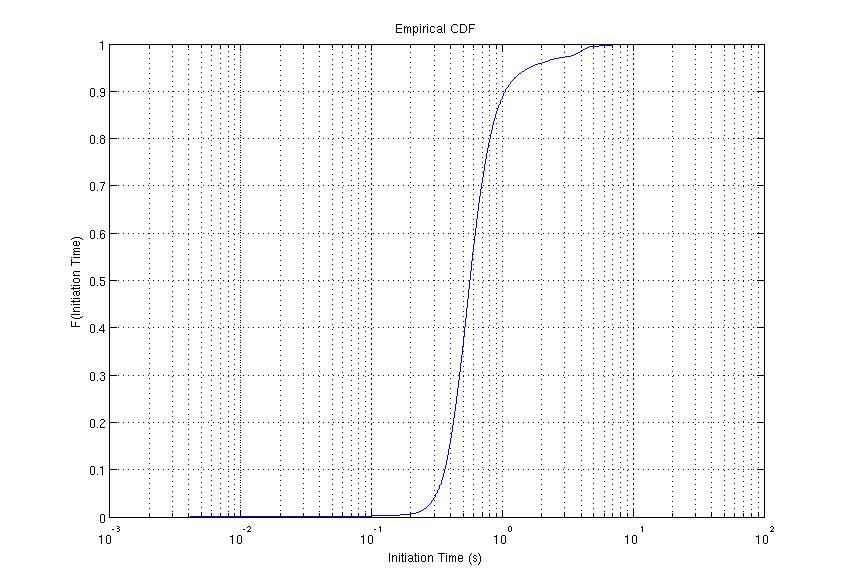
List of Tables

 3.1   Delay Parameters and corresponding definitions . . . . . . . . . . . 20
 3.2   Name of “s” parameters and corresponding description. . . . . . . . 23
 3.3   List of parameters to be captured . . . . . . . . . . . . . . . . . . . 26

 4.1   Example cell contents for 3 video sessions. . . . . . . . . . . . . . . 32
 4.2   Video format ID with corresponding video characteristics and bit-
       rates . . . . . . . . . . . . . . . . . . . . . . . . . . . . . . . . . . . 37

                                        v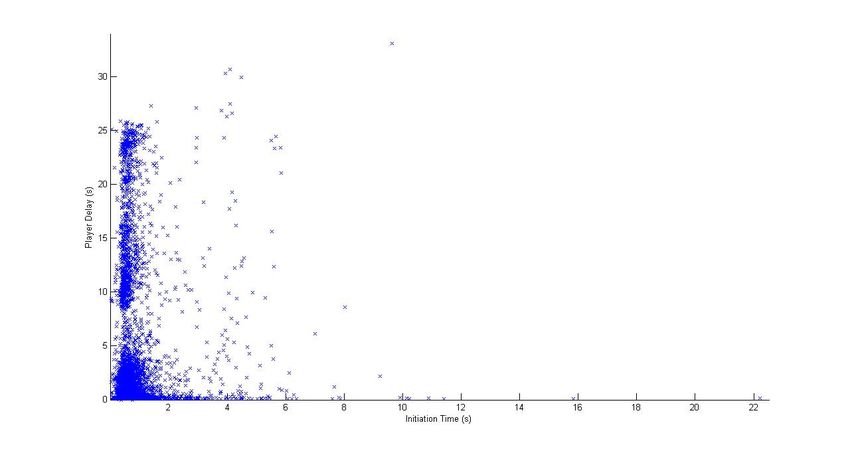
Abbreviations

      ISP    Internet Service Provider
      QoS    Quality of Service
      QoE    Quality of Experience
      RTT    Round Trip Time
      VoD    Video on Demand
      DNS    Domain Name Server
      MOS    Mean Opinion Score
      CDN    Content Distribution Network
      UPC    Universitat Polytecnica de Catalunya
      HTTP   Hyper Text Transfer Protocol
      TCP    Transmission Control Protocol
      RTMP   Real Time Messaging Protocol
      URL    Uniform Resource Locator
      CDF    Cumulative Distribution Function

                         vi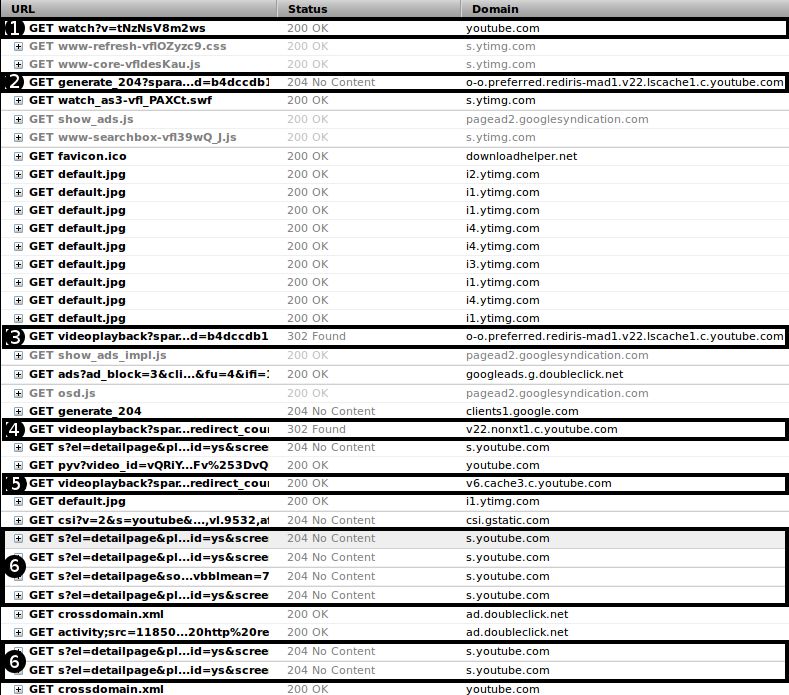
Contents

Declaration of Authorship                                                                                            i

Abstract                                                                                                            ii

Acknowledgements                                                                                                   iii

List of Figures                                                                                                    iv

List of Tables                                                                                                      v

Abbreviations                                                                                                      vi

1 Introduction                                                                                                      1
  1.1 Objectives . . . . . . . . . . . . . . . . . . . . . . . . . . . . . . . .                                    2
  1.2 Contribution . . . . . . . . . . . . . . . . . . . . . . . . . . . . . . .                                    3
  1.3 Outline . . . . . . . . . . . . . . . . . . . . . . . . . . . . . . . . . .                                   3

2 Background                                                                                                        5
  2.1 Review of Related Work . . . . . . . . .         .   .   .   .   .   .   .   .   .   .   .   .   .   .   .    5
  2.2 Video Types and Containers . . . . . . .         .   .   .   .   .   .   .   .   .   .   .   .   .   .   .    8
  2.3 TCP/HTTP traffic analysis for PC users           .   .   .   .   .   .   .   .   .   .   .   .   .   .   .    8
  2.4 Mobile user traffic . . . . . . . . . . . . .    .   .   .   .   .   .   .   .   .   .   .   .   .   .   .   12
  2.5 YouTube Buffering Strategies . . . . . .         .   .   .   .   .   .   .   .   .   .   .   .   .   .   .   13
  2.6 Network QoS and user QoE . . . . . . .           .   .   .   .   .   .   .   .   .   .   .   .   .   .   .   14

3 Methodology                                                                                                      17
  3.1 TCP/HTTP events important for QoE            .   .   .   .   .   .   .   .   .   .   .   .   .   .   .   .   17
  3.2 Parameters to be calculated . . . . . .      .   .   .   .   .   .   .   .   .   .   .   .   .   .   .   .   18
  3.3 YouTube Statistic Parameters . . . . .       .   .   .   .   .   .   .   .   .   .   .   .   .   .   .   .   20
  3.4 MoCoMe DPI tool . . . . . . . . . . .        .   .   .   .   .   .   .   .   .   .   .   .   .   .   .   .   26
  3.5 Measurement Approach . . . . . . . .         .   .   .   .   .   .   .   .   .   .   .   .   .   .   .   .   27

                                         vii
Contents                                                                                                 viii

4 Experimental Results                                                                                   30
  4.1 Environment and conditions of measurements         .   .   .   .   .   .   .   .   .   .   .   .   30
  4.2 Duration of the Experiments . . . . . . . . . .    .   .   .   .   .   .   .   .   .   .   .   .   30
  4.3 The Plotting Environment . . . . . . . . . . .     .   .   .   .   .   .   .   .   .   .   .   .   31
  4.4 Generated Plots and Diagrams . . . . . . . . .     .   .   .   .   .   .   .   .   .   .   .   .   33
  4.5 Correlation of QoE with the Parameters . . .       .   .   .   .   .   .   .   .   .   .   .   .   41

5 Conclusion and Future Work                                                     43
  5.1 Conclusion . . . . . . . . . . . . . . . . . . . . . . . . . . . . . . . . 43
  5.2 Future Work . . . . . . . . . . . . . . . . . . . . . . . . . . . . . . . 44

Bibliography                                                                                             46
Chapter 1

Introduction

YouTube is a massive-scale on-line video sharing service. It allows registered
users to upload videos and share them with other users of the service. All users
can access the available videos through a web browser, while registered users can
additionally rate and comment on videos or reply with their own videos.

The service was first launched in 2005 and is currently owned by Google Inc.. Ac-
cording to website popularity estimation service Alexa 1 , YouTube currently holds
the third place among the most visited websites in the world and it is the most
bandwidth intensive service of today’s Internet[3]. The service has enjoyed rapidly
increasing popularity during the last years, a fact that is frequently reflected in
various reports. One of these reports made in 2010 [2] revealed that 15% - 25%
of all the Inter-Autonomous System traffic was attributed to video, mainly origi-
nating from YouTube. The site at that time was counting 2 billion views per day
and 35 hours of videos where being uploaded every minute [3].

Nowadays, YouTube claims to serve 4 billion videos every day, which corresponds
to a 25% increase over a period of 8 months [9]. Additionally, according to Cisco
Visual Networking Index: Forecast and Methodology, 2010 - 2015 [10], in 2010
global Internet video traffic surpassed global peer-to-peer traffic for the first time
in the last 10 years. Moreover, the company predicts that by the end of 2012,
Internet video will be accounted for more than 50% of consumer Internet traffic
world-wide.
  1
      www.alexa.com

                                          1
Chapter 1. Introduction 2 In this context, a service with a high popularity and bandwidth requirements such as YouTube, can become a great challenge for modern network operators and an intriguing topic for researchers. More specifically, research concerning YouTube can aid scientists get a better grasp of the ways modern networks are utilized and how their performance is affected by large traffic sources. As a result, the research community will be able to obtain a better understanding how future networks could be improved to better accommodate the popularity and traffic demands of such services. Moreover, network operators and ISPs are to adapt to constantly increasing traffic demands by users and maintain an overall satisfactory level of Quality of Service (QoS). As a means to this end, it is critical for operators to be able to accurately evaluate how users and services utilize the network resources, in order to improve the performance of their infrastructure and provide long-term capacity planning. Likewise, ISPs are interested in identifying the applications their clients are using the most, in order to allocate the available bandwidth more efficiently and improve the quality of the services offered. Hence, it is understandable that measurements related to the YouTube service are becoming a necessity for either researchers or network operators, as a way of retrieving information about the users’ quality of experience when using YouTube and the network parameters that affect it. A first step to fulfill this objective, is to create the appropriate tools for performing YouTube associated measurements. 1.1 Objectives The main motivation behind this thesis, is to gain an insight into YouTube’s video delivery mechanism and furthermore investigate the different metrics that are associated with its performance. Particular parameters can be identified as more crucial than others to the performance of the video delivery and playback, through extensive measurements and analysis. Therefore, an important aspect of this study is to provide an application capable of extracting the important metrics by means of monitoring the related network traffic. The preferred approach to accomplish this goal, is by using the applica- tion as passive network measurement tool. As opposed to active measurement methods, the passive measurement approach does not rely neither on client-based
Chapter 1. Introduction                                                           3

applications nor on customized video players. In contrast, the application has the
capacity to collect the information required to assess the users’ experience, from
real networks without tampering with the monitored traffic.

Furthermore, the developed tool will be tested through multiple controlled exper-
iments in the lab. This way, the validity of the generated results will be tested
before the tool can be applied in a real-world scenario.

In a more general perspective, it is among the ambitions of this work, to expand
the existing knowledge on the YouTube service and aid the researcher community
and network operators in further demystifying the complex system behind it.

1.2     Contribution

The main contribution of the thesis, is the development of an application that,
with the help of passive measurement, will be capable of detecting and capturing
YouTube related parameters by passively monitoring network traffic. Furthermore,
the output of the application can be used to produce statistical results that can
be directly related to network QoS and indirectly to user QoE.

Moreover, another contribution made from this thesis, is the differentiation of
the measurement methodology as compared to other related work in the field.
This is accomplished by adopting a more objective approach to the YouTube user
experience analysis, outside the premises of the lab and under real situations.

1.3     Outline

In this introductory chapter, a brief overview of the YouTube service alongside with
statistical information was presented. Next, there were two subsections concerning
the objectives and the contribution respectively. Chapter 2 includes information
concerning the theoretical and practical background of the thesis as well as the
related work section. In the next chapter there is the detailed description of the
methodology applied, while the measurements procedure along with the diagrams
created from them are presented in Chapter 4. Moreover, in this chapter the
analysis of the results and their relation to user experience is also included. In
Chapter 1. Introduction                                                          4

Chapter 5 the conclusions of the thesis are presented. Finally, the fifth and last
chapter of the thesis provides the conclusions of the thesis as well as an overview
of future work.
Chapter 2

Background

2.1      Review of Related Work

YouTube’s significant and constantly increasing contribution to global Internet
traffic, has attracted the interest of the researchers community during the last
years. Numerous groups have studied the related traffic patterns and attempted
to model the internal mechanisms of the YouTube service. In the related litera-
ture, one can distinguish three main fields of research focused on YouTube: video
characterization, the infrastructure modeling and the user experience.

   • Video Characterization
      Regarding the first of the three fields, Video Characterization refers to the
      process of identifying and categorizing videos according to their technical
      attributes, content or popularity, for the purpose of conveying information
      about them. The significance of this procedure, lies in understanding the
      viewers’ preferences in terms of video quality and content, so as to evaluate
      current and future viewing patterns.
      In the related documents [11] and [12], traffic from university campuses was
      captured and processed in order to characterize usage patterns and local
      and global video popularity respectively. Other researchers have “crawled”
      YouTube to collect meta information [13] or gather video and social statistics
      [14].
      As a result, the researchers found that video popularity and user preferences
      have a great impact on local and remote networks. Therefore, different
                                         5
Chapter 2. Background 6
caching polices were proposed to handle the increasing traffic generated by
YouTube.
• Infrastructure
Given its traffic volumes and number of users, YouTube requires a mas-
sive infrastructure, which poses important engineering challenges. However,
details involved in the architecture, the operation and location of this infras-
tructure are not public information. Therefore, researchers have attempted
to understand the YouTube’s underlying system in order to gain an insight
on how massive content networks are created and operate and what can be
done in addition to improve their performance.
The YouTube infrastructure and server selection mechanisms have been put
under the microscope by researchers, as well as the physical location of
YouTube servers [15], [2]. Additionally, in [16] there is an analytical com-
parison among YouTube and other video sharing services via crawling the
websites and measuring delays. Moreover, in other literature [3], there is
comparison between PC and mobile users of YouTube and how their behav-
ior can be related to system performance degradation.
The conclusions derived in these papers agree on a load balancing mech-
anism, that redirects YouTube users to preferred video servers in order to
achieve a more uniform load distribution in the system. Additionally, in
cases where load balancing resulted in redirection to non-preferred servers,
there were factors such as DNS server variation, lack of video availability in
some servers and high server load due to popular video content.
• User Experience One of the important parameters that are involved in the
evaluation of video services, is the user’s experience quality. The Quality
of Experience is a subjective measure of the end-user’s perception of the
delivered service. It is related to another important metric called Quality of
Service, which attempts to objectively measure the quality of the provided
service. For network based services in specific, QoS is determined by metrics
such as delay, jitter and packet loss. On the other hand, the QoE is calculated
from measurements in the end-user’s device as opposed to QoS measurements
that are performed on the medium used for delivering the service. QoE
and QoS are both system output metrics that are taken into account when
designing a service delivery system.Chapter 2. Background 7
The QoE metric is increasing in popularity among researchers for applica-
tions such as YouTube. This is attributed mostly to the fact that QoS in the
case of video delivery systems, in not always sufficient to estimate the user’s
experience. Although there is a strong relation between the two parameters,
it is not always guaranteed that good QoS will result in satisfactory user
experience.
With respect to the research concerning the YouTube user experience, Mok et
al. [6] approached user QoE through investigating network QoS metrics. The
procedure followed here, included a customized Flash video player able to
detect buffering events which are in consequence related to user experience.
A similar approach was followed in [1], where a custom browser-based plug-in
was implemented to provide feedback about the videos’ buffering status and
predict possible disruptions in the playback due to buffer underflow events.
In addition, the same author [5], enhanced the aforementioned method for
Wireless Mesh Network environments, with the addition of an application
to perform resource management tasks.
In [17] the Mean Opinion Score (MOS) scale was successfully related to
the occurrence of increased packet loss that resulted in re-buffering events
during video playback. The MOS is like QoE a subjective metric of the
user’s experience, that uses a numerical scale from 0 to 5 to rate the user’s
annoyance and the perceived quality of experience.
Finally, in the work of Dobrian et al. [7], client-based tools in controlled lab
settings where used to extract statistics for short and long Video on Demand
(VoD) and for streaming video services. More specifically, user experience
for different types of media content was evaluated in terms of quality metrics
and content types.
The results of the aforementioned publications reveal that network QoS met-
rics such as Round Trip Time (RTT) and packet loss, may affect the buffering
process of a YouTube video and therefore affect the user’s experience. More
specifically, either by using the re-buffering frequency or the buffering ratio
as performance metrics, researchers were able to derive MOS marks and link
network QoS to user QoE.Chapter 2. Background 8
2.2 Video Types and Containers
This section involves the analysis of the different video formats available to YouTube
users. The information provided here, will give a more concrete view of the large
diversity of the available video and audio encodings and clarify the video delivery
mechanism that is explained in the following section.
HTTP video streaming and HTTP VoD are widely used in delivering stored mul-
timedia content through web browsers. Likewise, YouTube allows users to browse
videos through a web interface that facilitates a flash player plug-in or the, cur-
rently available for testing purposes, HTML5 video player 1 . The video containers
available by YouTube are Flash Video (FLV), MPEG-4 Part 14 (MP4) and WebM
for the HTML5 version of the website, with vertical resolutions ranging from 240
to 1080 pixels. Moreover, the FLV container is used in all but the two high def-
inition resolutions (720p and 1080p). However, for mobile users although FLV is
supported in many devices, the default container for standard quality playback is
3GP and for high quality is MP4.
In order for YouTube to provide compatibility with all browsers, devices, band-
width and quality requirements, it converts the uploaded videos using various
audio and video encoders and stores them in video servers using the containers
mentioned above. This approach results in a wide range of encodings for every
video, available for users to select from. Additionally, to make the identification
and the selection of different encoding schemes of a video from YouTube’s servers,
a numerical identifier named “itag”, or in some other cases “fmt”, is used. The
“itag” parameter is included in the HTTP requests that are related to video server
selection and video retrieval, that are discussed in the following section.
2.3 TCP/HTTP traffic analysis for PC users
In this section, there is a detailed study of the HTTP and TCP events that occur
during a YouTube video session. Most of the HTTP requests made to the YouTube
servers are GET requests responsible for fetching objects such as scripts, images
or the video itself to the browser. However, there are other requests responsible
1
http://www.youtube.com/html5Chapter 2. Background 9
for triggering more complex processes like DNS resolution, video server redirection
or generation of statistical parameters.
In order for a video session to be consistent, the latter group of requests should be
kept in a certain chronological order. However, since HTTP is stateless protocol
it is necessary to set HTTP cookies in the user’s browser in order to maintain the
state of the video session. In more detail, the information carried by the “cookies”,
is used to keep track of the progress of the video session, identify the user and
maintain the proper succession of events in the session.
For PC users, a normal YouTube video link has the following form:
“http://www.youtube.com/watch?v=1234567AbcD”. The eleven characters fol-
lowing the “v=” are an alphanumeric identifier, unique for every video. Also, it is
usually the case that after the identifier follow other parameters, separated by an
ampersand, that indicate if the selected video is featured or related to a previously
watched video.
A detailed view of the HTTP traffic generated between a client and YouTube
2
servers, can be seen in Figure 2.1. The figure was generated with the Firebug
plug-in installed in the Firefox browser. Firebug is a web browser extension and
a development tool used to inspect HTML code in web pages, debug JavaScript
applications and analyze network usage and performance.
In the figure, the HTTP requests mentioned in this section are important for the
analysis are marked with a bold outline. An HTTP request is a method defined
by the HTTP protocol specification for clients interacting with web servers. The
requests depicted here, are using the GET method which indicates that the client
requests to get a specific resource from the server. The GET method is followed
by the URL as can be seen in the first column of the figure. The URL indicates
the name of the requested resource and may also contain additional parameters to
pass dynamic data to the server.
In the second column of the figure, there are the response codes. The HTTP status
codes correspond to the way the server responded to the corresponding request.
In the case of a “200 OK” status code, the requested resource was located and suc-
cessfully delivered to the client. However, if there is a “204 No Content” response,
then the server has successfully fulfilled the request but it was not required to
2
http://getfirebug.com/Chapter 2. Background 10
return a resource. As can be seen in request (2), the client has successfully passed
dynamically data to the server in the form of parameters. Requests (3) and (4)
received a status code “302 Found” which means that the requested resource is
located in a different server and a redirection must occur to reach it. The last col-
umn in the figure under the title “Domain”, represents the address of the server
that the respective request is made to.
Figure 2.1: YouTube HTTP traffic.
When the user clicks on the video link, which can be seen in the “watch” request
(1) in Figure 2.1, a sequence of TCP and HTTP events are generated in order to
deliver the video content and other necessary objects. First of all, the browser
fetches the HTML web-page of the video and all the related items such as, CSS
and XML files, the ShockWave Flash (swf) objects, scripts and thumbnail images
of suggested videos. This is accomplished with an HTTP GET request from the
client side to the web server.Chapter 2. Background 11 Next, a script in the video page makes a “generate 204” request (Figure 2.1 (2)) to the server and the server replies with a status code “204 No Content”. This request is made in order to force a DNS resolution of the preferred video server that holds the desired video. The “generate 204” request also includes, among others, the parameter mentioned before called “itag” that indicates witch video quality the user selected. YouTube performs the DNS resolution using the method described, in order to increase the performance of its Content Distribution Network (CDN) and improve the response of its services. A CDN such as the one used by YouTube, is a large group of numerous data servers working together as one distributed system spanning a large geographical area. Each of these data servers is responsible for serving requests from nearby clients. In this way, it is possible to keep the load distributed among many servers and at the same time maintain fast response times. To accomplish this task, the DNS resolution must return the address to a server as close as possible to the geographical position of the client and with a relatively small load, in order to provide fast response times and optimal load balancing across servers. After the DNS resolution has completed and the preferred video server address has been returned, a script generates a “videoplayback” request (Figure 2.1 (3)) to that server in order to fetch the video data. If the requested video is located and the server is the most preferred one, then it produces a “200 OK” status code. How- ever, it is typical that the preferred server is not reached in the first attempt and there is one or more “videoplayback” requests generated returning “302 Found” code (Figure 2.1 (4)). The maximum number of total “videoplayback” requests, for a single video observed in the tests for this project was three. When the last “videoplayback” request with a “200 OK” response (Figure 2.1 (5)) is made, the download of the video data begins. Depending on if the browser is making use of HTTP persistent connections, it is possible to use the same TCP connection opened by the “generate 204” request to transfer video data. Otherwise, the TCP connection opened by the last “videoplayback” request is used. In addition, when the video playback has started there are automatically gener- ated HTTP GET requests towards Google’s servers used for collecting statistical information. These requests are generated every few seconds, provided that the
Chapter 2. Background                                                            12

playback has not been paused by the user or due to buffer depletion. Each of the
requests is marked by “GET /s?” (Figure 2.1 (6)) followed by a long string of pa-
rameters and their values, separated by ampersands and therefore for convenience
hereinafter they will be referred to as “s” requests.

2.4      Mobile user traffic

At this point, it is important to mention that extensive experiments were made,
to capture the traffic generated when watching a YouTube video from a mobile
device. The experiments were distinguished by either the type of the connection
and by the browsing application. In this way, there were experiments that involved
watching a video through a web browser over either cellular or Wi-Fi connection
and experiments that involved watching videos using the YouTube application
again either over cellular or Wi-Fi connection.

The first observation made by comparing the results of the experiments is that,
there was no differentiation in the traffic generated using Wi-Fi connection from
the one generated from a cellular connection usage. However, it was interesting
to observe that in both cases, the “generate 204” request were not present. More
careful analysis of the traffic revealed that the DNS resolution for mobile users,
was performed with the first “videoplayback” request. Furthermore, for the exper-
iments where the video was accessed from the YouTube application instead of the
browser, the “watch” requests were not present in addition to the “generate 204”
requests.

These findings helped to understand that the traffic generated from mobile devices
can be ambiguous, depending on the user’s preferred method of watching YouTube
content. Moreover, the absence of the HTTP requests mentioned above, introduces
difficulties when distinguishing unique video sessions. The reason for this is that
some important parameters that will be reviewed in the following chapter are no
longer available in the mobile user traffic.

As a result, the traffic from mobile device users will be not be taken into account
during the measurements in the following chapters. This decision was made on
the basis that in order to measure traffic from these devices, an entirely different
design approach for the tool is necessary and additionally a new measurement
methodology must be applied.
Chapter 2. Background                                                               13

2.5        YouTube Buffering Strategies

In contrast to other video-streaming services, the video delivery mechanism that
YouTube is using, can be characterized as progressive download, and as pseudo-
streaming [11]. Progressive download, as opposed to the RTMP protocol used in
typical video-streaming, uses HTTP to transfer the video data to the user’s local
storage. Additionally, YouTube allows the video playback to initiate as soon as a
small part of the video has been downloaded and certain buffering requirements
have been met. The data download and the buffering process continues in the
background as the playback progresses. This approach results in a user experience
similar to video-streaming and therefore called pseudo-streaming.

Moreover, YouTube allows users to seek to parts of the video that have not yet
been buffered. More specifically, when a non-buffered part of the video is selected
for playback, there is a TCP range request to the video server generated. This
request is similar to the “videoplayback” request made in the beginning of the
video session, but it additionally contains the range of bytes of the video file that
correspond to the part of the video the user seek to.

In addition, Adobe Systems Inc 3 , the owner company of the Flash technology,
has introduced new buffering strategies available with their products Flash Player
version 9 and Flash Media Server version 3. These two products have now three
options available for buffering media content: the Standard Video Buffering, the
Dual-Threshold Buffering and Buffering of H.264 Video [20].

In more detail, Standard Buffering assures that the media server sends the data
to the client as fast as possible in order to fill a predefined buffer. Once the
buffer is full, the playback of the video begins, while the client continues to receive
video data but at a minimum rate enough to keep the buffer full. If there is
a bandwidth drop and the data rate is not enough to keep the buffer full then
the buffer eventually becomes empty, the playback is stopped and a re-buffering
process starts.

In order to compensate bandwidth fluctuations and maintain a smooth playback,
the Dual-Threshold strategy is employed. In this case, the server uses an initial
high buffer threshold that will be filled as soon as possible and will ensure enough
data in the client side to reliably initiate the playback. After the first buffering
  3
      http://www.adobe.com/
Chapter 2. Background 14 threshold is reached and the buffer is filled successfully, a second lower threshold is employed for the rest of the buffering process. The lower threshold allows the buffer to fill faster and the data rate needed to keep it full is smaller. This buffering method is preferred for Media Servers that deliver FLV videos. In contrast, due to the encoding mechanism of the H.264 standard, the H.264 encoded videos require a different buffering strategy in order to provide optimal performance and smooth playback. The Media Servers that stream H.264 videos that in the case of YouTube use the MP4 format, have deeper buffer require- ments. For that reason, unrestricted buffering is considered a better approach and therefore buffering thresholds are not used. YouTube is using the updated versions of the Flash Player and the Flash Media Server on their video servers to stream videos. Hence, after measuring the down- load rates for different encodings of the same video, it was possible to verify that YouTube is using the Dual-Threshold buffering strategy for serving FLV videos and the H.264 buffering mechanism for MP4 videos. These two mechanisms have been visualized in Figure 2.2, where the download- rates for the same video in five different resolutions can be seen. In the lower three graphs of Figure 2.2, we can see the dual-threshold policy for FLV videos with vertical resolutions of 240p, 360p and 480p. Here, in all three examples, there is an initial high burst of data to fill the buffer with a higher threshold before playback. When the playback begins, a lower threshold is used and as a result the buffer fills faster and the required data rate to maintain it full is lower, as can be seen in the rest of the buffering procedure. On the other hand, the top two graphs of Figure 2.2 represent the download rates for 720p and 1080p videos using the H.264 encoding. In those cases, there are high data rates throughout the entire buffering process. This is attributed to the unrestricted buffering policy applied by YouTube to H.264 videos. 2.6 Network QoS and user QoE As opposed to other on-line media delivery services that use UDP to stream mul- timedia content, YouTube uses the TCP protocol. The advantage of using TCP
Chapter 2. Background                                                             15

        Figure 2.2: Download rates for different resolutions of same video.

as opposed to UDP, is that TCP is a reliable protocol that uses error correc-
tion and congestion avoidance mechanisms. Therefore, video delivery over TCP
is less prone to suffer from network impairments such as packet loss or high de-
lay. Furthermore, TCP allows the buffering of data on the client side and thus
providing even greater protection from delay and increased flexibility as it makes
the pseudo-streaming functionality possible. Therefore, it is a common pitfall to
assume that poor network QoS is not related to video user’s experience because
TCP compensates for it.

However, impairments in the network as the ones mentioned above, can be possible
culprits for stalling and interruptions during HTTP video playback according to
related documentation. More specifically, in [6] and [1], network QoS parameters
where successfully linked to user QoE by analyzing the frequency of buffering
events. Additionally, as mentioned in the Related Work section of this chapter, in
[17] Mean Opinion Score (MOS) for video-streaming over 3G networks was derived
from parameters like encoding, bit-rate, packet loss rate and buffering events.
Chapter 2. Background 16 This relatively new approach in QoE estimation for streaming media over TCP adds valuable knowledge to the existing QoE models that assume UDP as transport protocol. Nevertheless, this particular part of the research has not yet matured. Thus, there is still margin for further analysis of the parameters involved in the YouTube video streaming process and identify the ones important for evaluating the performance of the service and the experience of the user.
Chapter 3

Methodology

3.1        TCP/HTTP events important for QoE

As mentioned in the previous chapter, YouTube’s buffering mechanism allows
a high initial burst of data, to ensure that the a sufficient amount of data are
downloaded and that the playback on the client side begins as fast as possible.
This approach indicates the importance of providing the users with a service with
quick response. Nevertheless, due to the complexity and the size of the CDN, there
are frequently many redirections before the client is connected to the preferred
video server.

These redirections take their toll on the total time required before the first video
bytes are downloaded and the playback can initiate. This total time after the video
link has been clicked and before the actual playback has begun, is perceived by
the user as one undivided delay. However, what is transparent to the user are the
processes of the video server DNS look-up, resolution and redirections that occur
in the background. Each of these processes is responsible for adding a partial delay
to the total and all play an important role in the perceived QoE.

Finally, during the playback of a video the flash player automatically gener-
ates requests that contain statistical information and are directed to the domain
“s.youtube.com”. This domain is linked to several different IP addresses and ac-
cording to 1 , it cnames to a higher level domain called “video-stats.l.google.com”.
Apparently, Google uses these servers to store statistical information related to
  1
      www.robtex.com

                                        17
Chapter 3. Methodology 18 the YouTube service and the its users. The name “video-stats.l.google.com” of the servers is alone enough to imply that information generated is collected for statistical purposes. However, this implication can be also verified from the knowl- edge that YouTube is offering statistical results to users about the videos they have uploaded. These results can be accessed by viewers by clicking a related button in the video web-page. The information displayed in this statistical results, indicate that YouTube is analyzing metrics such as the number of viewers, their location and the time they watched the video. Moreover, registered users are offered with even more detailed statistics about the videos they have uploaded. In addition to the mentioned metrics, they are able to tack how the viewers were redirected to their videos and on what percentage watched the video on a mobile device or on a different website. Therefore, it is obvious that YouTube is collecting user and video related information for statistical purposes and there is a high probability that YouTube is collecting additional information in order to monitor the performance of its services. The “s” requests can be distinguished in the traffic by the “s.youtube.com” do- main, followed by a long string of multiple parameters and their values. These parameters, depending on their usage can be categorized to two main groups. The first set is related either to environment settings such as screen and video player dimensions, user’s region and selected language, referrer URL and others. The second and more interesting set of parameters, is related to either playback performance variables such as frame rate and dropped frames, player delay, or video download performance variables like downloaded video bytes and corre- sponding times. These statistical metrics will be discussed in greater detail in the following section of this chapter, where their meaning and significance will be reviewed separately. 3.2 Parameters to be calculated According with the analysis made in the section “TCP/HTTP traffic analysis for PC users” of the previous chapter, there can be distinguished five main HTTP or TCP events that can be related to the total delay before playback initiation. The first event is the click of the video link, which is used as a reference of the
Chapter 3. Methodology                                                            19

beginning of the video session. When the video link is opened a “watch” request
is made to download the HTML web page of the selected video. The parameter
“Watch Time” corresponds to the time this request was made. The next event
is the “generate 204” that indicated the DNS resolution for the video server. The
elapsed time between these two events can be defined as the “Resolution Delay”.

Furthermore, the next important event is the “videoplayback” request that is
responsible for fetching the desired video from the corresponding server, or for
redirecting to a new video server if the currently selected one cannot deliver the
video. At this point, since there can be multiple redirections and therefore multiple
“videoplayback” requests, the one that is of significance is always the last one
generated, since it indicates that the redirections have finished and the video is
about to be delivered.

The beginning of the video delivery as well as the beginning of the buffering process
is marked by an important TCP event; the delivery of the first video packet. By
measuring the time the first video packet was delivered, there are three delays
that can be calculated. The first one is the “Redirection Delay” and is defined as
the time between the “generate 204” request and the first video packet time. The
next one is the “Initiation Delay” and it is used to measure the time between
the last “videoplayback” request and the first video packet. The last delay that
requires the first video packet time to be calculated is the “Buffering Delay”.
In order to calculate this delay it is necessary to also measure the time that the
video buffering was completed and the TCP connection was closed.

Additionally, it is necessary to take into account the total time required to down-
load the entire video to the user’s browser cache. This time is named “Buffering
Time” and it corresponds to the time that the first video packet is received until
the time the last packet is downloaded and the corresponding TCP connection
is closed. The “Buffering Time” can be calculated only if the entire video is
downloaded from the same TCP connection that it started. In other words, this
parameter cannot be calculated if the user closes the web page, skips forward in
a part of the video’s time-line that has not yet been downloaded or if another
encoding of the video is selected. In all the above scenarios, the TCP connection
is interrupted and the delay is not possible to be calculated.

As soon as the “Buffering Time” is calculated, it can be compared to the video
duration so that a new parameter called “Buffering Ratio” can be derived by
Chapter 3. Methodology                                                                     20

             Figure 3.1: Delays with regards to HTTP and TCP events.

 PARAMETER                                        DEFINITION
 Watch Time          Time   that the ’watch’ request occurred
 Resolution Delay    Time   elapsed from ’watch’ request until ’generate 204’ request
 Redirection Delay   Time   elapsed from ’generate 204’ request until 1st video packet
 Initiation Delay    Time   elapsed from last ’videopacket’ request until 1st video packet
 Buffering Time      Time   elapsed from 1st video packet until closing of the TCP connection

             Table 3.1: Delay Parameters and corresponding definitions

dividing the video duration by the “Buffering Time”. This ratio can be used as
an indicator of buffering problems if its value exceeds 1. A value greater than 1,
implies that the buffering lasted longer than the video total play-time and therefore
there was either slow or interrupted buffering.

In figure 3.2, there is a chronogram of the HTTP requests towards the correspond-
ing servers and the response codes generated.

3.3      YouTube Statistic Parameters

As far as the aforementioned “s” requests are concerned, there is a large number
of parameters involved that are generated by the ActionScript of the flash player.
These requests are generated automatically in short intervals of a few seconds
Chapter 3. Methodology 21
Figure 3.2: YouTube HTTP traffic chronogram.
during the playback, providing in this way statistical “snapshots” of the playback
status and the user preferences.
The fact that these metrics are calculated and provided by the YouTube service
through HTTP requests, greatly simplifies the procedure of statistically analyzing
the playback process and the users’ preferences. However, given the fact that at
the time this thesis was written, no documentation or relevant information could
be found regarding the purpose and usage of the parameters included in the “s”
requests. Related documentation as well as on-line resources were thoroughly
skimmed for relevant information but to no avail.
Hence, the only alternative approach remaining, was to reverse-engineer the YouTube
flash player in order to gain access to its source code. So as to achieve this, the
ShockWave Flash object was downloaded from a YouTube video page and after-
wards the object was de-compiled to provide the source code. The de-compilation
was provided from an on-line de-compiling service 2 .
2
http://www.showmycode.com/Chapter 3. Methodology 22 Although the code that was produced from this process was obfuscated, thorough analysis helped unveil the properties and functionality of the involved statistical parameters. In greater detail, each of the parameters of interest was located in the source code. In sequence, there was an inspection of the variables related with each of the parameters and the classes they were contained. However, the obfuscation of the code from the developers, had resulted in meaningless names for variables and functions in the entirety of the source code. Therefore the diffi- culty of understanding the functionality of the code and the usage of the involved parameters was increased to a great extent. In order to overcome the obfuscation difficulties, each parameter was inspected with regards to the variables that were directly or indirectly related to it. The functionality of those variables was additionally analyzed to produce useful infor- mation. Moreover, the context in which each parameter was used in the code was also studied. In more detail, the classes and functions containing the parameter of interest were analyzed to gain an insight of their usage. The findings of the analysis showed that many of the generated parameters are related the progress and the quality of the playback. Such parameters are the frames per second, the dropped frames, the audio and video buffers count and length and the player delay. Moreover, there are parameters that indicate how many bytes of the video have been downloaded so far and in how much time, as well as the player’s delay due to stalling. Additionally, there are parameters displaying information about the timing of the segments in which the video was divided and delivered to the client’s browser. In more detail, all the parameters analyzed along with their corresponding de- scriptions can be found in the table below. “bc” represents the number of bytes loaded in the browser cache since the begin- ning of the buffering process. “bd” is a metric of the bytes of the video downloaded to the client since the last “s” request generation and “bt” is a timer showing the time required to download the “bd” bytes. The parameter “cfps” indicates the frame-rate of the video at the time of the gen- eration of the request. This parameter is an important indicator of the smoothness of the video playback when its value is lower than the frame-rate specified from the video encoding. However, after performing experiments, it was revealed that it is mainly affected by factors in the user’s machine and not by network impairments.
Chapter 3. Methodology                                                     23

       PARAMETER NAME DESCRIPTION
       bc             Bytes Loaded/Cached
       bd             Bytes Downloaded
       bt             Bytes Downloaded Timer
       cfps           Current Frames Per Second
       decoding       Decoding method (software/hardware)
       docid          Video ID
       et             Segment End Times
       fmt            Video Quality (equivalent to itag)
       fs             FullScreen Enabled
       lact           Time Since Last User Activity
       len            Video Duration
       mos            Is Muted
       nsidf          Dropped Frames
       nsiabblc       Audio Buffer Byte Length Count
       nsiabblmax     Audio Buffer Byte Length Max
       nsiabblmean    Audio Buffer Byte Length Mean
       nsiabblmin     Audio Buffer Byte Length Min
       nsivbblc       Video Buffer Byte Length Count
       nsivbblmax     Video Buffer Byte Length Max
       nsivbblmean    Video Buffer Byte Length Mean
       nsivbblmin     Video Buffer Byte Length Min
       pd             Playback Delay
       playerh        Video Player Height
       playerw        Video Player Width
       referrer       Video Referrer
       rendering      Rendering Method (software/hardware)
       rt             “s” Request Generation Time
       screenh        User Monitor Height
       screenw        User Monitor Width
       st             Segment Start Times
       vh             Video Height
       volume         Volume Level (%)
       vw             Video Width

        Table 3.2: Name of “s” parameters and corresponding description.
Chapter 3. Methodology 24 More specifically, low values of “cfps” can be observed when the video decoding requirements exceed the local software capabilities and therefore this parameters was not taken into account as an indicator of playback irregularities due to network impairments. Moreover, parameters “vh”, “vw”, “playerh” and “playerw” provide the dimen- sions in pixels of the video and the video player respectively. Likewise, the “screenh” and “screenw” show the dimensions of the user’s screen in pixels. Furthermore, the “rt” is a timer that displays the time that the “s” request was generated with respect to the playback time-line. In more detail, this timer shows how many seconds after the beginning of the playback the current “s” request was created. The parameters “st” and “et” are also timers measuring time relevant to the playback time-line. Specifically, they represent the relevant start time and end time of video segments sent to the flash player. These segments are parts of the video file that are sent in chronological sequence to the buffer and stored for later playback. However, they are measured in seconds relative to the time-line and not bytes. Additionally, there can be more than one transfered segments displayed in a single “s” request. This fact implies low congestion in the network and sufficient throughput to transfer multiple segments in order to accelerate the buffering process. Other parameters that can be found in the “s” requests, are the “docid” that is equivalent to the video unique ID, the “fmt” that is equivalent to the “itag” that identifies the video encoding and quality and the “len” that is showing the duration of the video in seconds. The “lact” is a timer counting the seconds that have elapsed since the last user activity. A user activity could be any interaction of the user with the player’s interface like decreasing the volume or pausing the video. Additionally, whether the video’s sound is muted or not is displayed by the “mos” parameter and can be either “1” or “0”. The group of parameters “nsiabblc”, “nsiabblmin”, “nsiabblmean”, “nsiabblmax”, “nsivbblc”, “nsivbblmin”, “nsivbblmean” and “nsivbblmax”, are metrics that are related to the size of the buffers used by the video and audio streams during playback. This group from this point on will be referred to as the “bbl” parameters for efficiency.
Chapter 3. Methodology                                                            25

An important step towards understanding the role of these parameters is to un-
derstand what the letters in their names represent. Therefore, “nsi” represents
NetStream info, that refers to an ActionScript class that is called to return QoS
statistics. The following two letters “a” and “v” indicate either audio or video
streams, while “bbl” stands for buffer byte length. Finally, “c”, “min”, “mean”
and “max” are for count, minimum, mean and maximum respectively.

Hence, it becomes clear that the “bbl” parameters are QoS metrics used by
YouTube to indicate the size of audio and video stream buffers during the play-
back. These two separate streams are created when the video player in the user’s
browser is decoding the video, so that it can be delivered to the video and audio
outputs of the user’s machine. The four parameters related to each stream inform
about the minimum, mean and maximum size of the buffers and the number of
bytes used. In addition to the “bbl” parameters, there is “nsidf” which is a counter
of the frames dropped between consecutive “s” requests during the decoding of
the video stream.

Finally, the last parameters that are included in the “s” requests are the “referrer”
and the “pd”. The “referrer” is equivalent to the HTTP referrer included in the
HTTP header fields. In the case of YouTube, it indicates the source of the link
of the video page selected and it can help understand if the user navigated to
the video page from a previous video page, from a video search in the YouTube
website or a different web page.

The “pd” is a parameter that provides information about the playback delay and it
only appears in the “s” requests if it has non-zero value. In other words, it returns
the time in seconds that the playback has been delayed due to stalling. The stalling
is attributed to buffer underflow where the video buffer has not sufficient data to
resume the playback. Therefore, it is clear the the “pd” parameter is one of the
most important metrics involved in estimating the state of the playback and if
buffering underflow events have occurred.

To summarize, in table 3.3 are listed the 28 parameters the will be captured from
the traffic generated from each video session.
Chapter 3. Methodology                                                         26

                                        1         Video ID
                                        2         client IP
                                        3        video type
                                        4        watch time
                                        5     initiation delay
                                        6    resolution delay
                                        7    redirection delay
                                        8     video duration
                                        9      buffering time
                                        10     buffering ratio
                                        11           cfps
                                        12           fmt
                                        13          nsidf
                                        14        nisabblc
                                        15      nisabblmax
                                        16      nisabblmean
                                        17       nisabblmin
                                        18        nisvbblc
                                        19      nisvbblmax
                                        20      nisvbblmean
                                        21       nisvbblmin
                                        22            bc
                                        23            bd
                                        24            bt
                                        25            st
                                        26            et
                                        27            rt
                                        28            pd

                          Table 3.3: List of parameters to be captured

3.4           MoCoMe DPI tool

The developed application that was used to make the measurements, is an exten-
sion also called a “module”, of the general purpose passive network measurement
system called MoCoMe. MoCoMe is an implementation of the CoMo architecture
3
    , that was developed in the Polytechnic University of Catalonia in the depart-
ment of Computer Architecture. The software is written in the C language and it
is used to perform traffic analysis by means of passive monitoring and measure-
ments. The “modules” are applications that are created to extend the functional-
ity of MoCoMe. They are used to perform more specialized tasks such as traffic
     3
         http://como.sourceforge.net/
Chapter 3. Methodology 27
characterization and Deep Packet Inspection.
3.5 Measurement Approach
The MoCoMe system is capable of capturing and processing all incoming packets
from the monitored traffic source. The module to be developed, will be able to
process the incoming packets with the purpose of extracting the YouTube perfor-
mance metrics that were discussed in the first and second section of this chapter.
In order to achieve this task, it is important to maintain a per-user session state
when processing the packets. Moreover, an additional auxiliary state is necessary
for maintaining the state of each session. These two states are essential, because
they help distinguish video sessions from each other and furthermore keep track
of the progress of individual sessions.
Moreover, efficiency is of great importance when processing great number of pack-
ets generated from high-speed links. As a result, it is crucial to decrease the needed
time to process each packet by using efficient data structures called hash tables 4 .
The three hash tables used can be observed in Figure 3.3.
Figure 3.3: The three hash tables used in the module.
Out of these three hash tables, Table B is used as explained above to maintain the
session state and store the values of the variables that correspond to each session.
The key used to access each session is defined by the combination of the video
unique identifier and the client’s IP address. A new entry in this table is created
4
http://en.wikipedia.org/wiki/Hash tableYou can also read