Modulating the human functional connectome using deep brain stimulation - bioRxiv
←
→
Page content transcription
If your browser does not render page correctly, please read the page content below
bioRxiv preprint first posted online Feb. 1, 2019; doi: http://dx.doi.org/10.1101/537712. The copyright holder for this preprint (which
       was not peer-reviewed) is the author/funder, who has granted bioRxiv a license to display the preprint in perpetuity.
                                       All rights reserved. No reuse allowed without permission.

        Modulating the human functional connectome using deep
        brain stimulation

        Andreas Horn1*, Gregor Wenzel1, Friederike Irmen1,2, Julius Hübl1, Ningfei Li1, Wolf-Julian
        Neumann1,3, Patricia Krause1, Georg Bohner3, Michael Scheel3, Andrea A. Kühn1,2

             1. Department of Neurology, Movement Disorders and Neuromodulation Section,
                  Charité – University Medicine Berlin
             2. Berlin School of Mind and Brain, Humboldt-Universität zu Berlin
             3. Department of Neuroradiology, Charité – University Medicine Berlin

        * Corresponding Author
        Material & Correspondence
        Andreas Horn, MD, PhD
        Charité – University Medicine Berlin
        Charitéplatz 1
        10117 Berlin
        andreas.horn@charite.de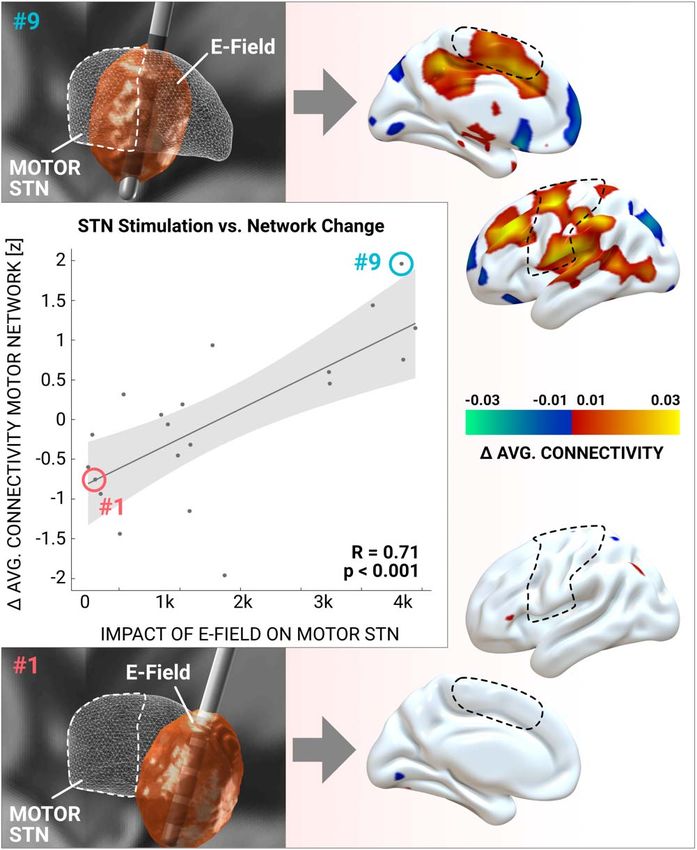
bioRxiv preprint first posted online Feb. 1, 2019; doi: http://dx.doi.org/10.1101/537712. The copyright holder for this preprint (which
       was not peer-reviewed) is the author/funder, who has granted bioRxiv a license to display the preprint in perpetuity.
                                       All rights reserved. No reuse allowed without permission.

        List of abbreviations
          B1+RMS                                                            The root-mean-square value of the MRI Effective
                                                                            Component of the radio frequency (RF) magnetic
                                                                            (B1) field. A measure to control the amount of RF
                                                                            power utilized to assure patient safety (besides
                                                                            B1+RMS, this is often measured by the specific
                                                                            absorption rate; SAR).

          BOLD                                                              Blood oxygen level dependent (signal commonly
                                                                            investigated in functional magnetic resonance
                                                                            imaging).

          DBS                                                               Deep Brain Stimulation

          DCM                                                               Dynamic Causal Modeling

          dlPFC                                                             Dorsolateral prefrontal cortex

          EC                                                                Eigenvector centrality

          GP/GPi/GPe                                                        Globus pallidus / internal part of globus pallidus /
                                                                            external part of globus pallidus

          NBM                                                               Nucleus Basalis of Meynert

          PD                                                                Parkinson‘s Disease

          PDRP                                                              Parkinson‘s Disease related pattern

          PET                                                               Positron Emission Tomography

          PPN                                                               Pedunculopontine nucleus

          UPDRS                                                             Unified Parkinson’s Disease Rating Scale

          (rs-)fMRI                                                         (resting-state)     functional      magnetic       resonance
                                                                            imaging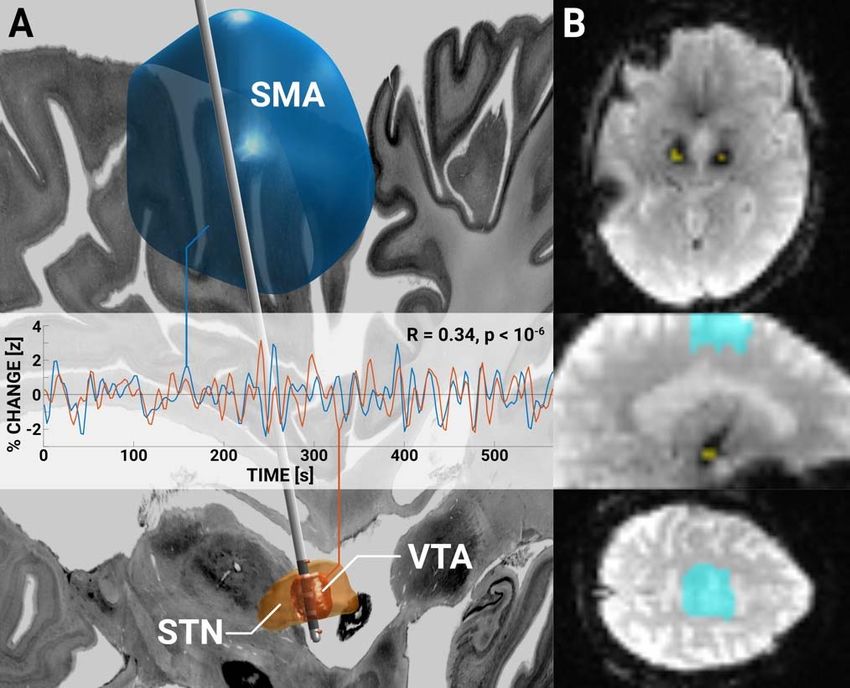
bioRxiv preprint first posted online Feb. 1, 2019; doi: http://dx.doi.org/10.1101/537712. The copyright holder for this preprint (which
       was not peer-reviewed) is the author/funder, who has granted bioRxiv a license to display the preprint in perpetuity.
                                       All rights reserved. No reuse allowed without permission.

          PH                                                                Posterior hypothalamic nucleus

          ROI                                                               Region of interest

          SMA                                                               Supplementary motor area

          STN                                                               Subthalamic nucleus, primary DBS target in PD

          VIM                                                               Ventral intermediate nucleus of the thalamus

          VP                                                                Ventral posterior nucleus of the thalamus

          VPM                                                               Ventral posteromedial nucleus of the thalamus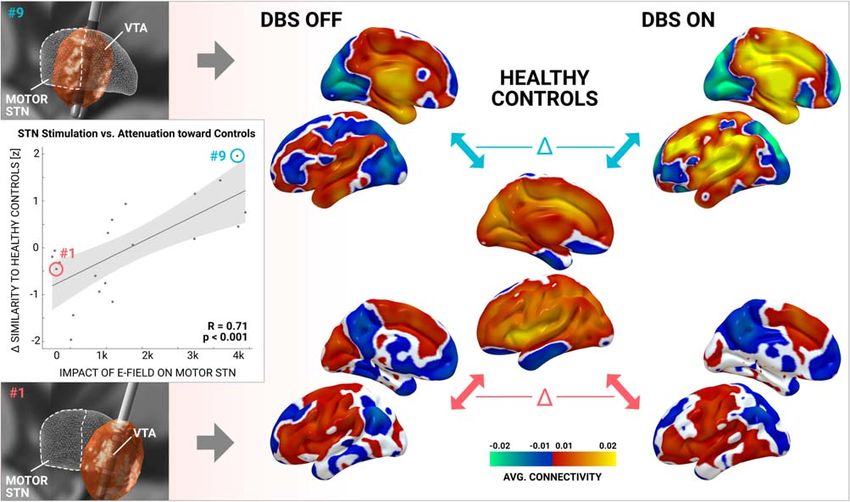
bioRxiv preprint first posted online Feb. 1, 2019; doi: http://dx.doi.org/10.1101/537712. The copyright holder for this preprint (which
       was not peer-reviewed) is the author/funder, who has granted bioRxiv a license to display the preprint in perpetuity.
                                       All rights reserved. No reuse allowed without permission.

        Abstract
        Neuroimaging has seen a paradigm shift from a formal description of local activity patterns
        toward studying distributed brain networks. The recently defined framework of the ‘human
        connectome’ allows to globally analyse parts of the brain and their interconnections. Deep
        brain stimulation (DBS) is an invasive therapy for patients with severe movement disorders
        aiming to retune abnormal brain network activity by local high frequency stimulation of the
        basal ganglia. Beyond clinical utility, DBS represents a powerful research platform to study
        functional connectomics and the modulation of distributed brain networks in the human
        brain. We acquired resting-state functional MRI in twenty Parkinson’s disease (PD)
        patients with subthalamic DBS switched ON and OFF. An age-matched control cohort of
        fifteen subjects was acquired from an open data repository. DBS lead placement in the
        subthalamic nucleus (STN) was localized using a state-of-the art pipeline that involved
        brain shift correction, multispectral image registration and use of a precise subcortical
        atlas. Based on a realistic 3D model of the electrode and surrounding anatomy, the
        amount of local impact of DBS was estimated using a finite element method approach. On
        a global level, average connectivity increases and decreases throughout the brain were
        estimated by contrasting ON and OFF DBS scans on a voxel-wise graph comprising eight
        thousand nodes. Local impact of DBS on the sensorimotor STN explained half the
        variance in global connectivity increases within the sensorimotor network (R = 0.711, p <
        0.001). Moreover, local impact of DBS on the motor STN could explain the degree of how
        much voxel-wise average brain connectivity normalized toward healthy controls (R =
        0.713, p < 0.001). Finally, a network based statistics analysis revealed that DBS
        attenuated specific couplings that are known to be pathological in PD. Namely, coupling
        between motor thalamus and sensorimotor cortex was increased and striatal coupling with
        cerebellum, external pallidum and STN was decreased by DBS.
        Our results show that rs-fMRI may be acquired in DBS ON and OFF conditions on clinical
        MRI hardware and that data is useful to gain additional insight into how DBS modulates
        the functional connectome of the human brain. We demonstrate that effective DBS
        increases overall connectivity in the motor network, normalizes the network profile toward
        healthy controls and specifically strengthens thalamo-cortical connectivity while reducing
        striatal control over basal ganglia and cerebellar structures.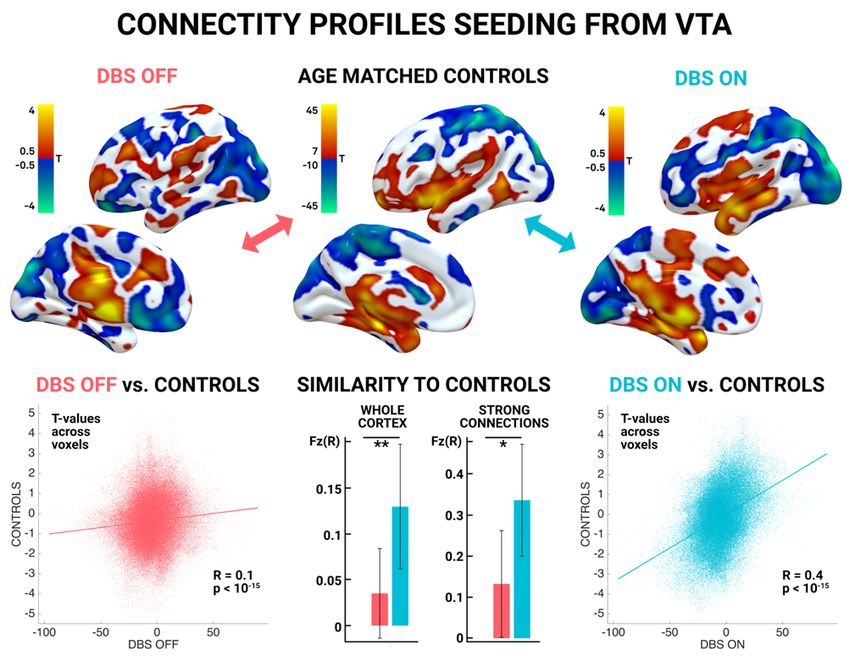
bioRxiv preprint first posted online Feb. 1, 2019; doi: http://dx.doi.org/10.1101/537712. The copyright holder for this preprint (which
       was not peer-reviewed) is the author/funder, who has granted bioRxiv a license to display the preprint in perpetuity.
                                       All rights reserved. No reuse allowed without permission.

        Introduction
        A potentially ideal but little explored method to stimulate, modulate and analyze the
        functional organization of the human connectome is deep brain stimulation (DBS). Given
        its precise targeting and the possibility to apply highly focal and functionally relevant
        effective stimuli, DBS may represent a suitable method to study focally induced
        modulations of distributed brain networks. This strong, lasting and focal impact on small
        brain regions has a direct impact on focal tissue without interference from non-neural
        structures (as opposed to noninvase transcranial neuromodulation techniques where
        volume conduction in soft-tissue and skull renders the stimulation focus less precise).
        Using DBS, network changes may be analyzed as a function of precisely targeted stimuli,
        rendering the concept of “connectomic DBS” a powerful one to study the human brain.
        Needless to say, the invasive nature of DBS makes empirical data rare and more
        elaborate to acquire – especially in humans.
        One of the few noninvasive options to study the functional organization of the brain is
        functional magnetic resonance imaging (fMRI). Intrinsic associations between subparts of
        the brain may be estimated using resting-state (rs-) fMRI and in this way, the “functional
        connectome” of the brain may be explored 5. When blood oxygenated level dependent
        (BOLD) signals of two brain regions are correlated over time, these have been called
                                                                    6,7
        functionally “connected” in the literature                     , although this measure includes highly indirect
                           8
        connections . Until recently, it was not straight-forward to acquire rs-fMRI data in patients
        with DBS implants, let alone with the stimulator switched on in the scanner. The reason
        was that no official certificate of device manufacturers allowed this practice and only
        limited pioneering work by a few specialized centers – the Jech and Foltynie groups
        should be mentioned among others – investigated changes of fMRI data under DBS in a
                                        9,10
        so far limited fashion                 ; table 1. In a first study involving 4 patients, Jech et al. showed
                                                                                                                10
        BOLD signal increases in ipsilateral subcortical structures under DBS                                        . In a case-report,
        Stefurak et al. then showed more distributed signal increases in (pre-)motor cortices,
                                                                                                                11
        ventrolateral thalamus, putamen and cerebellum under effective DBS                                           . Seminal work by
        Kahan et al. in 2014 described changes of direct, indirect and hyperdirect pathways of the
        basal ganglia – cortical loops under DBS using dynamic causal modeling 9. The same data
        was used to fit a computational mean-field model that was able to identify additional
        potential DBS targets beyond the classical STN target used to treat Parkinson‘s Disease
        (PD)12. In a formal literature analysis, we identified further studies that used fMRI under
        active DBS in humans and animal models so far (table 1). In summary, STN-DBS in PD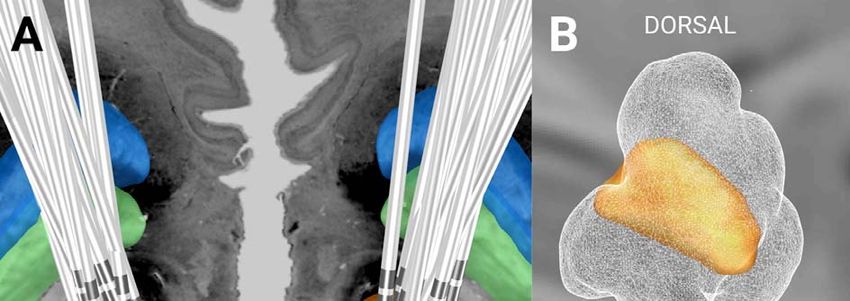
bioRxiv preprint first posted online Feb. 1, 2019; doi: http://dx.doi.org/10.1101/537712. The copyright holder for this preprint (which
       was not peer-reviewed) is the author/funder, who has granted bioRxiv a license to display the preprint in perpetuity.
                                       All rights reserved. No reuse allowed without permission.

                                                                                                                                   13
        may lead to increased overall functional connectivity in the premotor cortex                                                      and
                                                                                                             9
        strengthened cortico-striatal and thalamo-cortical pathways in fMRI .
                                                                                                                                 14-20
        Others investigated functional changes induced by DBS using PET/SPECT                                                           . Of
        special note for PD is the PET based “PD-related pattern” that was characterized, widely
                                                             14,16
        studied by the Eidelberg group                               . Specifically, metabolic changes in a network
        comprising putamen, globus pallidus, sensorimotor cortex and cerebellar vermis were
        shown to be prevalent in PD patients as well as modulated by both DBS and dopaminergic
        medication 16.
        In sum, even though there was no official allowance for active DBS in the fMRI before
        2015 (see methods), the concept has been explored in small case numbers, PET studies
        or animal models. One issue that has been neglected in prior studies is that slight changes
                                                                                                                                   21
        of millimeters in lead placement lead to large differences in clinical improvement                                                and
        similarly, slight differences in connectivity profiles of DBS electrodes may be used to
                                                                                                                    22
        predict clinical improvement across patients, cohorts and DBS centers                                          . Finally, small
                                                                                                                  23                       24
        variations in lead placement even explain changes of behavior in motor                                         and cognitive
        domains. Thus, we argue that it is crucial to incorporate DBS lead placement into an
        analysis of their impact on distributed brain networks. Instead, prior studies characterized
        fMRI changes in DBS ON vs. OFF contrasts and, by doing so, implicitly assumed that the
        DBS effect was equal in each patient. In reality, the impact of each DBS electrode on the
        target structure varies across patients and may be used as a regressor to better explain
        network changes. Specifically, we expected strong motor network changes in patients with
        optimally placed leads and weak or more diffuse/different changes in patients with
        suboptimal placement.
        In the present study, we investigated a cohort of 20 PD patients at rest under DBS ON and
        OFF conditions. We characterized changes in average connectivity (i.e. centrality) of brain
        regions and laid special focus on network changes as a function of the degree of motor
        STN-DBS modulation. Based on minor differences in DBS electrode placement, different
        amounts of motor STN volume were stimulated in each patient. As a result, we expected
        correspondingly differing changes in motor cortical activation that should be stronger or
        weaker as a function of electrode placement. Moreover, because differences in
                                                                                                     21,22
        therapeutic effects are equally dependent on lead placement                                          , we expected network
        properties to normalize toward healthy controls depending on lead placement. We
        expected that an optimally placed lead would result in strong modulations in the motor
        network, normalizing toward the network properties found in healthy controls. In contrast,
        poorly placed leads would not result in strong motor network changes.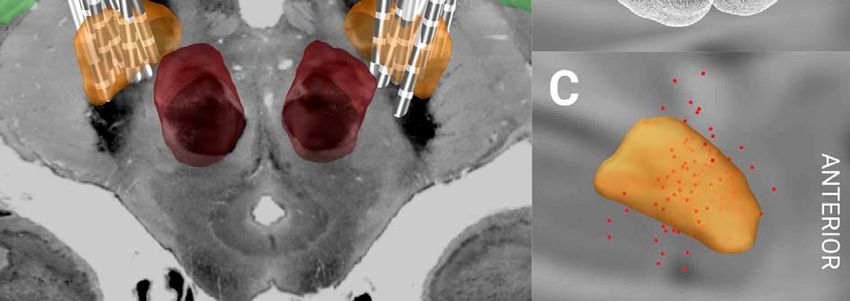
bioRxiv preprint first posted online Feb. 1, 2019; doi: http://dx.doi.org/10.1101/537712. The copyright holder for this preprint (which
was not peer-reviewed) is the author/funder, who has granted bioRxiv a license to display the preprint in perpetuity.
All rights reserved. No reuse allowed without permission.
Table 1: Studies on DBS-induced modulation of resting-state functional connectivity in PD
25 2 6 12 2 7 2 8 9 13 2 9 30 3 1 3 2 11 1 0 33 3 4 35 36 37 38 3 9 40 4 1
, , , , , , , , , , , , , , , , , , , , ,
Study Contrast DBS DBSon No. of PD Timepoint of Main findings
target during postoperative
fMRI scans scanning
Human
Gratwicke et DBSON – DBS OFF NBM bilateral 6 6 and 14 weeks No NBM-DBS-related changes in functional connectivity within
al. 2018 stimulation post lead the default mode network.
implantation
Mueller et al. Pre: MedON - MedOFF; STN unilateral 13 (same sample 1-3 days post lead STN-DBS induced higher interconnectedness (i.e., EC) of left
2018 Post: MedOFF DBSON – stimulation as Holiga 2015 implantation and right motor cortex and increased connectivity of these
MedOFF DBSOFF; and Mueller 2013) regions with thalamus and cerebellum in seed-based analysis.
Saenger et Post: MedOFF DBSON – STN bilateral 12 (same sample 37.9 ± 29.3 STN-DBS shifted whole-brain dynamics of functional
al. 2017 MedOFF DBSOFF; stimulation as Kahan 2014, 2 months post lead connectivity towards a regime resembling that of healthy
patients excluded) implantation controls. Local changes were most prominent in thalamus, GP,
and orbitofrontal cortex.
Holiga et al. Pre: MedOFF; STN unilateral 13 (same sample 0-3 days post lead Postoperative enhanced functional connectivity (i.e., EC) in
2015 Post: MedOFF DBSON – stimulation Mueller 2013) implantation brainstem in the DBSOFF condition suggests sensitivity of this
MedOFF DBSOFF; region to microlesion effects of DBS. With DBSON EC increased
in left premotor cortex (see Mueller et al., 2013).
Knight et al. DBSON - DBSOFF STN unilateral 10 Intraoperatively STN-DBS activated ipsilateral prim ary motor and premotor
2015 stimulation after lead cortex, SMA, PPN, cingulate gyrus and contralateral cerebellum.
implantation
Kahan et al. Post: MedOFF DBSON – STN bilateral 12 (same sample 38.4 ± 27.0 In DCM analysis, a model including direct, indirect, hyperdirect,
2014 MedOFF DBSOFF; stimulation as Kahan 2012, months post lead thalamo-cortical and cortico-striatal pathways best described
with 2 additional implantation modulatory effects of STN-DBS. Hyperdirect, direct and STN
patients) afferents from the striatum predicted clinical improvement with
DBS.
Mueller et al. Post: MedOFF DBSON – STN unilateral 13 0-3 days post lead STN-DBS enhanced connectivity (i.e., EC) in the premotor
2013 MedOFF DBSOFF; stimulation implantation cortex. The degree of connectedness in this region correlated
negatively with UPDRS motor score.
Jech et al. Pre: MedOFF; STN no 12 Within 3 days post Microlesion effects of STN-DBS lowered movement-related
2012 Post: MedOFF DBSOFF; stimulation lead implantation cortical and subcortical activation. During finger-tapping,
activation decreased in precentral gyrus, SMA, rolandic
operculum, insula, thalamus and GP/putamen following
implantation of DBS leads.
Kahan et al. Post: MedOFF DBSON – STN bilateral 10 38.5 ± 29.5 STN-DBS reshapes effective connectivity by reversing cortico-
2012 MedOFF DBSOFF; stimulation months post lead thalamic coupling during voluntary movements.
implantation
Phillips et al. DBSON - DBSOFF STN bilateral 5 1-2 days post lead STN-DBS evoked motor activation in ipsilateral basal ganglia,
2006 stimulation implantation motor cortex and contralateral cerebellum.
Hesselmann DBSON - DBSOFF STN unilateral 1 Intraoperatively STN-DBS lead to activation decrease in contralateral primary
et al. 2004 stimulation after lead sensorimotor cortex and ipsilateral cerebellum. Activation
implantation increased with STN-DBS in contralateral basal ganglia and
insula.
Stefurak et DBSON – DBS OFF STN unilateral 1 2-5 days post lead DBS of contacts inside STN relieved motor symptoms and
al. 2003 stimulation implantation induced BOLD signal changes in motor regions, i.e. increased
activity in premotor and motor cortices, cerebellum, thalamus
and putamen as well as decreased activity in SMA and
dorsom edial thalamic nuclei. DBS of contacts outside STN in
white matter tracts induced dysphoric mood and altered
activations of frontal regions.
Jech et al. Post: MedONDBSON – VIM, unilateral 4 Prior to stimulator STN-DBS induced increased activation of thalamus, GP,
2001 MedONDBSOFF ; STN stimulation implantation mesencephalon, dlPFC and lateral prem otor regions. VIM-DBS
enhanced activity in thalamus and caudate.
Macaque
Min et al. DBSON - DBSOFF STN unilateral 2 2-4 weeks post STN-DBS enhanced activation of sensorimotor cortex, SMA,
2014 stimulation lead implantation caudate, PPN, cingulate, insula and cerebellum.
Pig
Min et al. DBSON - DBSOFF STN, unilateral 11 (non-PD) Same day as lead STN-DBS and GPi-DBS both increase BOLD activity in
2012 GPi stimulation implantation ipsilateral sensorimotor regions as well as dlPFC, caudate,
cingulate cortex and insula. STN-DBS specifically altered activity
in somatosensory association cortex, prepyriform area,
hippocampal and parahippocampal areas, lateral geniculate and
PPN as well as cerebellum. GPi-DBS specifically altered activity
in periaqueductal gray and superior colliculus.
Lee et al. DBSON - DBSOFF STN unilateral 1 n.r. STN-DBS elicited activation of the ipsilateral head and body of
2011 stimulation caudate nucleus, however not its tail.
Rodent
Lai et al. DBSON - DBSOFF VPM unilateral 10 rats, 4 mice n.r. VPM-DBS induced robust and frequency-dependent BOLD
2015 stimulation responses in ipsilateral sensorimotor cortex.
Chao et al. DBSON - DBSOFF VP unilateral 5 (non-PD) >week post lead VP-DBS in rats evoked cortical frequency- and amplitude-
2014 stimulation implantation dependent BOLD responses in ipsilateral som atosensory cortex
that were reproducible over a week.
Shih et al. DBSON - DBSOFF VPM unilateral 12 (non-PD) n.r. VPM-DBS in rats increased thalamo-cortical connectivity in a
2014 stimulation highly frequency- and amplitude-dependent manner, peaking at
25Hz and 1mA.bioRxiv preprint first posted online Feb. 1, 2019; doi: http://dx.doi.org/10.1101/537712. The copyright holder for this preprint (which
was not peer-reviewed) is the author/funder, who has granted bioRxiv a license to display the preprint in perpetuity.
All rights reserved. No reuse allowed without permission.
Younce et al. DBSON - DBSOFF STN unilateral 1 (non-PD) n.r. STN-DBS produced BOLD responses in ipsilateral cortical
2014 stimulation regions centred around motor cortex.
Lai et al. DBSON - DBSOFF STN, unilateral 14 (non-PD) > 2 days post lead Both STN- and GPi-DBS in rats lead to increased BOLD
2014 GPi stimulation implantation activation of ipsilateral motor, somatosensory and cingulate
cortex. Motor cortex activation was frequency-dependent
peaking at 100 Hz.
Young et al. DBSON - DBSOFF PH unilateral 8 n.r. PH-DBS induced activation increase that was robust in
2011 stimulation somatosensory and motor, minor in limbic and sparse in
thalamic areas.bioRxiv preprint first posted online Feb. 1, 2019; doi: http://dx.doi.org/10.1101/537712. The copyright holder for this preprint (which
was not peer-reviewed) is the author/funder, who has granted bioRxiv a license to display the preprint in perpetuity.
All rights reserved. No reuse allowed without permission.
Results
Patients (N = 20) were 63.7 ± 6.6 (STD) years old at time of surgery and the sample
included 4 women. Healthy control subjects were 59.5 ± 11.9 years old and 4 of 15
subjects were female.
Patients were scanned 30 ± 21 months after surgery with a minimum of 4 months in one
subject. All other subjects had been implanted at least 11 months at the time of the scan.
Due to logistic reasons (see methods), patients were scanned in Med ON condition and
first scanned in DBS ON followed by the DBS OFF condition (with a brief interval of 5-15
minutes in which the impulse generator was turned off).
Before surgery, patients had a Levodopa response of 36.8 ± 11 % (percent improvement
in Med ON vs. OFF conditions; from 35.9 ± 7.6 to 18.9 ± 6.8 points on the UPDRS-III
scale; lacking scores of two patients). Levodopa-equivalent dose of medication was 724.7
± 441 mg (lacking data of one patient). Under effective DBS, motor symptoms improved by
43 ± 18 % (from 38.8 ± 10.9 points before in DBS OFF to 22.0 ± 9.8 in DBS ON; lacking
scores of two patients). Please note that stimulation parameters during rs-fMRI differed
since they had to be in bipolar setting and were not all taken at the same time of the 12
months postoperative evaluation. The aim was to best match unipolar long-term
stimulation settings with the bipolar settings used during rs-fMRI acquisition. Still, for
logistic reasons, a second UPDRS score could not be taken at the time of scanning and
thus a matching UPDRS-III improvement for the DBS applied in the scanner is not
available in this cohort.
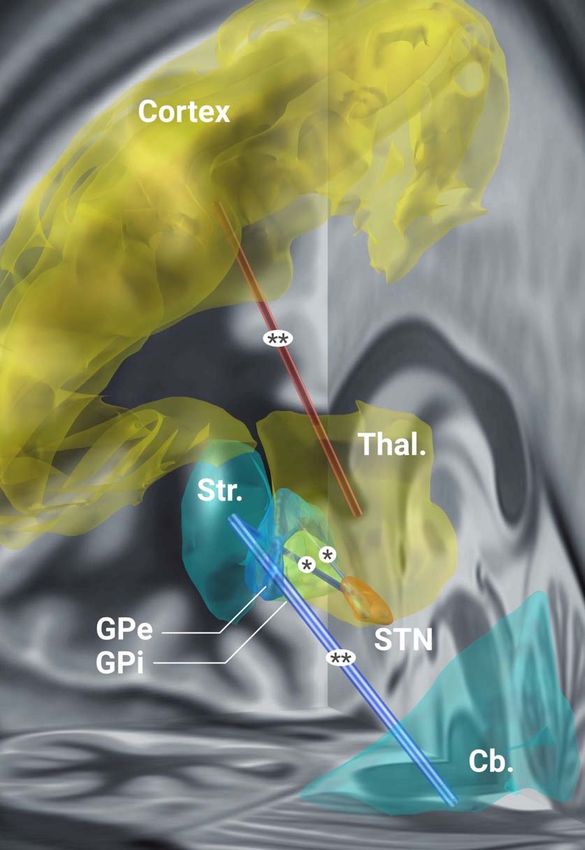
Electrodes were all placed in the subthalamic region (fig. 1) although five patients had an
overlap between their bilateral volume of tissue activated (VTA) and the sensorimotor
42
parts of the bilateral STN (as defined by the DISTAL atlas below 4 mm3). In comparison,
the average coverage of motor STN stimulation in the rest of the sample was 36.4 ± 20.5
mm3 which amounts to 50.6 % of the bilateral nucleus volume.
To investigate whether subject motion in the scanner differed between DBS ON and OFF
conditions, motion parameters were estimated using SPM12 and framewise displacements
43
calculated following the approach of Power et al. (fig. 2 C). Average displacement
values for DBS ON and OFF conditions were not significantly different (0.26 ± 0.17 mm in
ON vs. 0.30 ± 0.17 mm in OFF, p = 0.32) and within a typical range of tolerable movement
44
.bioRxiv preprint first posted online Feb. 1, 2019; doi: http://dx.doi.org/10.1101/537712. The copyright holder for this preprint (which
was not peer-reviewed) is the author/funder, who has granted bioRxiv a license to display the preprint in perpetuity.
All rights reserved. No reuse allowed without permission.
To investigate whether BOLD time series sampled directly from the region of the electrode
/ volume of tissue activated (VTA) could be used despite the prevalence of metal artifacts,
we first calculated functional connectivity between bilateral VTAs and second between
VTAs and supplementary motor area (SMA) in DBS OFF conditions. The SMA was
chosen given its functional role and positive connectivity to the STN 22,45. In some patients,
correlation values of R > 0.3 were prevalent between bilateral VTAs, suggesting the STN
time series around the electrode are useable but variability in lead placement introduced
strong variance across patients (average absolute R values were 0.16 ± 0.11). Crucially,
the connectivity between the two electrodes could be explained by lead placement: The
more similar their impact on the motor STN, the higher their connectivity (R = 0.45 at p <
0.05).
Functional connectivity values between bilateral VTAs and SMA were similar, R-values
ranged up to 0.24 (average absolute R values were 0.14 ± 0.06). Here, lead placement did
not significantly correlate with connectivity between VTA and SMA (R = 0.31, p = 0.09).
Figure 2 illustrates BOLD time series sampled from the VTA and the supplementary motor
region (SMA) of a representative patient and gives a visual impression about the BOLD
signal sampled directly at and around the electrode artifact.
Despite the apparent usefulness of the BOLD signal directly at the stimulation sites, the
first and main analysis of this manuscript did not use this signal but rather investigated
whole-brain connectivity changes within the sensorimotor network (cortex, cerebellum and
basal ganglia). Average connectivity changes between DBS ON and OFF conditions were
estimated on a graph of 8k nodes that covered the whole brain but were then sampled
within the motor network (see table 2 for a proper definition of the network). In other words,
overall connectivity changes between each pair of voxels in the whole brain was defined
and changes in the motor network were then correlated with impact of DBS on the motor
STN. Across subjects, changes in average connectivity of the motor network were
correlated with the impact of the DBS electrode on the motor STN (R = 0.71, p < 0.001).
Figure 3 shows these results across the group and highlights two example subjects. In the
first one (pt. #9, fig. 3 top), overlap between the VTA and motor STN is large – i.e. it
represents a case with (near) optimally placed DBS electrodes. As expected, in this patient
under DBS, average connectivity increases strongly – and predominantly in the motor
network. The contrary is the case in a patient where the leads are largely outside the STN
where as expected little to no modulation of the motor network takes place (pt. #1, fig. 3bioRxiv preprint first posted online Feb. 1, 2019; doi: http://dx.doi.org/10.1101/537712. The copyright holder for this preprint (which
was not peer-reviewed) is the author/funder, who has granted bioRxiv a license to display the preprint in perpetuity.
All rights reserved. No reuse allowed without permission.
bottom). Across the group, this relationship between DBS placement and the connectivity
increase in the motor network was strong. In fact, 50% of the observed variance in motor
network changes (which are exclusively informed by rs-fMRI) may be explained purely by
lead placement (which is exclusively informed by structural MRI). After this analysis, we
investigated relationships between motor STN stimulation and connectivity changes of
specific regions within the sensorimotor network. In post-hoc uncorrected head-to-head
comparisons, this relationship was significant for the cortical (R = 0.50, p = 0.024) and
cerebellar (R = 0.51, p = 0.022) regions of interest (ROI) but not for remaining ROI
(striatum, thalamus, GPi, GPe, substantia nigra) with a positive but non-significant R-value
for all regions.
Subsequently, connectivity profiles seeding from bilateral VTAs in DBS ON and OFF
conditions were compared to the same maps informed by a normative connectome of age-
matched healthy controls 22,46. DBS ON and OFF maps (top right and left maps in figure 4)
were each compared to healthy controls (top mid map) by means of voxel-wise spatial
correlation (as a similarity metric). Here, seed connectivity maps in DBS ON condition
were significantly more similar to the ones obtained when using rs-fMRI data of healthy
controls both on a group level (bottom right and left scatter plots in figure 4) and single
subject level (bottom mid bar plots). This analysis shows that the overall connectivity of the
DBS electrode “normalizes” toward healthy controls under DBS. In a subsequent analysis,
we compared whole-brain average connectivity estimates (voxel-wise strength centrality)
changes based on DBS. These estimates became more similar to the ones obtained in
healthy controls as a function of motor-STN stimulation. The same two patients (#9 and #1
shown in top and bottom rows of figure 5) are shown as examples. Here, the average
connectivity metrics across the whole brain – and not just the motor network – became
more similar to healthy controls as a clear function of motor STN stimulation. Similarly to
the analysis in fig. 3, ~50% of variance in how much the overall average connectivity
“normalizes” toward healthy controls could be explained just based on DBS electrode
placement. In other words, the more optimal a DBS electrode was placed (as measured by
overlap with the motor STN), the more normal the overall functional connectivity became
(as measured by similarity to healthy controls).
To further investigate exactly which connections would increase or decrease, we applied
the network based statistics approach on DBS ON vs. OFF graph between ROI defined in
table 2 (which include sensorimotor domains of STN, GPi, GPe, striatum, thalamus,
cerebellum, substantia nigra and cortex). Again, changes were investigated as a functionbioRxiv preprint first posted online Feb. 1, 2019; doi: http://dx.doi.org/10.1101/537712. The copyright holder for this preprint (which
was not peer-reviewed) is the author/funder, who has granted bioRxiv a license to display the preprint in perpetuity.
All rights reserved. No reuse allowed without permission.
of motor STN DBS (weighted overlap between E-Field and motor STN). As expected, this
showed a significant increase between thalamus and cortex and decreases between
Striatum and Cerebellum, Striatum and STN as well as STN and GPe (fig. 6).
In summary, results show that effective STN-DBS leads to an overall increase of
connectivity in the motor network of the brain (fig. 3), potentially mediated by a reduced
basal ganglia output (and stronger thalamo-cortical interaction, fig. 6). Second, STN-DBS
seems to attenuate or “normalize” both functional connectivity profiles seeding from the
electrode (fig. 4) and the overall average connectivity (i.e. centrality) estimates in the brain
(fig. 5).
Figure 1: DBS electrode placement in the sample of 20 patients. A) 3D lead reconstructions together with
42
STN (orange), GPi (green), GPe (blue) and red nucleus (red) as defined by the DISTAL atlas . An axial
47
section of the BigBrain dataset at z = -10 mm is shown. Right hemispheric volumes of activated tissue (B)
and active (bipolar) stimulation contacts (C) were nonlinearly flipped to the left hemisphere to show the
combined stimulation volume of the group (white wireframes) and the active contacts (red dots) in
relationship to the STN.bioRxiv preprint first posted online Feb. 1, 2019; doi: http://dx.doi.org/10.1101/537712. The copyright holder for this preprint (which
was not peer-reviewed) is the author/funder, who has granted bioRxiv a license to display the preprint in perpetuity.
All rights reserved. No reuse allowed without permission.
Figure 2: A-B) Resting state time series sampled from the left VTA (red/yellow) and bilateral SMA
(blue/cyan) in an example patient in DBS ON condition. Despite presence of electrode artifacts, useful BOLD
time series could be sampled from the vicinity of the electrode (i.e. the VTA) that show functional connectivity
to cortical motor regions (such as the SMA). A) shows a 3D reconstruction and example time series from the
left hemisphere SMA. B) shows the actual data with ROI overlays. Susceptibility artifact of the lead extension
can be seen on the axial slice. In this patient, correlation between the two contralateral VTA time series was
R = 0.41, correlation between left/right VTA and SMA were R = 0.34 / 0.25. In the DBS OFF condition,
values were similar (left to right VTA: R = 0.34; left/right VTA to SMA: R = 0.32 / 0.42). Sagittal and coronal
47
sections of the BigBrain dataset shown as backdrops.bioRxiv preprint first posted online Feb. 1, 2019; doi: http://dx.doi.org/10.1101/537712. The copyright holder for this preprint (which
was not peer-reviewed) is the author/funder, who has granted bioRxiv a license to display the preprint in perpetuity.
All rights reserved. No reuse allowed without permission.
Figure 3: The amount of stimulated motor STN explains connectivity changes within the motor network
across patients. The larger the weighted overlap between E-Field and motor STN, the more connected the
motor network becomes (on average to all other brain regions). Here, “motor network” refers to sensorimotor
zones (including premotor domains) in cortex, cerebellum, striatum, pallidum and thalamus (visible parts
outlined by dashed lines; see methods). Example subjects #9 and #14 are marked in the scatter plot and
their electrode placement (left) and cortical changes in connectivity induced by DBS (right) are shown.
Crucially, cortical connectivity changes were calculated independently from knowledge about electrodebioRxiv preprint first posted online Feb. 1, 2019; doi: http://dx.doi.org/10.1101/537712. The copyright holder for this preprint (which
was not peer-reviewed) is the author/funder, who has granted bioRxiv a license to display the preprint in perpetuity.
All rights reserved. No reuse allowed without permission.
placement. Both E-Field and cortical changes are visualized for the left hemisphere only but were similar on
the right hemisphere.
Figure 4: rs-fMRI functional connectivity profiles seeding from volumes of tissue activated (weighted sum of
E-fields estimating the bilateral DBS stimulation volumes) to the rest of the brain. Patient specific data of
DBS OFF (top left), ON (top right) conditions as well as maps derived from healthy age matched controls
(bottom left) were compared. Unthresholded T-maps calculated across the group of 20 patients are shown in
the top row. Spatial correlation values (that assess similarity) across cortical voxels between each DBS
condition and the healthy controls were calculated on a group (scatter plots) and individual level (mid bottom)
and were significantly higher between ON and healthy controls vs. OFF and healthy controls.bioRxiv preprint first posted online Feb. 1, 2019; doi: http://dx.doi.org/10.1101/537712. The copyright holder for this preprint (which
was not peer-reviewed) is the author/funder, who has granted bioRxiv a license to display the preprint in perpetuity.
All rights reserved. No reuse allowed without permission.
Figure 5: The shift of whole brain average connectivity profiles toward that of healthy controls (central) is
dependent on the amount of motor STN stimulated (scatter plot left). Whole brain average connectivity
profiles in DBS OFF (left) and ON (right) conditions of the same example patients as in fig. 3 are shown.
Their connectivity distribution is spatially correlated with the one in healthy controls (to assess similarity) and
the difference between conditions is related to the amount of motor STN stimulation in each patient. As can
be seen in patient #9 (top row), DBS has a strong effect on the average connectivity profile. In contrast,
profiles of patient #1 remain similar.bioRxiv preprint first posted online Feb. 1, 2019; doi: http://dx.doi.org/10.1101/537712. The copyright holder for this preprint (which
was not peer-reviewed) is the author/funder, who has granted bioRxiv a license to display the preprint in perpetuity.
All rights reserved. No reuse allowed without permission.
Figure 6: Specific connections in the sensorimotor network modulated by effective STN-DBS. Functional
connectivity between motor thalamus (sensorimotor functional domain) and sensorimotor cortex (SMA, M1,
S1) increase as a function of DBS impact on the motor STN. Instead, connectivity between motor striatum
and cerebellum, motor striatum and motor STN as well as motor STN and motor GPe decreases. For exact
definition of ROI within the motor network see table 2. ** = p < 0.005, * = p < 0.05 corrected for multiple
comparisons using the network based statistics approach as implemented in the GraphVar toolbox.bioRxiv preprint first posted online Feb. 1, 2019; doi: http://dx.doi.org/10.1101/537712. The copyright holder for this preprint (which
was not peer-reviewed) is the author/funder, who has granted bioRxiv a license to display the preprint in perpetuity.
All rights reserved. No reuse allowed without permission.
Discussion
Four main conclusions may be drawn from the present study. First, the acquisition of
postoperative rs-fMRI in DBS patients is feasible in a clinical setting and resulting data is
both useful and useable to noninvasively study effects of DBS on distributed brain
networks. Based on functional connectivity estimates to other regions of the motor
network, even the BOLD signal sampled directly at and around the electrode exhibited a
physiologically meaningful signal. Second, STN-DBS had a significant effect on brain
connectivity throughout the sensorimotor network, specifically on its cortical and cerebellar
subparts. Third, and most importantly, DBS induced changes on average connectivity
throughout the sensorimotor network were strongly dependent on electrode placement.
Specifically, electrodes with strong impact on the motor STN induce larger changes than
the ones with weak or no impact on the motor STN (R = 0.7, p < 0.001). This correlation is
crucial since it may show a direct modulatory effect of STN-DBS on the motor network.
Finally, STN-DBS had the effect of “normalizing” both connectivity profiles of the
electrodes but also average connectivity profiles toward profiles found in age-matched
healthy control subjects. Again, this effect was dependent on electrode location – well
placed electrodes shifted the overall connectivity profiles more strongly toward controls
than poorly placed electrodes.
DBS as an optimal tool to study the functional connectome of the brain
Our study identifies DBS as a promising tool to study changes of the functional
connectome due to precise brain stimulation of focal subcortical areas. Currently, such a
focal stimulation is not possible using other techniques in the human brain. Moreover,
deeper structures are not accessible by noninvasive brain stimulation. World-wide, DBS is
an increasingly applied treatment option that is well established for severe movement
48
disorders but indications extend to a growing number of psychiatric diseases .
Accordingly, a growing number of structures are targeted by DBS 49. Sometimes, the same
disease can be treated by targeting varying brain structures. For instance, at least five
50
targets are under investigation to treat obsessive compulsive disorder or treatment-
51
refractory depression . Even established diseases are treated with different targets (for
instance both PD and dystonia have been treated by stimulating STN, GPi or thalamus). It
seems that DBS may modulate symptom-related brain networks that may be overlapping
at the same node (e.g. the therapeutic network modulated in PD and dystonia seems to
overlap at both STN and GPi). fMRI analyses may help further strengthen this concept.bioRxiv preprint first posted online Feb. 1, 2019; doi: http://dx.doi.org/10.1101/537712. The copyright holder for this preprint (which
was not peer-reviewed) is the author/funder, who has granted bioRxiv a license to display the preprint in perpetuity.
All rights reserved. No reuse allowed without permission.
Adding to the complexity, different targets can be used in the same disease to
preferentially treat different symptoms (for instance STN being an obvious choice to treat
most PD symptoms while the VIM is predominantly used to exclusively treat Parkinsonian
tremor). DBS cohorts may now be studied using functional MRI (in DBS ON setting
currently approved for some systems by Medtronic only) as was done here and in a few
previous studies (table 1). Needless to say, beyond acquiring fMRI data under stimulation
in resting-state, changes in task-fMRI paradigms could equally be studied. We argue that
DBS-fMRI may soon become a new field of research that may be crucial to investigating
the functional architecture of the human brain. Based on this present study, we conclude
that much focus should be put upon precise localization of DBS electrode placement.
Specifically, studying ON vs. OFF group results without taking electrode placement into
account may lead to erroneous conclusions. The reason is that small changes in
21,52
placement may result in clinically meaningful changes in motor outcome or behavioral
23 24
response . In the present study we show that the same seems true for functional
response patterns.
Clinical implications
Our main finding shows that connectivity changes induced by DBS with optimally placed
leads are being “normalized” toward healthy controls. Overall, similar to prior results, STN-
13
DBS led to increased functional connectivity in the sensorimotor network (e.g. ) and
relative decoupling of basal ganglia pathways. Our findings are based on the largest DBS-
fMRI sample to date and extended by explaining individual differences in network changes
as a function of DBS electrode placement. This extension is crucial since it shows that
fMRI could potentially be used to even guide DBS surgery and programming. Specifically,
it could be feasible to acquire real-time rs-fMRI in surgeries that are based on
intraoperative MRI. In such a setting, one could picture test stimulations during and after
surgery. Lead placement and parameters could then be semi-automatically tuned to
maximize impact of DBS on the sensorimotor network.
Even without intraoperative MRI, before surgery, our findings could be used to guide DBS
targeting by estimating the region in and around the STN that is most strongly functionally
connected to the motor network. Such a concept has been briefly explored for essential
tremor 53 in the past but could be extended to STN-DBS for PD, as well.bioRxiv preprint first posted online Feb. 1, 2019; doi: http://dx.doi.org/10.1101/537712. The copyright holder for this preprint (which
was not peer-reviewed) is the author/funder, who has granted bioRxiv a license to display the preprint in perpetuity.
All rights reserved. No reuse allowed without permission.
Pathophysiological implications
Beyond such practical, clinical implications of our findings, they may also shed light on the
pathophysiology of PD and the mechanism of action of DBS. Specifically, we showed an
increase of functional connectivity between the motor thalamus and cortex as a function of
effective DBS and a decrease of striato-cerebellar coupling. Both effects have partly been
shown using fMRI before 9. In particular, the increase of thalamo-cortical interaction by
54
STN-DBS may be derived from classical basal-ganglia cortical loop models . In PD, the
dopamine deficit leads to increased activity of the indirect basal ganglia pathway which
results in increased GPi/SNr output and in turn inhibition of the ventrolateral thalamic
nucleus. STN hyperactivity is a key characteristic of this pathological circuitry and by
attenuating this hyperactivity with DBS the inhibition of the thalamo-cortical pathway is
9,54
reduced . Correspondingly, our results suggest an attenuation of coupling between the
STN and the striatum as well as the STN and the GPe. Taken the above into account, one
may speculate that DBS could “rescue” the thalamocortical interaction due to a disruption
of subthalamic control over GABAergic pallidothalamic efferents. In turn, this seems
implemented by attenuating coupling between the overactive STN and the striatum. In this
way, DBS may restore the hypodopaminergic loss of effective coding capacity within the
thalamo-cortical network.
Similarly, our findings suggest that striatal dominance over the cerebellum is being
attenuated by effective DBS. Increased functional striato-cerebellar coupling has been
55
described in PD patients before and was attributed to a compensatory effect that was
56
associated with improved movement performance . Still, this increased coupling – be it
pathologic or compensatory – was decreased to a level found in healthy controls under
dopaminergic medication. Our study extends these findings by showing that STN-DBS
seems to have a similar attenuating effect on increased striato-cerebellar coupling.
Limitations
Several limitations apply for careful interpretation of our results. First and foremost, despite
several publications in the past (table 1), the field of fMRI under DBS is still quite new and
most publications were case reports or based on low N cohorts of ~10 patients. Further,
the impact of DBS induced artifacts on the rs-fMRI signal has not been investigated in
detail and more methodological work is needed to address potential issues, in the future.
To our knowledge, several laboratories world-wide are currently investigating
methodological and signal-processing questions related to fMRI under DBS. In our study,
the BOLD signal sampled from directly around the electrode was at times highly correlatedbioRxiv preprint first posted online Feb. 1, 2019; doi: http://dx.doi.org/10.1101/537712. The copyright holder for this preprint (which
was not peer-reviewed) is the author/funder, who has granted bioRxiv a license to display the preprint in perpetuity.
All rights reserved. No reuse allowed without permission.
to the SMA (with a maximum R of 0.7 that is unlikely to originate from noise, also see fig.
2), a region that is coupled to the STN and not (directly) impacted by metal artifacts. This
made us decide to use the BOLD signal of the electrode itself in one analysis (fig. 4).
However, we refrained from using the signal in the most central analyses that draw our
main conclusions (figs. 2 & 5).
A crucial parameter that was investigated here for the first time in an fMRI DBS context
was the impact of the stimulation on the motor STN. Several limitations apply for the model
used to derive this measure. First, lead reconstruction and patient registration to the STN
atlas may be biased. To this end, we use a state-of-the-art DBS imaging pipeline that has
been explicitly designed for the task. In fact, a recent study could show that using our
pipeline, automatic registrations between patient space and an STN atlas are not
57
significantly different from manual expert segmentations of the nucleus . The study
involved > 11,000 nonlinear warps in > 100 brains and tested 6 multispectral deformation
algorithms with several parameter settings each to fit patient data to the STN atlas.
Second, the atlas of the STN itself might be biased. To this end, we used a modern atlas
42
that was explicitly created for our pipeline and that is based on the newest multispectral
58
high-resolution MNI template available . Recently, others confirmed accuracy of the atlas
based on intraoperative microelectrode recordings and showed that it matched
59
electrophysiological data better than three other atlases of the STN . Finally, the
sensorimotor functional zone of the atlas was defined using diffusion weighted imaging
60
data acquired on specialized MR hardware and cross-validated using both healthy
42
controls and PD data .
A third potential limitation is the impact of the electric field on the STN. In the past, the
61
volume of tissue modulated by DBS (VTA; ) has been modeled as a binary region
62-65
around the electrode (e.g. ). However, the degree of mesoscopic tissue modulation
may not be a binary (“all or nothing”) effect but instead show probabilistic properties – with
66
areas closer to the electrode being more strongly modulated than more distant ones . In
line with this assumption, we were recently able to predict slightly more variance in clinical
21
outcome using a weighted over a binary model . This led us to adopt the same principle
here, i.e. to calculate the sum over the E-field distribution within the motor STN domain.
Still, as mentioned earlier, all results shown here would hold significant when repeating the
analyses using a binary VTA instead.
Finally, clinical data was acquired at the time of imaging due to logistic reasons. Thus, our
study describes network effects of DBS on the brain but cannot draw direct conclusions onbioRxiv preprint first posted online Feb. 1, 2019; doi: http://dx.doi.org/10.1101/537712. The copyright holder for this preprint (which
was not peer-reviewed) is the author/funder, who has granted bioRxiv a license to display the preprint in perpetuity.
All rights reserved. No reuse allowed without permission.
how those affect clinical outcome. Further studies are needed to draw inferences in that
domain.
Conclusions
Our study exemplifies the use of invasive brain stimulation to study and modulate the
functional connectome of the human brain. The study shows the promise of using invasive
neuromodulation in the exemplary case of PD and hints at the promise to broaden this
novel field of functional neuroimaging under precisely targeted and focal brain stimulation.
More specifically, we demonstrate that the acquisition of postoperative rs-fMRI under STN-
DBS in a clinical setting is feasible and resulting data is useful to noninvasively study DBS
effects.
DBS may attenuate pathological basal ganglia output leading to changes in average
connectivity within the sensorimotor network that were strongly dependent on electrode
placement. Finally, STN-DBS seemed to have the effect of “normalizing” brain connectivity
toward that of healthy controls. Similar studies in populations under DBS with different
targets and/or in different diseases will extend our knowledge on the impact of focal brain
stimulation on distributed brain networks.bioRxiv preprint first posted online Feb. 1, 2019; doi: http://dx.doi.org/10.1101/537712. The copyright holder for this preprint (which
was not peer-reviewed) is the author/funder, who has granted bioRxiv a license to display the preprint in perpetuity.
All rights reserved. No reuse allowed without permission.
Data Availability
The DBS MRI datasets generated during and analyzed during the current study are not
publicly available due to data privacy regulations of patient data but are available from the
corresponding author on reasonable request. The control cohort is available within the
PPMI repository (www.ppmi-info.org). All code used to analyze the dataset is available
within Lead-DBS /-Connectome software (https://github.com/leaddbs/leaddbs).bioRxiv preprint first posted online Feb. 1, 2019; doi: http://dx.doi.org/10.1101/537712. The copyright holder for this preprint (which
was not peer-reviewed) is the author/funder, who has granted bioRxiv a license to display the preprint in perpetuity.
All rights reserved. No reuse allowed without permission.
Methods
Literature analysis
To summarize previous studies in the still novel field of DBS-fMRI, a systematic medline
literature analysis was conducted using the search-string (“Deep brain stimulation” OR
“DBS”) AND (“Parkinson’s disease” OR “Parkinson” OR “Parkinsonian” OR “thalam*” OR
“pallid*” OR “subthalamic”) AND (“functional connectivity” OR “resting-state fMRI” OR
“fMRI”). This resulted in n = 64 studies on August 31, 2018. Predefined inclusion criteria
for studies were: (i) investigation of effects of DBS in subcortical targets such as thalamus,
pallidum or subthalamic nucleus in PD patients or (potentially healthy) animals using fMRI;
(ii) bilateral/unilateral stimulation of DBS target during fMRI scan. Exclusion criteria were:
(i) studies reporting safety of fMRI in DBS patients or animals without reporting structures
affected by DBS; (ii) resting-state fMRI studies in healthy humans; (iii) studies assessing
medication effects without DBS; (iv) meta-analyzes and reviews. Relevant references were
identified by title and abstract (n = 17) and further judged based on inclusion and exclusion
criteria, originality, quality and actuality of the study resulting in n = 15 remaining papers.
Another 7 publications were added by screening reference lists of included articles.
Results are summarized in table 1.
Patients and imaging
DBS cohort
Twenty patients suffering from Parkinson’s Disease that underwent DBS with target STN
were included in the present study. Inclusion criteria were at least > 3 months of active
STN-DBS, an MR-conditional DBS system (in agreement with the Medtronic whole-body
67
CE certificate ), no metal implants beside the DBS system, no largely predominant
affective or cognitive non-motor symptoms of the disease, no excessive tremor at rest that
would make scanning impossible. The study was carried out in accordance with the
Declaration of Helsinki and was approved by the internal review board of Charité –
Universitätsmedizin Berlin (master vote # EA2/138/15). All patients had undergone DBS
surgery for idiopathic PD between April 2010 and April 2016 and received 2 quadripolar
DBS electrodes (model 3389; Medtronic, Minneapolis, MN). Before surgery, patients
received preoperative MRI and neuropsychological testing to exclude structural or
psychiatric comorbidities. During surgery, microelectrode recordings were performed to
verify lead placement. Clinical variables, including age, sex, L-dopa response and L-dopa
equivalent dose (LEDD) at baseline were recorded. Postoperative improvement scoresbioRxiv preprint first posted online Feb. 1, 2019; doi: http://dx.doi.org/10.1101/537712. The copyright holder for this preprint (which
was not peer-reviewed) is the author/funder, who has granted bioRxiv a license to display the preprint in perpetuity.
All rights reserved. No reuse allowed without permission.
were recorded 12 months after surgery under Med OFF and DBS ON/OFF conditions
using clinical DBS stimulation parameters.
After multiple studies had shown fMRI acquisition with implanted DBS devices to be safe
10,68,69
, and elaborate modeling and animal testing by the company Medtronic, their
Activa® portfolio received an extended MR conditional CE certificate for full-body MRI in
2015 (FDA approval followed 2016). Under this extended certificate, it became officially
67
feasible to acquire fMRI data under active DBS in humans . Limits, such as a maximal
scanning time of 30 minutes and a B1+RMS value below 2.0 μT apply – and it is only
allowed to stimulate using bipolar settings. Thus, postoperatively, patients were scanned in
a Siemens Magnetom Aera 1.5T MRI. After a structural scan, a resting-state fMRI scan of
~9 minutes was carried out in DBS ON condition. Patients were then briefly taken out of
the scanner to turn the impulse generator off. After that, the same scan was repeated
(DBS OFF condition). Scan parameters were as follows: T1 MP-RAGE: Voxel-size 1 × 1 ×
1 mm, TR 2200 ms, TE 2.63 ms. Rs-fMRI EPI scan: Voxel-size 3 × 3 × 3 mm, 24 slices
with distance factor 30%, A >> P phase encoding, TR 2690 ms, TE 40 ms, FoV readout
200 mm. 210 volumes were acquired for each condition (total scan length of rs-fMRI scans
2 × 9.42 min). A brief dMRI scan was acquired before the rs-fMRI scans but was not used
in the present study. Total scan time was close to but below 30 minutes and the B1+RMS
value was kept below 2.0 uT at all times (conforming to the MR-conditional regulations of
the Medtronic Activa CE-certificate).
Normative control subjects
Structural and rs-fMRI data from 15 control subjects were obtained from the Parkinson’s
46
Disease Progression Marker Initiative (PPMI; ppmi-info.org; ) database. These were
processed in the same way as patients of the present study using Lead connectome
70,71 22
software and had been made available in form of a normative group connectome in .
Thus, details in acquisition and processing scheme are described elsewhere 22,46.
Electrode localization and modeling the volume of tissue activated
72
All data was processed in Lead-DBS software (www.lead-dbs.org; ) using the enhanced
21
default workflow of version 2.1.7 described in . Within the pipeline, Lead-DBS uses a
21
multitude of open source tools (see below and for details). Briefly, all (pre- and
postoperative) MRIs were linearly co-registered to the preoperative T1 anchor modality
73
using SPM (https://www.fil.ion.ucl.ac.uk/spm/software/spm12/; ). Registration between
post- and preoperative T1 was further refined using the “brainshift correction” module inbioRxiv preprint first posted online Feb. 1, 2019; doi: http://dx.doi.org/10.1101/537712. The copyright holder for this preprint (which
was not peer-reviewed) is the author/funder, who has granted bioRxiv a license to display the preprint in perpetuity.
All rights reserved. No reuse allowed without permission.
74
Lead-DBS which focuses on the subcortical target ROI and thus minimizes nonlinear
bias introduced by opening the skull during surgery. Data was normalized into standard
58
space (ICBM 2009b NLIN ASYM; ; henceforth referred to as “MNI space”) in a
multispectral fashion (i.e. using T1- and T2-weighted) in parallel. This was done with the
symmetric diffeomorphic registration algorithm implemented in Advanced Normalization
75
Tools (http://stnava.github.io/ANTs/; ) using the “effective (low variance)” preset with
21
subcortical refinement as implemented in Lead-DBS . This exact normalization method
76
was recently evaluated best-performing in a large comparative study and STN
definitions obtained by the method rivaled those of manual expert segmentations in
precision. Electrode trajectories and contacts were automatically pre-localized and
manually refined using Lead-DBS. Based on the (bipolar) stimulation settings active in the
scanner, the electric fields (E-Fields) around the electrode were modeled using a finite
21,22
element approach defined in . Briefly, an adapted version of the FieldTrip/SimBio
pipeline that is part of Lead-DBS (http://www.fieldtriptoolbox.org/; https://www.mrt.uni-
77
jena.de/simbio/; ) was used which uses a four-compartment anatomical model of the
electrodes and surrounding tissue. All analyses were performed using the impact of the E-
Field on the STN but were repeated with a binarized version of it, the VTA that is a more
commonly applied model in the field. To approximate the VTA, the E-field gradient
magnitude was thresholded at a heuristic value of 0.2 V/mm. This value has been
frequently been used in similar context 22,78-80.
Estimating the impact of DBS on motor STN
As mentioned above, in the DBS context, the VTA has most often been modeled in binary
22,61,64,65,78
form . However, a recent study showed superior results when directly using the
21
E-field magnitude (instead of a binarized version; ). Building upon this, here, we
estimated the factor impact of DBS on the motor STN by multiplying the (unthresholded)
42
E-field gradient magnitude map with the atlas-defined mask of the motor STN and
summed up voxels of the resulting image. Intuitively, this grasps the amount of voltage
gradient that is present within the motor STN. Of note, all results reported in the present
study would hold true with similar (and significant) effect sizes when repeating analyses
using a binarized VTA, instead.
Definition of a sensorimotor network parcellation
To estimate changes in the motor network of key regions within the basal ganglia
cerebellar cortical loop, sensorimotor functional zones of cortex, striatum, thalamus,You can also read