Diversity, Composition, and Activities of Nano- and Pico-Eukaryotes in the Northern South China Sea With Influences of Kuroshio Intrusion - Frontiers
←
→
Page content transcription
If your browser does not render page correctly, please read the page content below
ORIGINAL RESEARCH
                                                                                                                                            published: 31 August 2021
                                                                                                                                      doi: 10.3389/fmars.2021.658233

                                            Diversity, Composition, and Activities
                                            of Nano- and Pico-Eukaryotes in the
                                            Northern South China Sea With
                                            Influences of Kuroshio Intrusion
                                            Feipeng Wang 1,2 , Bangqin Huang 1,3* , Yuyuan Xie 1 , Shujie Cai 1 , Xiuxiu Wang 1 and
                                            Jingli Mu 2
                                            1
                                              State Key Laboratory of Marine Environmental Science, Fujian Provincial Key Laboratory of Coastal Ecology and
                                            Environmental Studies, Xiamen University, Xiamen, China, 2 Institute of Oceanography, Minjiang University, Fuzhou, China,
                                            3
                                              Southern Marine Science and Engineering Guangdong Laboratory (Zhuhai), Zhuhai, China

                                            Nano- and pico-eukaryotes play important roles in the diversity and functions of
                                            marine ecosystems. Warm, saline, and nutrient-depleted water that originates in the
                                            Kuroshio Current seasonally intrudes into the northern South China Sea (NSCS) from
                                            autumn to spring. To clarify the mechanisms in shaping the community structure of
                           Edited by:       nano- and pico-eukaryotes as well as impacts of the Kuroshio intrusion on the NSCS
                      Xavier Pochon,
           The University of Auckland,      ecosystem, genomic DNA and RNA were co-extracted from samples collected at
                         New Zealand        two depths from nine stations, and then the V9 region of 18S rDNA and rRNA was
                        Reviewed by:        sequenced with high-throughput sequencing. Our results showed that Dinophyceae
        Margaret Anne Mars Brisbin,
                                            was the most diverse and abundant nanoeukaryotic group during the study period
         Okinawa Institute of Science
 and Technology Graduate University,        revealed by both DNA and RNA surveys. In contrast, the relative read abundance of
                                 Japan      MAST, Pelagophyceae, and Dinophyceae in the size fraction of picoeukaryotes might
                  Franck Lejzerowicz,
   University of California, San Diego,     be largely underestimated by the DNA survey. The RNA survey was the more reliable
                          United States     method to investigate the eukaryotic community structure. Environmental filtering played
                 *Correspondence:           an important role in shaping the community structure, and the sampling depth became
                    Bangqin Huang
                                            the governing factor of the beta diversity under the environmental setting of stratification
               bqhuang@xmu.edu.cn
                                            during the study period. The spatial variations in the diversity of nanoeukaryotes were
                   Specialty section:       subject to the dispersal limitation under the size rule. The effects of the Kuroshio
         This article was submitted to
          Marine Ecosystem Ecology,
                                            intrusion on the nanoeukaryotic community structure might also be explained by the
               a section of the journal     dispersal limitation. Overall, neutral processes are critical in shaping the community
          Frontiers in Marine Science       structure of nanoeukaryotes. The relative metabolic activities of nanoeukaryotes were
         Received: 25 January 2021          relatively stable in accordance with the high similarity of community structure between
         Accepted: 10 August 2021
         Published: 31 August 2021          sampling sites. The responses of the relative metabolic activities of picoeukaryotes
                            Citation:       to environmental factors displayed two distinct patterns: positive correlations with
      Wang F, Huang B, Xie Y, Cai S,        salinity and nutrients and negative with temperature for Dinophyceae, MAST, and
   Wang X and Mu J (2021) Diversity,
 Composition, and Activities of Nano-
                                            Pelagophyceae, while reversed patterns for Mamiellophyceae and Radiolaria. Our
 and Pico-Eukaryotes in the Northern        findings improve the understanding of the nano- and pico-eukaryotic communities in
    South China Sea With Influences         the NSCS and the mechanisms of their assembly.
               of Kuroshio Intrusion.
          Front. Mar. Sci. 8:658233.        Keywords: nano- and pico-eukaryotes, RNA/DNA comparison, neutral process, Kuroshio intrusion, northern
   doi: 10.3389/fmars.2021.658233           South China Sea

Frontiers in Marine Science | www.frontiersin.org                                  1                                           August 2021 | Volume 8 | Article 658233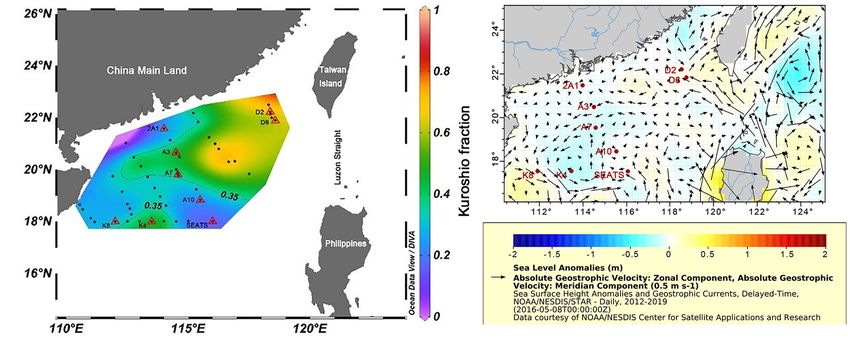
Wang et al.                                                                                                      Nano- and Pico-Eukaryotes in NSCS

INTRODUCTION                                                                size constrains fundamental requirements and physiological rates
                                                                            (e.g., growth rate) of plankton as well as biotic interactions
Nano- and pico-eukaryotes (size fractions of 3–20 and 0.2–3 µm,             (e.g., grazing and competition) between them (Barton et al.,
respectively) are present worldwide, abundantly, and persistently           2013). In contrast with picoplankton studied by most research,
in various marine ecosystems (Massana et al., 2015). Much                   nanoplankton have higher requirements for nutrients and food,
attention has been paid to their astonishing diversity (Caron et al.,       in turn, nanoplankton contribute more to carbon export than
2012; Piwosz et al., 2015; de Vargas et al., 2015; Caron et al.,            picoplankton (Ward and Follows, 2016; Leblanc et al., 2018).
2016) and more recently to their trophic modes and interactions             Cell size is also an important factor for dispersal limitation to
(Piwosz et al., 2018; Adl et al., 2019; Sassenhagen et al., 2019).          shape community structure. Dispersal limitation was reported to
The photosynthetic groups of nano- and pico-eukaryotes are                  increase with cell size (de Vargas et al., 2015).
important contributors to primary production (Grob et al., 2007;               High-throughput sequencing (HTS) has revealed the
Jardillier et al., 2010; Hartmann et al., 2012), which link trophic         astonishing diversity of protist (microbial eukaryotes) and
levels in the microbial food web (Massana et al., 2009), and                greatly improved our understanding of their community
mixotrophic groups are important bacterial grazers and have the             composition in environmental samples (Edgcomb et al., 2011;
potential to dominate the primary production and bacterivory                Parris et al., 2014; Massana et al., 2015; de Vargas et al., 2015;
in marine ecosystems (Unrein et al., 2014). Understanding the               Piwosz et al., 2018; Liu et al., 2019). Moreover, protistologists
diversity, composition, and functions of these groups is therefore          have generally accepted that protist assemblages inferred
important to unveil critical biogeochemical cycles in the sea.              from 18S rRNA gene sequencing (hereafter DNA sequencing)
    The main goal of microbial ecology is to reveal the                     represented the species present. Compared to DNA, RNA is
mechanisms shaping and maintaining community assembly                       unstable in extracellular conditions, microbial community
(Zhou and Ning, 2017). The framework described by Sloan                     structures inferred from rRNA sequencing (hereafter RNA
et al. (2006) proposed four main processes for regulating                   sequencing) can exclude sequences from dissolved extracellular
the distribution patterns of microbial communities, including:              pool, dormant cells and dead materials (Not et al., 2009). Thus,
selection, ecological drift, dispersal, and speciation. These               the RNA-based approach was used to identify the active species
four processes can be further grouped into two categories:                  or groups in environmental samples (Massana et al., 2015; Hu
deterministic processes (or selective processes) and neutral                et al., 2016; Wang et al., 2019). The RNA: DNA ratio (calculated
processes (or stochastic processes) (Sloan et al., 2006; Logares            by relative sequence abundance) has been used as an index
et al., 2013). The deterministic process refers to the governing of         for the relative metabolic activity in protist (Hu et al., 2016;
the microbial community structure by environmental conditions               Wu and Liu, 2018). However, sequences information derived
(e.g., temperature, salinity, and nutrient concentration) and               from the rRNA indicates the possible ribosomal activity (i.e.,
biotic interactions (e.g., predation, competition, and mutualism)           protein synthesis), which is not a direct indicator of cell activity
(Stegen et al., 2012; Yu et al., 2015; Zhou and Ning, 2017).                (Blazewicz et al., 2013). In addition, gene copy numbers, life
The neutral process refers to the governing of the microbial                strategies and histories are very different among species. The
community structure by the stochastic process of birth, death,              RNA: DNA ratio should be used with caution (Blazewicz et al.,
extinction, colonization, and speciation (Hubbell, 2011). The               2013). Comparison of RNA: DNA ratios usually used in the
neutral community model (NCM) is an adaptation of the neutral               same species or group among different samples, but not for the
theory, which is very useful in quantifying the importance                  comparison between different species or groups (Hu et al., 2016).
of neutral process in diverse environments (Logares et al.,                 A previous study showed that the RNA: DNA ratio could be a
2013; Chen et al., 2017). Normalized stochasticity ratio (NST),             potential indicator of the upcoming Phaeocystis globosa bloom in
proposed by Ning et al. (2019), is also powerful in evaluating              the eastern English Chanel (Rachik et al., 2018). Xu et al. (2017)
the community assembly processes (Li et al., 2020). The                     observed the varied metabolic activities of protist community at
relative importance of deterministic and neutral processes varies           different sampling depths in the South China Sea. Wang et al.
among regions, taxa, and ecosystems (Bahram et al., 2016;                   (2019) found the varied metabolic activities of picoeukaryotes at
Wu et al., 2017b).                                                          spatial scale in the Pacific Ocean.
    Eukaryotic diversity in the ocean has been extensively studied.            The South China Sea is the largest marginal sea of the North
Most studies targeted one specific size fraction, while a few               Pacific (from the equator to 23◦ N, from 99 to 121◦ E), and its
studies explored diversity across size, usually in four size                surface circulation is driven by monsoons (Liu et al., 2002). The
classes: picoplankton (0.2–3 µm), nanoplankton (3–20 µm),                   North South China Sea (NSCS) exchanges water with the North
microplankton (20–200 µm), and mesoplankton (200–2000 µm)                   Pacific through only the Luzon Strait channel. Kuroshio, the
(de Vargas et al., 2015; Massana et al., 2015; Ramond et al.,               western boundary current of the North Pacific, is characterized
2019). These studies disclosed cryptic diversity across oceans with         by warm and saline waters and intrudes seasonally into the NSCS
many parasitic and phagotrophic species unseen by traditional               by passing through the Luzon Strait (Nan et al., 2015). Intrusion
methods. The deeply sequenced samples help reacquaint the                   also generates mesoscale eddies in the NSCS (Wang et al., 2018).
trophic modes of eukaryotes in the ocean (Ramond et al., 2019).             The mix of Kuroshio and NSCS waters dilutes nutrients (Du
In spite of the dominance of heterotrophs in every size fraction,           et al., 2013), but has been found to stimulate the activities of
the ratio between heterotrophs and autotrophs increases with                ammonia-oxidizing bacteria (Xu et al., 2018; Lu et al., 2019) as
the nominal size of fractions (de Vargas et al., 2015), and cell            well as primary productivity (Huang et al., 2019). The diversity

Frontiers in Marine Science | www.frontiersin.org                       2                                     August 2021 | Volume 8 | Article 658233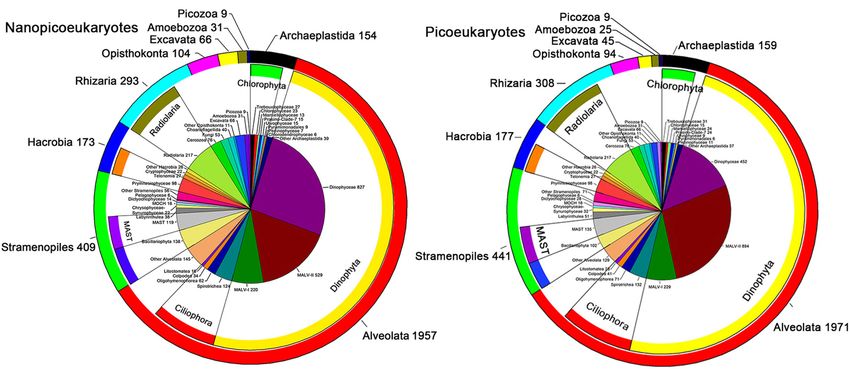
Wang et al.                                                                                                            Nano- and Pico-Eukaryotes in NSCS

and composition of picoeukaryotes in the NSCS have been                   United States) under 200 mm Hg pressure. The filters were
previously explored by high-performance liquid chromatography             stored in liquid nitrogen on board. In the laboratory, the filters
(Xiao et al., 2018), fluorescence in situ hybridization (Wu et al.,       were submersed in 90% acetone in the dark at −20◦ C for
2017c), and DNA sequencing (Wu et al., 2014). However, little is          24 h. The concentrations of Chl a extracted into the acetone
known about the diversity and composition of nano-eukaryotes              were measured with a Trilogy fluorometer (Turner Design,
in this area. Moreover, neutral processes have been overlooked in         United States) (Welschmeyer, 1994). A geostrophic current is
the past, but these processes could be important for Kuroshio-            the result of the horizontal pressure gradient and the Coriolis
water-influenced areas because ocean currents are always related          force. The direction of the geostrophic current is parallel to the
to the dispersal and colonization of species. This study examines         contour of the sea surface height. To generate a synoptic view of
the diversity and community composition of nano- and pico-                how Kuroshio intrusion physically influences the SCS, sea level
eukaryotes in the NSCS using size-fractionated filtration and             anomalies and geostrophic current vectors for the study area
DNA/RNA high-throughput sequencing. The NSCS was sampled                  were downloaded from the US NOAA National Environmental
in late spring, when a significant proportion of the water                Satellite, Data, and Information Service.1
mass is of Kuroshio origin, in order to evaluate the relative
importance of environmental filtering and neutral processes in            Kuroshio Fraction at the HTS Sampling
shaping communities. In particular, we assess how diversity               Stations
and community composition of nano- and pico-eukaryotes are                An isopycnal mixing model described by Du et al. (2013) was
affected by deterministic processes by relating metabolic activity        used to quantify the impact of the Kuroshio intrusion (KI) at
and environmental gradients.                                              our sampling stations. This model assumes that the different
                                                                          water masses are dominated by isopycnal mixing, and diapycnal
MATERIALS AND METHODS                                                     mixing is comparatively negligible (Du et al., 2013). In this
                                                                          model, two end-members (representing the Kuroshio water and
Cruise, Sampling, and Environmental                                       SCS water, respectively, in this study) are required for index
                                                                          estimation. The P4 station (122.959◦ E, 20.003◦ N) was used
Parameters                                                                to represent the Kuroshio water mass end-member, and the
The research cruise was conducted in the NSCS from 114                    South East Asian time-series (SEATS) station (116◦ E, 18◦ N)
to 119◦ E and 18 to 22.5◦ N from May 15th to June 5th,                    was selected to represent the proper South China Sea (SCS)
2016 (Supplementary Figure 1). A total of 36 samples (18                  water mass end-member (Figure 1A). Notably, the fractional
picoeukaryotes and 18 nanoeukaryotes) were collected from the             contribution of the two end-members varies depending on the
surface layer (Sur, 5 m) and deep chlorophyll maximum (DCM)               end-member selection. The proportion of the Kuroshio water
layers at nine stations (Supplementary Figure 1). For each                (RK ) indicated the relative contribution from P4 instead of the
sample, 10–20 L of seawater was collected using Niskin bottles            “typical Kuroshio” water. Our HTS samples were all collected at
(12-L PVC) mounted on a conductivity, temperature, and depth              the surface (5 m) and DCM layers (less than 100 m), and the
(CTD) rosette (Sea-Bird Electronics, United States). The seawater         average RK values of the upper 100 m (RKave−100 , 1 m interval)
was pre-filtered through a 20 µm Bolting Cloth to remove                  were used to represent the KI fraction. Hence, an index was
large organisms. Then the pre-filtered seawater was sequentially          used to indicate the degree of KI influence (KI index) at each
filtered through 3- and 0.2 µm pore size polycarbonate                    sampling station (Supplementary Table 1). According to the
membranes (142 mm diameter, Millipore, United States) using               assumption of this model, Xu et al. (2018) who participated in
a peristaltic pump. To reduce the loss of RNA samples, the                the same cruise have calculated and published the KI index at all
filtration rate in our experiment was controlled at 0.5–1 L/min.          sampling stations. In this study, KI index ≥0.35 was considered
The filters (nanoeukaryotic samples: 3–20 µm, picoeukaryotic              to indicate more KI (MKI) affected stations, and the D2, D6, A3,
samples: 0.2–3 µm) were stored in 5 mL cryotubes containing               A7, and K4 stations belonged to this category. KI index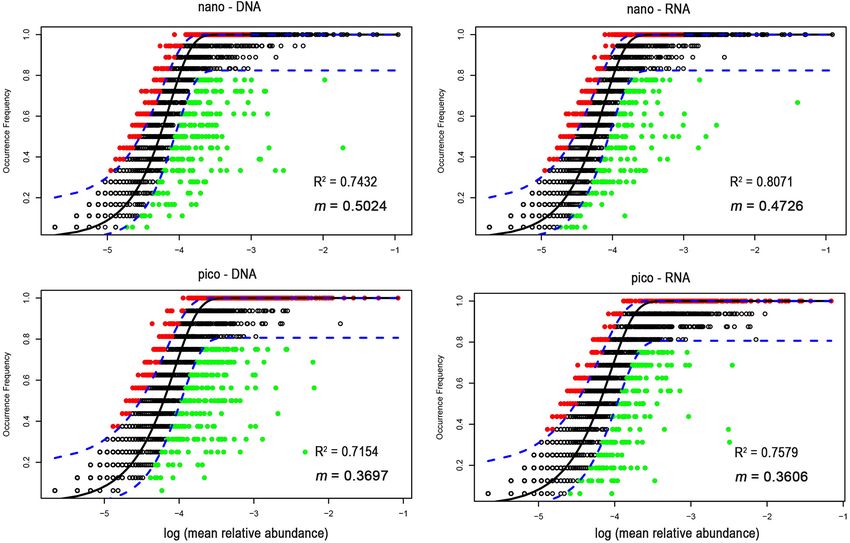
Wang et al.                                                                                                                         Nano- and Pico-Eukaryotes in NSCS

  FIGURE 1 | The spatial distribution of (A) averaged Kuroshio fraction for upper 100 m (1 m resolution) at our HTS sampling sites (triangles) in the NSCS during the
  summer cruise conducted in 2016 and (B) geostrophic currents and sea level anomalies in a week before the cruise. The P4 station was the end-member used in
  our study for the Kuroshio water. The thin line stands for the isopleth of RK (KI index) of 0.35. The color bar indicates the value Rkave−100 (from 0 to 1).

Reverse Transcription Kit (Qiagen, #205311, Germany). The                              sequence of each OTU was chosen as the representative sequence,
V9 hypervariable region of the eukaryotic 18S rRNA gene was                            and then taxonomically annotated against the V9_PR2∗ database
amplified using the 1380F (5-CCCTGCCHTTTGTACACAC-3)                                    (de Vargas et al., 2015) using BLAST (E value = 10−6 and
and 1510R (5-CCTTCYGCAGGTTCACCTAC-3) primers                                           minimum percent query coverage = 0.9) (Altschul et al., 1990).
(Amaral-Zettler et al., 2009). For each polymerase chain reaction                      The OTU taxonomy was determined from the top hit based on
(PCR) reaction, 25 µL mixture contained 12.5 µL 2 × Taq PCR                            the BLAST score. OTUs occurring in a single sample, OTUs
mix (Takara, China), ≤1 µg DNA or cDNA template, 0.1 µM                                with only one read (singleton), and OTUs assigned to Metazoan,
forward primer, and 0.1 µM reverse primer. The PCR program                             Bacteria, Archaea, and organelles were also discarded from the
consisted of a 5-min initial denaturation step at 95◦ C, followed                      downstream analyses. To normalize the sampling effort, the
by 34 cycles of denaturation at 94◦ C for 1 min, annealing at                          nano- and pico-eukaryotic OTU tables were rarefied to 29,799
57◦ C for 45 s, and elongation at 72◦ C for 1 min, and a final                         and 28,698 reads per sample, respectively (the lowest sequence
extension at 72◦ C for 10 min. Each PCR was performed in                               reads numbers in these tables).
duplicates for each DNA and cDNA sample. The duplicate                                     All statistical analyses in our study were performed using the
PCR products were pooled and purified using the QIAquick                               R software (version 3.3.2) (R Core Team, 2014). To investigate
Gel Extraction Kit (Qiagen, #28704, Germany). Amplicons                                whether the community structure of nano- and pico-eukaryotes
were sent with dry ice to the Novogene sequencing company                              in the NSCS was affected by the Kuroshio intrusion, principal
(Beijing, China) where sequencing library, constructed using the                       coordinate analysis (PCoA) was conducted based on the Bray-
TruSeq DNA PCR-Free Sample Preparation Kit, was prepared                               Curtis distance matrix. Variation-partitioning analysis (VPA,
and sequenced on a single run using the Illumina HiSeq 2500                            Borcard et al., 1992) was performed to disentangle the relative
platform. High-throughput sequencing data from this study                              effects of spatial and environmental factors on variation in
were deposited in the GenBank Sequence Read Archive database                           nano- and pico-eukaryotic DNA/RNA-based communities using
under the accession number PRJNA684778.                                                a 3-way PERMANOVA (McArdle and Anderson, 2001). One
                                                                                       of the environmental factors was the data matrix consisting
                                                                                       of water temperature, NO2 − + NO3 − , PO4 3− , SiO3 2− , and
Sequencing Processing and Statistical                                                  Chl a, and the other was the KI index. It might represent
Analysis                                                                               some unmeasured environmental variables that were related to
The raw tags were processed and checked using the Quantitative                         the fraction of Kuroshio water or salinity. The spatial factor
Insights Into Microbial Ecology (v.1.70) pipeline (Caporaso et al.,                    was computed as the principal coordinates of neighborhood
2010). Chimeras were identified and discarded after checking                           matrix (PCNM) by the pcnm function of the “vegan” package
with the chimera search module (USEARCH, version 4.2) (Edgar                           in R, the second PCNM was used for the VPA analysis in
et al., 2011) using the Silva 123 release (Quast et al., 2013)                         this study. The neutral community model (NCM) was used
as a reference. The remaining filtered sequences were grouped                          to determine the potential contribution of neutral processes to
into operational taxonomic units (OTUs) with 0.95 similarities                         the nano- and pico-eukaryotic communities by predicting the
using UPARSE (v. 7.0.100; Edgar, 2013). The most abundant                              relationship between OTUs occurrence and their relative read

Frontiers in Marine Science | www.frontiersin.org                                  4                                            August 2021 | Volume 8 | Article 658233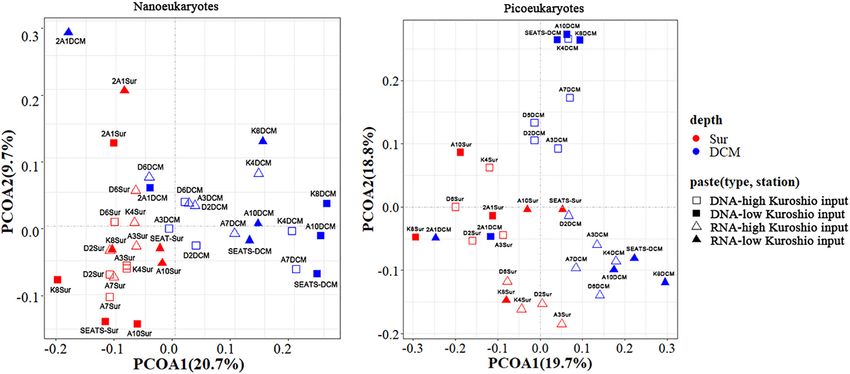
Wang et al.                                                                                                                    Nano- and Pico-Eukaryotes in NSCS

  FIGURE 2 | Number of OTUs of nano- (A) and pico-eukaryotes (B) in the NSCS. The pie chart represents the numbers of OTUs mainly at class level; the inner ring
  indicates these classes affiliated to the phylum; the outer ring represented the OTUs numbers at super-group level.

abundance (Sloan et al., 2006). The normalized stochasticity test                    (average 0.08 mg m−3 ) than at the DCM (average 0.37 mg m−3 )
(NST) was used to further confirm the importance of neutral                          (paired Mann-Whitney U-test, p < 0.01) was consistent with the
process during nano- and pico-eukaryotic community assembly.                         different nutrient regimes.
The NST was conducted using the function of the “NST” R
package, which is based on the Ruzicka index (NSTruzicka).
This index ranges from 0 to 100%, indicating an increase from
                                                                                     Richness of Nano- and Pico-Eukaryotes
more deterministic to more stochastic assembly (Ning et al.,                         in the NSCS
2019). Principal component analysis (PCA) was performed using                        In our study, 852,873 high-quality DNA sequences and
the “vegan” package in R to access the distribution pattern of                       997,272 high-quality RNA sequences were obtained from the
eukaryotic assemblages among sampling sites. OTUs only occur                         nanoeukaryotic samples (Supplementary Tables 5, 6), whereas
in both DNA and RNA sequencing results and appeared in all                           798,801 high-quality DNA sequences, and 787,383 high-quality
samples were selected, and the RNA: DNA ratios of the selected                       RNA sequences were obtained from the picoeukaryotic samples
OTUs were calculated based on their relative read abundance in                       (Supplementary Tables 7, 8). Note that picoeukaryotic DNA
the RNA and DNA results (Wu and Liu, 2018).                                          amplicons in A7Sur, SEATS-Sur, and cDNA amplicons in
                                                                                     A7Sur and 2A1Sur were too low concentration for library
                                                                                     preparation during high-throughput sequencing, and thus these
RESULTS                                                                              samples were not included. In this study, 3,198 and 3,233
                                                                                     nanoeukaryotic and picoeukaryotic OTUs, respectively, were
Environmental Setting                                                                generated. All the OTUs were affiliated to ten super-groups:
Stations D2 and D6 were close to the Luzon Strait and                                Alveolata, Stramenopiles, Hacrobia, Archaeplastida, Rhizaria,
characterized by higher salinity (34.44–34.81) than other                            Opisthokonta, Picozoa, Amoebozoa, Excavata, and Apusozoa
sampling stations. The two stations were greatly influenced by                       (Figures 2A,B).
the Kuroshio intrusion, as indicated by KI indexes larger than                          Alveolata was the richest super-group (in terms of the number
0.6 (Figure 1A). Kuroshio water affected stations A3 and A7                          of OTUs) in both nano- and picoeukaryotes, accounting for
in the middle of the transect from 2A1 to SEATS (Figure 1B).                         61.2 and 61.0% of total richness (observed OTU number),
Although station 2A1 is geographically close to the Pearl River                      respectively (Figure 2); followed by Stramenopiles (12.8 and
Estuary, it was not affected by fresh water during our sampling                      13.6%) and Rhizaria (9.2 and 9.5%). The other seven super-
period. Salinity at surface and DCM layers of 2A1 station were                       groups contributed only a small proportion of total richness.
34.28 and 34.33, respectively, which was close to those of SEATS                     Dinophyta and Ciliophora were the top two phyla of Alveolata,
station. The distinct temperature between surface and DCM                            Dinophyceae was the richest class of nanoeukaryotes while it was
(paired Mann-Whitney U-test, p < 0.01) indicated stratification                      MALV-II for picoeukaryotes.
in water columns (Supplementary Table 2). Nutrients at the                              Among the 3,198 nanoeukaryotic OTUs (3,233 picoeukaryotic
surface were mostly below the detection limits but were abundant                     OTUs), there were 292 (319) unique DNA OTUs in
in the DCM. The lower concentrations of Chl a at the surface                         the MKI stations and 215 (215) in the LKI stations

Frontiers in Marine Science | www.frontiersin.org                                5                                          August 2021 | Volume 8 | Article 658233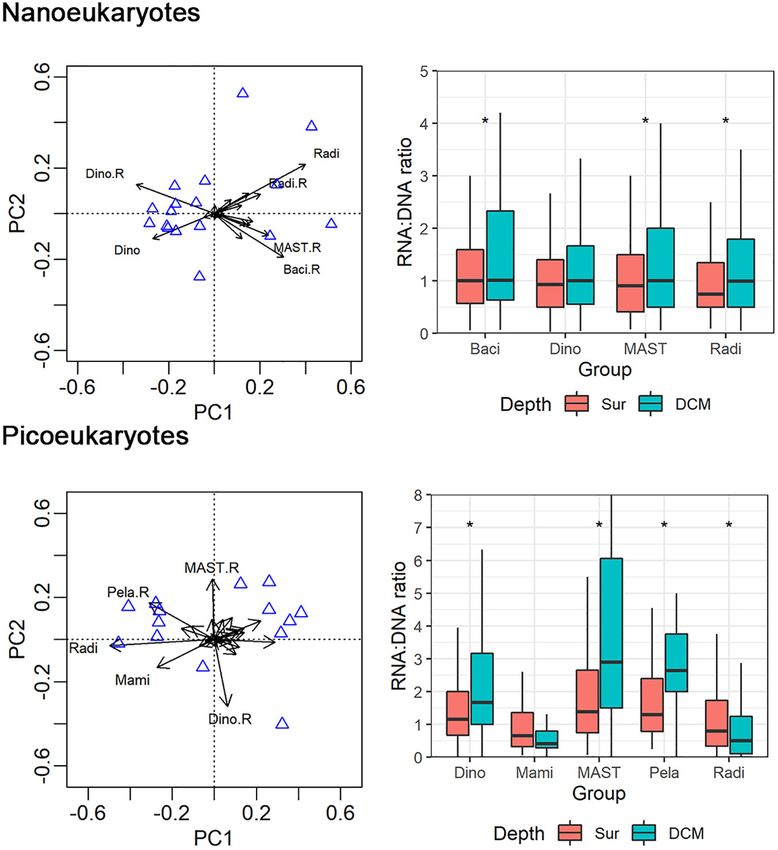
Wang et al. Nano- and Pico-Eukaryotes in NSCS
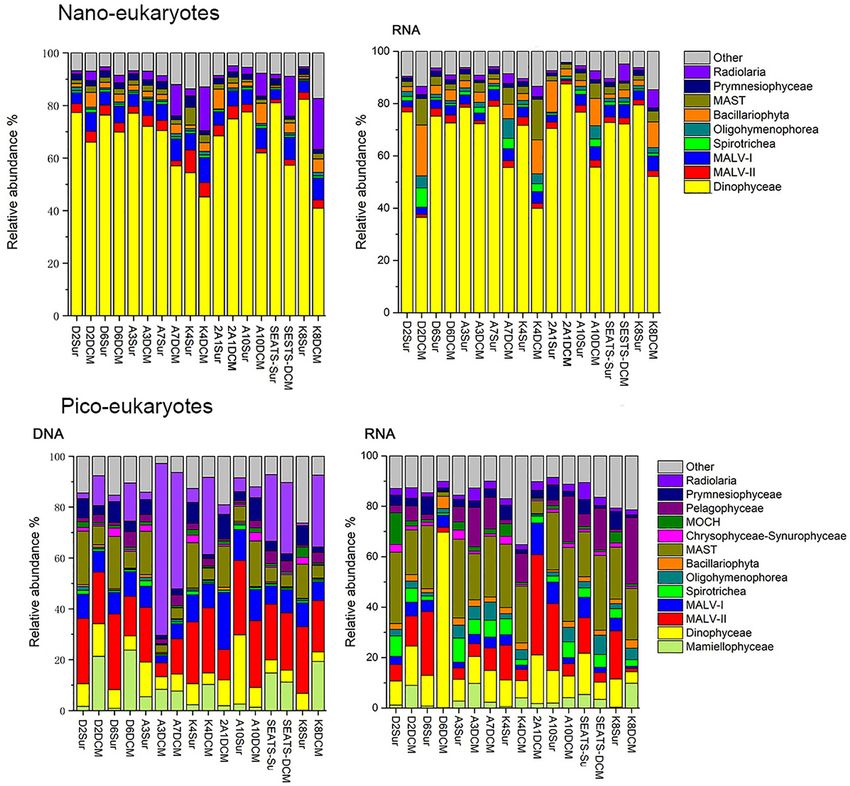
FIGURE 3 | Relative read abundance of nanoeukaryotes (A,B) and picoeukaryotes (C,D) mainly at class level based on the DNA-derived (A,C) and RNA-derived
(B,D) approaches for each sample. The other category refers to groups with relatively lower sequence abundance.
(Supplementary Figures 4A,C); similar numbers were displayed MKI stations. In contrast, MALV-II and MAST were the
for the RNA samples (Supplementary Figures 4B,D). In most sequenced picoeukaryotic classes in DNA and RNA
addition, there were more unique nanoeukaryotic DNA OTUs at samples, respectively (Figures 3C,D and Table 1). Radiolaria
the DCM than at the surface (466 vs. 192), similar to the unique Astrosphaera hexagonalis (OTU5) which favored the DCM
picoeukaryotic DNA OTUs (397 vs. 228). environments (Kruskal-Wallis test, p < 0.05) in MKI stations
(Kruskal-Wallis test, p < 0.05) was the most sequenced
OTU in picoeukaryotic DNA samples (averagely 8.2%), while
Relative Read Abundance of Nano- and Pelagophyceae Pelagomonas calceolata (OTU1) was the most
Pico-Eukaryotes sequenced in RNA samples (averagely 6.7%). The relative read
Dinophyceae was the most sequenced nanoeukaryotic class abundance of the picoeukaryotic OTU1 was not significantly
(Figures 3A,B and Table 1). The most sequenced OTU different between MKI and LKI stations (Kruskal-Wallis test,
was Dinophyceae Gymnodinium_03 aureolum, representing an p = 0.79) but higher in DCM than in surface for some stations
average relative read abundance of 12.0 and 10.0% in DNA (Kruskal-Wallis test, p = 0.06).
and RNA samples, respectively, and there was no significant In nanoeukaryotic samples, some of minor classes showed
difference between surface and DCM or between LKI and large variations in relative read abundance. For example,
Frontiers in Marine Science | www.frontiersin.org 6 August 2021 | Volume 8 | Article 658233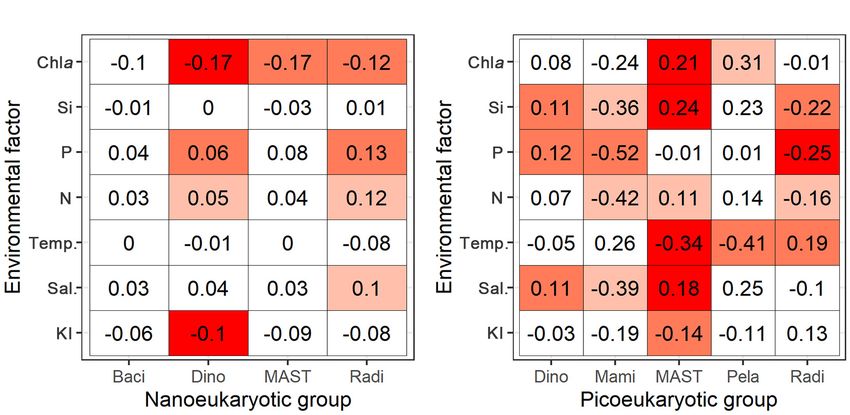
Wang et al.                                                                                                                Nano- and Pico-Eukaryotes in NSCS

TABLE 1 | Nano- and pico-eukaryotic taxonomic groups (mainly at class level) sequences and percentages across samples based on the DNA and RNA surveys.

Nano- and pico-eukaryotes                Taxonomic groups (mainly at class level)                      DNA                                   RNA

                                                                                           Sequences          Percent           Sequences             Percent

Nanoeukaryotes                           Dinophyceae                                        360,733            67.25              365,219               68.09
                                         MALV-I                                              33,332             6.21               19,645                 3.66
                                         Radiolaria                                          29,576             5.51               12,435                 2.32
                                         MALV-II                                             19,284             3.60               11,801                 2.20
                                         Bacillariophyta                                     16,644             3.10               30,564                 5.70
                                         Prymnesiophyceae                                    11,086             2.07                7,545                 1.41
                                         MAST                                                11,059             2.06               22,038                 4.11
                                         Oligohymenophorea                                   4,352              0.81               11,763                 2.18
                                         Spirotrichea                                        4,165              0.78               10.130                 1.89
                                         Others                                              46,151             8.60               45,332                 8.45
Picoeukaryotes                           MALV-II                                             97,736            21.29               55,159               12.01
                                         Radiolaria                                          80,770            17.59               13,944                 3.04
                                         MAST                                                49,047            10.68               97,377               21.21
                                         MALV-I                                              43,806             9.54               21,033                 4.58
                                         Dinophyceae                                         39,608             8.63               67,730               14.75
                                         Mamiellophyceae                                     38,181             8.32               16,474                 3.59
                                         Pelagophyceae                                       23,078             5.03               16,245                 3.54
                                         Chrysophyceae-Synurophyceae                         6,204              1.35                7,008                 1.53
                                         MOCH                                                5,631              1.23               10,805                 2.35
                                         Spirotrichea                                        4,317              0.94               21,157                 4.61
                                         Oligohymenophorea                                   3,012              0.66               16,198                 3.53
                                         Bacillariophyta                                     2,362              0.51               10,505                 2.29
                                         Others                                              52,378            11.41               68.805               14.98

The other category refers to groups with relatively lower sequence abundance.

Radiolaria was much more sequenced in DCM than in surface                           community structure. The unique environmental component
(Kruskal-Wallis test, p < 0.001) in DNA samples, increases of                       [E| KI + S] (by excluding the effects of KI and spatial
one order of magnitude occurred in DCM in stations such as                          components) explained the largest proportions of variance for
A7, K4, SEATS, and K8 (Figure 3A). Increases of one order                           both nano- and pico-eukaryotic communities (p < 0.05) with
of magnitude in DCM relative to surface also occurred to                            numerically larger proportions for picoeukaryotes. The effect of
RNA samples of Bacillariophyta and MAST in a few stations                           the unique KI component [KI| E + S] was only significant for
(Figure 3B). In picoeukaryotic samples, the distributions of                        nanoeukaryotes (p < 0.05), and the effect of the unique spatial
relative read abundance among classes were not as uneven as in                      component [S| E + KI] was only significant for RNA samples of
nanoeukaryotic samples, therefore some minor classes with large                     nanoeukaryotes (p < 0.05).
variations could dominate in a few stations. For example, the                          In contrast, NCM explained large fractions (71–81%)
relative DNA abundance of Radiolaria was up to 67.6 and 45.8%                       of variabilities in the occurrence of nanoeukaryotes and
in DCM of MKI stations A3 and A7; and the exceptional case for                      picoeukaryotes during the study period (Figure 5). The m
Dinophyceae was that it contributed 69.5% of RNA samples in                         value (immigration rate) was higher for nanoeukaryotes than
DCM of the MKI station D6.                                                          for picoeukaryotes. The NSTruzicka index showed that both
                                                                                    DNA and RNA samples of nanoeukaryotes were primarily
                                                                                    controlled by stochastic processes (average NSTruzicka = 59 and
Beta Diversity of Nano- and                                                         62%, respectively; there was no significant difference between
Pico-Eukaryotic Communities and                                                     DNA and RNA samples, Mann-Whitney U-test, p = 0.17),
Controlling Factors                                                                 while the value of 38% for DNA samples of picoeukayotes
PCoA analysis showed that the beta diversity of both nano- and                      indicated the dominance of deterministic processes (Figure 6;
pico-eukaryotic communities was mainly shaped by sampling                           difference between nano- and pico-eukaryotes was significant,
depths (Figure 4), and the surface and DCM samples were clearly                     Mann-Whitney U-test, p < 0.001). However, for RNA samples
separated on axis 1 while there was no apparent clustering on                       of picoeukaryotes in the DCM, deterministic processes were
axis 2. Moreover, a 3-way PERMANOVA was used to assess                              only marginally stronger than stochastic processes (average
the relative importance of environmental and spatial factors in                     NSTruzicka = 50.1%; difference between DNA and RNA samples
shaping eukaryotic communities (Table 2). The combined effect                       was significant, Mann-Whitney U-test, p < 0.001). The above
of three components could explain 27.3-41.5% of variances in                        results indicated that neutral processes (stochastic processes)

Frontiers in Marine Science | www.frontiersin.org                               7                                       August 2021 | Volume 8 | Article 658233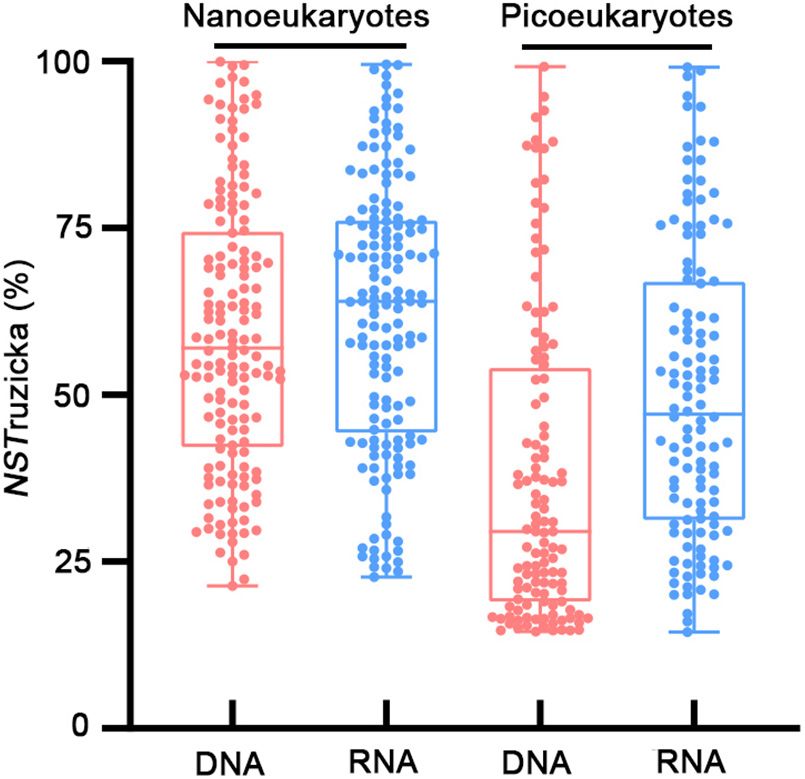
Wang et al.                                                                                                                      Nano- and Pico-Eukaryotes in NSCS

  FIGURE 4 | Principal coordinate analysis (PCoA) of nanoeukaryotes (A) and picoeukaryotes (B) in all samples based on the Bray-Curtis distance matrix. Red color:
  the surface samples; Blue color: the DCM samples.

played a critical role in shaping the eukaryotic communities                               Supplementary Table 3, Mann-Whitney U-test, p < 0.05). The
during the study period.                                                                   RNA: DNA ratios of four groups showed significant differences
                                                                                           between the surface and DCM (Figure 7D). The average RNA:
Variations in Relative Metabolic Activity                                                  DNA ratio of Radiolaria was slightly higher for the surface
of Nano- and Pico-Eukaryotes                                                               than for DCM (Mann-Whitney U-test, p < 0.05). In contrast,
PCA analysis was conducted on both the nano- and pico-                                     Dinophyceae, MAST, and Pelagophyceae showed significantly
eukaryotic groups. For nanoeukaryotes, four groups that showed                             higher average RNA: DNA ratios at the DCM than at the surface
large contributions to the total variation and RNA: DNA ratios                             (Mann-Whitney U-test, p < 0.05).
different from 1 were identified: Dinophyceae, Radiolaria, MAST,                               The relationships between the RNA: DNA ratios and the
and Bacillariophyta (Figure 7A). The average RNA: DNA ratios                               measured environmental factors (KI, salinity, water temperature,
of Bacillariophyta, MAST, and Radiolaria were significantly                                NO2 − + NO3 − , PO4 3− , SiO3 2− , and Chl a) were assessed. The
higher for the DCM samples than for the surface samples                                    RNA: DNA ratios of the nanoeukaryotic groups Dinophyceae
(Figure 7B, Mann-Whitney U-test, p < 0.05, Supplementary                                   and Radiolaria showed positive correlations with nutrients
Table 4). Following the same procedure, five groups of                                     but negative correlations with the Chl a concentration
picoeukaryotes were identified: Dinophyceae, Radiolaria,                                   (Figure 8A and Supplementary Figure 5), although the
MAST, Mamiellophyceae, and Pelagophyceae (Figure 7C and                                    correlation coefficients were small. The metabolic responses
                                                                                           of picoeukaryotes to environmental factors had roughly two
                                                                                           patterns (Figure 8B and Supplementary Figure 6). Dinophyceae,
TABLE 2 | Variation partitioning results showing the contribution of unique                MAST, and Pelagophyceae increased RNA: DNA ratios with
environmental [E| KI + S], unique KI [KI| E + S], and unique spatial [S| E + KI], as       salinity, nutrients, and Chl a concentration but decreased
well as combined environmental and KI [E∩KI], environmental and spatial [E∩S], KI          with water temperature. Meanwhile, RNA: DNA ratios of
and spatial [KI∩S], and all [ALL] component to the components of the nano- and             Mamiellophyceae and Radiolaria correlated negatively with
pico-eukaryotic communities inferred from DNA and RNA approaches.
                                                                                           nutrients and salinity but positively with water temperature.
                                  Variance explained (%)

       [E|KI + S]    [KI|E + S]     [S|E + KI]    [E∩KI]    [E∩S]    [KI∩S]   [ALL]        DISCUSSION
Nano-eukaryotes
DNA       29.6*          7.9*          3.7          32.6*   28.5*     6.7     36.3*        Nano- and Pico-Eukaryotic Community
RNA       17.9*          4.5*          6.9*         20.4*   22.8*     9.4*    27.3*        Structure in the NSCS During the Study
Pico-eukaryotes                                                                            Period
DNA       32.0*          5.7           3.2          38.3*   35.8*     9.5*    41.5*
                                                                                           In our study, the high rate of assignment for nano- and
RNA       25.6*          1.7           0.0          33.6*   31.4*     7.5     33.1*
                                                                                           pico-eukaryotes could be that many assignments have low
The bold font and asterisk indicate significant level at p < 0.05.                         taxonomic ranks (e.g., only to “Eukaryota”). Dinophyceae was

Frontiers in Marine Science | www.frontiersin.org                                      8                                     August 2021 | Volume 8 | Article 658233
Wang et al. Nano- and Pico-Eukaryotes in NSCS
FIGURE 5 | The neutral community model based on the relationship between OTU occurrence and relative read abundance. OTUs with higher frequency than
predicted by the model are shown in red, while those with lower frequency are shown in green. OTUs within the predicted range are displayed in black. The dotted
line represents the 95% confidence interval (blue dotted line) around the model prediction.
the dominant nanoeukaryotic group and the most diverse The MALV-I and II groups accounted for a significant
picoeukaryotic group at all sampling sites (Figures 2, 3 and proportion of the picoeukaryotic relative read abundance in
Table 1). Previous studies have revealed that many dinoflagellates the DNA survey. However, their relative read abundance
were mixotrophic (Stoecker, 1999; Jeong et al., 2004), and the
mixotrophic species could consume a wide variety of prey items
(Seong et al., 2006; Park et al., 2006; Berge et al., 2008; Glibert
et al., 2009). The most sequenced nanoeukaryotic OTU was
G. aureolum, a common bloom-forming species in temperate
waters that was first described by Hulburt (1957). G. aureolum
contains a horseshoe-shaped apical groove, a nuclear fibrous
connective (NFC), and nuclear chambers (Jeong et al., 2010).
Jeong et al. (2010) have shown that G. aureolum is a mixotrophic
dinoflagellate that feeds on Synechococcus, heterotrophic bacteria,
and some algal species. The Dinophyceae A. sanguinea (OTU2)
was the dominant nanoeukaryotic species in the DCM layer of
station 2A1, which was located close to the Pearl River Estuary.
A. sanguinea is also a common bloom-forming species with a
wide distribution, including the Black Sea (Gómez and Boicenco,
2004), the coast of Hong Kong (Lu and Hodgkiss, 2004), the
South Sea off the coast of South Korea (Lim et al., 2008), and
the Ariake Sea off the coast of Japan (Katano et al., 2011).
Large-scale blooms of A. sanguinea have been reported to be a
FIGURE 6 | Normalized stochasticity test values for the Ruzicka index
significant threat to seabirds, fish, and shellfish (Jessup et al., 2009; (NSTruzicka ).
Reis-Filho et al., 2012).
Frontiers in Marine Science | www.frontiersin.org 9 August 2021 | Volume 8 | Article 658233Wang et al. Nano- and Pico-Eukaryotes in NSCS FIGURE 7 | Principal component analysis (PCA) showed the distribution pattern of nano- (A) and pico-eukaryotic (C) major groups (mainly at class level) in combined DNA and RNA samples. Range of RNA: DNA ratios of the major groups of nano- (B) and pico-eukaryotes (D) at surface and DCM layers. Mam: Mamiellophyceae; Pel: Pelagophyceae; Rad: Radiolaria; Dino: Dionophyceae; Baci: Bacillariophyta. The asterisk indicates significant level at p < 0.05. decreased largely in the RNA survey. Most species in the and II groups were overrepresented in the DNA survey for MALV-I and II groups have been characterized as parasites in all size fractions of eukaryotes in European coastal waters a range of hosts (Bachvaroff et al., 2012). Similarly, the most and they attributed this phenomenon to higher rDNA gene sequenced OTU of picoeukaryotes was Radiolaria A. hexagonalis copy numbers of these two groups than other eukaryotes. (OTU_5), accounting for 8.5% of total DNA sequences, but Overall, it is likely that the DNA survey overestimated the decreased sharply to 0.5% in the RNA survey. The different relative read abundance of Radiolaria, MALV-I, and MALV- results between DNA and RNA surveys and the underlying II, while underestimated that of MAST, Pelagophyceae, and reasons have been extensively discussed. Sample collection Dinophyceae (Figure 3D). MAST is a remarkably diverse by the size-fractionated filtration may introduce artifacts, for group of uncultured species (Massana et al., 2014). MASTs example, cell breakage and fragments may go through filters are heterotrophic flagellates preying on bacteria (Lin et al., and be retained in smaller size fractions (Massana et al., 2012). They are widely distributed in the temperate and 2015). The Radiolaria A. hexagonalis is supposed to be an tropical oceans and supposed to play an important role in organism with the diameter of 150 µm (Haeckel, 1887). Its the microbial food web (Seeleuthner et al., 2018). The RNA DNA sequences appearing in a smaller fraction may represent survey found the average relative read abundance of 21.4% dead individuals or swarmer cells for reproduction (Li and belonged to the MAST group relative to only 10.3% by the Endo, 2020). In addition, high rDNA gene copy numbers of DNA survey (Figure 3). This large bias reinforced the argument some species may cause them to be overrepresented in DNA that the RNA survey is a more reliable method than the samples. Massana et al. (2015) also reported that the MALV-I DNA survey to investigate the eukaryotic community structure Frontiers in Marine Science | www.frontiersin.org 10 August 2021 | Volume 8 | Article 658233
Wang et al.                                                                                                                                   Nano- and Pico-Eukaryotes in NSCS

  FIGURE 8 | Heatmaps of correlation matrix (spearman correlation) of the RNA: DNA ratio versus environmental factors for major groups of nanoeukaryotes (A) and
  picoeukaryotes (B), including Bacillariophyta (Baci), Dinophyceae (Dino), Mamiellophyceae (Mami), MAST, Pelagophyceae (Pela), and Radiolaria (Radi). Environmental
  factors include Kuroshio intrusion (KI), salinity (Sal.), water temperature (Temp.), nitrate + nitrite (N), phosphate (P), silicate (Si), and chlorophyll a concentration (Chl a).
  Numbers are the correlation coefficients, background colors (from dark red to white) indicate significance levels associated to the p values (0.001, 0.01, 0.05) and no
  significance.

(Massana et al., 2015). The RNA-based results showing the                                     OTUs are clusters. In spite of deficiencies, filtration is the
abundant MAST reflected active functions of the microbial food                                most feasible way to study diversity for size characteristics
web in the NSCS.                                                                              of plankton, and the method did reveal distinctness of size
    In contrast, the DNA and RNA surveys reported roughly                                     classes in terms of relative abundance of OTUs (Table 1 and
the same community structure for nanoeukaryotes in this                                       Figure 3). Besides, BLAST identifies sequences with the top-
study (Figure 3). However, we should not interpret this                                       hit taxon in the reference database which cannot guarantee
consistency as an indication of that the DNA survey did not                                   the most accurate result because in fact there always have a
obscure the results with artifacts. The consistency between the                               series of hits with good scores; although BLAST is the common
DNA and RNA samples happened at the group level where                                         method, more robust methods for taxonomic annotation shall be
Dinophyceae dominated supremely. But differences emerged                                      further considered.
at the OTU level, for example, A. sanguinea (OTU2) at
the DCM layer of station 2A1 occupied 68.2% of RNA
sequences relative to 32.7% of DNA sequences. The findings
                                                                                              Differences in Mechanisms Shaping the
emphasized again the necessity to conduct the RNA survey                                      Community Structure of Nano- and
to tackle with the technical issues of the DNA survey                                         Pico-Eukaryotes in the NSCS
(Massana et al., 2015).                                                                       Environmental filtering played an important role in shaping
    Filters may collect material belonging to species from                                    the community structure of both nano- and pico-eukaryotes
other size fractions. We found many pairs of OTUs with                                        (Table 2). Phytoplankton growth in the NSCS is limited by
identical sequences between the nano- and pico-eukaryotes. This                               nitrogen in the open water and phosphate and silicate in the river
phenomenon has long been an issue for analyzing plankton                                      water influenced area (Yin et al., 2000, 2001). During the season
samples (de Vargas et al., 2015; Massana et al., 2015). de Vargas                             when the study was conducted, the monsoon winds were too
et al. (2015) reported that 64% of all OTUs spanned two or                                    weak to break down water-column stratification, which prevents
more size classes and Massana et al. (2015) even found 32–                                    nutrients reentering the surface. Then, nutrients at the surface
55% of picoeukaryotic OTUs and 20–41% of nanoeukaryotic                                       layer were depleted by light-saturated photosynthesis while
OTUs in filtrate passed through a 0.8 µm-pore-size membrane                                   nutrients at the DCM layer were abundant due to light limitation
filter. We found a significant proportion of shared OTUs were                                 on nutrient uptake. Therefore, the community structure at the
MALV-II and MALV-I (also known as Syndiniales). Syndiniales                                   DCM layer was distinct from that at the surface layer because of
are marine parasites that infect hosts from protists to fish,                                 the combined effects of photoadaptation and elevated nutrients,
they could be detected in the pico-sized fraction because they                                and decreased water temperature might play a role as well.
produce small, flagellated cells (dinospores) to infect new hosts                             Thus, it was not surprising that depth was the governing factor
(Guillou et al., 2008; Siano et al., 2011). Moreover, identical                               of the beta diversity (Countway et al., 2010; Wu et al., 2017a;
sequences do not essentially indicate identical species because                               Giner et al., 2020).

Frontiers in Marine Science | www.frontiersin.org                                        11                                               August 2021 | Volume 8 | Article 658233
Wang et al. Nano- and Pico-Eukaryotes in NSCS
However, most of the variation in community structure metabolic activities, which, however, could be assessed by the
were explained by neutral processes (Figures 5, 6), which relative changes of the RNA: DNA ratio between sampling
was consistent with previous studies (Sloan et al., 2006). sites (Hu et al., 2016). For example, a previous study in
Furthermore, the NSTruzicka was higher for nanoeukaryotes the northwestern Pacific Ocean reported different relative
than for picoeukaryotes, and the VPA results also indicated metabolic activities of Mamiellophyceae for different nutrient
that nanoeukaryotes were subject to dispersal limitation regimes (Wang et al., 2019). In this study, Mamiellophyceae
while picoeukaryotes were not (Table 2). The latter was also showed lower RNA: DNA ratios with increased nutrients
consistent with a previous study which suggested increasing (Figure 8B). Dinophyceae and MAST showed significantly
dispersal limitation with cell size (de Vargas et al., 2015). higher RNA: DNA ratios at the DCM layers than at the
Neutral community theory explains the species of a surface layers (Figure 7B), which was consistent with a previous
local community as a sample of the meta community study in the South China Sea (Xu et al., 2017). That study
regulated by immigration and extinction at the local level, reported that Dinophyceae, MALV-I, and MALV-II had the
therefore dissimilarities between local communities will be a highest relative metabolic activities in middle layers (200,
function of the geographical distance (namely the dispersal 300, and 500 m), followed by deep layers (1,000, 1,500,
limitation). The NCM displayed that the immigration rate 2,000, and 3,900 m) and shallow layers (5, 25, and 75 m).
for nanoeukaryotes was no less than that for picoeukaryotes Our analysis indicated that the relative metabolic activities of
(Figure 5). However, the number of individuals for the Dinophyceae and MAST increased with nutrients and the Chl a
same amount of carbon biomass decreases with cell size, concentration (Figure 8).
then the possibility of extinction at the local level will be In contrast, the correlations between the metabolic activities
higher for nanoeukaryotes than for picoeukaryotes, then of nanoeukaryotes and environmental factors were not
the dispersal limitation might be explained. Ecological drift apparent (Figure 8). Nanophytoplankton were expected to
might be another mechanism accounting for the diversity have lower nutrient affinity than picophytoplankton, therefore
of nanoeukaryotic community in this study. Ecological nanophytoplankton would show larger changes of the relative
drift is stochastic changes in population resulted from metabolic activities than picophytoplankton for the ranges
equal chances of individuals to reproduce or die. Ecological of nutrients in this study. However, our results contradicted
drift drifts community composition from expectations this expectation. The metabolic activities of nanoeukaryotes
of environmental filtering (Vellend, 2010). In this study, might change parallelly, thus the changes were not reflected
Dinophycease dominated the nanoeukaryotic communities by the relative values. The relatively stable RNA: DNA ratios
by contributing two-thirds of the relative read abundance might account partially for the dominance of nanoeukaryotic
(Figures 3A,B), which might limit other taxa from establishing Dinophyceae at all sampling sites (Figure 7B), but the underlying
their population, leading to high similarity between local mechanism was not clear.
nanoeukaryotic communities.
The Kuroshio intrusion is supposed to mainly affect the
eastern NSCS. However, Figure 1B shows the geostrophic
currents in the NSCS in early May 2016 (a week before the CONCLUSION
cruise), which flowed into the NSCS through the northern
Luzon Strait, and generated a westward branch at approximately In the NSCS during the study period, Dinophyceae was the
21◦ N. The current reached approximately 114◦ E and 20◦ N. most diverse and sequenced nanoeukaryotic group revealed
Therefore, substantial fractions of Kuroshio water were found by both DNA and RNA surveys. In contrast, the relative read
in the middle of the NSCS (Figure 1A). The VPA analysis abundance of MAST, Pelagophyceae, and Dinophyceae in the
showed that variations in the nanoeukaryotic community size fraction of picoeukaryotes might be largely underestimated
structure could be partially explained by the KI index. The by the DNA survey. Environmental filtering played an important
reason could be different activities of archaea and bacteria role in shaping the community structure, and the sampling
that was reported by Xu et al. (2018). That study showed depth became the governing factor of the beta diversity
distinctly higher ammonia oxidation rates by archaea and under the environmental setting of stratification during
bacteria in the MKI stations than in the LKI stations. the study period. The spatial variations in the diversity of
Ammonia-oxidizing archaea and bacteria were dependent on nanoeukaryotes were subject to the dispersal limitation under
dissolved organic matter, which was proportional to the faction the size rule. The effects of the Kuroshio intrusion on the
of Kuroshio water. nanoeukaryotic community structure might also be explained
by the dispersal limitation. Overall, neutral processes are
critical in shaping the community structure of nanoeukaryotes.
Relative Metabolic Activities in Relation The relative metabolic activities of nanoeukaryotes were
to Community Structure relatively stable in accordance with the high similarity of
Some argued that the discrepancy between the DNA and community structure between sampling sites. The responses
RNA surveys was mainly due to high rDNA copy numbers of the relative metabolic activities of picoeukaryotes to
of some species or dead cells and did not reflect the environmental factors displayed two distinct patterns. Our
Frontiers in Marine Science | www.frontiersin.org 12 August 2021 | Volume 8 | Article 658233Wang et al. Nano- and Pico-Eukaryotes in NSCS
findings improved the understanding of the nano- and pico- East Pacific Ocean (No. DY135-E2-5-5), and the study was
eukaryotic communities in the NSCS and the mechanisms also partially supported by NSFC (No. 41890803) and Xiamen
of their assembly. University Presidential Fund (20720180102).
DATA AVAILABILITY STATEMENT ACKNOWLEDGMENTS
The data presented in the study are deposited in the We thank JianYu Hu for providing the CTD data and Minhan
GenBank Sequence Read Archive repository, accession number Dai for proving the nutrient data. The nutrients concentration
PRJNA684778, https://www.ncbi.nlm.nih.gov/. data could be acquired from the supporting information of Xu
et al. (2018). This study also benefited from the discussion with
Wenxue Wu at Sun Yat-sen University, and Lizhen Lin, Jixin
AUTHOR CONTRIBUTIONS Chen, and Heng Zhu at Xiamen University for their assistances
FW, YX, and BH designed the experiments. FW carried out in phytoplankton sample collections and analyses. We thank
the experiments and wrote the manuscript. SC helped analyze NSFC Shiptime Sharing Project for supporting the cruises by R/V
the data. YX and BH provided critical feedback and revised the Dongfanghong 2 (No. NORC2015-05), and we also acknowledge
manuscript. XW and JM helped analyze the data and revised the captains and crew for their cooperation during the cruise. We
manuscript. All authors contributed to the article and approved truly thank two reviewers whose comments helped to improve
the submitted version. and clarify this manuscript.
FUNDING SUPPLEMENTARY MATERIAL
This work was supported by grants from the National Natural The Supplementary Material for this article can be found
Science Foundation of China (Nos. U1805241 and 41776146), online at: https://www.frontiersin.org/articles/10.3389/fmars.
Monitoring and Protection of Ecology and Environment in the 2021.658233/full#supplementary-material
REFERENCES community sequencing data. Nat. Methods 7, 335–336. doi: 10.1038/nmeth.f.
303
Adl, S. M., Bass, D., Lane, C. E., Lukeš, J., Schoch, C. L., Smirnov, A., et al. (2019). Caron, D. A., Alexander, H., Allen, A. E., Archibald, J. M., Armbrust, E. V., Bachy,
Revisions to the classification, nomenclature, and diversity of eukaryotes. C., et al. (2016). Probing the evolution, ecology and physiology of marine
J. Eukaryot. Microbiol. 66, 4–119. doi: 10.1111/jeu.12691 protists using transcriptomics. Nat. Rev. Microbiol. 15, 6–20. doi: 10.1038/
Altschul, S. F., Gish, W., Miller, W., Myers, E. W., and Lipman, D. J. (1990). Basic nrmicro.2016.160
local alignment search tool. J. Mol. Biol. 215, 403–410. doi: 10.1016/S0022- Caron, D. A., Countway, P. D., Jones, A. C., Kim, D. Y., and Schnetzer, A. (2012).
2836(05)80360-2 Marine protistan diversity. Annu. Rev. Mar. Sci. 4, 467–493.
Amaral-Zettler, L. A., Mccliment, E. A., Ducklow, H. W., and Huse, S. M. (2009). Chen, W. D., Pan, Y. B., Yu, L. Y., Yang, J., and Zhang, W. J. (2017). Patterns and
A method for studying protistan diversity using massively parallel sequencing processes in marine microeukaryotic community biogeography from Xiamen
of v9 hypervariable regions of small-subunit ribosomal RNA genes. PLoS One coastal waters and intertidal sediments, Southeast China. Front. Microbiol.
4:e6372. doi: 10.1371/journal.pone.0006372 8:1912. doi: 10.3389/fmicb.2017.01912
Bachvaroff, T. R., Kim, S., Guillou, L., Delwiche, C. F., and Coats, D. W. (2012). Countway, P. D., Gast, R. J., Dennett, M. R., Savai, P., Rose, J. M., and Caron, D. A.
Molecular diversity of the syndinean genus Euduboscquella based on single-cell (2010). Distinct protistan assemblages characterize the euphotic zone and deep
PCR analysis. Appl. Environ. Microbiol. 78, 334–345. doi: 10.1128/aem.06678- sea (2500 m) of the western north Atlantic (Aargasso Sea and Gulf Stream).
11 Environ. Microbiol. 9, 1219–1232. doi: 10.1111/j.1462-2920.2007.01243.x
Bahram, M., Kohout, P., Anslan, S., Harend, H., Abarenkov, K., and Tedersoo, de Vargas, C., Audic, S., Henry, N., Decelle, J., Mahé, F., Logares, R., et al. (2015).
L. (2016). Stochastic distribution of small soil eukaryotes resulting from high Eukaryotic plankton diversity in the sunlit ocean. Science 348:1261605. doi:
dispersal and drift in a local environment. ISME J. 10, 885–896. doi: 10.1038/ 10.1126/science.1261605
ismej.2015.164 Du, C., Liu, Z., Dai, M., Kao, S. J., and Li, Y. (2013). Impact of the Kuroshio
Barton, A. D., Pershing, A. J., Litchman, E., Record, N. R., Edwards, K. F., Kiørboe, intrusion on the nutrient inventory in the upper northern South China Sea:
T., et al. (2013). The biogeography of marine plankton traits. Ecol. Lett. 16, insights from an isopycnal mixing model. Biogeosciences 10, 6419–6432. doi:
522–534. doi: 10.1111/ele.12063 10.5194/bg-10-6419-2013
Berge, T., Hansen, P. J., and Moestrup, Ø (2008). Prey size spectrum and Edgar, R. C. (2013). UPARSE: highly accurate OTU sequences from microbial
bioenergetics of the mixotrophic dinoflagellate Karlodinium armiger. Aquat. amplicon reads. Nat. Methods 10, 996–998. doi: 10.1038/NMETH.2604
Microb. Ecol. 50, 289–299. doi: 10.3354/ame01166 Edgar, R. C., Haas, B. J., Clemente, J. C., Quince, C., and Knight, R. (2011).
Blazewicz, S. J., Barnard, R. L., Daly, R. A., and Firestone, M. K. (2013). UCHIME improves sensitivity and speed of chimera detection. Bioinformatics
Evaluating rRNA as an indicator of microbial activity in environmental 27, 2194–2200. doi: 10.1093/bioinformatics/btr381
communities: limitations and uses. ISME J. 7, 2061–2068. doi: 10.1038/ismej.20 Edgcomb, V., Orsi, W., Bunge, J., Jeon, S., Christen, R., Leslin, C., et al.
13.102 (2011). Protistan microbial observatory in the Cariaco Basin, Caribbean. I.
Borcard, D., Legendre, P., and Drapeau, P. (1992). Partialling out the spatial Pyrosequencing vs Sanger insights into species richness. ISME J. 5, 1344–1356.
component of ecological variation. Ecology 73, 1045–1055. doi: 10.2307/ doi: 10.1038/ismej.2011.6
1940179 Giner, C. R., Pernice, M. C., Balagué, V., Duarte, C. M., and Massana, R. (2020).
Caporaso, J. G., Kuczynski, J., Stombaugh, J., Bittinger, K., Bushman, F. D., Marked changes in diversity and relative activity of picoeukaryotes with depth
Costello, E. K., et al. (2010). QIIME allows analysis of high-throughput in the world ocean. ISME J. 14, 437–449. doi: 10.1038/s41396-019-0506-9
Frontiers in Marine Science | www.frontiersin.org 13 August 2021 | Volume 8 | Article 658233Wang et al. Nano- and Pico-Eukaryotes in NSCS
Glibert, P. M., Burkholder, J. M., Kana, T. M., Alexander, J., Skelton, H., and Lin, Y., Campbell, T., Chung, C., Gong, G., Chiang, K., and Worden, A. (2012).
Shilling, C. (2009). Grazing by Karenia brevis on Synechococcus enhances its Distribution patterns and phylogeny of marine stramenopiles in the north
growth rate and may help to sustain blooms. Aquat. Microb. Ecol. 55, 17–30. Pacific Ocean. Appl. Environ. Microbiol. 78, 3387–99. doi: 10.1128/AEM.06952-
doi: 10.3354/ame01279 11
Gómez, F., and Boicenco, F. (2004). An annotated checklist of dinoflagellates in the Liu, J., Meng, Z., Liu, X., and Zhang, X. (2019). Microbial assembly, interaction,
Black Sea. Hydrobiologia 517, 43–59. doi: 10.1023/B:HYDR.0000027336.05452. functioning, activity and diversification: a review derived from community
07 compositional data. Mar. Life Sci. Technol. 1, 112–128. doi: 10.1007/s42995-
Grob, C., Ulloa, O., Li, W., Alarcón, G., Fukasawa, M., and Watanabe, S. 019-00004-3
(2007). Picoplankton abundance and biomass across the eastern South Pacific Liu, K., Chao, S., Shaw, P., Gong, G., Chen, C., and Tang, T. (2002). Monsoon-
Ocean along latitude 32.5◦ S. Mar. Ecol. Prog. Ser. 332, 53–62. doi: 10.3354/ forced chlorophyll distribution and primary production in the South China Sea:
meps332053 observations and a numerical study. Deep-Sea Res. I Oceanogr. 49, 1387–1412.
Guillou, L., Viprey, M., Chambouvet, A., Welsh, R. M., Kirkham, A. R., Massana, doi: 10.1016/S0967-0637(02)00035-3
R., et al. (2008). Widespread occurrence and genetic diversity of marine Logares, R., Lindström, E. S., Langenheder, S., Logue, J. B., Paterson, H., Laybourn-
parasitoids belonging to Syndiniales (Alveolata). Environ. Microbiol. 10, 3349– Parry, J., et al. (2013). Biogeography of bacterial communities exposed to
3365. doi: 10.1111/j.1462-2920.2008.01731.x progressive long-term environmental change. ISME J. 7, 937–948. doi: 10.1038/
Haeckel, E. (1887). “Report on the radiolaria collected by H.M.S. Challenger during ismej.2012.168
the years 1873–1876. pp. i–viii [=1–8], i–clxxxviii [=1–188], 1–1803,” in Report Lu, S. H., and Hodgkiss, I. J. (2004). Harmful algal bloom causative collected
of the Scientific Results of the Voyage of H.M.S. Challenger During the Years from Hong Kong waters. Hydrobiologia 512, 231–238. doi: 10.1023/B:HYDR.
1873–1876 Under the Com-mand of Captain George S. Nares and Captain Frank 0000020331.75003.18
Tourle Thomson, Zoology. vol. XVIII [=18]., eds Thomson, C. W. and J. Murray Lu, Y., Wen, Z., Shi, D., Lin, W., Bonnet, S., Dai, M., et al. (2019). Biogeography of
(London, Edinburgh, Dublin), 1–140. N2 fixation influenced by the western boundary current intrusion in the South
Hartmann, M., Grob, C., Tarran, G. A., Martin, A. P., Burkill, P. H., Scanlan, D. J., China Sea. J Geophys. Res. Ocean 124, 6983–6996. doi: 10.1029/2018JC014781
et al. (2012). Mixotrophic basis of Atlantic oligotrophic ecosystems. Proc. Natl. Massana, R., del Campo, J., Sieracki, M. E., Audic, S., and Logares, R. (2014).
Acad. Sci. U. S. A. 109, 5756–5760. doi: 10.1073/pnas.1118179109 Exploring the uncultured microeukaryote majority in the oceans: reevaluation
Hu, S. K., Campbell, V., Connell, P., Gellene, A. G., Liu, Z., Terrado, R., et al. (2016). of ribogroups within stramenopiles. ISME J. 8, 854–866. doi: 10.1038/ismej.
Protistan diversity and activity inferred from RNA and DNA at a coastal site in 2013.204
the eastern North Pacific. FEMS Microbiol. Ecol. 92:fiw050. doi: 10.1093/femsec/ Massana, R., Gobet, A., Audic, S., Bass, D., Bittner, L., Boutte, C., et al. (2015).
fiw050 Marine protist diversity in European coastal waters and sediments as revealed
Huang, Y., Laws, E., Chen, B., and Huang, B. (2019). Stimulation of heterotrophic by high-throughput sequencing. Environ. Microbiol. 17, 4035–4049. doi: 10.
and autotrophic metabolism in the mixing zone of the Kuroshio Current and 1111/1462-2920.12955
northern South China Sea: implications for export production. J. Geophys. Res. Massana, R., Unrein, F., Rodriguez-Martinez, R., Forn, I., Lefort, T., Pinhassi, J.,
Biogeo. 124, 2645–2661. doi: 10.1029/2018JG004833 et al. (2009). Grazing rates and functional diversity of uncultured heterotrophic
Hubbell, S. P. (2011). The Unified Neutral Theory of Biodiversity and Biogeography flagellates. ISME. J. 3, 588–596. doi: 10.1038/ismej.2008.130
(MPB-32). Princeton: Princeton University Press. McArdle, B. H., and Anderson, M. J. (2001). Fitting multivariate models to
Hulburt, E. M. (1957). The taxonomy of unarmored Dinophyceae of shallow community data: a comment on distance-based redundancy analysis. Ecology
embayments on Cape Cod, Massachusetts. Biol. Bull. 112, 196–219. doi: 10. 82, 290–297. doi: 10.2307/2680104
2307/1539198 Nan, F., Xue, H., and Yu, F. (2015). Kuroshio intrusion into the South China Sea: a
Jardillier, L., Zubkov, M. V., Pearman, J., and Scanlan, D. J. (2010). Significant CO2 review. Prog. Oceangr. 137, 314–333. doi: 10.1016/j.pocean.2014.05.012
fixation by small prymnesiophytes in the subtropical and tropical northeast Ning, D., Deng, Y., Tiedje, J. M., and Zhou, J. (2019). A general framework for
Atlantic Ocean. ISME J. 4, 1180–1192. doi: 10.1038/ismej.2010.36 quantitatively assessing ecological stochasticity. Proc. Natl. Acad. Sci. U. S. A.
Jeong, H. J., Yoo, Y. D., Kang, N. S., Rho, J. R., Seong, K. A., Park, J. W., et al. (2010). 116, 16892–16898. doi: 10.1073/pnas.1904623116
Feeding by red-tide dinoflagellate Gymnodinium aureolum from the western Not, F., del Campo, J., Balagué, V., de Vargas, C., and Massana, R. (2009). New
Korean waters. Aquat. Microb. Ecol. 59, 239–255. insights into the diversity of marine picoeukaryotes. PLoS One 4:e7143. doi:
Jeong, H. J., Yoo, Y. D., Kim, J. S., Kim, T. H., Kim, J. H., Kang, N. S., et al. (2004). 10.1371/journal.pone.0007143
Mixotrophy in the phototrophic harmful alga Cochlodinium polykrikoides Park, M. G., Kim, S. J., Kim, H. S., Myung, G. O., Kang, Y. G., and Yih, W. H. (2006).
(Dinophycean): prey species, the effects of prey concentration and grazing First successful culture of the marine dinoflagellate Dinophysis acuminata.
impact. J. Eukaryot. Microbiol. 51, 563–569. doi: 10.1111/j.1550-7408.2004. Aquat. Microb. Ecol. 45, 101–106. doi: 10.1007/BF00407285
tb00292.x Parris, D. J., Ganesh, S., Edgcomb, V. P., DeLong, E. F., and Stewart, F. J. (2014).
Jessup, D. A., Miller, M. A., Ryan, J. P., Nevins, H. M., Kerkering, H. A., Microbial eukaryote diversity in the marine oxygen minimum zone off northern
Mekebri, A., et al. (2009). Mass stranding of marine birds caused by a Chile. Front. Microbiol. 5:543. doi: 10.3389/fmicb.2014.00543
surfactant-producing red tide. PLoS One 4:e4550. doi: 10.1371/journal.pone.000 Piwosz, K., Całkiewicz, J., Goł˛ebiewski, M., and Creer, S. (2018). Diversity and
4550 community composition of pico- and nanoplanktonic protists in the Vistula
Katano, T., Yoshida, M., Yamaguchi, S., Hamada, T., Yoshino, K., and Hayami, Y. River estuary (Gulf of Gdańsk, Baltic Sea). Estuar. Coast. Shelf Sci. 207, 242–249.
(2011). Diel vertical migration and cell division of bloom-forming dinoflagellate doi: 10.1016/j.ecss.2018.04.013
Akashiwo sanguinea in the Ariake Sea, Japan. Plankton Benthos. Res. 6, 92–100. Piwosz, K., Spich, K., Całkiewicz, J., Weydmann, A., Kubiszyn, A. M., and Wiktor,
doi: 10.3800/pbr.6.92 J. M. (2015). Distribution of small phytoflagellates along an Arctic fjord
Leblanc, K., Quéguiner, B., Diaz, F., Cornet, V., Michel-Rodriguez, M., Xavier, transect. Environ. Microbiol. 17, 2393–2406. doi: 10.1111/1462-2920.12705
D. D. M., et al. (2018). Nanoplanktonic diatoms are globally overlooked but Quast, C., Pruesse, E., Yilmaz, P., Gerken, J., Schweer, T., Yarza, P., et al. (2013). The
play a role in spring blooms and carbon export. Nat. Commun. 9:953. SILVA ribosomal RNA gene database project: improved data processing and
Li, L., and Endo, K. (2020). Phylogenetic positions of “pico-sized” radiolarians web-based tools. Nucleic Acids Res. 41, D590–D596. doi: 10.1093/nar/gks1219
from middle layer waters of the tropical Pacific. Prog. Earth. Planet. Sci. 7:70. R Core Team. (2014). R: a Language and Environment For Statistical Computing.
doi: 10.1186/s40645-020-00384-6 Vienna: R Foundation for Statistical Computing.
Li, P., Li, W., Dumbrell, A. J., Liu, M., Li, G., Wu, M., et al. (2020). Spatial variation Rachik, S., Christaki, U., Li, L. L., Genitsaris, S., Breton, E., and Monchy, S. (2018).
in soil fungal communities across paddy fields in subtropical China. mSystems Diversity and potential activity patterns of planktonic eukaryotic microbes in a
5, e00704–19. doi: 10.1128/mSystems.00704-19 mesoeutrophic coastal area (eastern English Channel). PLoS One 13:e0196987.
Lim, W. A., Lee, Y. S., and Lee, S. G. (2008). Characteristic of environmental factors doi: 10.1371/journal.pone.0196987
related to outbreak and decline of Cochlodinium polykrikoides bloom in the Ramond, P., Sourisseau, M., Simon, N., Romac, S., Schmitt, S., Rigaut-Jalabert, F.,
southeast coastal waters of Korea, 2007. J. Korean Soc. Oceanogr. 13, 325–332. et al. (2019). Coupling between taxonomic and functional diversity in protistan
Frontiers in Marine Science | www.frontiersin.org 14 August 2021 | Volume 8 | Article 658233You can also read


