Repeated Vessel Interactions and Climate- or Fishery-Driven Changes in Prey Density Limit Energy Acquisition by Foraging Blue Whales - cebc
←
→
Page content transcription
If your browser does not render page correctly, please read the page content below
ORIGINAL RESEARCH
                                                                                                                                         published: 03 August 2020
                                                                                                                                    doi: 10.3389/fmars.2020.00626

                                            Repeated Vessel Interactions and
                                            Climate- or Fishery-Driven Changes
                                            in Prey Density Limit Energy
                                            Acquisition by Foraging Blue Whales
                                            Marie Guilpin 1,2* , Véronique Lesage 1 , Ian McQuinn 1 , Pablo Brosset 1 ,
                                            Thomas Doniol-Valcroze 3 , Tiphaine Jeanniard-du-Dot 4 and Gesche Winkler 2
                                            1
                                             Maurice Lamontagne Institute, Fisheries and Oceans Canada, Mont-Joli, QC, Canada, 2 Institut des Sciences de la Mer
                                            de Rimouski, Québec-Océan – Université du Québec à Rimouski, Rimouski, QC, Canada, 3 Pacific Biological Station,
                                            Fisheries and Oceans Canada, Nanaimo, BC, Canada, 4 Centre d’Etudes Biologiques de Chizé, UMR 7372 CNRS –
                                            Université de la Rochelle, Villiers-en-Bois, France

                                            Blue whale survival and fitness are highly contingent on successful food intake during
                                            an intense feeding season. Factors affecting time spent at the surface or at depth in a
                                            prey patch are likely to alter foraging effort, net energy gain, and fitness. We specifically
                           Edited by:       examined the energetic consequences of a demonstrated reduction in dive duration
                    Rebecca Dunlop,
        The University of Queensland,
                                            caused by vessel proximity, and of krill density reductions potentially resulting from krill
                             Australia      exploitation or climate change. We estimated net energy gain over a simulated 10-
                         Reviewed by:       h foraging bout under baseline conditions, and three scenarios, reflecting krill density
                   Elizabeth McHuron,
                                            reductions, vessel interactions of different amplitudes, and their combined effects.
   University of California, Santa Cruz,
                           United States    Generally, the magnitude of the effects increased with that of krill density reductions
                          Gail Schofield,   and duration of vessel proximity. They were also smaller when peak densities were
    Queen Mary University of London,
                        United Kingdom
                                            more accessible, i.e., nearer to the surface. Effect size from a reduction in krill density
                  *Correspondence:
                                            on net energy gain were deemed small to moderate at 5% krill reduction, moderate
                         Marie Guilpin      to large at 10% reduction, and large at 25 and 50% reductions. Vessels reduced
              marieguilpin@gmail.com
                                            cumulated net energy gain by as much as 25% when in proximity for 3 of a 10-h
                    Specialty section:
                                            daylight foraging period, and by up to 47–85% when continuously present for 10 h.
          This article was submitted to     The impacts of vessel proximity on net energy gain increased with their duration. They
                     Marine Megafauna,
                                            were more important when whales were precluded from reaching the most beneficial
                a section of the journal
           Frontiers in Marine Science      peak densities, and when these densities were located at deeper depths. When krill
            Received: 14 May 2020           densities were decreased by 5% or more, disturbing foraging blue whales for 3 h could
            Accepted: 08 July 2020          reduce their net energy gain by ≥30%. For this endangered western North Atlantic blue
          Published: 03 August 2020
                                            whale population, a decrease in net energy gain through an altered krill preyscape or
                            Citation:
     Guilpin M, Lesage V, McQuinn I,
                                            repeated vessel interactions is of particular concern, as this species relies on a relatively
         Brosset P, Doniol-Valcroze T,      short feeding season to accumulate energy reserves and to fuel reproduction. This
   Jeanniard-du-Dot T and Winkler G
                                            study highlights the importance of distance limits during whale-watching operations to
 (2020) Repeated Vessel Interactions
      and Climate- or Fishery-Driven        ensure efficient feeding, as well as the vulnerability of this specialist to fluctuations in
Changes in Prey Density Limit Energy        krill densities.
Acquisition by Foraging Blue Whales.
               Front. Mar. Sci. 7:626.      Keywords: net energy gain, foraging energetics, krill density, climate change, whale-watching interaction, Estuary
     doi: 10.3389/fmars.2020.00626          and Gulf of St. Lawrence

Frontiers in Marine Science | www.frontiersin.org                                1                                              August 2020 | Volume 7 | Article 626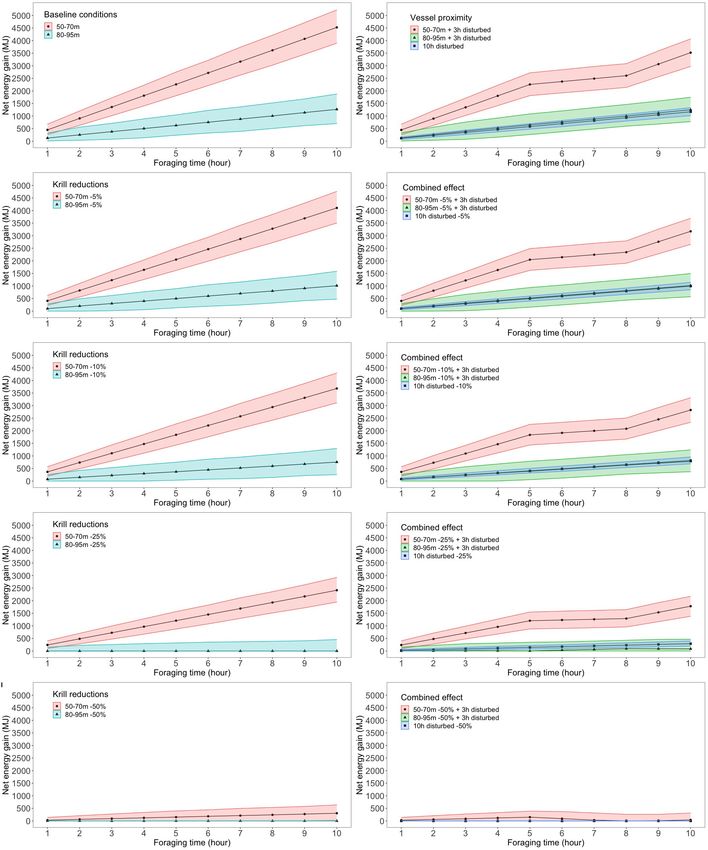
Guilpin et al.                                                                                           Vessel-Proximity and Preyscape Impact Energetics

INTRODUCTION                                                                      In the western North Atlantic, blue whales seasonally visit
                                                                              the Estuary and Gulf of St. Lawrence (EGSL) to feed (Sears
Sufficient food provisioning is essential to the growth, survival,            and Calambokidis, 2002). In this region from 1999 to 2009,
and reproduction of individuals (Emlen, 1966; Pyke et al.,                    their diet was composed on average of 70% of Thysanoessa
1977). In capital breeders and other migrating species, the                   raschii, and 30% of Meganyctiphanes norvegica (Gavrilchuk et al.,
vast majority of lipid accumulation relies on a spatiotemporally              2014), the two dominant krill species in the area. These two
narrow window of food abundance. Accumulated energy reserves                  species differ in aggregative behavior, mean depth, temperature
are then used for their yearly needs to sustain the individual                preferences, optimal ecological niche as well as energy content
during reproduction and periods of fasting or reduced food                    (Plourde et al., 2014b; McQuinn et al., 2015; Cabrol et al., 2019).
availability (Houston et al., 2007). Rorqual whales are capital               Surface salinity affects daytime distribution of the two species,
breeders that adopt this strategy, although sporadic feeding has              while changing water temperature experienced by adult krill may
been documented during migration when suitable areas are                      have consequences for development, growth, and reproduction
encountered (McWilliams et al., 2004; Skagen, 2006; Silva et al.,             (Richardson, 2008; Plourde et al., 2014a,c; Benkort et al., 2019),
2013; Owen et al., 2016). Rorquals feed on dense aggregations                 and ultimately biomass and density (Richardson, 2008). With
of zooplankton or small schooling fish using a distinct feeding               climate change, M. norvegica – a temperate to boreal species
strategy called lunge filter feeding (Goldbogen et al., 2011).                (Sameoto, 1976) – might be favored over Thysanoessa spp.
However, the high energetic cost of lunge feeding constrains                  (i.e., T. raschii and Thysanoessa inermis) – adapted to cold
rorquals to target dense prey patches to maintain high foraging               environments (Mauchline and Fisher, 1980). A change in the
efficiency and allow for fat accumulation (Goldbogen et al., 2011;            relative abundance and density of the two krill species, or in the
Guilpin et al., 2019).                                                        depth of their center of mass, is likely to affect the energetics and
    The blue whale, Balaenoptera musculus, is the largest of the              foraging efficiency of blue whales feeding in the EGSL. Similarly,
rorquals. This species is ubiquitous to all oceans and feeds almost           operations such as the introduction of a krill fishery, that would
exclusively on euphausiids or krill, a keystone species of pelagic            reduce krill density and biomass, could lead to a decrease in
food webs that is heterogeneously distributed in space and time               the number of krill patches with densities suitable for foraging
(Kawamura, 1980; Mauchline and Fisher, 1980; Watkins and                      blue whales and to an increased patchiness of blue whale habitat,
Murray, 1998). Blue whales have been shown to follow optimality               affecting their foraging efficiency.
predictions when feeding on krill by increasing the number of                     Other anthropogenic activities might also affect foraging
lunges per dive with increasing feeding depth (Doniol-Valcroze                efficiency by acting on prey access rather than density. This is
et al., 2011). Additionally, they modulate their behavior both                the case for instance of anthrophonic disturbances related to
in response to krill density and foraging depth (Hazen et al.,                marine traffic or whale-watching activities, underwater noise and
2015). For instance, they tend to optimize oxygen consumption                 vessel collision risk (Pirotta et al., 2018) that interfere with normal
when krill densities are low or located at shallow depths and to              behavior. Whale watching operations can reduce foraging activity
maximize energy intake when krill densities are high or located               of marine mammals by triggering avoidance responses and
at deeper depths (Hazen et al., 2015). Capital breeders such as               changing diving patterns (Lusseau et al., 2009; Christiansen et al.,
blue whales might be particularly sensitive to alterations to their           2013; Senigaglia et al., 2016; Schuler et al., 2019). A reduction
prey field or prey access, and in the context of climate change               in net energy gain can lead not only to immediate physiological
and worldwide increase in anthropogenic activity, there is a need             repercussions but also to long-term consequences on population
to understand how animals cope with natural or human-induced                  dynamics (Pirotta et al., 2019). In the EGSL, marine traffic and
changes to their environment.                                                 whale-watching are industry sectors that generate thousands of
    In recent years, climate change and increased anthropogenic               transits through blue whale habitat annually (Chion et al., 2009;
activity may be adding to the stochasticity and natural                       Aulanier et al., 2016). In this area, close proximity between vessels
variability in krill availability, density and patchiness. By affecting       and blue whales occurs on a regular basis, and for prolonged
water temperature, sea ice extent and other environmental                     periods during daytime, as the species is the target of whale-
factors, climate change has been acting on krill abundance                    watching activities (Martins, 2012). Particularly when within
and distribution, species composition, and life cycle in both                 400 m, vessels have been shown to reduce blue whale feeding
hemispheres (Flores et al., 2012; McBride et al., 2014). Krill                opportunities by decreasing their surface and dive times (Lesage
exploitation for use primarily as fish food in aquaculture, medical           et al., 2017b). The relative proportion of lost foraging time from
or pharmaceutical purposes, or for human consumption is a                     vessel exposure also increased exponentially with prey depth
common activity in the Antarctic and around Japan, and its                    (Lesage et al., 2017b). This lost foraging time through a decrease
potential as a new fishery resource is periodically considered                in the number of feeding lunges per dive has resulted in lesser
by different countries including Canada (Nicol et al., 2012).                 net energy gain in other rorqual species (Christiansen et al., 2013;
Decreases in krill abundance from climate change and fisheries                Di Clemente et al., 2018). Consequently, vessel proximity may
have been shown to hinder foraging success in penguins (Alonzo                be affecting the energetics and foraging efficiency of disturbed
et al., 2003; Cresswell et al., 2008). Given that prey density directly       whales. These effects might be exacerbated when cumulated
influences the rate of net energy gain, any reductions in the krill           with other stressors such as fisheries or climate change on prey
preyscape would impact blue whale energetics likewise.                        abundance and density.

Frontiers in Marine Science | www.frontiersin.org                         2                                           August 2020 | Volume 7 | Article 626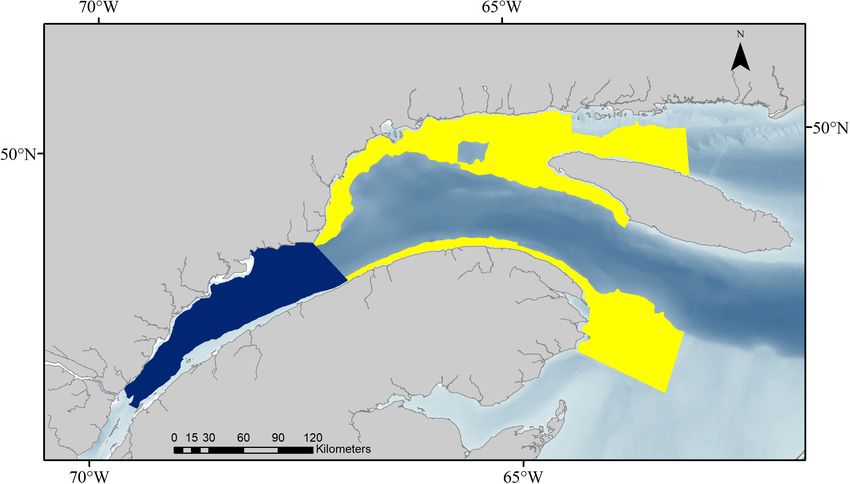
Guilpin et al.                                                                                         Vessel-Proximity and Preyscape Impact Energetics

   Blue whales in the western North Atlantic are listed as                       The energy intake (kJ) during a dive was defined as:
endangered under the Species at Risk Act of Canada and the
Endangered Species Act of the United States of America. Their
low abundance and apparently low calving rate raise concerns                    Energy intake = (VE ∗ N lunges ∗ KED ∗ KEC ∗ AE ∗ SR) (2)
about their nutritional status and cumulative impacts of the
                                                                              and accounts for the number of lunges per dive, which depends
changes to their environment, either natural or man-induced, on
                                                                              on feeding depth, body-length dependent volume of engulfment
their foraging efficiency, fitness and population size. In this study,
                                                                              VE (m3 ), species-specific krill density KED (g wet weight.m−3 ),
we examined how changes in krill density and reductions in time
                                                                              krill-specific energy content KEC (kJ.g wet weight−1 ), the
spent foraging affected net energy gain of foraging blue whales
                                                                              assimilation efficiency AE, and success rate SR.
through model simulations based on empirical data of their
                                                                                 The energy expended per dive depends on the targeted depth.
foraging behavior. Ultimately, these results can help estimate the
                                                                              Typically, blue whale foraging dives consist of a descent during
amount of additional pressure if any that this population can
                                                                              which 40% is passive gliding, followed by one or more lunges
sustain in light of the long-term changes in climate, and chronic
                                                                              at depth, a steadily powered ascent phase and recovery time at
exposure to anthropogenic activity.
                                                                              the surface (Goldbogen et al., 2011). Blue whales are negatively
                                                                              buoyant and start gliding at a depth of about 18 m when targeting
                                                                              depths exceeding 36 m (Williams et al., 2000). Accordingly, the
MATERIALS AND METHODS                                                         energy expended (kJ) during a foraging dive at depths of 36 m or
                                                                              more, was modeled as follows:
We used model simulations to explore the energetic
consequences of both human disturbances and variations                                      Energy expenditure(feeding dive   ≥ 36 m)
in krill preyscape on blue whale energy gains. Each scenario
comprised a set of simulations to investigate the effects of                          = (0.60 ∗ Depth ∗ Descent rate ∗ AMR + 0.40
reductions in krill density, of reduced dive durations as a result
of vessel proximity, and of the combined effect of both while                       Depth ∗ Descent rate ∗ BMR + N. lunges per dive ∗
accounting for foraging depths. Consequences on blue whale
                                                                                     Lunge duration ∗ LFMR + Depth ∗ Ascent rate ∗
energetics and the ability to accumulate energy were integrated
over a 10-h daylight foraging bout, which corresponded to the                           AMR)/1000 + (Surface time ∗ RMR)/1000                       (3)
maximum duration of whale-watching activities and potential
vessel proximity in the study area during summer (Martins, 2012;              where Depth (m) ∗ Descent rate (m.s−1 ) and Depth (m) ∗
Lesage et al., 2017b). However, we did not consider the longer                Ascent rate (m.s−1 ) respectively represent the time (s) required
term impacts of these energetic consequences because we lacked                to descend to the targeted depth or to ascend back to the surface,
data on seasonal changes in blue whale behavior and on the                    and where N. lunges per dives ∗ Lunge duration represents the
strategies that blue whales may use to cope with energy deficits.             time (s) available for foraging at the targeted depth (m). Each
                                                                              feeding dive was followed by a period spent at the surface,
Model Framework                                                               specific to feeding depth, and for which costs were calculated
We simulated individual time-series of foraging dives to                      based on the resting metabolic rate. Recovery time at the surface
investigate immediate and cumulated energetic consequences                    was shown to increase with feeding depth of the preceding dive
of the different scenarios. The model framework allowed the                   (Doniol-Valcroze et al., 2011), and therefore this relationship was
integration of dive-specific parameters such as feeding depth                 extrapolated from empirical data.
and depth-specific krill densities when calculating energy intake                The specific metabolic rates: basal metabolic rate (BMR),
and expenditures (Figure 1). We used Monte Carlo methods to                   resting metabolic rate (RMR), active metabolic rate (AMR), and
account for the uncertainty and variability in parameters, and for            lunge/filter metabolic rate (LFMR) were taken from the literature
estimating net energy gain. Dive parameters for the simulations               (Hemmingsen, 1960; Kleiber, 1975; Croll et al., 2001; Goldbogen
were based on the literature or the analysis of data loggers                  et al., 2006; Potvin et al., 2012). Values and sources for all
(Table 1). We assumed that a whale initiating a foraging dive at              parameters are presented in Table 1. The energy expended (kJ)
a given depth foraged in the same way and in the same location                when foraging at depths shallower than 36 m was modeled in
for the 10-h foraging bout. We also did not take into account the             the same way, but without considering passive gliding during
time needed to fill the forestomach or its clearing rate given that           descent:
our model was based on empirical diving rate data, which already
                                                                                            Energy expenditure(feeding dive < 36 m)
incorporated these factors.
   We calculated the net energy gain (MJ) as the difference                      = (Depth ∗ Descent rate ∗ AMR + N. lunges per dives ∗
between the energy intake and energy expenditure cumulated
                                                                                     Lunge duration ∗ LFMR + Depth ∗ Ascent rate ∗
over each hour of foraging (i):
                                 X                                                      AMR)/1000 + (Surface time ∗ RMR)/1000                       (4)
            Net energy gain = ( (energy intakei −
                                                                              Energy associated with urine production was assumed to be
                                        energy expenditurei ))/1000 (1)       included in basal metabolism, which represents the energy

Frontiers in Marine Science | www.frontiersin.org                         3                                         August 2020 | Volume 7 | Article 626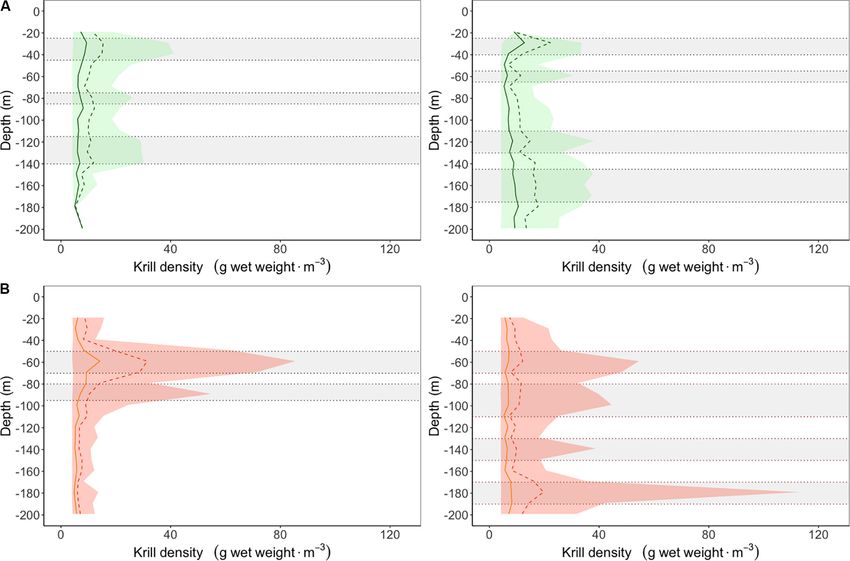
Guilpin et al.                                                                                                      Vessel-Proximity and Preyscape Impact Energetics

    FIGURE 1 | Bioenergetic model framework to assess immediate effects on net energy gain of changes in preyscape as a result of ocean warming or in prey access
    as a result of vessel proximity. Parameters and their value are provided in Table 1.

TABLE 1 | Input parameters, associated sampling distributions and/or values and, data sources used in the bioenergetic framework for estimating net energy gain.

Parameters            Description (units)                               Value                                  Distribution   Source

N lunges per dive     Number of lunges per dive                         Dive- and depth-specific               Gamma          Tag data, this study
N dives per h         Number of dives per hour                          Depth-specific                         Gamma          Tag data, this study
VE                    Length (25 m) specific engulfment volume (m3 )    (1.023*L3 .65 )/1,025                  NA             Potvin et al., 2012
M                     Length (25 m) specific body weight (kg)           96568                                  NA             Croll et al., 2001
KDT                   Krill density Thyssanoessa spp.                   Depth-specific –                                      Hydroacoustic surveys, this study
                      (g wet weight. m−3 )                              75th–95th percentile                   Uniform
KDM                   Krill density Meganyctiphanes norvegica           Depth-specific –                                      Hydroacoustic surveys, this study
                      (g wet weight. m−3 )                              75th–95th percentile                   Uniform
KECT                  Krill energy content Thysanoessa spp.             4.3 ± 0.58                             Normal         D. Chabot (unpubl. data)
                      (kJ. g wet weight−1 )                                                                                   V. Lesage (unpubl. data)
KECM                  Krill energy content M. norvegica                 5.2 ± 0.45                             Normal         D. Chabot (unpubl. data)
                      (kJ. g wet weight−1 )                                                                                   V. Lesage (unpubl. data)
AE                    Assimilation efficiency                           0.84–0.93                              Uniform        Martensson et al., 1994; Olsen et al.,
                                                                                                                              2000; Goldbogen et al., 2011
SR                    Success rate                                      1                                      Fixed
Lunge duration        Lunge duration (s)                                75                                     Fixed          Doniol-Valcroze et al., 2011
BMR                   Basal metabolic rate (J. s−1 )                    2 * (4 * M0.75 )                       NA             Kleiber, 1975
RMR                   Resting metabolic rate (J. s−1 )                  2 * BMR                                NA             Potvin et al., 2012
AMR                   Active metabolic rate (J. s−1 )                   3 * BMR                                NA             Potvin et al., 2012
LFMR                  Lunge/filter metabolic rate (J. s−1 )             1.6 * AMR                              NA             Potvin et al., 2012

NA, not applicable.

needed for maintenance activities, including vital organs such as                       and composition of the meal, and should ideally be included as a
kidneys. Energy expenditure from the heat increment of feeding,                         separate parameter in bioenergetics models. However, given there
i.e., energy associated with digesting food, depends on the size                        is no value specific to large whales for this parameter, numerous

Frontiers in Marine Science | www.frontiersin.org                                   4                                            August 2020 | Volume 7 | Article 626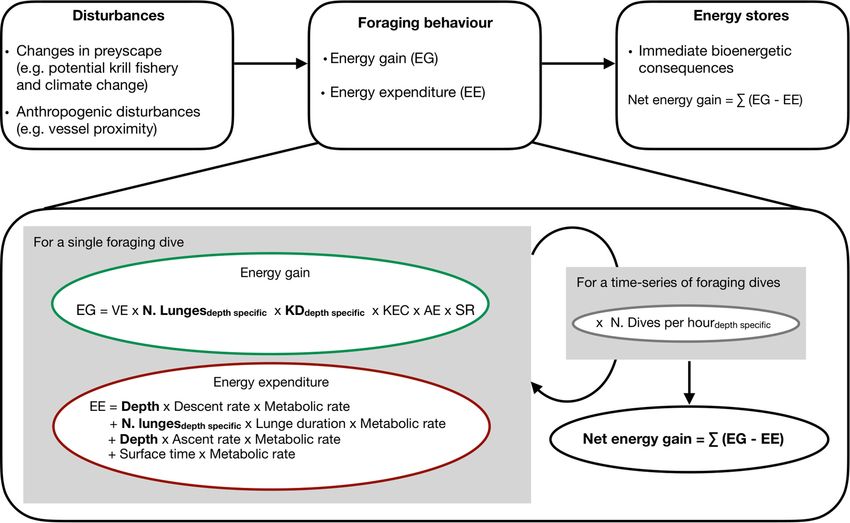
Guilpin et al.                                                                                      Vessel-Proximity and Preyscape Impact Energetics

studies investigating the energetics of large whales (e.g., right          maximum of 4 min on blue whale capacity to accumulate energy,
whales and blue whales) have not taken these costs into account            while allowing reachable depth and number of lunges per dive to
(Wiedenmann et al., 2011; Fortune et al., 2013; Pirotta et al.,            vary for each dive. In other words, disturbed whales were allowed
2018). Instead, heat increment of feeding has been assumed to              to vary the number of lunges per dive according to feeding depth,
be part of the active metabolic rate (Nordøy et al., 1995).                but with the constraint of a maximum dive duration of 4 min.
   Details on other parameters, such as depth-specific diving rate         Krill density was depth-specific for each dive. We simulated
or time spent at the surface after a dive, which were extracted            conditions reflecting vessel proximity within 400 m of foraging
from the analysis of biologging data, and on krill densities               blue whales for a portion (i.e., 3-h – from hour 5 to 8) and the
obtained from systematic hydroacoustic surveys, are presented in           full potential duration (10 h) of whale-watching activities in the
the Supplementary Material.                                                St. Lawrence Estuary (Martins, 2012). Therefore in the scenario
                                                                           of a 3-h vessel proximity, a whale would be constrained to adjust
Simulated Scenarios                                                        feeding depth and exploit the highest densities that are reachable
The energetic consequences of krill density reductions or of               within the 4-min dive limit during these 3 h. They would be
repeated vessel interactions were each examined under baseline             allowed to resume foraging at the initial target depth for the next
conditions and three different scenarios using Monte Carlo                 7 h. In the scenario where vessel proximity lasted for the full
simulations (Supplementary Table S1). We proceeded with 1,000              daytime foraging bout, i.e., 10 h, whales would be deprived from
iterations, which were each comprised of a time-series of feeding          reaching certain deeper depths under the constraints of the 4-min
dives performed over a 10-h foraging bout.                                 dive limit for the entire period. While effects on net energy gain
                                                                           for a 3 h vessel proximity are presented relative to the baseline
Scenario 1: Baseline                                                       scenarios for the same depth categories, they are presented for
This scenario used vertical distributions of krill densities               the 10 h relative to the baseline scenario providing the highest
measured in two regions, i.e., the St. Lawrence Estuary                    net energy gain, i.e., they are not depth-specific.
(SLE) and the North western Gulf of St. Lawrence (NWG),
during systematic hydroacoustic surveys conducted in August                Scenario 4: Combined Effect of Reduction in Krill
2008–2015 in the EGSL (Quebec, Canada, 49◦ 430 N – 65◦                     Density and Vessel Disturbance
110 W) (Figure 2, data analysis is presented in details in the             Reductions in krill density might occur in areas where vessel-
Supplementary Material). Blue whales feed in three different               related effects take place and thus, these two effects might be
habitats in the SLE (Doniol-Valcroze et al., 2012), the mean               additive (Hin et al., 2019; Pirotta et al., 2019). To account
feeding depth of which corresponds well with the center of mass            for potential combined effects, we examined scenarios where
of krill patches documented in this region (i.e., 30, 80, and              krill density was reduced by 5, 10, 25, and 50% from baseline
130 m for Thysanoessa spp., and 60 and 80 m for M. norvegica)              densities, while blue whales foraged in conditions of vessel
(Figure 3 and McQuinn et al., 2015). While a comparable study              proximity for 3 and 10 h.
documenting blue whale foraging depth does not exist for the
NWG, the center of mass for Thysanoessa spp. and M. norvegica              Statistical Analysis
remain in the range of those plausible or documented in the                We assessed the sensitivity of the energy gain function to the
SLE, or in other regions such as the Pacific (i.e., 30, 60, 120, and       uncertainty in parameters using a partial correlation coefficient
160 m for Thysanoessa spp., and 60, 100, 140, and 180 m for                sensitivity analysis and the “pcc” function of the R package
M. norvegica) (Goldbogen et al., 2013; Hazen et al., 2015; Irvine          “sensitivity” (Pujol et al., 2016. Sensitivity: Global Sensitivity
et al., 2019). Therefore, we ran simulations for feeding depths            Analysis of Model Outputs. R package version 1.17.0). This
corresponding to krill peak densities in each of the two regions,          method accounted for the correlation between feeding rate
and separately for the two krill species (Figure 3).                       and energy expenditure, and identified parameters with the
                                                                           largest influence on energy gain, across all scenarios. While all
Scenario 2: Reduction in Krill Biomass Density                             parameters from the energy gain equations (Eqs. 1 and 2) figured
This scenario investigates the effect of reducing krill densities          in the sensitivity analysis, the energy expenditure associated with
on net energy gain. We modeled a decrease in krill density                 each dive (Eq. 3) was entered as a single parameter, thereby
relative to the baseline scenario for the two species separately           incorporating variability associated with depth-specific feeding.
and distributed this decrease homogeneously over the baseline              This allowed the analysis to be focused on uncertainty from
vertical distribution. Hypothetical reductions in krill density            krill density and number of lunges performed, while avoiding
of 5, 10, 25, and 50% were examined, each using a set of                   autocorrelation of multiple parameters associated with energy
1,000 iterations.                                                          expenditure. Metabolic rates are weight-specific, and estimates
                                                                           from the literature are not associated with uncertainty and thus
Scenario 3: Disturbances From Vessels Proximity                            a single, fixed value, was used given our model was for a 25-
A recent study indicated that the presence of vessels within 400 m         m whale.
of blue whales in the SLE resulted in a 36% reduction in dive time,            We assessed each scenario and its effect on blue whale net
equivalent to a mean dive duration of 4 min, and a maximum                 energy gain against the baseline scenario using Cohen’s d value,
foraging effort of 12 dives per hour (Lesage et al., 2017b). In            which represents the difference between the mean net energy gain
this scenario, we investigated the effect of limiting dive time to a       of one of the krill-reduction and/or vessel-proximity scenarios

Frontiers in Marine Science | www.frontiersin.org                      5                                         August 2020 | Volume 7 | Article 626
Guilpin et al. Vessel-Proximity and Preyscape Impact Energetics
FIGURE 2 | Two regions, i.e., the Estuary of the St. Lawrence (dark blue) and the northwestern Gulf of the St. Lawrence (yellow) including the Gaspé peninsula, used
to determine in situ vertical distributions of krill densities.
and the baseline scenario scaled by their pooled standard to the baseline. Generally, the magnitude of the effects increased
deviation (Cohen, 1977). Cohen’s d values indicate a small (0.2– with that of krill density reductions and the duration of vessel
0.5), moderate (0.5–0.8), or large (>0.8) effect size (Cohen, 1977). proximity. Trends in net energy gain as a result of krill density
Simulations and statistical analyses were conducted under the R reduction and vessel proximity scenarios were similar for the two
programming language (R Development Core Team, 2017). krill species, and the two regions, except for the particular case
of Thysanoessa spp. in the SLE. Therefore, detailed results are
presented only for the scenarios that involved M. norvegica in the
RESULTS SLE, with results for the other species and regions being presented
in the Supplementary Material. However, the relative range of
Baseline simulations using in situ krill vertical distributions the effect sizes of the different scenarios on net energy gain is
indicated that blue whales had the potential to accumulate three presented below for both krill species and the two regions.
times more energy by feeding on the most accessible peak of As expected, reducing krill density decreased the net energy
krill densities, i.e., nearest to the surface. For instance, mean potentially gained by a blue whale feeding at any depth compared
net energy gain was more than 3 times higher in the SLE when to the baseline scenario. The energy deficit increased with the size
feeding on peak densities of M. norvegica at 50–70 m versus 80– of the krill density reduction, for the two species and regions
90 m (Figure 4A), or on peak densities of Thysanoessa spp. at (Figures 4C,E,G,I and Supplementary Figures S1C,E,G,I,
25–45 m versus 115–145 m (Supplementary Figure S1A). Only S2C,E,G,I, S3C,E,G,I). However, net energy losses were overall
in the NWG, where peak densities of M. norvegica at 170–190 m smaller both in absolute terms (in MJ) and in percentage for
were double those at 50–70 m, was net energy gain similar at the a given scenario when peak densities were more accessible,
two feeding depths (Supplementary Figure S2A in the NWG i.e., closer to the surface (Figures 4C,E,G,I, 5). For instance, a
for M. norvegica). M. norvegica also offered a higher potential reduction of 5% in M. norvegica densities in the SLE caused a
for net energy gain than Thysanoessa spp. in the two regions, 9% reduction in net energy gain when peak densities were at 50–
regardless of feeding depth. This was particularly the case in 70 m (422/4,526 MJ), compared to 20% (257/1,268 MJ) when
the SLE, with mean net energy gain for blue whales reaching a peak densities were at deeper depths (80–90 m) (Supplementary
maximum of 4,526 and 2,772 MJ for M. norvegica, as opposed Table S1). In addition, large effects were observed when initial
to 1,070 and 675 MJ for Thysanoessa spp. in the SLE and NWG, peak densities were low. In Thysanoessa spp. for instance, even
respectively (Figure 4A, Supplementary Figures S1A, S2A, S3A, small to moderate reductions in krill densities decreased net
and Supplementary Table S1). energy gain to 0 (Figure 3, Supplementary Table S1, and
Simulations of various scenarios of krill reduction and vessel Supplementary Figures S1C,E,G,I, S3C,E,G,I), with effect sizes
proximity highlighted significant differences in blue whale net considered moderate at 5% reduction (Cohen’s d values >0.51)
energy gains made over a 10-h daylight foraging bout compared and large at 10, 25, and 50% reduction (Cohen’s d values >1.16,
Frontiers in Marine Science | www.frontiersin.org 6 August 2020 | Volume 7 | Article 626Guilpin et al. Vessel-Proximity and Preyscape Impact Energetics FIGURE 3 | Vertical density profiles for (A) Thysanoessa spp. (green) and (B) Meganyctiphanes norvegica (orange) for the St. Lawrence Estuary (left) and the northwestern Gulf of St. Lawrence (right) with identified high density layers used as targeted feeding depth for simulated dive time-series (gray horizontal ribbons). Solid vertical lines represent the median, the dashed lines are the 75th percentiles and the colored areas are the 5–95% quantiles. Figure 5). In comparison, the effects of a decrease in krill density the 7 h of undisturbed foraging (during which feeding depth, the were considered small for M. norvegica at 5% reduction (Cohen’s number of dives, and the number of lunges were unconstrained) d values >0.28), moderate to large at 10% reduction (Cohen’s resulted in a 22.2% reduction in net energy gain compared d values >0.45) and large at 25 and 50% reduction (Cohen’s to the baseline over the 10-h foraging bout, i.e., 3,521 MJ d values >1.17, Figure 5) depending on whether whales were (Supplementary Table S1). In comparison, an undisturbed whale feeding in the SLE or NWG. targeting less dense krill densities at deeper depths (80–95 m) was Vessel proximity to foraging whales, with the limit they able to perform only 7 dives and 26 lunges·h−1 , gaining nearly 3 imposed on dive duration (4 min) and feeding rate (12 dives times less energy than a similarly undisturbed whale feeding near per h), led to the majority (70%) of dives being constrained the surface (1,268 MJ). In this case, vessel proximity over 3 h did to depths of 30 m or less (Figure 6). The impacts of vessel not further constrain the whale feeding rate (which was already proximity on net energy gain of foraging whales increased with within the set limit of 12 dives·h−1 ), but it limited feeding depth the duration of vessel interaction, were more important when to shallow waters through the 4-min dive limit where densities whales were precluded from reaching the most beneficial krill were lower than at deeper depths (Figure 3). Unconstrained density peaks and when these densities were located at deeper diving to 80–195 m for the remaining 7 h led to no overall change depths (Figures 4, 5 and Supplementary Figures S2B, S3B). in net energy gain in this scenario (i.e., 1,251 MJ, Supplementary The impacts of vessel proximity also depended on initial feeding Table S1). Whales having vessels in proximity during most of depth and associated peak densities. For instance, an undisturbed their daytime foraging bout had their feeding rate limited for whale foraging in the SLE at intermediate depths (50–70 m) on the full 10 h of vessel proximity, leading to net energy gains densities of M. norvegica performed on average 10 dives and 25 that were 74% lower compared to undisturbed whales feeding lunges·h−1 , and gained 4,526 MJ over the 10 h foraging bout. at depths allowing the highest energy accumulation, an effect During the 3 h when vessels were in proximity, their feeding rate considered large based on Cohen’s d value (>1.8) (Figure 5 and declined to 12 dives and 15 lunges·h−1 , and whales were likely Supplementary Table S1). There were scenarios where vessel unable to reach depths where they were initially feeding. Adding proximity did not lead to a negative effect on net energy gain, Frontiers in Marine Science | www.frontiersin.org 7 August 2020 | Volume 7 | Article 626
Guilpin et al.                                                                                                     Vessel-Proximity and Preyscape Impact Energetics

  FIGURE 4 | Net energy gain (mean and 5–95% CI) accumulated over a 10 h foraging period when feeding on M. norvegica in the St. Lawrence Estuary, (A) under
  baseline conditions measured in situ, (B) when exposed to vessel proximity within 400 m for 3 h (from hour 5 to hour 8) and 10 h, (C,E,G,I) under krill density
  reductions of 5, 10, 25, or 50% relative to baseline, and (D,F,H,J) while foraging on reduced krill densities when exposed to vessel proximity. Patterns for
  Thysanoessa spp. and the NWG are presented in the Supplementary Material.

Frontiers in Marine Science | www.frontiersin.org                                 8                                              August 2020 | Volume 7 | Article 626
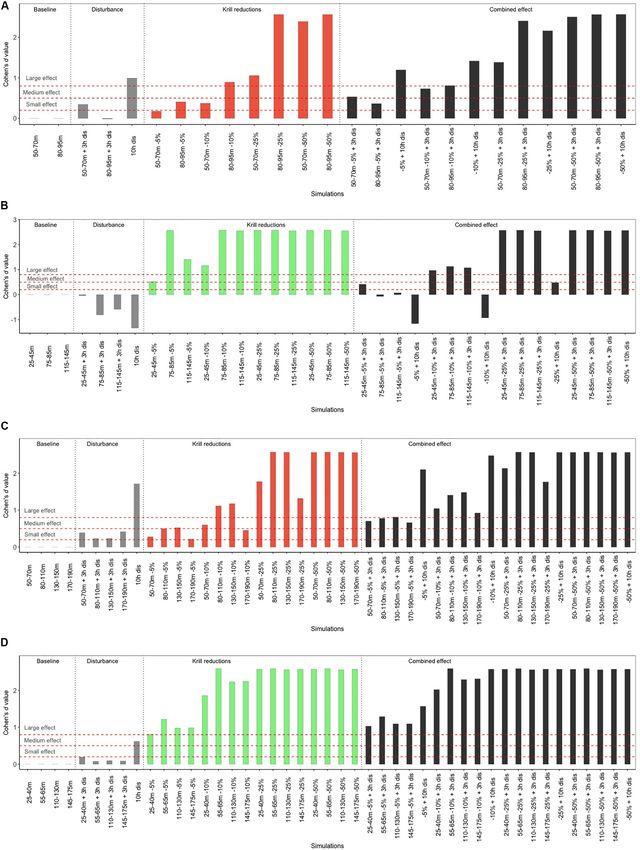
Guilpin et al.                                                                                                      Vessel-Proximity and Preyscape Impact Energetics

  FIGURE 5 | Effect of the various scenarios on net energy gain after a 10 h foraging period of a blue whale feeding on (B,D) Thysanoessa spp. or (A,C) M. norvegica,
  (A,B) in the St. Lawrence Estuary and (C,D) in the North western Gulf of St. Lawrence. The red dashed lines represent the threshold values of Cohen’s d above
  which effects are considered small (0.2), medium (0.5), and large (>0.8). Negative Cohen’s d value indicates a positive effect.

Frontiers in Marine Science | www.frontiersin.org                                 9                                               August 2020 | Volume 7 | Article 626
Guilpin et al.                                                                                                      Vessel-Proximity and Preyscape Impact Energetics

  FIGURE 6 | Frequency (%) distribution of feeding depths when exposed to vessel proximity within 400 m while feeding, thus when dives are limited to 4 min or less.

notably when undisturbed whales foraged near the surface (25–                          net energy gain was the highest (see Supplementary Material
45 m) on the highest densities of Thysanoessa spp. in the SLE.                         for further results). Comparing the effect size between the two
    In the last scenario, effects from krill density reductions                        stressors, a 3 h vessel proximity to a foraging blue whale would
were combined with those from vessel proximity. As a result,                           result in the same reduction in net energy gain as a 5% krill
effects on net energy gain generally reflected those from the two                      density reduction in most cases. Foraging during 10 h with vessels
stressors separately. Specifically, vessel proximity and krill density                 in continuous proximity would be equivalent to foraging on krill
reductions net energy losses were smaller when peak densities                          densities that are reduced by 5–10% (Figure 5).
were high, and more accessible. Impacts of these two factors                              The sensitivity analysis highlighted the number of lunges
on net energy gain increased with krill density reductions, and                        per dive, krill density and krill energy content as the three
with vessel proximity persistence over time (Figures 4D,F,H,J,                         parameters contributing the most to the uncertainty in net energy
5). For whales foraging on peak densities of M. norvegica in                           gain (Sensitivity partial correlation coefficients: 0.96, 0.87, and
the SLE, a density reduction of 25% or more, combined with                             0.62, respectively).
vessel proximity of 3 h or more, invariantly resulted in a medium
to large effect, equivalent to approximately 60–100% decrease
in net energy gain depending on feeding depth (Figure 5 and                            DISCUSSION
Supplementary Table S1). A whale foraging optimally, i.e., on
peak densities of M. norvegica nearest to the surface, but that                        Habitat degradation, either natural and/or human-induced, can
have been reduced by 50%, with vessels in proximity for 3 h,                           have detrimental effects on foraging efficiency, fitness and
would accumulate less than half the energy they would have                             population trends (Williams et al., 2006; Pirotta et al., 2018).
acquired under the baseline scenario (mean net energy gain                             Blue whale foraging behavior in the SLE conforms to optimality
of 1,781 MJ versus 4,526 MJ under baseline) (Supplementary                             predictions, with feeding dives near the surface yielding the
Table S1). Extending this perturbation to 10 h would lead to a                         highest feeding rates (Doniol-Valcroze et al., 2011). Adding
60% reduction in energy accumulated over that period compared                          to this that the krill densities measured in situ in the EGSL
to baseline conditions (i.e., 2,747 MJ) (Supplementary Table S1).                      were generally denser at shallower depths than at deeper depths
For M. norvegica in the SLE and both species in the NWG,                               (Figure 3), we predicted that the highest potential for energy
even a small reduction in krill densities (5%), when combined to                       accumulation was when whales were feeding on these shallow
medium (3 h) exposure to vessels can lead to a net energy deficit                      peaks densities and were targeting M. norvegica over T. raschii.
of 19–38% when feeding at intermediate or shallow depths. The                          We also showed that the energy deficit caused by krill density
scale of the effect varied for the two species and regions for a given                 reductions or vessel proximity, or their combination, can be
depth and scenario according to krill densities and depths where                       significant, even when vessels are in proximity for relatively

Frontiers in Marine Science | www.frontiersin.org                                 10                                              August 2020 | Volume 7 | Article 626
Guilpin et al. Vessel-Proximity and Preyscape Impact Energetics
short periods of time (3 h). Generally, effects varied with the temperate species, M. norvegica (Sameoto, 1976). Although the
density and depth of the krill peaks accessible to blue whales, and effects of a potential increase in species-specific krill density are
increased with the magnitude of krill density reductions, and with not explicitly addressed in this study, their general trend could
the duration of vessel proximity. be derived directly from the percent changes presented in the
Krill densities, like any other marine resource, naturally Supplementary Material (by making them positive).
fluctuate in abundance according to environmental conditions Meganyctiphanes norvegica offered a higher potential for
(Reid et al., 2010; Flores et al., 2012; Sydeman et al., 2013), and net energy gain than Thysanoessa spp., with particularly high
long-lived predators are particularly well adapted to cope with energetic benefits when peak densities were near the surface.
these fluctuations (Benoit-Bird et al., 2013; Abrahms et al., 2019; While blue whales are known to feed on both M. norvegica
Dunn et al., 2020). Our simulations showed that blue whales and Thysanoessa spp., their diet is likely to vary across their
are in all likelihood well adapted to cope with fluctuations of range depending on local availability (Lesage et al., 2018).
5%, but that they may incur considerable energy loss at higher M. norvegica is the dominant krill species in other, warmer blue
density fluctuations. A link between food availability and calving whale foraging areas such as the Scotian shelf or the waters
rate has been documented in several species including blue off southern Newfoundland (Cochrane et al., 1991, 2000) and
whales (e.g., Ward et al., 2009; Seyboth et al., 2016; Meyer- is likely to represent their main prey, although specific blue
Gutbrod and Greene, 2018). In blue whales from Antarctica, whale diet is unknown for these areas. In the EGSL, Thysanoessa
a simulated reduction of 50% in mean swarm density during spp. comprised 70% of blue whale diet between 1995–2009
an entire feeding season of 120 days resulted in an estimated according to quantitative isotopic models (Gavrilchuk et al.,
80% decrease in calving rate (Wiedenmann et al., 2011). Blue 2014). This is in agreement with the stronger spatial association
whales appear to track food resource based on long-term stored of this krill species with blue whale observations made during
information rather than short-term proximate cues (Abrahms hydroacoustic surveys in 2009–2013 (McQuinn et al., 2016), and
et al., 2019), a behavior that might limit their ability to respond which suggests that M. norvegica densities worth exploiting might
and adjust to rapidly changing environmental conditions despite not be that common in the EGSL. Hydroacoustic surveys used
a certain degree of behavioral plasticity in blue whales (Abrahms in our study to derive total krill densities were conducted in
et al., 2019) as in other marine predators (Ronconi and Burger, 2008–2015, i.e., mainly after the study on blue whale diet, and
2008). Behavioral plasticity might be particularly insufficient indicated densities that were similar for the two krill species
for mitigating the consequences of climate change, which are or greater for M. norvegica since 2010 (Figure 3). However, M.
accelerating and exacerbating the natural variability of prey norvegica peak densities are typically found at deeper depths than
resources (Sydeman et al., 2013). Important foraging habitats for Thysanoessa spp. (Figure 3; McQuinn et al., 2015, 2016), reducing
blue whales have been identified in several areas across eastern the relative benefit of exploiting this resource over Thysanoessa
Canada, including the EGSL but also in Newfoundland waters spp. Considering its higher energetic value, and that our results
and on the Scotian Shelf (Lesage et al., 2018). These regions showed that blue whales accumulated the most energy when
offer a high diversity of habitats, and are heterogeneous in their feeding on M. norvegica, a change in the dominance ratio with
seascape (Loncarevic et al., 1992; Galbraith et al., 2018), in vessel climate change in favor of M. norvegica might be beneficial to
traffic density (e.g., Simard et al., 2014), and in krill densities blue whales and therefore mitigate at least in part the reduced
(McQuinn et al., 2015; Plourde et al., 2016). In the case where krill krill density in the EGSL.
densities would be inadequate in a given region, or where vessel We showed that the level of impact from vessel proximity is
exposure would limit energy gains, whales would theoretically dependent on resource accessibility. If krill is present in sufficient
have the opportunity to move to other areas of recurrent krill densities near the surface, then the negative effects from close
aggregations within the EGSL region or outside of it, assuming of vessel proximity, which imposes a limit on dive time and dive
course that these habitats exist in these other regions at the time rate, would not be as limiting as if adequate krill densities are
they are needed. only available at deeper depth, where they become out of reach
Changes in zooplankton community composition in the EGSL with a dive-duration limit of 4 min (>30 m). In the SLE, blue
have been documented over the last two decades (Richardson, whales forage in four types of habitat that vary in feeding depth
2008; Blais et al., 2019). Although studies specifically examining and whale behavior, and that are used differently depending
climate change effects are still scarce for krill communities typical on tidal phase (Doniol-Valcroze et al., 2012). Feeding depths
of the EGSL, changes in composition are also expected for the follow a bimodal distribution, with a strong peak near the surface
latter given the overlapping but distinct optimal temperature and a weaker peak between 50 and 100 m (Doniol-Valcroze
niche of the two main krill species (Sameoto, 1976; Mauchline et al., 2012). Indeed, blue whales in the SLE and NWG exhibited
and Fisher, 1980; Ollier et al., 2018). Water salinity through its the strongest spatial association with shallow krill patches over
effect on light penetration influences the vertical distribution deep aggregations between 2009 and 2013 (McQuinn et al.,
and density of krill in the EGSL (Plourde et al., 2014b) as well 2016). These results suggest that a given vessel-proximity event
as their temperature exposure, physiological state, condition, might have differential effects on blue whale foraging efficiency
and survival (Flores et al., 2012; McBride et al., 2014). The depending on where and when it occurs in their habitat. At times
forecasted 0.6–1.2◦ C increase in seawater temperature the EGSL or in areas where sufficient krill densities that may allow for a
over the next 50 years (Hutchings et al., 2012; Long et al., 2016; positive net energy gain are unavailable near the surface, effects
Galbraith et al., 2018) might lead to a niche expansion of the more of vessel proximity on the capacity of blue whales to accumulate
Frontiers in Marine Science | www.frontiersin.org 11 August 2020 | Volume 7 | Article 626Guilpin et al. Vessel-Proximity and Preyscape Impact Energetics
energy reserves might be more important than depicted in our result in strong negative effects on their reproductive success, as
study, even for short periods of vessel exposure. they tend to prioritize their own survival over investment into
The timing of peak whale-watching activities is inextricably an offspring (Pirotta et al., 2019). In our study area, whether
linked to the presence of whales. In the EGSL, the whale-watching the changes we modeled could affect blue whale’s capacity to
fleet comprises over 20 vessels proposing multiple departures a accumulate adequate energy reserves to reproduce successfully
day from May to October. Their activities result in prolonged or to survive is unknown, and depends on the persistence
and recurrent vessel proximity to foraging blue whales (Martins, of vessel interactions and on food abundance. However, there
2012) and what might lead to negligible to major energy deficits are indications of a low calving rate for this western North
per day. Whether the net energy deficits predicted in our study Atlantic blue whale population (Mingan Island Cetacean studies,
would have long-term effects on blue whale body condition Unpublished data), which may be an indication of difficulties
is unknown, and depends on the nature and magnitude of in foraging. When food resources are limited, the additional
the consequences (Houston et al., 2012; Pirotta et al., 2018), pressure from short-term or prolonged vessel-proximity might
which in turn depend on the recurrence of exposure and the exacerbate the negative effects of prey limitation on their net
whale’s capacity to compensate for un-capitalized energy at other energy gain. Modeling the effects of vessel-proximity and food
times. Individuals generally show resilience and plasticity by shortage over longer time periods (e.g., for annual life cycle or
adjusting foraging effort to the naturally changing preyscape a reproductive cycle) would be evaluated best if cumulated over
(Costa et al., 1989; Sigler et al., 2009). In the context of a feeding season or a full reproductive cycle and would help
anthropogenic disturbance, this plasticity likely allows some determine their biological significance for blue whales. However,
degree of compensation for lost feeding opportunities. While this would require a model that incorporates energy gains from
some studies show a relatively high resilience to disturbance in feeding at other times of day, search time for food patches and
some populations (e.g., New et al., 2013a, 2014), others provide non-foraging behavior, and in the case of extrapolation over
strong support for a limited capacity to compensate for lost a full reproductive cycle, breeding and migration costs. The
opportunities (e.g., New et al., 2013b; McHuron et al., 2018). For model would also need to incorporate the unknown mechanisms
example, a simulation study on Californian sea lions indicated that blue whales implement for coping with energy deficits,
that both short and infrequent disturbances (Guilpin et al. Vessel-Proximity and Preyscape Impact Energetics
resume foraging when they encounter another prey patch of DATA AVAILABILITY STATEMENT
sufficient density. However, both of these behavioral modes
are time dependent and were not considered in our study The datasets presented in this article are not readily available
(Mori, 1998; Watanabe et al., 2014). We assumed constant because the tag data and hydroacoustic data are still under
prey density while depletion of a food patch is inevitable and exploitation. The datasets generated for this study are
influences predator foraging decisions (Thompson and Fedak, available on request. Requests to access the datasets should
2001; Sparling et al., 2007; Thums et al., 2013; Akiyama et al., be directed to VL, veronique.lesage@dfo-mpo.gc.ca (tag data);
2019), and did not allow a whale to find an alternative patch IM, ian.mcQuinn@dfo-mpo.gc.ca (hydroacoustic data); and MG,
(Sims et al., 2006; Thums et al., 2011). The hydroacoustic marie.guilpin@gmail.com (generated datasets).
surveys used covered most of the areas visited by blue whales
over a feeding season (Lesage et al., 2017a) and provided us
with a global krill vertical density distribution rather than ETHICS STATEMENT
densities of specific krill layers or swarms. It was therefore
The animal study was reviewed and approved by The Canadian
reasonable to assume that whales were feeding at the same
Animal Care Committee, through the Maurice Lamontagne
general location for the 10-h foraging period. However, we might
Institute committee.
have overestimated net energy gain during this 10-h portion
of daylight foraging by not accounting for activities other than
foraging (i.e., resting and traveling). AUTHOR CONTRIBUTIONS
From a management perspective, the findings of this study
are important as they transpose behavioral responses into VL and MG conceived the model framework. MG led the
energetic consequences for foraging blue whales. They also bring data analysis and wrote the manuscript. VL and GW obtained
support to the currently applied regulations in the Saguenay- funding to support the research. IM provided the hydroacoustic
St. Lawrence Marine Park, which impose a 400-m exclusion surveys data and guidance for the analysis of it. VL, GW, PB,
zone for vessels around blue whales, as a way to mitigate and TJ-D provided guidance on the model and simulations.
potential impacts on this endangered species. In addition, they All authors provided guidance on model framework and
highlight the need to extend these limits to other important reviewed the manuscript.
habitats for blue whales, where vessel interactions might be
chronic. Our study also underscored the importance of limiting
the duration of vessel proximity, especially if vessels are within FUNDING
400 m of a blue whale and in conditions where krill densities
might be reduced. In the Saguenay-St. Lawrence Marine Park, This work was financially supported by the Species at Risk and
a single vessel has a 1-h viewing time limit, with a 1-h Oceans Management programs of Fisheries and Oceans Canada,
interval between successive observations (Regulations Saguenay- and by the strategic partnership grant (STPGP 447363) from the
St. Lawrence Marine Park, 2020). A potential management Natural Sciences and Engineering Research Council of Canada
measure could be to implement cumulative vessel time viewing (NSERC) awarded to GW and VL. PB was funded by Fisheries
limits around blue whales to decrease total duration of Science and Ecosystem Research Program from the Government
potential disturbance. of Canada through an NSERC (Natural Sciences and Engineering
For a species like the blue whale, which relies on a limited Research Council of Canada) visiting fellowship.
feeding season for building energy reserves, changes in energy
gain through an altered krill preyscape and/or anthropogenic ACKNOWLEDGMENTS
disturbances is of concern. This study showed that these
changes not only would have a detrimental effect on net We thank all DFO personnel and crewmembers aboard the
energy gain, but there is the possibility of these changes Frederick G. Creed involved in the systematic hydroacoustic
to acting synergistically or exacerbating one another. Under surveys. We thank F. Paquet for validating the hydroacoustic
conditions where krill densities would decrease due to climate data as well as the editor and reviewers for their helpful
change or krill exploitation, disturbing foraging blue whales suggestions which greatly improved the manuscript. This
would undoubtedly affect their capacity to accumulate energy study is contributing to the program of Québec–Océan, a
stores over a feeding season. An estimation of the energy strategic cluster of oceanography scientists and their partners,
budget over a reproductive cycle of blue whales is needed funded by the Fonds de Recherche du Québec – Nature et
to determine a threshold above which these changes would technologies (FRQNT).
jeopardize their reproductive success. Although future work
needs to investigate the fine scale diving behavior of disturbed
individuals, our results to date could be integrated into models SUPPLEMENTARY MATERIAL
simulating the population consequences of disturbances to
estimate their effect on vital rates and population dynamics, The Supplementary Material for this article can be found online
providing a longer time-scale perspective on the energetics of this at: https://www.frontiersin.org/articles/10.3389/fmars.2020.
endangered population. 00626/full#supplementary-material
Frontiers in Marine Science | www.frontiersin.org 13 August 2020 | Volume 7 | Article 626Guilpin et al. Vessel-Proximity and Preyscape Impact Energetics
REFERENCES Doniol-Valcroze, T., Lesage, V., Giard, J., and Michaud, R. (2011). Optimal foraging
theory predicts diving and feeding strategies of the largest marine predator.
Abrahms, B., Hazen, E. L., Aikens, E. O., Savoca, M. S., Goldbogen, J. A., Bograd, Behav. Ecol. 22, 880–888. doi: 10.1093/beheco/arr038
S. J., et al. (2019). Memory and resource tracking drive blue whale migrations. Doniol-Valcroze, T., Lesage, V., Giard, J., and Michaud, R. (2012). Challenges in
Proc. Natl. Acad. Sci. U.S.A. 116, 5582–5587. doi: 10.1073/pnas.18190 marine mammal habitat modelling: evidence of multiple foraging habitats from
31116 the identification of feeding events in blue whales. Endanger. Spec. Res. 17,
Akiyama, Y., Akamatsu, T., Rasmussen, M. H., Iversen, M. R., Iwata, 255–268. doi: 10.3354/esr00427
T., Goto, Y., et al. (2019). Leave or stay? Video-logger revealed Dunn, R. E., Wanless, S., Daunt, F., Harris, M. P., and Green, J. A. (2020). A year
foraging efficiency of humpback whales under temporal change in in the life of a north Atlantic seabird: behavioural and energetic adjustments
prey density. PLoS One 14:e0211138. doi: 10.1371/journal.pone.02 during the annual cycle. Sci. Rep. 10, 1–11. doi: 10.1038/s41598-020-62842-x
11138 Emlen, J. M. (1966). The role of time and energy in food preference. Am. Nat. 100,
Alonzo, S. H., Switzer, P. V., and Mangel, M. (2003). An ecosystem-based approach 611–617. doi: 10.1086/282455
to management: using individual behaviour to predict the indirect effects of Flores, H., Atkinson, A., Kawaguchi, S., Krafft, B. A., Milinevsky, G., Nicol, S., et al.
Antarctic krill fisheries on penguin foraging. J. Appl. Ecol. 40, 692–702. doi: (2012). Impact of climate change on Antarctic krill. Mar. Ecol. Prog. Ser. 458,
10.1046/j.1365-2664.2003.00830.x 1–19. doi: 10.3354/meps09831
Aulanier, F., Simard, Y., Roy, N., Gervaise, C., and Bandet, M. (2016). Spatial- Fortune, S. M. E., Trites, A. W., Mayo, C. A., Rosen, D. A. S., and Hamilton,
temporal exposure of blue whale habitats to shipping noise in St. Lawrence P. K. (2013). Energetic requirements of North Atlantic right whales and the
system. DFO Can. Sci. Advis. Sec. Res. Doc. 90, 4–26. implications for species recovery. Mar. Ecol. Prog. Ser. 478, 253–272. doi: 10.
Benkort, D., Plourde, S., Winkler, G., Cabrol, J., Ollier, A., Cope, L.-E., et al. (2019). 3354/meps10000
Individual-based modeling explains the contrasted seasonality in size, growth, Galbraith, P. S., Chassé, J., Caverhill, C., Nicot, P., Gilbert, D., Lefaivre, D., et al.
and reproduction of the sympatric Arctic (Thysanoessa raschii) and Nordic (2018). Physical oceanographic conditions in the gulf of St. Lawrence during
krill (Meganyctiphanes norvegica) in the St. Lawrence Estuary, eastern Canada. 2017. DFO Can. Sci. Advis. Sec. Res. Doc. 50:79.
Limnol. Oceanogr. 64, 1–21. doi: 10.1002/lno.11032 Gavrilchuk, K., Lesage, V., Ramp, C., Sears, R., Bérubé, M., Bearhop, S., et al. (2014).
Benoit-Bird, K. J., Battaile, B. C., Heppell, S. A., Hoover, B., Irons, D., Jones, N., Trophic niche partitioning among sympatric baleen whale species following the
et al. (2013). Prey patch patterns predict habitat use by top marine predators collapse of groundfish stocks in the Northwest Atlantic. Mar. Ecol. Prog. Ser.
with diverse foraging strategies. PLoS One 8:53348. doi: 10.1371/journal.pone. 497, 285–301. doi: 10.3354/meps10578
0053348 Goldbogen, J. A., Calambokidis, J., Oleson, E., Potvin, J., Pyenson, N. D., Schorr,
Blais, M., Galbraith, P. S., Plourde, S., Scarratt, M., Devine, L., and Lehoux, C. G., et al. (2011). Mechanics, hydrodynamics and energetics of blue whale lunge
(2019). Chemical and biological oceanographic conditions in the estuary and feeding: efficiency dependence on krill density. J. Exp. Biol. 214, 131–146. doi:
gulf of St. Lawrence during 2017. DFO Can. Sci. Advis. Sec. Res. 2019:56. 10.1242/jeb.054726
Boyd, I. L. (1996). Temporal scales of foraging in a marine predator. Ecology 77, Goldbogen, J. A., Calambokidis, J., Shadwick, R. E., Oleson, E. M., McDonald,
426–434. doi: 10.2307/2265619 M. A., and Hildebrand, J. A. (2006). Kinematics of foraging dives and lunge-
Cabrol, J., Trombetta, T., Amaudrut, S., Aulanier, F., Sage, R., Tremblay, R., et al. feeding in fin whales. J. Exp. Biol. 209, 1231–1244. doi: 10.1242/jeb.02135
(2019). Trophic niche partitioning of dominant North-Atlantic krill species, Goldbogen, J. A., Southall, B. L., DeRuiter, S. L., Calambokidis, J., Friedlaender,
Meganyctiphanes norvegica, Thysanoessa inermis, and T. raschii. Limnol. A. S., Hazen, E. L., et al. (2013). Blue whales respond to simulated mid-
Oceanogr. 64, 165–181. doi: 10.1002/lno.11027 frequency military sonar. Proc. Biol. Sci. 280:20130657. doi: 10.1098/rspb.2013.
Chion, C., Turgeon, S., Michaud, R., Landry, J.-A., and Parrott, L. (2009). Portrait 0657
de la navigation dans le parc marin du Saguenay-Saint-Laurent. Parcs. Canada Guilpin, M., Lesage, V., McQuinn, I., Goldbogen, J., Potvin, J., Jeanniard-du-Dot,
2009, 1–86. T., et al. (2019). Foraging energetics and prey density requirements of western
Christiansen, F., Rasmussen, M., and Lusseau, D. (2013). Whale watching disrupts North Atlantic blue whales in the Estuary and Gulf of St. Lawrence, Canada.
feeding activities of minke whales on a feeding ground. Mar. Ecol. Prog. Ser. 478, Mar. Ecol. Prog. Ser. 625, 205–223. doi: 10.3354/meps13043
239–251. doi: 10.3354/meps10163 Hazen, E. L., Friedlaender, A. S., and Goldbogen, J. A. (2015). Blue whales
Cochrane, N. A., Sameoto, D. D., and Herman, A. W. (2000). Scotian Shelf (Balaenoptera musculus) optimize foraging efficiency by balancing oxygen use
euphausiid and silver hake population changes during Scotian Shelf euphausiid and energy gain as a function of prey density. Sci. Adv. 1:e1500469. doi: 10.1126/
and silver hake population changes during 1984 - 1996 measured by multi- sciadv.1500469
frequency acoustics. ICES J. Mar. Sci. 57, 122–132. doi: 10.1006/jmsc.1999. Hemmingsen, A. M. (1960). Energy metabolism as related to body size and
0563 respiratory surfaces, and its evolution. Rep. Stem Meml. Hosp. Nordisk Insulin
Cochrane, N. A., Sameoto, D. D., Herman, A. W., and Neilson, J. L. (1991). Lab. 9:110.
Multiple-frequency acoustic backscattering and zooplankton aggregations in Hin, V., Harwood, J., and de Roos, A. M. (2019). Bio-energetic modeling of
the Inner Scotian shelf basins. Can. J. Fish. Aquat. Sci. 48, 340–355. doi: 10. medium-sized cetaceans shows high sensitivity to disturbance in seasons of low
1139/f91-046 resource supply. Ecol. Appl. 29, 1–19. doi: 10.1002/eap.1903
Cohen, J. (1977). Statistical Power Analysis For The Behavioral Science. New York, Houston, A. I., Prosser, E., and Sans, E. (2012). The cost of disturbance: a
NY: Academic Press. waste of time and energy? Oikos 121, 597–604. doi: 10.1111/j.1600-0706.2011.
Costa, D. P., Croxall, J. P., and Duck, C. D. (1989). Foraging energetics of Antarctic 19594.x
fur seals in relation to changes in prey availability. Ecology 70, 596–606. doi: Houston, A. I., Stephens, P. A., Boyd, I. L., Harding, K. C., and McNamara, J. M.
10.2307/1940211 (2007). Capital or income breeding? A theoretical model of female reproductive
Cresswell, K. A., Wiedenmann, J., and Mangel, M. (2008). Can macaroni penguins strategies. Behav. Ecol. 18, 241–250. doi: 10.1093/beheco/arl080
keep up with climate- and fishing-induced changes in krill?? Polar Biol. 31, Hutchings, J. A., Côté, I. M., Dodson, J. J., Fleming, I. A., Jennings, S., Mantua,
641–649. doi: 10.1007/s00300-007-0401-0 N. J., et al. (2012). Climate change, fisheries, and aquaculture: trends and
Croll, D. A., Acevedo-Gutiérrez, A., Tershy, B. R., and Urbán-Ramírez, J. (2001). consequences for Canadian marine biodiversity. Environ. Rev. 20, 220–311.
The diving behavior of blue and fin whales: is dive duration shorter than doi: 10.1139/a2012-013
expected based on oxygen stores? Comp. Biochem. Physiol. Part A Mol. Integr. Irvine, L. M., Palacios, D. M., Lagerquist, B. A., and Mate, B. R. (2019). Scales of
Physiol. 129, 797–809. doi: 10.1016/S1095-6433(01)00348-8 blue and fin whale feeding behavior off California, USA, with implications for
Di Clemente, J., Christiansen, F., Pirotta, E., Steckler, D., Wahlberg, M., and prey patchiness. Front. Ecol. Evol. 7:338. doi: 10.3389/fevo.2019.00338
Pearson, H. C. (2018). Effects of whale watching on the activity budgets of Kawamura, A. (1980). A review of food of balaenopterid whales. Sci. Rep. Whales
humpback whales, Megaptera novaeangliae (Borowski, 1781), on a feeding Res. Inst. 32, 155–197.
ground. Aquat. Conserv. Mar. Freshw. Ecosyst. 28, 810–820. doi: 10.1002/aqc. Kleiber, M. (1975). The Fire Of Life: An Introduction To Animal Energetics, 2nd
2909 Edn, Huntington, NY: Robert E. Krieger.
Frontiers in Marine Science | www.frontiersin.org 14 August 2020 | Volume 7 | Article 626You can also read