Seasonality of the Microbial Community Composition in the North Atlantic - Frontiers
←
→
Page content transcription
If your browser does not render page correctly, please read the page content below
ORIGINAL RESEARCH
                                                                                                                                           published: 05 February 2021
                                                                                                                                      doi: 10.3389/fmars.2021.624164

                                            Seasonality of the Microbial
                                            Community Composition in the North
                                            Atlantic
                                            Luis M. Bolaños 1* , Chang Jae Choi 2,3,4 , Alexandra Z. Worden 2,3 , Nicholas Baetge 5 ,
                                            Craig A. Carlson 5 and Stephen Giovannoni 1*
                                            1
                                              Department of Microbiology, Oregon State University, Corvallis, OR, United States, 2 Monterey Bay Aquarium Research
                                            Institute, Monterey, CA, United States, 3 Ocean EcoSystems Biology Unit, GEOMAR Helmholtz Centre for Ocean Research,
                                            Kiel, Germany, 4 Marine Science Institute, The University of Texas at Austin, Port Aransas, TX, United States, 5 Department
                                            of Ecology, Evolution and Marine Biology, Marine Science Institute, University of California, Santa Barbara, Santa Barbara,
                                            CA, United States

                                            Planktonic communities constitute the basis of life in marine environments and have
                                            profound impacts in geochemical cycles. In the North Atlantic, seasonality drives
                                            annual transitions in the ecology of the water column. Phytoplankton bloom annually
                                            in spring as a result of these transitions, creating one of the major biological pulses
                                            in productivity on earth. The timing and geographical distribution of the spring
                           Edited by:       bloom as well as the resulting biomass accumulation have largely been studied
                       Tilmann Harder,      using the global capacity of satellite imaging. However, fine-scale variability in the
       University of Bremen, Germany
                                            taxonomic composition, spatial distribution, seasonal shifts, and ecological interactions
                        Reviewed by:
                      Jarone Pinhassi,      with heterotrophic bacterioplankton has remained largely uncharacterized. The North
         Linnaeus University, Sweden        Atlantic Aerosols and Marine Ecosystems Study (NAAMES) conducted four meridional
                            Eva Sintes,
                                            transects to characterize plankton ecosystems in the context of the annual bloom
          University of Vienna, Austria
                                            cycle. Using 16S rRNA gene-based community profiles we analyzed the temporal
                 *Correspondence:
                     Luis M. Bolaños        and spatial variation in plankton communities. Seasonality in phytoplankton and
           bolanosl@oregonstate.edu         bacterioplankton composition was apparent throughout the water column, with changes
                 Stephen Giovannoni
  Steve.giovannoni@oregonstate.edu          dependent on the hydrographic origin. From winter to spring in the subtropic and
                                            subpolar subregions, phytoplankton shifted from the predominance of cyanobacteria
                   Specialty section:       and picoeukaryotic green algae to diverse photosynthetic eukaryotes. By autumn,
         This article was submitted to
          Marine Ecosystem Ecology,         the subtropics were dominated by cyanobacteria, while a diverse array of eukaryotes
               a section of the journal     dominated the subpolar subregions. Bacterioplankton were also strongly influenced by
          Frontiers in Marine Science
                                            geographical subregions. SAR11, the most abundant bacteria in the surface ocean,
         Received: 30 October 2020
         Accepted: 07 January 2021
                                            displayed higher richness in the subtropics than the subpolar subregions. SAR11
        Published: 05 February 2021         subclades were differentially distributed between the two subregions. Subclades Ia.1
                             Citation:      and Ia.3 co-occurred in the subpolar subregion, while Ia.1 dominated the subtropics.
                Bolaños LM, Choi CJ,        In the subtropical subregion during the winter, the relative abundance of SAR11
   Worden AZ, Baetge N, Carlson CA
 and Giovannoni S (2021) Seasonality        subclades “II” and 1c.1 were elevated in the upper mesopelagic. In the winter, SAR202
          of the Microbial Community        subclades generally prevalent in the bathypelagic were also dominant members in
    Composition in the North Atlantic.
           Front. Mar. Sci. 8:624164.
                                            the upper mesopelagic zones. Co-varying network analysis confirmed the large-scale
    doi: 10.3389/fmars.2021.624164          geographical organization of the plankton communities and provided insights into the

Frontiers in Marine Science | www.frontiersin.org                                  1                                          February 2021 | Volume 8 | Article 624164
Bolaños et al.                                                                                                        North Atlantic Plankton Composition

                                            vertical distribution of bacterioplankton. This study represents the most comprehensive
                                            survey of microbial profiles in the western North Atlantic to date, revealing stark seasonal
                                            differences in composition and richness delimited by the biogeographical distribution of
                                            the planktonic communities.
                                            Keywords: North Atlantic Aerosols and Marine Ecosystems Study, phytoplankton community composition,
                                            bacterioplankton community composition, North Atlantic subregions, seasonal succession, amplicon sequence
                                            variants

INTRODUCTION                                                                     composition are likely, largely determined by variance in the
                                                                                 quality and bioavailability of DOM produced by phytoplankton
The phytoplankton spring bloom in the North Atlantic is                          (Aluwihare and Repeta, 1999; Meon and Kirchman, 2001).
the climax of an annual cycle driven by the seasonality of                       Variability in DOM composition may result not only from
physical, chemical and biological features (Sieracki et al., 1993;               differences in the DOM that distinct phytoplankton release,
Behrenfeld and Boss, 2018). This massive pulse in biological                     but also from food-web processes stimulated by phytoplankton
productivity is a key mediator of the strength of the biological                 community structure. Phytoplankton direct release, grazer-
carbon pump (Martin et al., 2011; Sanders et al., 2014). The                     mediated production, solubilization of sinking and detrital
phytoplankton spring bloom represents a pathway by which                         particles, and cell lysis by viral or bacterioplankton infection
atmospheric CO2 is biologically converted to organic matter and                  all affect the magnitude and quality of DOM production
subsequently exported vertically to depth via sinking particles,                 (Thornton, 2014; Carlson and Hansell, 2015). Bacterioplankton
vertically migrating zooplankton, and the physical mixing of                     communities are sensitive and respond to such variability in
suspended organic particles and dissolved organic matter (DOM)                   DOM composition (Massana et al., 2001; Carlson et al., 2002;
(Ducklow et al., 2001).                                                          Liu et al., 2020a). Indeed, microbial DOM remineralization
   A dynamic ecological system underlies the annual cycle                        experiments have demonstrated that the amendment of DOM
of phytoplankton biomass in the western North Atlantic.                          derived from distinct primary producers can differentially affect
Phytoplankton composition has been observed to undergo                           the responding bacterioplankton community (Nelson et al.,
major seasonal shifts (Choi et al., 2020; Kramer et al., 2020;                   2013; Wear et al., 2015b; Liu et al., 2020b). Coastal surveys
Yang et al., 2020). Communities dominated by cyanobacteria,                      observed that bacterioplankton responses to phytoplankton
prasinophytes and pelagophytes in the early winter give way                      blooms consisted of a succession of different phylogenetic
to a more diverse eukaryotic phytoplankton community in the                      groups driven by the availability of specific classes of
spring. Major contributors over this period include haptophytes,                 algal primary products (Teeling et al., 2012; Wear et al.,
diatoms, and prasinophytes (Bolaños et al., 2020). The magnitude                 2015a). As physicochemical gradients shape phytoplankton
and composition of springtime diversity captured depends on the                  communities, these studies collectively demonstrate that
successional stage of the phytoplankton bloom that is sampled,                   shifts in phytoplankton community composition can dictate
which is strongly influenced by both timing and location.                        bacterioplankton species succession on time scales as short as
Assessing the role of the spring phytoplankton bloom in the                      days (Wear et al., 2015a; Needham and Fuhrman, 2016). In
biological carbon pump and how it may change in future climate                   this analysis, we hypothesize that seasonal shifts and regional
scenarios requires better understanding of the composition,                      differences in phytoplankton communities through annual cycles
functioning, and interactions of the microbial community.                        shape the composition of heterotrophic bacterioplankton in
   Bacterioplankton composition in the surface waters of the                     the North Atlantic.
ocean is influenced by multiple environmental factors and                           The North Atlantic Aerosols and Marine Ecosystems Study
biological interactions (Bunse and Pinhassi, 2017). Seasonality                  (NAAMES) was designed to study the plankton ecosystem
of bacterioplankton has been well documented with inter-                         dynamics over four stages of the annual phytoplankton
annual time-series in different oceanic regions (Giovannoni                      productivity cycle: early winter (“winter transition”: November–
and Vergin, 2012; Cram et al., 2015). Transect surveys have                      December), early spring (early “accumulation phase”:
provided insights on how bacterioplankton assemblages are                        March–April), late spring (“climax transition”: May–June),
biogeographically defined (Milici et al., 2016), and vertical                    and early autumn (“depletion phase”: September) (Behrenfeld
profiles have shown that a high degree of bacterioplankton                       et al., 2019). Meridional transects sampled water masses
specialization exists in the water column macro- (Giovannoni                     originating from the Sargasso Sea, subtropical, temperate
et al., 1996; Field et al., 1997; DeLong et al., 2006; Treusch                   and subpolar subregions (Della Penna and Gaube, 2019).
et al., 2009) and micro-environments (Moeseneder et al., 2001;                   In this study, we demonstrate seasonality in microbial
Liu et al., 2018). Bacterioplankton community composition                        composition within the NAAMES region. A near complete
can be influenced by changes in phytoplankton composition,                       view of bacterioplankton and eukaryotic phytoplankton is
as demonstrated by a bloom study in which cultures of either                     provided by high-throughput amplicon sequencing of 16S rRNA
diatoms or dinoflagellates were inoculated into mesocosms                        genes of bacterioplankton and eukaryotic chloroplasts. Samples
(Camarena-Gómez et al., 2018). Shifts in bacterioplankton                        were collected from eight different depths spanning the euphotic

Frontiers in Marine Science | www.frontiersin.org                            2                                   February 2021 | Volume 8 | Article 624164
Bolaños et al.                                                                                              North Atlantic Plankton Composition

zone (5–100 m) and upper mesopelagic (150–300 m) at each                (Lane, 1991) and 338 RPL (50 -GCWGCCWCCCGTAGGWGT-
station. Ecological analyses of Amplicon Sequence Variants              30 ) (Daims et al., 1999; Vergin et al., 2013) primers attached
(ASVs) maximized the taxonomic resolution of the microbial              to Illumina overhang adapters (Illumina Inc.). These primers
community variation. Furthermore, ASV co-variability was                retrieve V1-V2 16S rRNA gene sequences from bacteria and
examined by network analysis to identify large-scale trends in          plastids of multiple phytoplankton lineages in one round of
microbial community structure.                                          amplification (Rappé et al., 1998). Libraries for each reaction
                                                                        product were constructed by attaching dual indices with the
                                                                        Nextera XT Index Kit (Illumina Inc.) using a second PCR
MATERIALS AND METHODS                                                   amplification (following manufacturers conditions). Library
                                                                        PCR size was confirmed in a Bioanalyzer DNA 1000 chip
Sampling and DNA Extraction                                             (Agilent, Santa Clara, CA, United States). All PCR reactions
Microbial biomass was sampled along the meridional transects            were purified using AMPure XP beads (Beckman Coulter,
of the four seasonal NAAMES field campaigns (Figure 1). In              Brea, CA, United States). Purified libraries were pooled in
early winter (NI; November 2015) and late spring (NII; May              equimolar concentrations for each campaign. Each pool was
2016), transect sampling covered the subpolar, temperate and            sequenced using the Illumina MiSeq platform (reagent kit
subtropical subregions. One station in subtropical waters in the        v.2; 2 × 250 PE; Illumina Inc.) at the Center for Genome
late spring (NII-S4) was sampled daily for 4 days, capturing a          Research and Biocomputing (Oregon State University, Corvallis,
local bloom resulting from mixed-layer stratification following         Oregon, United States).
a storm-induced deep-mixing event (Graff and Behrenfeld,
2018; Morison et al., 2019; Della Penna and Gaube, 2020).               Bioinformatics Analysis
In early autumn (NIII; September 2017), stations covered all            Primer sequences from de-multiplexed raw paired-end fastq
four subregions. During this field campaign, one station in the         files were cut using the CutAdapt software (Martin, 2011),
subpolar subregion (NIII-S6) was sampled daily for 4 days. In           removing 20 bases from forward files and 18 from reverse files
early spring (NIV; March–April 2018), all stations were located         that matched the 27F and 338 RPL primer lengths, respectively.
south of 45◦ N (Figure 1c), spanning the subtropical and Sargasso       Trimmed fastq files were quality filtered, dereplicated and
Sea subregions. Full description of NAAMES campaigns,                   merged with dada2 R package, version 1.2 (Callahan et al.,
locations of the stations, hydrographic and environmental data          2016) following the pipeline described in Bolaños et al. (2020).
can be found in Behrenfeld et al. (2019). At all stations, 8            Taxonomic assignment was determined aligning the sequences
nominal depths (5, 25, 50, 75, 100, 150, 200, and 300 m)                to the silva_nr_v123 database (Quast et al., 2012). ASVs assigned
were sampled at dawn from 10 L Niskin bottles affixed to                as plastid and cyanobacteria were extracted and placed in
a standard Conductivity-Temperature-Depth (CTD, Sea-Bird                curated reference trees (Sudek et al., 2015; Choi et al., 2017)
911+) rosette. At each depth, 4 L of water were collected into a        using Phyloassigner version v6.166 (Vergin et al., 2013). Of the
polypropylene carboy (rinsed 3 times with sample water prior            negative controls, only the SLB from NAAMES 4 (NIV-SLB_neg)
to collection). Seawater was then filtered inline using an eight-       retrieved amplicon sequences. We analyzed the prevalence
channel peristaltic pump at a flow-rate of 30 mL/min through            of potential contamination ASVs with the decontam package
a 0.22 µm pore-size Sterivex filter cartridge (polyethersulfone         (Davis et al., 2018). For phytoplankton community composition,
membrane, Millipore). One ml of sucrose lysis buffer (SLB) was          only samples shallower than 100 m that had ≥ 1,600 plastid
added to each cartridge and filters were stored at −80◦ C until         and cyanobacteria reads were considered. Bacterioplankton
further processing. DNA was extracted from the filters using            sequences of SAR202 clades were further classified using
a phenol:chloroform protocol (Giovannoni et al., 1996). DNA             Phyloassigner and custom phylogenetic trees (Vergin et al., 2013;
concentration was measured using Quant-iT assays (Invitrogen,           Landry et al., 2017). SAR11 sequences were assigned using a 16S
Carlsbad, CA) in a Qubit fluorometer. Negative controls                 rRNA full-length custom phylogenetic tree. Briefly, we retrieved
consisted of one ml aliquots of the SLB used to preserve the            all SAR11 sequences from SILVA database version SSU r138
samples for each cruise. DNA extractions, amplicon library              which fulfilled the following conditions: taxonomy = “SAR11
preparation, and sequencing of negative controls were performed         clade”, sequence length > 1,200 bp, sequence quality > 90.
using the same parameters and protocols used for the samples.           The retrieved set of sequences were aligned using Clustal W
Environmental data, as well as data for total chlorophyll a             (Thompson et al., 1994) and cropped to the last base pair of
concentration and bacterioplankton abundance, were obtained             the 27F primer and position 1,355. Sequences not spanning
from the publicly available SeaWiFS Bio-optical Archive and             this region were discarded. Final dataset was composed of
Storage System (SeaBASS)1 .                                             1,181 sequences including those used as outgroup. For the
                                                                        SAR202 tree, we referenced the phylogenetic tree shown in
Library Preparation and Amplicon                                        the Figure S1 supplementary data of Landry et al. (2017). We
Sequencing                                                              used the setupdb.pl script provided in Phyloassigner to create
The hypervariable V1-V2 region of the 16S rRNA gene was                 both phylogenetic databases. SAR11 (Supplementary Figure 1)
amplified with the 27F (50 -AGAGTTTGATCNTGGCTCAG-3)                     and SAR202 (Landry et al., 2017) phylogenetic databases along
                                                                        with a metadata table of the SAR11 sequences are available
1
    https://seabass.gsfc.nasa.gov/naames                                at https://www.github.com/lbolanos32/NAAMES_2020. For

Frontiers in Marine Science | www.frontiersin.org                   3                                  February 2021 | Volume 8 | Article 624164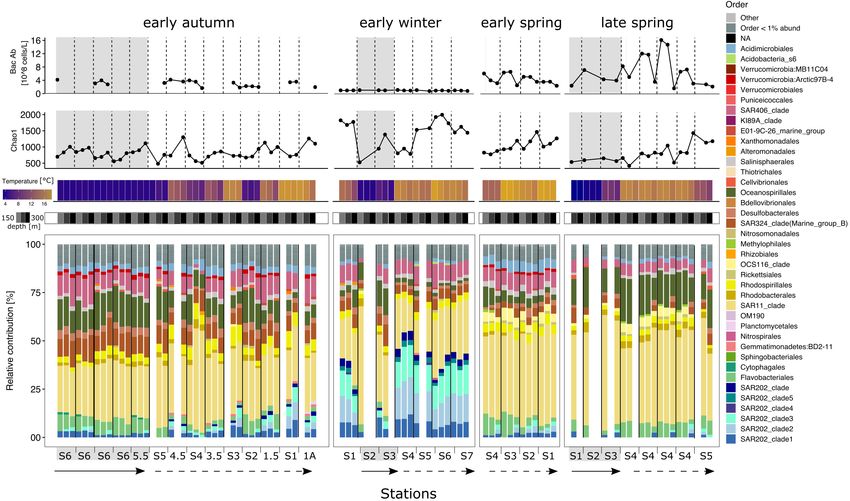
Bolaños et al.                                                                                                                North Atlantic Plankton Composition

  FIGURE 1 | Map of the sampled stations in the western North Atlantic overlapped with the subregions established by Mean Dynamic Topography analysis. Panels in
  clockwise direction: (a) early autumn (NAAMES field campaign NIII: September 2017) (b) early winter (NAAMES field campaign NI: November 2015) (c) early spring
  (NAAMES field campaign NIV: April-March 2018) (d) late spring (NAAMES field campaign NII: May 2016).

bacterioplankton analysis we included all amplicon datasets                         were constructed with the MDS method using the Bray-Curtis
composed of ≥ 15,000 reads.                                                         dissimilarities. Relative contribution barplots and supporting
   Hierarchical clustering (method = “ward.D2”) of the                              plots were done in R using ggplot2 (Wickham, 2016) and edited
phytoplankton fraction was performed with normalized counts                         in inkscape2 for aesthetics.
using the variance stabilizing transformation in DESEq2 (Love
et al., 2014) with fixed zero-tolerant geometric means. Chao1                       Network Analysis, Visualization, and
index and Bray-Curtis dissimilarities were calculated using                         Module Identification
rarefied datasets (1,600 for phytoplankton and 30,000 for                           Co-variation network analysis was performed using a reduced
bacterioplankton) with Phyloseq (McMurdie and Holmes, 2013).                        dataset to reduce the noise of low abundance ASVs. ASVs
For SAR11 richness estimation (Chao1), the dataset was rarefied
to the minimum in the sample (6,740 sequences). Ordinations                         2
                                                                                        www.inkscape.org

Frontiers in Marine Science | www.frontiersin.org                               4                                        February 2021 | Volume 8 | Article 624164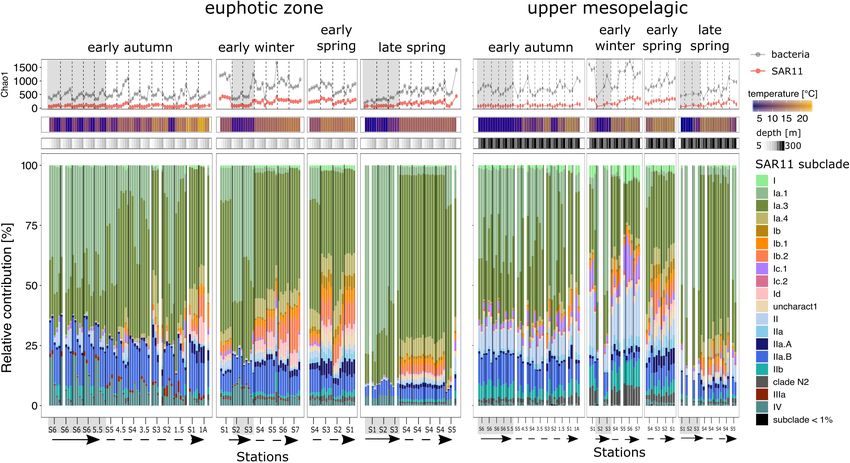
Bolaños et al. North Atlantic Plankton Composition
with less than 6 counts in at least 10% of the samples for the longitude, with stations 1 and 3 (43◦ W, 42◦ W, respectively) being
phytoplankton and in 40% of the samples for bacterioplankton more similar to each other than either with 2 and 4 (41◦ W,
were removed. After separately filtering the phytoplankton and 38◦ W, respectively).
bacterioplankton, both datasets were embedded in phyloseq Total chlorophyll a concentration was used as a proxy
objects and merged. The covarying network was calculated for phytoplankton biomass and remained below 2 mg/m3
with the SPIEC-EASI function in the SpiecEasi package v.1.0.7 throughout all sampled stations (Figure 3), with one exception.
(Kurtz et al., 2015) in R using the Meinshausen-Buhlmann In the subpolar late spring, surface chlorophyll a concentrations
Neighborhood Selection method (50 repetitions). Log2 of the were maximal, increasing southward from 56◦ N to 50◦ N.
mean of each ASV was calculated to represent the size of This pattern reflects the general timing phenomenon where
the nodes. The network visual representation was achieved the peak of the bloom shifts to later dates with increasing
with igraph v.1.0.1 (Csárdi and Nepusz, 2006) and ggnet latitude. Phytoplankton-derived 16S rRNA gene copies retrieved
v.0.1.0 (Butts, 2019) packages. Modules were defined using from the total dataset did not follow the same pattern as
the igraph fast greedy modularity optimization algorithm. The chlorophyll a concentrations. Low chlorophyll samples were
network visualization of each module was done using igraph not necessarily associated with a low number of phytoplankton
v.1.0.1 and ggnet v.0.1.0 packages. Supporting heatmap and gene copies, as shown by the early autumn subtropics
barplots were generated in R using ggplot2 and edited for (Figure 3). Of the total sequences recovered, the percentage
aesthetics in inkscape2 . represented by phytoplankton ranged from ∼5% in the subpolar
autumn and winter samples to a maximum of 60% in the
subtropical late spring.
RESULTS Patterns in phytoplankton ASV richness through the water
column differed at each station, likely due to the influences
Phytoplankton Composition Displays of subregional and seasonal conditions (Figure 3). During the
Subregional Seasonality subpolar late spring bloom, ASV richness increased in parallel
Profiles of phytoplankton community composition in the to chlorophyll a concentration. No other season showed a
euphotic zone (upper 100 m) were analyzed along the similar effect, indicating that spring bloom conditions allowed
meridional transects of the four campaigns, each capturing a diverse set of phytoplankton to succeed. The lowest richness
distinct stages of the phytoplankton productivity annual was observed in samples from both the subpolar early winter
cycle (Figure 1). Previous observations from the early winter and the surface (5–25 m) of the early autumn subtropics.
(Figure 1b) and late spring (Figure 1d) campaigns revealed The low ASV richness in these environments at these times
two distinctive phytoplankton communities (Bolaños et al., reflects different types of limiting conditions to phytoplankton.
2020). One group was characterized as subpolar for samples In the subpolar early winter, low temperature, deep mixing,
collected in the subpolar and temperate subregions, the other and low light may restrict the range of phytoplankton species
as subtropical for samples collected in the subtropical and that can thrive. Comparatively, in the thermally stratified
Gulf stream-Sargasso Sea subregions. The present study adds water column characteristic of the early autumn subtropics,
the analysis of phytoplankton composition datasets from nutrient depletion may be a more influential factor that
the early autumn (Figure 1a) and early spring (Figure 1c). skews community composition toward groups better adapted to
Clustering based on the ASV profiles revealed that early oligotrophic conditions.
spring and early autumn phytoplankton communities Subpolar phytoplankton communities shifted sharply
generally differentiated into the two groups matching the through seasons. In early autumn, a diverse set of eukaryotic
previously described subpolar and subtropical community phytoplankton, including cryptophytes, prymnesiophytes,
types (Supplementary Figure 2). However, the early autumn pelagophytes, and bacillariophytes dominated the communities.
subtropical samples did not cluster with the other seasons from The remaining sequences were represented by cyanobacteria,
the subtropical subregion, instead clustering more closely to the specifically Synechococcus ecotypes I and IV. Early winter
subpolar grouping. was dominated by Synechococcus ecotypes I and IV and
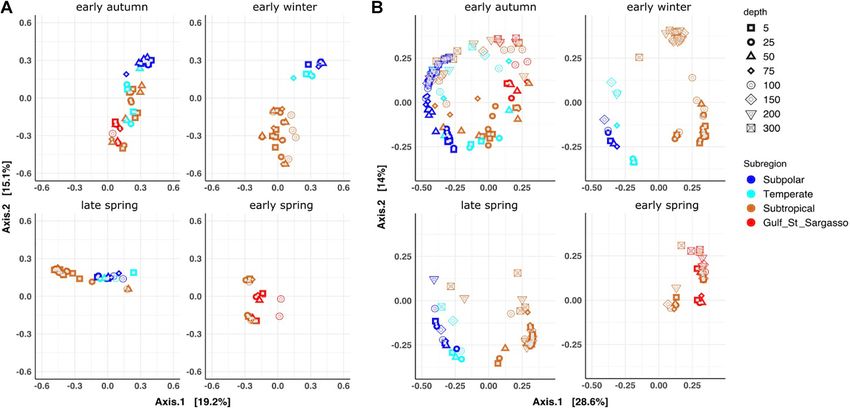
Multidimensional scaling (MDS) based on Bray-Curtis prasinophytes. During the late spring bloom, cyanobacteria
dissimilarities (beta diversity) supported the observed clustering relative abundances decreased, while eukaryotic phytoplankton
pattern in phytoplankton surface communities, resolving further dominated and were particularly represented by haptophytes,
details of each campaign (Figure 2A and Supplementary rappemonads, prasinophytes, and bacillariophytes.
Figure 3). In early autumn and early winter, sample clustering Subtropical phytoplankton communities displayed seasonal
followed a north to south organization, represented by the patterns. Cyanobacteria dominated in the early autumn;
second axis (Figure 2A). Early autumn samples showed a Prochlorococcus contributions made up to 95% of the
gradient of latitudinal distribution with some overlaps between phytoplankton reads at the two most southern stations of
the subtropical and subpolar communities. During early winter, the subregion. Prochlorococcus dominance decreased northward,
a larger separation clearly distinguished the subpolar and while the relative abundance of Synechococcus clades I and IV
subtropical communities. The latitudinal ordination observed in increased. In early autumn, eukaryotic sequences were most
the early autumn and early winter communities was shifted in pronounced at depths greater than 25 m and were primarily
the early spring. Subtropical early spring samples organized by composed of prasinophytes. In early winter, prasinophytes
Frontiers in Marine Science | www.frontiersin.org 5 February 2021 | Volume 8 | Article 624164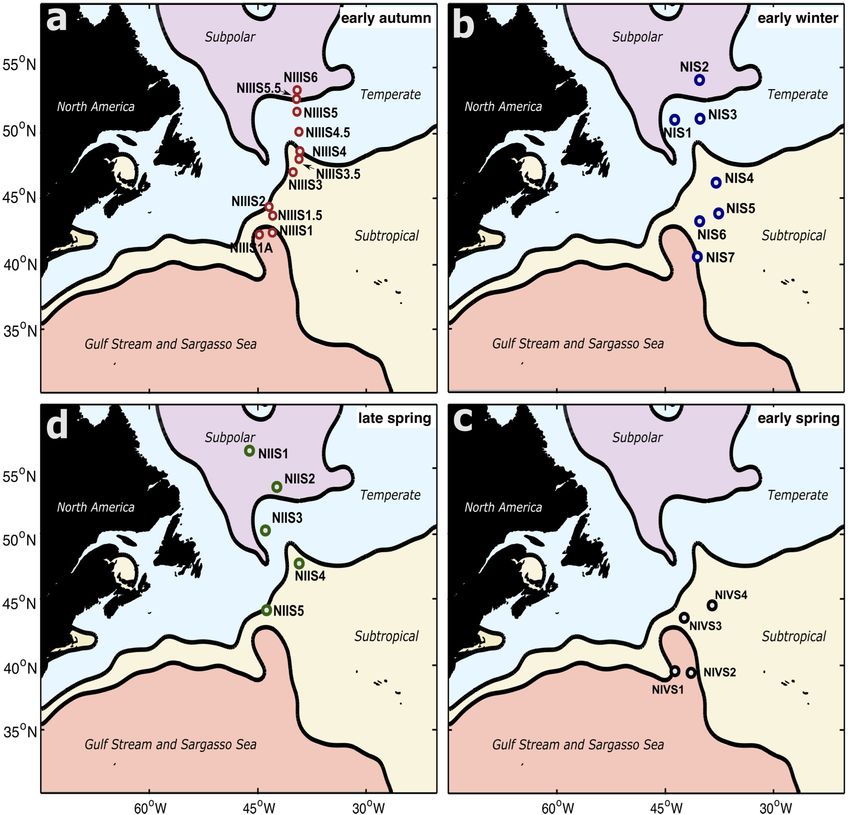
Bolaños et al.                                                                                                                    North Atlantic Plankton Composition

  FIGURE 2 | Multidimensional scaling (MDS) ordination based on Bray-Curtis dissimilarities (A) Phytoplankton fraction of the datasets (0–100 m) (B) Bacterioplankton
  fraction of the datasets (0–300 m). Ordinations were divided in four panels representing each of the sampled seasons (clockwise: early autumn, early winter, early
  spring, late spring). Datasets in both panels are colored based on the MDT subregion.

increased relative to early autumn throughout the euphotic                            Bacterioplankton Community
zone and, with cyanobacteria, dominated the communities.                              Composition
The cyanobacterial fraction at this time was dominated by                             Bacterioplankton profiles spanning the surface 300 m were
Prochlorococcus HL l and Synechococcus IV. In the early spring,                       analyzed by subregions and seasons to assess whether or not
Synechococcus (clades II and IV) and prasinophytes dominated,                         similar spatiotemporal patterns exist between phytoplankton
but bacillariophytes and prymnesiophytes increased to comprise                        and bacterioplankton community composition (Figure 2).
up to 25% of the ASVs. In the late spring, the two stations                           MDS ordination, based on Bray-Curtis dissimilarities, showed
that were sampled in the subtropical subregion had distinct                           that bacterioplankton communities geographically clustered
communities from each other. NII-S4 was a unique station in                           in a similar pattern as the phytoplankton communities.
that it was homogeneously mixed to > 250 m upon the first day                         Subtropical and Gulf stream – Sargasso Sea communities
of occupation and stratified to < 50 m over the next 4 days of                        clustered together (i.e., subtropical community), while
occupation. As the water column stratified at NII-S4, the relative                    subpolar and temperate communities clustered together
abundance of phytoplankton sequences became dominated                                 (i.e., subpolar community) (Figure 2B and Supplementary
by prasinophytes and diatoms, both of which increased in cell                         Figure 4). As expected, bacterioplankton communities
number. In contrast, the subtropical station NII-S5, which                            were structured by depth at almost all seasons and stations,
was thermally stable and stratified, showed an increase in the                        with samples from the euphotic zone (
Bolaños et al.                                                                                                                        North Atlantic Plankton Composition

  FIGURE 3 | Environmental metadata and stacked bar plots of the taxonomic relative contributions to the phytoplankton fraction for each station within each
  seasonal campaign. Top three panels: Chlorophyll a concentration (uppermost), phytoplankton relative contribution to the total sequences (middle) and Chao 1
  richness (bottom). Data points in the three line graphs are aligned to the phytoplankton community composition representation below. Bottom panel: stacked barplot
  representing the relative contributions of the different taxonomic groups to the phytoplankton fraction. Bars are organized by station from left to right in a north to
  south direction indicated by the straight arrow (subpolar) and the dashed arrow (subpolar), except early winter where S2 was the most northern station. Only depths
  5–100 m were analyzed and plotted for the phytoplankton fractions. Within each station, depths are organized in a descending order from 5 to 100 m in a left to right
  direction. Blank columns represent samples that did not overcome the minimal sequences threshold or where sample failed to generate amplicon sequences.
  Temperature and depth heatmap cells and data points in the three line charts correspond to the sample represented by the aligned barplot below these. Gray
  background shading indicates that the profile is biologically categorized as subpolar (physically located in the subpolar and temperate), while no shades represents
  subtropical (physically located in the subtropical and Sargasso Sea).

deep mixing event (mixed layer depth of > 250 m),                                          The SAR11 clade was the dominant fraction of the
mentioned previously.                                                                   bacterioplankton community across space and time (Figures 4–
   Bacterioplankton abundance (cells/L) near the surface (5                             6). However, SAR11 ASV richness was lower in the subpolar
and 25 m) was lower in the early winter and early spring                                subregion compared to the subtropics, following the total
compared to late spring and early autumn (Figure 4).                                    bacterioplankton abundance (Figures 4, 5) and richness
Bacterioplankton ASV richness was lower in subpolar subregions                          (Figure 6). SAR11 subclades, thought to be ecotypes with
than subtropical subregions (Figure 4). Seasonality and latitude                        specialized adaptations, displayed different spatiotemporal
influenced richness patterns throughout the water column                                distributions in the euphotic zone and the upper mesopelagic
for both subregions. In early autumn, all stations displayed                            (Figure 6). Subclades Ia.1 and Ia.3 dominated the community in
similar richness profiles to each other, increasing gradually                           the euphotic zone through most seasons, with clear subregional
with depth. Early winter displayed a different pattern where                            differences in relative abundances. SAR11 subclade Ia.1 was
subtropical communities showed the highest richness of all                              co-occurrent with Ia.3 in the subpolar subregion regardless
samples, especially in the upper mesopelagic. In contrast, the                          of the season, while the relative contribution of subclade Ia.3
early winter subpolar stations had the lowest richness. The two                         dominated throughout the subtropics. In the subpolar subregion,
most northern subtropical stations in the early spring showed                           subclades IIa.B and IV made the rest of the SAR11 fraction. These
constant richness throughout the water column, while richness                           subclades showed a decreasing contribution from more than 30%
increased with depth at the southern stations. In the late spring,                      of the SAR11 clade in the early autumn to less than 10% in the
richness increased southward and followed the phytoplankton                             late spring, when Ia.1 and I.a3 dominated the subpolar euphotic
bloom progression.                                                                      zone. Throughout the year in the subtropics, multiple subclades

Frontiers in Marine Science | www.frontiersin.org                                   7                                           February 2021 | Volume 8 | Article 624164
Bolaños et al.                                                                                                                      North Atlantic Plankton Composition

  FIGURE 4 | Environmental metadata and stacked bar plots of the taxonomic relative contributions to the bacterioplankton fraction for each station within each
  seasonal campaign in the euphotic zone. Top two panels: bacterioplankton abundance and Chao 1 richness. Temperature and depth heatmap cells and data points
  in the three line charts are aligned to the bacteria community composition representation below. Base barplots depict the relative contributions of the different
  taxonomic groups within the bacterioplankton fraction. Bars are organized by station from left to right in a north to south direction indicated by the straight arrow
  (subpolar) and the dashed arrow (subpolar), except early winter where S2 was the most northern station. Depths 5–100 m were analyzed and plotted for the
  bacterioplankton fractions. Within each station, depths are organized in a descending order from 5 to 100 m following a left to right direction. Blank columns
  represent samples that did not overcame the minimal sequences threshold or which sample was unsuccessful to generate amplicon sequences. Gray background
  shading indicates that the profile is biologically categorized as subpolar, while no shades represents subtropical.

including Ia.4, Ib.1, Ib.2, Id, IIa.A, and IIa.B accompanied the                       abundant ASVs after SAR11 in their relative contributions
dominant Ia.1. Of these subclades, Ib.1 and Ib.2 were the most                         to total bacterioplankton. However, SAR202 became an
sensitive to seasonal changes, being abundant in early winter and                      abundant contributor at subtropical stations in the winter,
spring and then decreasing in the autumn to a negligible fraction                      making up to 53% of the total sequences (300 m, NI-S4;
of the SAR11 clade.                                                                    Figure 5). SAR202 sharply increased in depths greater than
    Subclades Ia.1 and Ia.3 dominated the upper mesopelagic and                        100 m, but with shifting subclade composition (Figures 4, 5).
displayed similar ratios between subregions. In early autumn,                          For example, SAR202 clade 1 dominated in the euphotic
the SAR11 composition across the subpolar and subtropical                              zone, while SAR202 clades 2 and 3 became more prominent
regions were homogenous. Notably, sequences belonging to the                           in the upper mesopelagic (Figures 4, 5). Additionally, the
subclade II made more than 30% of the SAR11 clade in the upper                         absence of OCS116 and the reduction of Oceanospirillales
mesopelagic. By the early winter in the subtropics, subclade II                        in the upper mesopelagic contributed to the sharp shift in
increased up to 40%. Subclade 1c.1 was also observed to increase                       vertical community composition in the subtropics during
to more than 10% at this time within the upper mesopelagic.                            the early winter.
In the early and late spring, SAR11 composition was similar                               At the most southern stations in early spring, NIV-S1 and
between the upper mesopelagic and the euphotic zone. In station                        NIV-S2, Flavobacteriales made up to 25% of the community
NIV-S3 of early spring, the distribution of SAR11 subclade                             in the surface 50 m, but dropped drastically at depths deeper
relative abundance was uniform from 5 to 300, while at stations                        than the euphotic zone. At stations NIV-S3 and NIV-S4,
1 and 2, clade II relative abundance gradually increased with                          Flavobacteriales were distributed homogenously throughout
depth. At NII-S4 in the late spring, an initially homogenous                           the water column. During the late spring, Oceanospirillales
SAR11 composition through the water column changed, with the                           composed between 10 and 35% of the community at all stations
relative contribution of subclades II increasing to the end of the                     and were the major responders to the increase in phytoplankton
occupation as the water column stratified.                                             biomass in the euphotic zone, but were also prevalent in the upper
    Over the annual cycle in both subregions, bacterioplankton                         mesopelagic. In the early autumn, large gradients in community
taxa within Flavobacteriales, Oceanospirilalles, SAR406,                               structure across depth were observed. For example, at subpolar
Acidomicrobiales, and Rhodospirillales, were the next most                             NIII-S6, Desulfobacterales and SAR324 increased from being

Frontiers in Marine Science | www.frontiersin.org                                  8                                          February 2021 | Volume 8 | Article 624164
Bolaños et al. North Atlantic Plankton Composition
FIGURE 5 | Environmental metadata and stacked bar plots of the taxonomic relative contributions to the bacterioplankton fraction for each station within each
seasonal campaign in the upper mesopelagic. Top two panels: bacterioplankton abundance and Chao 1 richness. Temperature and depth heatmap cells and data
points in the three line charts are aligned to the bacteria community composition representation below. Base bar plots depict the relative contributions of the different
taxonomic groups within the bacterioplankton fraction. Bars are organized by station from left to right in a north to south direction indicated by the straight arrow
(subpolar) and the dashed arrow (subpolar), except early winter where S2 was the most northern station. Within each station, depths are organized in a descending
order from 150 to 300 m following a left to right direction. Blank columns represent samples that did not overcame the minimal sequences threshold or which
sample was unsuccessful to generate amplicon sequences. Gray background shading indicates that the profile is biologically categorized as subpolar, while no
shades represents subtropical.
nearly absent in the surface 25 m to together contributing up to only three modules (4, 2, and 9). These modules dominated by
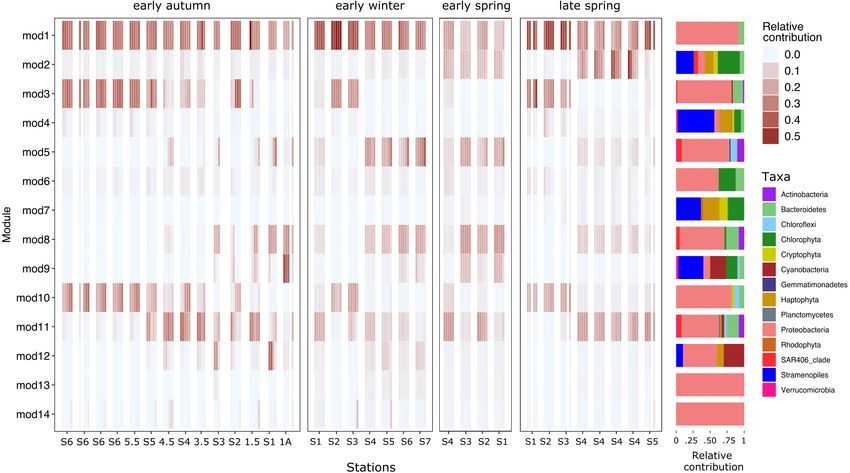
17% of the sequences at 300 m. Notably, from the early spring to phytoplankton ASVs were strongly associated with subregions.
the early autumn, SAR202 were marginalized or even absent in Phytoplankton covarying module 4 was mainly constrained
the euphotic zone and at 150 and 200 m, but made up between 5 to the subpolar subregion and linked with bacterioplankton
and 9% of the community at 300 m. ASVs related to Oceanospirillales, SAR11 subclade II, and
Verrucomicrobia (Figure 8, Supplementary Figure 6, and
Supplementary Table 1). Phytoplankton covarying module 2
Co-variation Network Analysis and was associated to the subtropical subregion and linked with
Modularity of ASVs bacterioplankton ASVs related to Flavobacteriales, SAR406, and
To identify patterns of co-variation among ASVs that might SAR11 subclade II (Figure 8, Supplementary Figure 6, and
indicate interactions among planktonic taxa or among sets of taxa Supplementary Table 1). Phytoplankton covarying Module 9 was
with adaptations to very similar environments, we constructed associated with the most southern stations under the influence of
a network using the most abundant 292 bacterioplankton the Gulf Stream and the Sargasso Sea. In this module we found
(representing 71.2% of the total bacterioplankton reads) and 128 bacteria ASVs belonging to SAR202 clade 1 and SAR86 (Figure 8,
phytoplankton (representing 92.1% of the total phytoplankton Supplementary Figure 6, and Supplementary Table 1). This
reads) ASVs from samples of the upper 100 m of the water distinction between subtropical and Sargasso Sea phytoplankton
column (Figure 7 and Supplementary Figure 5). Overall, the dominated modules indicates a southern ecological boundary
network had a clustering coefficient of 0.1414 indicating it is not captured by the ordination (Figure 2B) or clustering
a sparse network and a graph average degree of 13.295 (total (Supplementary Figure 2). The more highly resolved sampling of
edges/total nodes). the southern latitudes in early spring and early autumn compared
The co-varying network was compartmentalized into 14 to our previous analysis of the early winter and late spring
modules (Figures 7, 8 and Supplementary Figure S5). Sixty (Bolaños et al., 2020) helped to define the boundary in the
five percent of the phytoplankton ASVs could be found in network analysis.
Frontiers in Marine Science | www.frontiersin.org 9 February 2021 | Volume 8 | Article 624164Bolaños et al. North Atlantic Plankton Composition FIGURE 6 | SAR11 richness (Chao1) and stacked bar plots of the subclades relative contributions for each station within each seasonal campaign. Top panel represent the richness (Chao 1 index) of the bacterioplankton fraction (gray line) and the specific to SAR11 ASVs (red line). Base barplots depict the relative contributions of the SAR11 subclades in the euphotic zone (left side) and the upper mesopelagic (right side). Bars are organized by station from left to right in a north to south direction indicated by the straight arrow (subpolar) and the dashed arrow (subpolar), except early winter where S2 was the most northern station. Within each station, depths are organized in a descending order. Blank columns represent samples that did not overcame the minimal sequences threshold or which sample was unsuccessful to generate amplicon sequences. Gray background shading indicates that the profile is biologically categorized as subpolar, while no shades represents subtropical. FIGURE 7 | Covariation network of the 128 phytoplankton and 292 bacterioplankton most abundant ASVs and modularity analysis. (A) Visual representation of the non-directed ASVs covariation network. Nodes are color-coded by phylum. (B) Visual representation of the non-directed ASVs covariation network with the nodes color-coded by module. Size of the nodes in both panels depicts the log2 of the represented ASV average. Modules dominated by bacterioplankton ASVs also showed in early autumn. These were mainly composed of Proteobacteria subregional and seasonal differences in addition to differences and Bacteroidetes. Subtropical modules 5, 8, and 11 were according to depth (Figures 7, 8). Modules 3 and 10 were present in all four seasons. Modules 5 and 8 followed similar found in the subpolar subregion and some subtropical stations distributions, except in early autumn. Module 11 was detected Frontiers in Marine Science | www.frontiersin.org 10 February 2021 | Volume 8 | Article 624164
Bolaños et al.                                                                                                                   North Atlantic Plankton Composition

  FIGURE 8 | Heatmap depicting the relative contributions in the euphotic zone of each network’s module to the total dataset. Modules are organized in sequential
  numbers from top to bottom in the x-axis. Samples are displayed in the y-axis; organized following the same order as in Figures 3–6. Only ASVs from the upper 100
  m samples were analyzed. The percentage represented by the heatmap is restricted to the total reads of ASVs used in the network analysis. Aligned barplots on the
  right side of the heatmap represent the taxonomic relative contribution of the ASVs to the module.

in subpolar samples and one of the few that overlapped                                Study (BATS), Tara Oceans (Karsenti et al., 2011; Sunagawa
between geographical subregions. Two ubiquitous modules                               et al., 2020) and Malaspina (Duarte, 2015). The NAAMES field
were found: module 1, composed mainly of abundant SAR11                               campaign provided the most comprehensive temporal and spatial
ASVs, and module 6, which contained Micrococcus, Bathycoccus,                         view of the microbial communities for this region between 39
and Alphaproteobacteria AEGAN-169 ASVs (Supplementary                                 and 56◦ N. The sequencing strategy we selected targeted the
Figure 6 and Supplementary Table 1).                                                  16S rRNA V1-V2 hypervariable region and provided information
   While the observed network modularity indicates a strong                           on the relative abundance of heterotrophic bacterioplankton,
influence of geographical subregions on the phytoplankton                             cyanobacteria and eukaryotic phytoplankton (by means of the
community composition, other factors likely influence the                             plastid 16S rRNA gene) in a single experiment.
high degree of variability between bacterioplankton modules.                             Our previous analysis revealed a strong correlation between
Phytoplankton underwent major changes over the annual cycle                           phytoplankton communities and the hydrographic origin of
in the subpolar subregion, but these changes could be tracked                         the water masses where the samples were collected (Bolaños
to a single covarying set of ASVs that were grouped in module                         et al., 2020). Although seasonality generates a sharp shift in
4. Comparatively, the dominant bacterioplankton modules in                            phytoplankton composition, communities are constrained by the
the subpolar subregion could also be found in the subtropical                         environmental conditions specific to the subregions including
stations. Bacterioplankton assemblages are not only associated to                     the degree of stratification, availability of macronutrients
season or subregion but also with depth (Figure 8).                                   and temperature regime. ASV co-variation network analysis
                                                                                      confirmed the strong boundaries that define the communities
                                                                                      in this region. Cyanobacteria, prasinophytes and stramenopiles
DISCUSSION                                                                            were the phytoplankton groups that shifted the most between
                                                                                      seasons. Research based on pigment data extended this
The temperate and subpolar latitudes of the western North                             observation to Dinoflagellates, which were not efficiently detected
Atlantic are dynamic regions that have been under-sampled                             by the PCR primers used previously (Kramer et al., 2020).
compared to the eastern region of the basin (Behrenfeld et al.,                       Prasinophytes (green algae picoeukaryotes) had high relative
2019). There is a paucity of microbial community structure data                       abundance during winter and spring (early and late) but declined
for the western North Atlantic outside of those provided by the                       in autumn. Photosynthetic picoeukaryote communities have
large-scale survey projects such as Bermuda Atlantic Time-series                      been shown to be sensitive to temperature, light intensity and

Frontiers in Marine Science | www.frontiersin.org                                11                                        February 2021 | Volume 8 | Article 624164
Bolaños et al. North Atlantic Plankton Composition nutrient concentrations (Kirkham et al., 2011). Furthermore, potential from the surface into the mesopelagic at latitudes that increasing numbers of cyanobacteria and their expansion to also experience deep winter convection (Baetge et al., 2020). higher latitudes are predicted as a consequence of global The differences in DOC accumulation between regions with warming (Morán et al., 2010; Flombaum et al., 2013). The distinct phytoplankton communities may lead to differences contributions of cyanobacteria reported in this study suggests in the quality of organic matter exported to the mesopelagic, that they may be more competitive than prasinophytes in the contributing to the observed response of SAR202 during or oligotrophic and highly stratified subtropical conditions that shortly following deep winter convection in the subtropical realm characterized the most southern autumn NAAMES stations (Treusch et al., 2009). (∼42–47◦ N). One biological characteristic that might favor In autumn, SAR324 and Desulfobacterales increased in cyanobacteria is the high surface area to volume ratio of the upper mesopelagic. SAR324 are well-known deep ocean these cells that can make them more competitive at low chemolithotrophs that have C1 metabolism and a particle- nutrient concentrations. associated lifestyle (Swan et al., 2011), while Desulfobacterales Our results add support to the notion that the seasonal are sulfate-reducing strict anaerobes. Both taxa are well-known succession in ocean bacteria is constrained by the biogeographical inhabitants of the dark ocean, but seasonality has not been distribution of the communities (Bunse and Pinhassi, 2017), documented in these bacteria (Treusch et al., 2009; Nelson et al., but also shows that the succession manifests differently between 2014; Yilmaz et al., 2016). the euphotic and the upper mesopelagic zones within our In spring, bacterioplankton communities transitioned with study region. The euphotic and upper mesopelagic zones depth without the sharp shifts observed in other seasons. were dominated by SAR11 but the dynamics of SAR11 These results may suggest that primary production from the subclades differed between subpolar and subtropical subregions. euphotic zone creates a gradient of DOM flux. In spring, The subpolar SAR11 composition was dominated by the when primary production was greatest, Flavobacteriales and co-occurrence of subclades Ia.1 and Ia.3 in all seasons, Oceanospirillales had a high relative contribution in the euphotic while only Ia.3 was predominant in the subtropics. It is zone. The increase in abundance of these taxa concomitant to well documented that subclade Ia.1 is associated with cold phytoplankton bloom progression has been reported in other environments and Ia.3 to temperate and tropical (Brown systems, including the northern Antarctic peninsula (Signori et al., 2012; Eren et al., 2013). However, the co-occurrence et al., 2018) and Antarctic islands in the Southern Indian Ocean in the subpolar subregion suggests that subclade Ia.3, or (Landa et al., 2016). This suggests that these bacteria might specific phylotyopes within it (Delmont et al., 2019), are respond to the DOM produced as a result of numerous food adapted to a broader range of temperatures. In the subtropics, web processes that occur during the periods of high primary SAR11 subclades followed a similar spatiotemporal dynamic production. During this season in the subpolar subregion as previously reported at BATS site (Carlson et al., 2009; (highest chlorophyll concentrations), bacterioplankton richness Vergin et al., 2013; Giovannoni, 2017). For example, subclade represented by the Chao1 index reached the lowest values, Ib peaked in the euphotic zone during the period of water while bacterioplankton abundance, phytoplankton biomass, and column instability from early winter to spring, while subclade phytoplankton richness were at their highest values. This II dominated the upper mesopelagic zone following deep suggests that during the peak of primary productivity, specific convective overturn in the late winter and early spring. copiotrophic Rhodobacterales and Flavobacteriales may be Comparatively, SAR11 composition in the subpolar subregion responding to the flux of fresh labile DOM, outcompeting other was less dynamic and diverse: subclades Ia.1 and Ia.3 dominated, community members as observed during phytoplankton blooms with subclades IIa.B and IV comprising the remainder of the (Buchan et al., 2014; Luria et al., 2017). SAR11 fraction and varying only slightly in relative contributions Biotic interactions are increasingly recognized as a major throughout the seasons. influence on planktonic community composition (Lima- During the subtropical autumn and winter, upper mesopelagic Mendez et al., 2015). We analyzed the organization of the bacterioplankton differentiated sharply from the euphotic communities in co-varying modules using a network analysis. communities, while in the spring (early and late) community The network delineated 14 covarying modules among the most composition transitioned more gradually through depth. The abundant phytoplankton and bacteria ASVs. These modules largest difference between euphotic and upper mesopelagic reflected subregional and seasonal variation and were congruent communities was in the early winter subtropics. At these stations, with the results of ordination and community clustering. SAR202 subclades 2 and 3, which are commonly found in the However, the modules were insufficient to resolve potential bathypelagic (Saw et al., 2020), dominated the upper mesopelagic phytoplankton-bacteria interactions at a local spatial and zone. SAR202 genomes encode for paralogs hypothesized to temporal scales. The tightly varying phytoplankton communities oxidize remnant recalcitrant DOM (Landry et al., 2017; Saw influenced by subregion contrasted to the atomized co-varying et al., 2020). In the subtropical water masses, where diatoms are bacterioplankton modules, which showed an additional set of displaced by cyanobacteria during highly stratified period, net patterns, mostly influenced by depth. This evidence may suggest DOC accumulation is observed (Hansell et al., 2009; Carlson that bacterioplankton are more sensitive to local gradients or et al., 2010; Romera-Castillo et al., 2016). In the subtropics a disturbances, or that the diversity of heterotrophs is arranged in greater percentage of net community production is partitioned additional dimensions by factors such as DOM quality and of as accumulating DOC, which can lead to a greater export flux from food web sources. Frontiers in Marine Science | www.frontiersin.org 12 February 2021 | Volume 8 | Article 624164
Bolaños et al.                                                                                                                             North Atlantic Plankton Composition

    Our results provide evidence of the profound effect of water                             SUPPLEMENTARY MATERIAL
mass origin and inherent physical/chemical features on the
seasonal dynamics of plankton community composition. In                                      The Supplementary Material for this article can be found
previous work phytoplankton communities have been ordered in                                 online at: https://www.frontiersin.org/articles/10.3389/fmars.
reference to large-scale subregions of the North Atlantic (Bolaños                           2021.624164/full#supplementary-material
et al., 2020). Although bacterioplankton composition is restricted
by the same ecological borders as phytoplankton, seasonal                                    Supplementary Figure 1 | SAR11 16S rRNA Phylogenetic tree. Maximum
                                                                                             likelihood phylogeny used as the database reference for the taxonomic placement
fluctuations in the water column and primary production                                      of the retrieved SAR11 ASVs. Subclades are labeled following Giovannoni (2017)
determine how the community transitions are shaped through                                   and Haro-Moreno et al. (2020) classification.
depth. This effect creates a dynamic system, sensitive to
                                                                                             Supplementary Figure 2 | Hierarchical clustering of the samples based on the
phytoplankton community changes but not strictly correlated in
                                                                                             phytoplankton ASV profiles. ASVs dendrogram (top) defined by hierarchical
the same temporal scale.                                                                     clustering of the phytoplankton fraction in the euphotic zone (5–100 m). Heatmap
                                                                                             (bottom) represents the relative contribution of each major taxonomic group to the
                                                                                             phytoplankton fraction. Based on the dendogram and the samples origin
DATA AVAILABILITY STATEMENT                                                                  subgroups were defined as indicated by the dashed lines in the heatmap. From
                                                                                             left to right: subtropical autumn, SA (subtropical autumn) DCM (Deep-chlorophyll
Amplicon sequence datasets presented in this study have                                      maximum), subpolar autumn, subpolar winter, subpolar late spring, subtropical
                                                                                             late spring, subtropical winter, and subtropical early spring.
been deposited in NCBI SRA database under the BioProject
identifier PRJNA627189.                                                                      Supplementary Figure 3 | Phytoplankton multidimensional scaling (MDS)
                                                                                             ordination based on Bray-Curtis dissimilarities. Top panel represents the original
                                                                                             MDS without the seasonal subdivision presented in Figure 2A (4-panel split).
AUTHOR CONTRIBUTIONS                                                                         Datasets are colored based on the MDT subregion. Bottom panel represents the
                                                                                             original MDS color-coded by the determined biological division of the subregions
                                                                                             (Subpolar and Subtropical). In both panels, 50% ellipses are depicted around the
LB and SG conceived the study and experimental design,
                                                                                             centroids of the sample categories. Below we presented the stress analysis of the
collected the samples, and generated the sequence data. LB, CC,                              ordination and the Permutational Multivariate Analysis of Variance that support the
and NB analyzed the data. All authors contributed to the writing,                            described differences between subregions and seasons for the phytoplankton.
revision, and editing of the final manuscript.
                                                                                             Supplementary Figure 4 | Bacterioplankton multidimensional scaling (MDS)
                                                                                             ordination based on Bray-Curtis dissimilarities. Top panel represents the original
                                                                                             MDS without the seasonal subdivision presented in Figure 2B (4-panel split).
FUNDING                                                                                      Datasets are colored based on the MDT subregion. Bottom panel represents the
                                                                                             original MDS color-coded by the determined biological division of the subregions
This research was supported by the NASA grant no.                                            (Subpolar and Subtropical). In both panels, 50% ellipses are depicted around the
NNX15AE70G to SG, award NSF OCE-157943 to CC and NSF                                         centroids of the sample categories. Below we presented the stress analysis of the
Dimensions Collaborative Research grant: Unraveling thiamin                                  ordination and the Permutational Multivariate Analysis of Variance that support the
                                                                                             described differences between subregions and seasons for the phytoplankton.
cycling complexity and impacts on microbial networks to SG
(DEB-1639033), and AW (DEB-1638928). This work was funded                                    Supplementary Figure 5 | Covariation network of the 128 phytoplankton and
by Simons Foundation International as part of the BIOS-SCOPE                                 292 bacterioplankton most abundant ASVs and modularity analysis color coded
                                                                                             by Order. Visual representation of the non-directed ASVs covariation network.
initiative (SG).
                                                                                             Nodes are color-coded by Order or the lowest taxonomical hierarchy available in
                                                                                             case order was not determined. Congruently to Figure 7, the visual
                                                                                             representation of the non-directed ASVs covariation network with the color-coded
ACKNOWLEDGMENTS                                                                              nodes by module is presented in the bottom panel. Size of the nodes in both
                                                                                             panels depicts the log2 of the represented ASV average.
We thank Mark Dasenko and the members of the Oregon
                                                                                             Supplementary Figure 6 | Non-directed covariation networks of each of the
State University Center for Genome Research and Biocomputing                                 modules defined by the modularity analysis of the global network. Nodes are color
(CGRB) for library preparation, sequencing and maintenance                                   coded by phylum and labeled using the name of the ASVs these represent and
of the computational infrastructure. We thank Captains A.                                    the higher taxonomy resolution (full taxonomy classification available in
Lund and D. Bergeron and R/V Atlantis crew. We thank                                         Supplementary Table 1).
Michael Behrenfeld for leading NAAMES. We thank NAAMES                                       Supplementary Table 1 | Taxonomy table of the ASVs used in the
participants for core data and their feedback to this study.                                 covariation network.

REFERENCES                                                                                      the western North Atlantic. Front. Mar. Sci. 7:227. doi: 10.3389/fmars.2020.
                                                                                                00227
Aluwihare, L. I., and Repeta, D. J. (1999). A comparison of the chemical                     Behrenfeld, M. J., and Boss, E. S. (2018). Student’s tutorial on bloom hypotheses
   characteristics of oceanic DOM and extracellular DOM produced by marine                      in the context of phytoplankton annual cycles. Glob. Chang. Biol. 24, 55–77.
   algae. Mar. Ecol. Prog. Ser. 186, 105–117. doi: 10.3354/meps186105                           doi: 10.1111/gcb.13858
Baetge, N., Graff, J. R., Behrenfeld, M. J., and Carlson, C. A. (2020). Net community        Behrenfeld, M. J., Moore, R. H., Hostetler, C. A., Graff, J., Gaube, P., Russell,
   production, dissolved organic carbon accumulation, and vertical export in                    L. M., et al. (2019). The North Atlantic Aerosol and marine ecosystem study

Frontiers in Marine Science | www.frontiersin.org                                       13                                           February 2021 | Volume 8 | Article 624164
You can also read