Non-random Co-occurrence of Juvenile White Sharks (Carcharodon carcharias) at Seasonal Aggregation Sites in Southern California - Frontiers
←
→
Page content transcription
If your browser does not render page correctly, please read the page content below
ORIGINAL RESEARCH
                                                                                                                                          published: 14 September 2021
                                                                                                                                        doi: 10.3389/fmars.2021.688505

                                            Non-random Co-occurrence of
                                            Juvenile White Sharks (Carcharodon
                                            carcharias) at Seasonal Aggregation
                                            Sites in Southern California
                                            James M. Anderson 1* , Alyssa J. Clevenstine 1,2 , Brian S. Stirling 1 , Echelle S. Burns 3,4,5 ,
                                            Emily N. Meese 6 , Connor F. White 7 , Ryan K. Logan 8 , John O’Sullivan 9 , Patrick T. Rex 1 ,
                                            Jack May (III) 1 , Kady Lyons 1 , Chuck Winkler 10 , Emiliano García-Rodríguez 11 ,
                                            Oscar Sosa-Nishizaki 11 and Christopher G. Lowe 1
                                            1
                                             Department of Biological Sciences, California State University, Long Beach, Long Beach, CA, United States,
                                            2
                                             United States Fish and Wildlife Service, Fremont, CA, United States, 3 Marine Science Institute, University of California,
                            Edited by:      Santa Barbara, Santa Barbara, CA, United States, 4 Bren School of Environmental Science and Management, University
                   David M. P. Jacoby,      of California, Santa Barbara, Santa Barbara, CA, United States, 5 Environmental Market Solutions Lab, University
       Institute of Zoology, Zoological     of California, Santa Barbara, Santa Barbara, CA, United States, 6 Department of Marine Biology, Texas A&M University
  Society of London, United Kingdom         at Galveston, Galveston, TX, United States, 7 Department of Organismic and Evolutionary Biology, Harvard University,
                                            Cambridge, MA, United States, 8 Guy Harvey Research Institute, Nova Southeastern University, Dania Beach, FL,
                       Reviewed by:
                                            United States, 9 Monterey Bay Aquarium, Monterey, CA, United States, 10 Aquatic Research Consultants, San Pedro, CA,
                       Sara Andreotti,
                                            United States, 11 Departamento de Oceanografía Biológica, Centro de Investigación Científica y de Educación Superior
 Stellenbosch University, South Africa
                                            de Ensenada (CICESE), Ensenada, Mexico
                   Charlie Huveneers,
          Flinders University, Australia
                    Robert Perryman,        Many terrestrial and aquatic taxa are known to form periodic aggregations, whether
       Macquarie University, Australia
                                            across life history or solely during specific life stages, that are generally governed by
                 *Correspondence:
                 James M. Anderson          the availability and distribution of resources. Associations between individuals during
          james.anderson@csulb.edu          such aggregation events are considered random and not driven by social attraction
                                            or underlying community structure. White sharks (Carcharodon carcharias) have been
                   Specialty section:
         This article was submitted to      described as a species that exhibits resource-driven aggregative behaviors across
                    Marine Megafauna,       ontogenetic stages and juvenile white sharks are known to form aggregations at
               a section of the journal
          Frontiers in Marine Science
                                            specific nursery sites where individuals may remain for extended periods of time
          Received: 30 March 2021
                                            in the presence of other individuals. We hypothesized juvenile white sharks form
            Accepted: 19 July 2021          distinct communities during these critical early phases of ontogeny and discuss how
     Published: 14 September 2021           a tendency to co-occur across life stages may be seeded by the formation of these
                               Citation:    communities in early ontogeny. We present results from a series of social network
        Anderson JM, Clevenstine AJ,
    Stirling BS, Burns ES, Meese EN,        analyses of 86 juvenile white sharks derived from 6 years of passive acoustic telemetry
    White CF, Logan RK, O’Sullivan J,       data in southern California, demonstrating the likelihood of association of tagged
           Rex PT, May J (III), Lyons K,
       Winkler C, García-Rodríguez E,
                                            juvenile white sharks is greater when sharks are of similar size-classes. Individuals in
       Sosa-Nishizaki O and Lowe CG         observed networks exhibited behaviors that best approximated fission-fusion dynamics
  (2021) Non-random Co-occurrence           with spatiotemporally unstable group membership. These results provide evidence of
               of Juvenile White Sharks
(Carcharodon carcharias) at Seasonal        possible non-resource driven co-occurrence and community structure in juvenile white
        Aggregation Sites in Southern       sharks during early life stages.
 California. Front. Mar. Sci. 8:688505.
    doi: 10.3389/fmars.2021.688505          Keywords: social structure, acoustic telemetry, network analysis, sociality, juvenile white shark

Frontiers in Marine Science | www.frontiersin.org                                   1                                        September 2021 | Volume 8 | Article 688505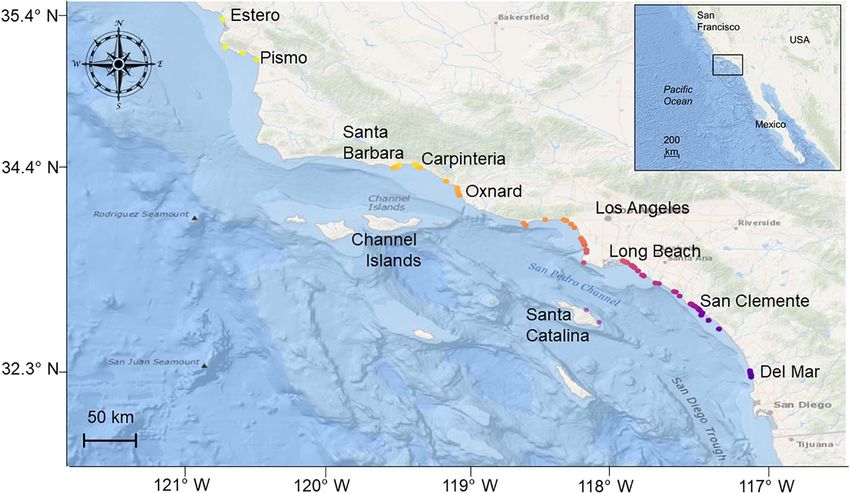
Anderson et al.                                                                                                           Sociality in Juvenile White Sharks

INTRODUCTION                                                                         It is unknown whether co-occurrence of individual sharks is
                                                                                 random, driven by resource availability and/or environmental
Sociality, or the propensity of individuals to form social                       factors, or is a function of socially mediated behaviors. Co-
groups (Merriam-Webster., 2021), is a trait exhibited across                     occurrence may be a function of overlap in home ranges
taxa and varies between loose temporary aggregations to                          and exploited niches, or may be due to preferred associations
life-long associations (Alexander, 1974; Sabol et al., 2020).                    between individuals of phenotypic characteristics. In network
Social interactions have been shown to reduce predation risk                     theory, this propensity for individuals with similar traits to
and increase foraging efficiency, navigational capability, and                   co-occur is termed assortativity (Newman, 2002; Noldus and
reproductive opportunities (Farine et al., 2015; Berdahl et al.,                 Van Mieghem, 2015). Co-occurrence of individual sharks may
2018; Campbell et al., 2018; Diaz-Aguirre et al., 2019). Thus,                   afford the opportunity for the transfer of information and the
animal social groups usually form when the associated benefits                   development of association preferences. Thus, seasonal resource-
of group behavior outweigh the costs, while the influence of such                driven aggregations may seed the development of social groups
associated costs upon the decision to engage in social behaviors                 and assortative interactions (Jacoby et al., 2011).
is driven by extrinsic (e.g., prey availability) and intrinsic (e.g.,                In this study, we applied a network analysis to passive acoustic
competition) variability (Krause and Ruxton, 2002; Silk et al.,                  telemetry data gathered from tagged juvenile white sharks
2014). Animal social groups are thus characterized by motivated                  [ < 150–350 cm Total Length (TL)] in southern California over a
cohesion and can be distinguished from aggregative behaviors,                    6-year period (2014–2019). This approach was designed to gather
which are temporary assemblages of individuals in response to                    insight as to whether tagged shark co-occurrence at acoustically
non-social forcing factors, such as seasonal resource availability               monitored sites was random, an artifact of resource-driven
(Jacoby et al., 2011; Meese and Lowe, 2019; Grueter et al., 2020).               aggregation behavior, or may be driven by social preferences.
    White sharks (Carcharodon carcharias) are circumglobally                     We aimed to examine (1) whether apparent structure could be
distributed in both temperate and tropical waters (Compagno,                     identified within generated networks, (2) the extent to which
2002). In the sub-adult to adult ontogenetic stages, they are                    tagged sharks formed associations with other tagged individuals,
known to occur as solitary individuals but are also found in                     (3) the extent of association stability across time, and (4) to
seasonal aggregations at feeding grounds such as pinniped haul                   characterize assortativity in association preferences.
outs (Bruce et al., 2006; Robbins, 2007; Domeier and Nasby-
Lucas, 2008; Jorgensen et al., 2010; Duffy et al., 2012; Kock
et al., 2013, 2018; Kanive et al., 2021). To date, the extent to
which socially motivated factors play a role in co-occurrences                   MATERIALS AND METHODS
of individual white sharks remains unresolved, with only two
published studies on the subject arriving at different conclusions               Tag Models and Tagging Procedures
(Findlay et al., 2016; Schilds et al., 2019). Specifically, Findlay et al.       A total of ninety sharks, of which detection data from eighty-
(2016) reported that associations between white sharks in their                  six individuals used in the study were accessed via one of
study were random, although they exhibited weak structuring by                   three ways (incidental catch, targeted catch, dart tagging),
sex and body size, whereas Schilds et al. (2019) reported non-                   and were outfitted with either Vemco V16 or V13 coded
random, sex-dependent associations with temporal variability.                    acoustic transmitters (Vemco | Innovasea, Nova Scotia, Canada;
These studies drew upon observations of sub-adult and adult                      transmitter family V13-1x-069k, V13-2x-069k, V16-4x-069k,
sharks co-occurring under baited and chummed (burleyed)                          V16-5x-069k. V16-6x-069k) (Supplementary Table 1).
conditions, at locations proximal to pinniped haul-outs, with very
different time thresholds constituting co-occurrence. Juvenile                   Incidental Catch
white sharks use nearshore and beach habitat, where they                         Commercial gillnet fishers, working in collaboration with
have been observed to exhibit high degrees of residency and                      CSULB and CICESE researchers, brought incidentally captured
aggregation site fidelity (Weng et al., 2007; Bruce and Bradford,                juvenile white sharks to the nearest port in a large fish tote
2008; Werry et al., 2012; Dicken and Booth, 2013; Harasti                        (1.2 × 1.2 × 1.2 m) with flowing seawater. Incidentally-
et al., 2017; Oñate-González et al., 2017; Curtis et al., 2018;                  caught sharks were caught offshore (>3 nm) outside of State
Tamburin et al., 2019; White et al., 2019; Spaet J. L. Y.                        waters. Researchers physically assessed, measured, and surgically
et al., 2020; Anderson et al., 2021a,b). Such site fidelity is                   implanted a plasma sterilized V16 transmitter into the abdominal
common among elasmobranchs in early ontogeny, as these                           cavity of the shark through a small incision (5 cm). The wound
habitats typically provide opportunities for optimal growth                      was closed with 2–3 interrupted sutures, before the animal
and foraging, and reduced predation risk (Simpfendorfer and                      was released approximately 2 km offshore. All individuals were
Milward, 1993; Heupel et al., 2007; Chapman et al., 2009).                       visually monitored during release and behavior was recorded.
Preliminary high-spatial-resolution movement data derived from                   A previous study demonstrated post-release survival rates of
hyperbolic positioning via a high density acoustic array off                     juvenile white sharks retrieved live from gillnets to be in the
Carpinteria, California, indicate individual juvenile white sharks               order of 93% (Lyons et al., 2013), while a more recent analysis
form aggregations (5–30 individuals of multiple size-classes) and                indicated that minimizing handling and on-deck holding times
use overlapping, spatially restricted areas (∼8 km2 ) continuously,              may in turn minimize non-lethal post-release negative effects
for periods of weeks to months (Spurgeon et al., unpublished                     (Raoult et al., 2019). Approximate elapsed times from researchers
data; Anderson et al., 2021b).                                                   taking possession of the shark to offshore release were < 30 min.

Frontiers in Marine Science | www.frontiersin.org                            2                                  September 2021 | Volume 8 | Article 688505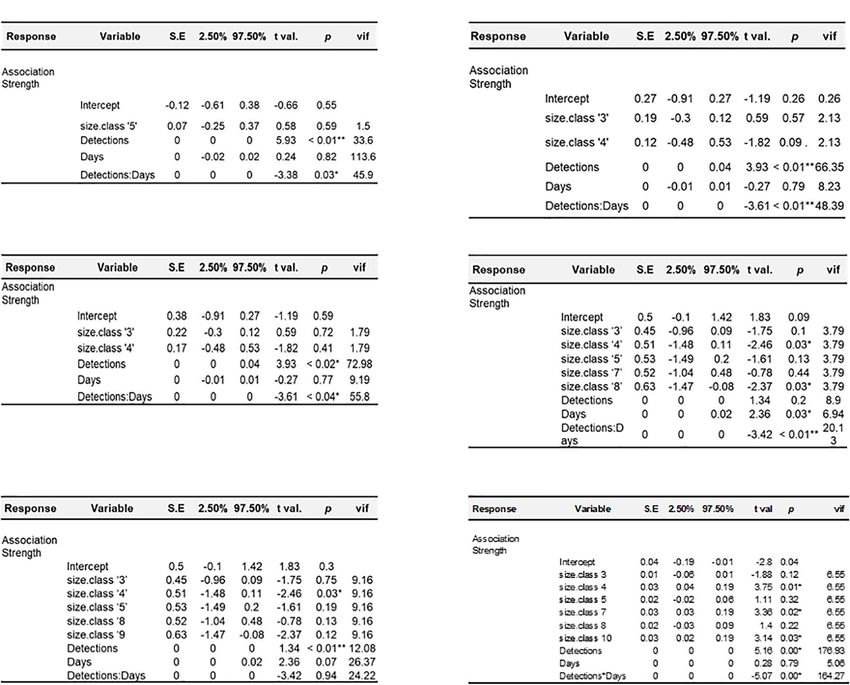
Anderson et al.                                                                                                                  Sociality in Juvenile White Sharks

Targeted Catch                                                                         installed and maintained by CSULB, but also included receivers
Juvenile white sharks were caught in shallow inshore waters                            of collaborators: University of California San Diego (UCSD),
either via a purse-seine, or via targeted quick-extraction with                        the Southern California Acoustic Telemetry Tracking Network
a gillnet. Sharks were transferred to a custom-made staging                            (SCATTN), and the Ensenada Center for Scientific Research and
tank and ventilated, before being sexed, sized, and outfitted                          Higher Education (CICESE). Acoustic receivers were deployed in
with a surgically implanted V16 transmitter as described above.                        shallow (∼ 3–40 m depth) coastal waters within 1,000 m of the
Approximate handling times in all instances were < 20 min.                             shoreline (50% within 400 m), across a range of environments,
                                                                                       including calm protected habitats (e.g., embayments, harbors),
Dart Tagging                                                                           exposed high energy sand substrata (e.g., beach habitat), rocky
Juvenile white sharks swimming close to, or at the surface (at                         reef, and kelp forest habitats. Receiver detection range (nominal
least 2 m visibility) were approached by either a small boat or                        range 150–700 m) varied by site, habitat type, and transmitter
personal watercraft from behind, with the aim of minimizing                            power output (Heupel et al., 2006; Kessel et al., 2014; Huveneers
stress and flight response from the targeted animal and tagged                         et al., 2016). For example, range testing performed in waters
with either a V13 or V16 acoustic tag using a 3 m modified                             off Santa Catalina Island and Long Beach Harbor revealed
pole-spear fitted with a tag applicator. Tags were inserted into                       average detection ranges of 150 m to ∼ 200 m (V13 and V9
the dorsal musculature at the base of the first dorsal fin using a                     low power transmitters, respectively; Wolfe and Lowe, 2015;
titanium dart tethered to the tag. When possible, targeted sharks                      Clevenstine and Lowe, 2021), while mean detection ranges of
were visually checked for the presence of existing tags, and sex                       high power output V16 transmitters in waters off San Clemente
of individual was determined using a pole-mounted dip camera.                          and Santa Barbara are estimated to be in the region of 500–700
Tagging effort via this method was largely directed at locations                       m (Stirling et al., unpublished data). Thus, a nominal detection
where sharks were known to seasonally aggregate. Shark size (TL                        range of 500 m across the entire array was considered. To account
cm) was estimated by comparison to an object of known size (the                        for the possibility of false detections, raw receiver data were
watercraft) from orthogonal aerial drone footage. Comparative                          filtered to include only individuals that were detected two or more
methods such these have been shown to produce valid estimates                          times per day (Simpfendorfer et al., 2015). Detection data were
of size (Sequeira et al., 2016; May et al., 2019). All tagged sharks                   visually inspected to check for the possibility of double-tagged
were assigned a size-class based upon their measured or estimated                      animals. Where double-tagged animals were identified, all data
size at time of tagging (Table 1). For sharks detected in more than                    pertaining to the 2nd tag were removed from the analyses.
one calendar year, a growth rate of 25 cm per year was assumed
(Cailliet et al., 1985).
                                                                                       Social Network Construction and
Spatial and Temporal Detection Analysis                                                Association Definition
Acoustic detection data were acquired from a wide-spread                               A gambit-of-the-group approach (Cairns and Schwager, 1987;
acoustic receiver array of up to 75 Vemco VR2 and VR2W                                 Franks et al., 2010) was used to build proximity-based social
receivers, deployed between Estero Bay (35.448, −120.952) and                          networks using individual tagged sharks as nodes and strength of
San Diego [32.876, −117.260 (Figure 1)], but also included                             association as edges, calculated via the simple ratio index (SRI)
offshore island monitoring sites at Santa Catalina Island (33.389,                     using the R packages spatsoc (version 0.1.14; Robitaille et al.,
−118.359). From north to south, these included locations                               2019) and igraph (version 1.2.5; Csardi and Nepusz, 2006). The
proximal to the following locations/landmarks: Estero Bay,                             SRI score’s an individual’s strength of association between 0 and
Morro Bay, Pismo Beach, Santa Barbara, Ventura, Santa Catalina                         1, with 0 indicating no co-occurrence while a score close to 1
Island, Santa Monica Bay, Long Beach—Huntington Beach,                                 indicates a high level of co-occurrence (Aplin et al., 2013). SRI
Newport Beach—Laguna Beach, Dana Point—San Clemente,                                   was chosen over other indices (e.g., half-weight index) as the
Oceanside, and San Diego (Figure 1). Receivers were largely                            properties and nature of acoustic detection data render them
                                                                                       unlikely to violate the assumptions required for SRI: recorded
                                                                                       associations are accurate, the probability of identification is
TABLE 1 | Allocated size-classes of juvenile white sharks detected.                    independent of whether an individual is associated or not
                                                                                       (Stehfest et al., 2013; Lilly et al., 2020). To comply with formatting
Size (cm)                                                             Size-class
                                                                                       requirements, detections were rounded to the nearest hour (i.e.,
350                                                                     10            other. A 1 km spatial threshold was chosen as this allowed for

Frontiers in Marine Science | www.frontiersin.org                                  3                                   September 2021 | Volume 8 | Article 688505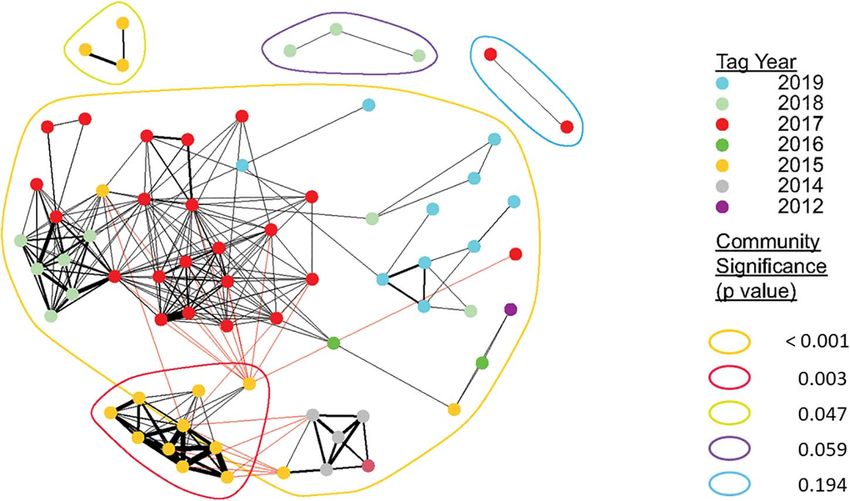
Anderson et al.                                                                                                                         Sociality in Juvenile White Sharks

  FIGURE 1 | Study area (inset) and locations of all receivers used in the study (2014–2019). Receiver locations are colored according to latitude.

individuals to be considered as being within the same group in                          each constructed network in each individual year of the study.
instances where they were detected on separate receivers that had                       CV’s of SRI indices from observed and random networks
overlapping detection ranges, although creating such a spatial                          were compared to examine observed and expected relationships
buffer introduces the possibility that sharks may be grouped                            (Bejder et al., 1998; Farine and Whitehead, 2015; Farine et al.,
together, or regarded as associating, when in-fact they could be                        2015), whereby tagged sharks were assumed to exhibit preferred
up to 2 km from each other (assuming a 500 m detection range).                          co-occurrences where coefficients of variation from observed
    Data were then subset by Julian year (2014–2019)                                    networks were greater than 97.5% of coefficients of variations
before generating networks and associated graphs. Network                               from randomized (permuted) networks (Findlay et al., 2016). It
communities were identified through weighted eigenvector                                was not possible to replicate this same process for the overall (all
community detection (Newman, 2006), and community                                       years combined) network as it was not possible to account for
modularity (Q, the extent to which communities within a                                 phenotypic changes in those individuals that were as identified as
network are distinct from each other) was calculated using                              nodes in networks across more than 1 year.
the R package igraph. Homophilic propensity, the tendency
of individuals to associate with others with similar traits, was                        Association Preference Examination
examined by calculating assortment coefficients based on                                We used multiple linear regression to examine structural
estimated shark size. Strength of associations were calculated                          predictors of association strength (strength) in observed
as edge lists using a temporal based nearest neighbor approach,                         networks, with separate models run for each annual network.
whereby the nearest neighbor to each individual within                                  Predictor variables included estimated shark size-class (size-
each time group was calculated, incorporating a distance                                class), number of detections (detections), detection period
threshold of 1 km radius.                                                               (days), and number of acoustic receiver stations visited
    Pre-network permutation tests based on mean values from                             (statvis). The inclusion of size-class allows for identification
10,000 randomized networks generated in the R package                                   of homophilic association preferences, while the inclusion of
spatsoc were used to examine whether the observed overall                               the number of detections, detection period, and the number of
network structure (all years combined) differed from structure                          stations visited allows for identification of possible structure
of randomized networks. Coefficients of variation (CV’s) of SRI                         inherent to the data. The sex of the shark was not included
indices between vertices from observed networks were compared                           as a predictor variable due to the number of animals in
to those from the randomized networks using two-sample t-tests.                         the study with unconfirmed sex (Supplementary Table 1).
    To further confirm the non-random nature of the observed                            The most parsimonious model for each year was identified
structure, we used pre-network permutation tests (10,000) for                           from a global model via AICc values using the R package

Frontiers in Marine Science | www.frontiersin.org                                   4                                        September 2021 | Volume 8 | Article 688505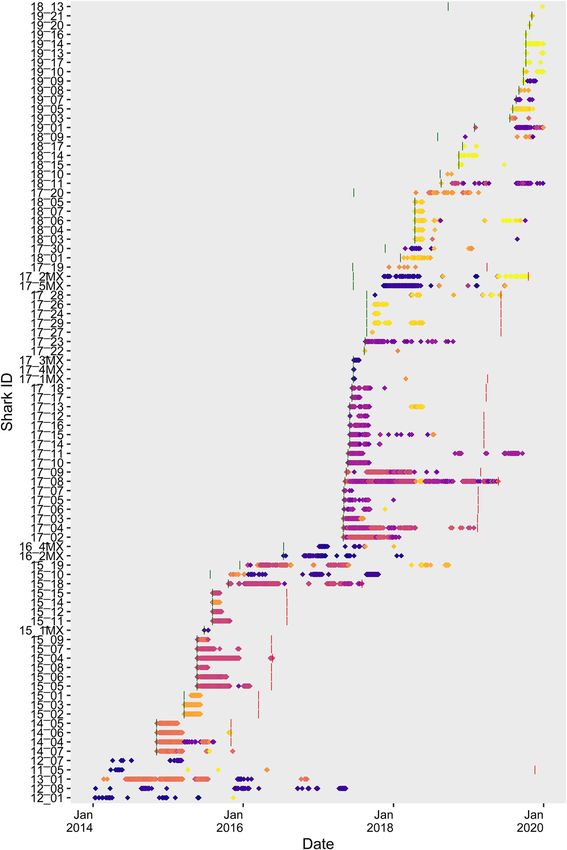
Anderson et al.                                                                                                                      Sociality in Juvenile White Sharks

glmulti (Calcagno and de Mazancourt, 2010), and confirmed                                 A multiple regression quadratic assignment procedure with
by individually comparing the final model to the next                                 double-semi-partitioning (MRQAP-DSP; Farine, 2013) was used
two most parsimonious model iterations. Final models                                  to further quantify the influence of specific structural factors
were also compared against null models (strength ∼ 1) to                              (i.e., size-class) included in multiple regression models in each
examine significance of predictors used (Supplementary                                year. To examine whether association strength differed for sharks
Table 1). The global model was written as strength ∼ size                             grouped in the same size-class, a binary matrix was constructed
class + statvis + detections + days + detections ∗ days.                              that encoded size-class and tested for correlation with a binary

  FIGURE 2 | Time series plot showing presence/absence of tagged juvenile white sharks at monitored locations. Points are colored according to individual receiver
  station latitude demonstrate co-occurrence. Latitudes corresponding to point color are shown in Figure 1. Green and red vertical lines show tagging date and
  tag-battery life, respectively. Sharks with bars missing were either tagged prior to 2014, or tag-battery life extends beyond 2019.

Frontiers in Marine Science | www.frontiersin.org                                 5                                       September 2021 | Volume 8 | Article 688505
Anderson et al.                                                                                                                       Sociality in Juvenile White Sharks

version of the SRI matrix using Mantel tests (999 permutations)                        Observed network strength values (mean = 0.36 ± 0.41) were
following the method described by Farine and Whitehead (2015),                         significantly greater than expected values (0.27 ± 0.36; Welch
using the R package vegan (Oksanen et al., 2011). This process                         Two Sample t-test; t = −2.513, p = 0.012), indicating there
was repeated for each yearly dataset (2014–2019).                                      was apparent structure (i.e., association preferences) in juvenile
                                                                                       white shark seasonal aggregations. Additionally, CV’s of observed
                                                                                       association strength indices vs. randomized networks for each
RESULTS                                                                                individual year indicated that, with the exception of 2016,
                                                                                       observed network structure was significantly stronger than
A total of 86 tagged juvenile white sharks were detected on at least                   expected from a randomly structured network (Supplementary
1 day across the study period (2014–2019) and included in the                          Figure 1). Thus, co-occurrence of tagged juvenile white sharks
overall analyses. Of these, 29 (34%) were outfitted with internal                      at acoustically monitored locations was considered non-random.
tags, while 57 (66%) were tagged externally. Total number of                           Community modularity for all detections across all years was high
days detected on acoustic receivers and sum detection period                           (O̧ = 0.63), which reflects that although communities appear to
varied by shark, ranging from 1 to 424 days detected [66 ± 75                          be connected, they were spatiotemporally distinct with limited
(mean ± SD)], across a sum period of 1–1,216 (265 ± 277)                               individual connections to other communities. Fifty-five of the
days (Figure 2). A total of 26 sharks were detected in 2 or                            86 sharks (64%) included in analyses formed associations with
more calendar years (range 2–4 years, 2.42 ± 0.58). The number                         another shark. Thirty-nine of the 86 sharks (45%) were a part of
of returning tagged sharks showed an increasing trend across                           a significant network (Supplementary Table 2), with nine sharks
the study (Figure 2) and was positively correlated with the                            (10%) identified as being part of a significant network in more
cumulative number of sharks tagged (Pearson’s product-moment                           than 1 year. The number of associations formed by individuals
correlation; r = 0.82, p = 0.048). Only externally tagged sharks                       within a single year ranged from 1 to 10 (2.21 ± 1.65). The total
were observed to represent nodes in networks in more than                              number of associations per shark varied both within and between
1 year (Supplementary Table 2). Tagged juvenile white sharks                           years throughout the study period but showed no discernable
exhibited both temporal and spatial overlap in detection patterns,                     trend across the study period (Supplementary Table 1). Mean
suggesting possible association preferences (Figure 2).                                number of associations per shark was highest in 2015, which
                                                                                       is reflected by the associated mean SRI value of 0.7. Lowest
Social Organization and Association                                                    mean SRI values were observed in 2016 and 2019 (0.03 and 0.05,
Preference                                                                             respectively), suggesting tagged sharks had low likelihoods of
Overall observed network structure (Figure 3) was compared                             spatiotemporal overlap within acoustically monitored locations
against a null network generated from 10,000 pre-network                               in those years (Table 2).
permutations based upon the CV’s of individuals, accounting                                The number of associations between sharks was not correlated
for years in which individual sharks were present in a network.                        with individual year (Pearson’s product-moment correlation;

  FIGURE 3 | Sociogram showing associations of all tagged juvenile white sharks across all years. Nodes represent individual sharks, node color indicates the year in
  which they were detected or formed strongest associations (in the case of sharks detected over more than year). Edge thickness indicates the relative number of
  connections (associations) between nodes. Colors encircling multiple nodes represent identified distinct communities. Detected sharks that did not form dyadic
  connections to at least one other tagged shark (n = 31) are not shown. Community modularity for all detections across all years was high (Q = 0.63), which reflects
  that although communities appear to be connected, they were spatiotemporally distinct with limited individual connections to other communities.

Frontiers in Marine Science | www.frontiersin.org                                  6                                       September 2021 | Volume 8 | Article 688505
Anderson et al. Sociality in Juvenile White Sharks
TABLE 2 | Summary table of characteristics of observed networks across individual years.
Year Total active Tag type ratio Total Total Total in Mean Modularity Assortativity Mean dyads per
tags (internal : external) detected returning network(s) SRI ± SD (O̧) (r) Shark ± SD
2014 17 1:3 9 2 4 0.55 ± 0.23 8.8 × 10⁻¹⁶ −0.25 2.5 ± 1.29
2015 36 0:12 25 6 12 0.70 ± 0.52 0.42 0.55 4 ± 3.10
2016 42 2:1 9 7 3 0.03 ± 0.04 0.28 −0.41 1 ± 0.0
2017 73 3:9 36 5 12 0.42 ± 0.42 0.28 0.08 3 ± 2.52
2018 92 4:5 33 12 8 0.27 ± 0.42 0.07 −0.06 2.88 ± 1.96
2019 110 2:6 29 10 8 0.05 ± 0.09 0.35 0.65 1.38 ± 0.52
r = −0.240, p = 0.105) or with the total number of available was included, except for 2018, where the interaction was not
(i.e., detectable) tagged sharks (Pearson’s product-moment significant and these terms were removed, and the model re-
correlation; r = −0.214, p = 0.148). Node degree, the number run (Carey, 2013). Model correlation coefficients ranged from
of connections an individual has with other sharks, was not 0.19 to 0.83 (0.52 ± 0.23). The interaction term and response
found to correlate with the date of first detection, thus there was variable (association strength) were found to be strongly collinear
no relationship between how early in a calendar year a shark across all models where included and is reflected by high
was tagged and the number of associations that shark had with associated variance inflation factors (Figure 5). Shark size-class
other tagged sharks. The exception to this was in 2017, where was included in all final models, and was found to be a significant
a positive correlation was observed (Pearson’s product-moment predictor of association for 3 of 6 final models [2017, 2018,
correlation; r = −0.393, p = 0.018), which was likely a function and 2019 (Figure 5)]. The results from MRQAP-DSP regression
of six sharks with both the highest degree and SRI values being indicated that shark size-class was a significant predictor of
tagged within 1 month of each other (two on the same day, three co-occurrence in 3 of 6 yearly datasets examined (2015, 2017,
within 3 days, four within 8 days, five within 22 days). With the 2019; Table 3). Tagged shark co-occurrence was found to be
exception of 2015, returning sharks were not observed to renew significantly correlated with shark size-class in those same years
individual associations from the previous year. However, the [Mantel tests: (2015) r = 0.332, p = 0.001; (2017) r = 0.08, p = 0.04;
exception in 2015 is a function of sharks aggregating and forming (2019) r = 0.144, p = 0.014; Table 4].
association preferences in 2014 continuing to do so through the
change of year into 2015.
Network analyses based on weighted eigenvector community DISCUSSION
detection demonstrated that for all years combined (Figure 3),
Juvenile white sharks in southern California are known to
as well as each individual year, some aggregating sharks formed
seasonally aggregate in annually variable, spatially discrete
distinct, significant communities (Table 2). In years where
nearshore locations (Lyons et al., 2013; White et al., 2019;
spatiotemporally separate aggregations formed, relatively high
Anderson et al., 2021a). The drivers behind these aggregation
community modularity was observed, as indicated by high
“hot spot” patterns, and the selection of specific habitat locations
calculated O̧-values (Table 2, Figure 4, and Supplementary
over an abundance of comparable available habitat remain
Video 1). Similarly, assortment coefficients were observed to be
unclear, and are not consistently explained by environmental
highest in years with higher O̧-values (Table 2). Of the 39 tagged
correlates (Spaet J. et al., 2020; Anderson et al., 2021a). While
animals that were members of significant communities, 18 were
the study included detection data from tagged juvenile white
detected in two or more spatially distinct locations (considered
sharks at locations across southern California, a majority of
separate aggregations) across 2014 (n = 4), 2015 [n = 8 (three
annual detections and co-occurrences of tagged sharks occurred
sharks from the significant network in 2014)], 2017 (n = 3), 2018
at seasonal aggregation hot spots, as indicated in Figures 2, 4. It
(n = 1), and 2019 (n = 2) (Supplementary Table 2). Sixteen sharks
must be acknowledge that a majority of tagged sharks included
were identified as being members of significant communities
in the study (65%) were tagged externally, and the majority
across two or more years. Fourteen were sharks identified in
of these sharks were tagged at known aggregation locations
communities in two separate years. Two sharks (Shark IDs 15_19
(see Supplementary Table 1 for tagging locations). Thus, to
and 17_08) were part of significant communities in three separate
some extent, detection patterns and observed network structures
years (2016, 2017, 2018 and 2017, 2018, 2019, respectively).
may be a function of tagging methodologies used. However,
where this is the case, the patterns in the detection data
Observed Social Structure and Size also reflect that these sharks had already formed aggregations
Class and may have also already formed preferential associations
General linear models were run for each year in the dataset to with individual conspecifics present within the aggregation.
examine potential predictors of association strength. For all years, For instance, individuals caught offshore by commercial fishers
the best fitting model was strength ∼ size class + detections∗ days were less likely to be found within nearshore aggregations.
(Figure 5 and Supplementary Table 3). The interaction term Individuals that spatiotemporally overlap each other are more
of detections∗ days was significant in all years for which it likely to be associated with each other, due to inherently
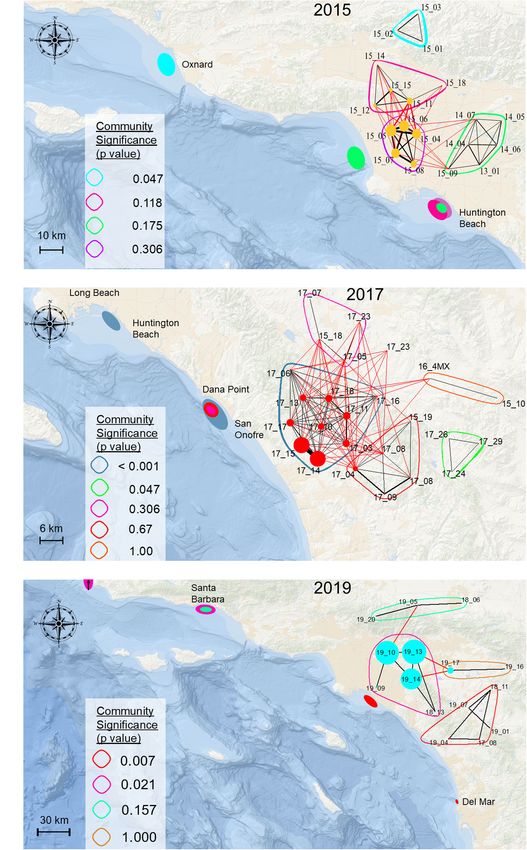
Frontiers in Marine Science | www.frontiersin.org 7 September 2021 | Volume 8 | Article 688505Anderson et al. Sociality in Juvenile White Sharks FIGURE 4 | Maps depicting community modularity in observed networks for 2015 (A), 2017 (B), and 2019 (C). Community composition and corresponding discrete spatial locations of specific network communities are reflected in coloration of bands surrounding network nodes, and oval shaped markers within map coastal locations. greater probability of co-occurrence. Pre-network (data stream) indicating apparent co-occurrence of individuals in space and permutations can be used to examine whether a metric of time is non-random (Supplementary Figure 1). Observed interest (in this case observed association strength) differs relative association strengths in animal social networks may to that which might occur at random. Our comparison of be a function of resource availability or site fidelity (Lusseau observed and permuted association strengths demonstrated et al., 2006; Armansin et al., 2016). Thus, we incorporated that except for 2016 (a notably data deficient year) observed methods that aimed to discern whether observed network association preferences differed significantly to expected values, structure could be explained by social factors, or were likely Frontiers in Marine Science | www.frontiersin.org 8 September 2021 | Volume 8 | Article 688505
Anderson et al.                                                                                                                        Sociality in Juvenile White Sharks

  FIGURE 5 | Results of multiple linear regression analyses. Each panel shows model results for the corresponding year; (A) 2014, (B) 2015, (C) 2016, (D) 2017, (E)
  2018, (F) 2019.

TABLE 3 | Results from MRQAP-DSP regression.

Predictor                         2014                      2015                     2016                   2017                    2018                   2019

                          Coefficient      p        Coefficient      p      Coefficient        p    Coefficient      p      Coefficient      p     Coefficient        p

Size class                4.9 ×   10−2   1.00       4.8 ×   10−2   0.0007   −5.3 ×   10−3    0.79   1.1 ×   10−2   0.047   −3.2 ×   10−3    0.65   9.1 ×   10−3    0.006
Stations visited              NA          NA        5.7 × 10⁻²     0.005    −7.2 × 10⁻³      0.65   4.5 × 10⁻³     0.49    5.3 × 10⁻³       0.8    4.2 × 10⁻⁴      0.70
Total detections              NA          NA    −2.6 × 10⁻²        0.99         NA            NA    −1.3 × 10⁻²    0.87    −7.7 × 10⁻³      0.83   −2.8 × 10⁻³     0.61
Detection period (days)       NA          NA    −2.9 × 10⁻²        0.002        NA            NA    8.7 × 10⁻³     0.1     −6.5 × 10⁻³      0.07   −1.4 × 10⁻⁴     0.93

Table shows effects of four predictor variables upon association strength in tagged sharks between 2014 and 2019. Two of the years where size class was not significantly
correlated with association strength were years where < 5 individuals formed at least one distinct community. With the exception of 2015, no other predictors were
significant. Variance explained by all models was low (2014: R2 = 7.0 × 10⁻² , 2015: R2 = 0.19, 2016: R2 = 7.16 × 10⁻³ , 2017: R2 = 0.017, 2018: R2 = 4.9 × 10⁻³ ,
2019: R2 = 0.08). Bold values denote a statistically significant predictor variable in a given year.

driven by other forcing (e.g., environmental conditions and/or                            the only phenotypic characteristic we were able to consistently
resource availability).                                                                   gather, we were restricted to using size-class as a metric of
                                                                                          assortment. Although the resulting assortativity coefficients were
Assortativity and Community Structure                                                     variable, our analyses suggest the likelihood of association of
Animals that exhibit homophilic association preferences may do                            tagged juvenile white sharks is greater where sharks are of similar
so with respect to phenotypic characteristics such as species, sex,                       size-classes. A comparable relationship was described in a study
size, and kinship (Mourier and Planes, 2021). As animal size was                          of juvenile white sharks in South Africa (Findlay et al., 2016).

Frontiers in Marine Science | www.frontiersin.org                                     9                                     September 2021 | Volume 8 | Article 688505
Anderson et al. Sociality in Juvenile White Sharks
TABLE 4 | Results of Mantel tests for correlation between yearly simple ratio index of resource clustering at hot spot locations with respect to
(SRI) matrices and shark size-class.
ostensibly similar neighboring habitat. Juvenile white sharks
Year Estimate (rho) p-value in the study were observed to co-occur at different receivers
both within the same spatiotemporal aggregation, as well as
2014 0.332 0.455 separate, spatially discrete locations and aggregations within the
2015 0.332 0.001 same year (Supplementary Video 1). Although this behavior,
2016 −0.021 0.662 which linked nodes between network communities, could simply
2017 0.080 0.040 indicate individuals at similar ontogenetic stages were responding
2018 −0.029 0.796 in similar ways to the same environmental cues, it may also
2019 0.144 0.014 be attributable to following behaviors and association borne
Observed estimates were compared to 999 permuted estimates. Significant from local enhancement, where individuals are attracted to
p-values and respective years are indicated in bold. actively foraging conspecifics (Poysa, 1992). Thus, the interplay
of environmental drivers and context-specific social behaviors
may govern co-occurrence and apparent association of individual
The low variance explained by our multiple regression and
juvenile white sharks in the study.
MRQAP analyses indicates community structure was also driven
Although 10% of tagged sharks were identified at the same
by other factors we were unable to quantify, which could
locations across more than 1 year, there was no evidence of
include spatiotemporal overlap due to environmental factors
stability in structure across multiple years, as returning sharks
and/or resource availability, as well as sampling effects. However,
did not form repeated associations at monitored locations
black tip reef sharks (Carcharhinus melanopterus) have been
in subsequent years. Juvenile white sharks aggregating at
documented to exhibit preferential associations to conspecifics of
nearshore locations, including those in this study, have been
similar size and sex regardless of prey availability (Mourier et al.,
demonstrated to exhibit overlapping, restricted area use (Lyons
2012), which lends support to apparent preferential association
et al., 2013; Anderson et al., 2021a). An individual’s tendency
toward conspecifics of similar size in the current study.
toward association may be indicated by the propensity for
spatiotemporal overlap and successive return to the same
Shark Co-occurrence and Group locations (Klimley and Holloway, 1999; Lilly et al., 2020), a
Dynamics trait exhibited in juvenile white sharks (Bruce et al., 2019; Spaet
Individuals in observed networks exhibit behaviors that best J. L. Y. et al., 2020; Anderson et al., 2021a). Observations of
approximate fission-fusion dynamics (formation and dissolution juvenile white shark interactions derived from drone surveys
of groups over time) with spatiotemporally unstable group undertaken during the study period (Rex et al., unpublished
membership. Fission-fusion dynamics are common in animal data) indicate that individuals may often be within 10–20 m
groups across taxa, including elasmobranchs (Haulsee et al., of each other while in these loose aggregations, and do not
2016; Perryman et al., 2019; Papastamatiou et al., 2020), and appear to be schooling in the manner seen in other aggregative
are regarded as being advantageous in the exploitation of shark species [e.g., scalloped hammerhead sharks (Sphyrna
heterogeneous environments (Ramos-Fernández and Morales, lewini), black tip reef sharks (Carcharhinus melanopterus)]. In
2014; Silk et al., 2014; Farine et al., 2015). Dyadic relationships addition, observations of these interactions suggest the presence
seen between individual juvenile white sharks in our study of dominance hierarchies and conspecific aggression. Although
are not represented by predictable or stable co-occurrence tagged sharks generally exhibited low frequency of associations
(association) as might be expected by animals that exhibit with other tagged conspecifics (Supplementary Table 1), the
central-place foraging behavioral characteristics. Rather, the strength of those associations, as indicated by SRI indices,
dyadic patterns observed in our study suggest individuals co- were relatively strong, with the exception of sharks in 2016
occur (fusion) punctuated by variable spatiotemporal intervals and 2019, which were both years with low mean and total
(fission). Such behaviors may be a function of exploitation of associations (Table 1 and Supplementary Table 1). Individuals
shared resources (e.g., food). A recent study of Australasian within heterogeneous environments likely do not experience
gannets (Morus serrator) determined that social associations equal benefits from local enhancement and information derived
in the study population were context dependent, and were from social behaviors and co-occurrence (Jones et al., 2020).
most prevalent during foraging (constituting local enhancement). Thus, fission may not be a singular synchronous event, but rather
These associations were also most prevalent in regions where an ongoing social construct governed by intrinsic plasticity.
resources were clustered (Jones et al., 2020). Southern California Aggregation dynamics in juvenile white sharks may therefore
juvenile white shark aggregation hot spots have been largely be governed by the interplay of resource quality, environmental
associated with shallow, sandy beach habitat, although across heterogeneity, and the continuous evaluation of the cost-benefit
southern California, such habitat constitutes < 30% of total relationship of sociality. This can be likened to the hypothesis
available shore type (Anderson et al., 2021a). Although we were of the ecological loop that affects dispersal, proposed by Bowler
not able to quantify resource homogeneity at aggregation hot and Benton (2005), whereby the size of a population (in this case
spots, hot spot locations themselves were annually spatially at an aggregation site), which is mediated by the environment
variable. If spatial locations of aggregation hot spots are resource (which varies in space and time), governs interactions between
driven, we can expect there to be a comparatively higher degree individuals for resources.
Frontiers in Marine Science | www.frontiersin.org 10 September 2021 | Volume 8 | Article 688505Anderson et al. Sociality in Juvenile White Sharks
Although sociality has been examined and described in a tendency of individuals to remain within aggregations may
number of elasmobranch species (Sims et al., 2000; Jacoby be the result of conscious behaviors, potentially driven by
et al., 2010, 2011, 2016; Guttridge et al., 2013; Wilson et al., sociality, which may stem from naïve individuals acquiring
2014, 2015; Armansin et al., 2016; Mourier et al., 2019; information and experiencing local enhancement. To better
Perryman et al., 2019; Schilds et al., 2019; Mourier and Planes, understand the dynamics of associations between individuals,
2021; Papastamatiou et al., 2020), the extent to which co- far higher resolution data is required. This could be achieved
occurrence in white sharks as a function of social forcing through the use of high-density acoustic arrays across much
factors is unknown. The difficulty of interpreting the true smaller spatial scales, specifically centered at aggregation hot
level of association between animals is a function of the data spots [e.g., VPS (Vemco Positioning System) arrays], where
collection method, and the spatiotemporal thresholds used. For the movements of individuals in three-dimensional space
example, Schilds et al. (2019) used photographic identification throughout an array can be achieved via trilateration of acoustic
of individuals present at a baited location within the same tag transmissions or by using proximity-based tags. Such
day as a means of identifying co-occurrence, thus arrival of studies would provide a more objective means of quantifying
connected nodes at the monitored location could potentially co-occurrence, fusion, and fission between individuals and
be hours apart. In the present study, shark presence and groups, and elucidate the potential social dynamics that may
associations at monitored aggregation locations may be under- govern space use and niche exploitation at juvenile white shark
estimates as they only reflect tagged sharks within spatially aggregation locations.
discrete locations and time thresholds (1 h), which may better
represent natural co-occurrence. However, the potential for
temporally co-occurring individuals to be up to 2 km apart DATA AVAILABILITY STATEMENT
from each other in some instances, due to the nature of
acoustic telemetered data, may also represent over-estimates of The raw data supporting the conclusions of this
spatio-temporal co-occurrence. article will be made available by the authors, without
While the primary drivers behind co-occurrence in shark undue reservation.
species may be extrinsic factors such as resource availability
and use, additional adaptive benefits of social interactions
beyond direct biological benefits (e.g., increased opportunity ETHICS STATEMENT
for reproduction) have been identified and described (e.g.,
Jacoby et al., 2010; Mourier et al., 2012, 2019; Armansin The animal study was reviewed and approved by the CSULB
et al., 2016; Jacoby and Freeman, 2016; Mourier and Planes, Institutional Animal Care and Use Committee.
2021; Papastamatiou et al., 2020). Papastamatiou et al. (2020)
concluded that for sharks exhibiting central place foraging
life history characteristics, information transfer during social
AUTHOR CONTRIBUTIONS
foraging increased foraging efficiency and may lead to temporally JA, AC, EB, and CL conceived the study. CL, EB, EM, CFW,
stable social groups across years. Other shark species that exhibit RL, CW, PR, JM, KL, JA, AC, EG-R, and OS-N tagged the
more solitary life histories but aggregate seasonally at feeding sites sharks and collected the data. CFW, EB, EM, BS, JA, PR, and JM
may also exhibit preferential associations based on phenotypic organized the data. JA analyzed the data, created the main figures,
characteristics (Findlay et al., 2016; Haulsee et al., 2016). and drafted the manuscript. All authors contributed equally to
For naïve individuals, information transfer facilitates manuscript revisions.
exploitation of patchy resources already identified by others
(Aplin et al., 2013). The specific drivers governing where and
when juvenile white sharks aggregate in southern California have FUNDING
yet to be defined but are thought to include water temperature
and resource availability (White et al., 2019; Anderson et al., Funding for tagging and acoustic monitoring was provided
2021a), and decisions by individual sharks to remain within by Monterey Bay Aquarium and AltaSea. Funding for data
a specific aggregation location may therefore reflect resource maintenance and analysis was provided by State of California. In-
quality. Thus, perceived habitat quality derived from cues kind support for tagging and monitoring was provided by Los
generated by both con and hetero-specifics, as well as transfer of Angeles and Orange County Lifeguards, Cities of Huntington
information (e.g., following of “experienced” individuals by naïve Beach, Seal Beach, Ventura, Santa Barbara, Newport Beach,
individuals) within aggregation locations may lead to increased Laguna, Long Beach, and San Clemente.
likelihood of association at a given location.
SUPPLEMENTARY MATERIAL
CONCLUSION
The Supplementary Material for this article can be found online
Although individual presence at aggregation sites may be at: https://www.frontiersin.org/articles/10.3389/fmars.2021.
driven by environmental cues and resource availability, the 688505/full#supplementary-material
Frontiers in Marine Science | www.frontiersin.org 11 September 2021 | Volume 8 | Article 688505Anderson et al. Sociality in Juvenile White Sharks
REFERENCES sharks (Carcharodon carcharias) in the western North Atlantic Ocean. Sci. Rep.
8:10794. doi: 10.1038/s41598-018-29180-5
Alexander, R. D. (1974). The evolution of social behavior. Annu. Rev. Ecol. Syst. 5, Diaz-Aguirre, F., Parra, G. J., Passadore, C., and Möller, L. (2019). Genetic
325–383. doi: 10.1146/annurev.es.05.110174.001545 relatedness delineates the social structure of southern Australian bottlenose
Anderson, J. M., Burns, E. S., Meese, E. N., Farrugia, T. J., Stirling, B. S., White, dolphins. Behav. Ecol. 30, 948–959. doi: 10.1093/beheco/arz033
C. F., et al. (2021a). Interannual nearshore habitat use of young of the year Dicken, M. L., and Booth, A. J. (2013). Surveys of white sharks (Carcharodon
white sharks off Southern California. Front. Mar. Sci. 8:645142. doi: 10.3389/ carcharias) off bathing beaches in Algoa Bay, South Africa. Mar. Freshw. Res.
fmars.2021.645142 64:530. doi: 10.1071/MF12336
Anderson, J. M., Spurgeon, E. A., Stirling, B. S., May, J. I., Rex, P. T., Hyla, B., Domeier, M., and Nasby-Lucas, N. (2008). Migration patterns of white sharks
et al. (2021b). High resolution acoustic telemetry reveals swim speeds and Carcharodon carcharias tagged at Guadalupe Island, Mexico, and identification
inferred field metabolic rates in juvenile white sharks (Carcharadon carcharias). of an eastern Pacific shared offshore foraging area. Mar. Ecol. Prog. Ser. 370,
Commun. Biol. 221–237. doi: 10.3354/meps07628
Aplin, L. M., Farine, D. R., Morand-Ferron, J., Cole, E. F., Cockburn, A., and Duffy, C., Francis, M. P., and Bonfil, R. (2012). “Regional population
Sheldon, B. C. (2013). Individual personalities predict social behaviour in wild connectivity, oceanic habitat, and return migration revealed by sat-
networks of great tits (Parus major). Ecol. Lett. 16, 1365–1372. doi: 10.1111/ele. ellite tagging of white sharks,Carcharodon carcharias, at NewZealand
12181 aggregation sites,” in Global perspectiveson the biology and life history
Armansin, N. C., Lee, K. A., Huveneers, C., and Harcourt, R. G. (2016). of the white shark, ed. M. L. Domeier (Boca Raton, FL: CRC Press),
Integrating social network analysis and fine-scale positioning to characterize 310–318.
the associations of a benthic shark. Anim. Behav. 115, 245–258. doi: 10.1016/j. Farine, D. R. (2013). Animal social network inference and permutations for
anbehav.2016.02.014 ecologists in R using asnipe. Methods Ecol. Evol. 4, 1187–1194. doi: 10.1111/
Bejder, L., Fletcher, D., and Brager, S. (1998). A method for testing association 2041-210X.12121
patterns of social animals. Anim. Behav. 56, 719–725. doi: 10.1006/anbe.1998. Farine, D. R., Firth, J. A., Aplin, L. M., Crates, R. A., Culina, A., Garroway, C. J.,
0802 et al. (2015). The role of social and ecological processes in structuring animal
Berdahl, A. M., Kao, A. B., Biro, D., Flack, A., Westley, P. A. H., Codling, populations: A case study from automated tracking of wild birds. R. Soc. Open
E. A., et al. (2018). Collective animal navigation and migratory culture: from Sci. 2:150057. doi: 10.1098/rsos.150057
theoretical models to empirical evidence. Philos. Trans. R. Soc. Lond. B Biol. Sci. Farine, D. R., and Whitehead, H. (2015). Constructing, conducting and
373:20170009. doi: 10.1098/rstb.2017.0009 interpreting animal social network analysis. J. Anim. Ecol. 84, 1144–1163. doi:
Bruce, B. D., and Bradford, R. W. (2008). Spatial dynamics and habitat preferences 10.1111/1365-2656.12418
of juvenile white sharks – identifying critical habitat and options for monitoring Findlay, R., Gennari, E., Cantor, M., and Tittensor, D. P. (2016). How solitary are
recruitment. Hobart, TAS: CSIRO Marine and Atmospheric Research. white sharks: social interactions or just spatial proximity? Behav. Ecol. Sociobiol.
Bruce, B. D., Harasti, D., Lee, K., Gallen, C., and Bradford, R. (2019). Broad- 70, 1735–1744. doi: 10.1007/s00265-016-2179-y
scale movements of juvenile white sharks Carcharodon carcharias in eastern Franks, D. W., Ruxton, G. D., and James, R. (2010). Sampling animal association
Australia from acoustic and satellite telemetry. Mar. Ecol. Prog. Ser. 619, 1–5. networks with the gambit of the group. Behav. Ecol. Sociobiol. 64, 493–503.
doi: 10.3354/meps12969 doi: 10.1007/s00265-009-0865-8
Bruce, B. D., Stevens, J. D., and Malcolm, H. (2006). Movements and swimming Grueter, C. C., Qi, X., Zinner, D., Bergman, T., Li, M., Xiang, Z., et al. (2020).
behaviour of white sharks (Carcharodon carcharias) in Australian waters. Mar. Multilevel organisation of animal sociality. Trends Ecol. Evol. 35:24. doi: 10.
Biol. 150, 161–172. doi: 10.1007/s00227-006-0325-1 1016/j.tree.2020.05.003
Cailliet, G. M., Natanson, L. J., Weldon, B. A., and Ebert, D. (1985). Preliminary Guttridge, T. L., van Dijk, S., Stamhuis, E. J., Krause, J., Gruber, S. H., and Brown, C.
studies on the age and growth of the white shark Carcharodon carcharias, using (2013). Social learning in juvenile lemon sharks, Negaprion brevirostris. Anim.
vertebral bands. Bull. South. Calif. Acad. Sci. Mem. 9, 49–60. Cogn. 16, 55–64. doi: 10.1007/s10071-012-0550-6
Cairns, S. J., and Schwager, S. J. (1987). A comparison of association indices. Anim. Harasti, D., Lee, K., Bruce, B., Gallen, C., and Bradford, R. (2017). Juvenile
Behav. 35, 1454–1469. doi: 10.1016/S0003-3472(87)80018-0 white sharks Carcharodon carcharias use estuarine environments in
Calcagno, V., and de Mazancourt, C. (2010). glmulti: An R Package for easy south-eastern Australia. Mar. Biol. 164, 1–14. doi: 10.1007/s00227-017-3
automated model selection with (Generalized) Linear Models. J. Stat. Software 087-z
34:63083. Haulsee, D. E., Fox, D. A., Breece, M. W., Brown, L. M., Kneebone, J., Skomal, G. B.,
Campbell, L. A. D., Tkaczynski, P. J., Lehmann, J., Mouna, M., and Majolo, B. et al. (2016). Social network analysis reveals potential fission-fusion behavior in
(2018). Social thermoregulation as a potential mechanism linking sociality and a shark. Sci. Rep. 6, 1–9. doi: 10.1038/srep34087
fitness: Barbary macaques with more social partners form larger huddles. Sci. Heupel, M. R., Carlson, J. K., and Simpfendorfer, C. A. (2007). Shark nursery areas:
Rep. 8:6074. doi: 10.1038/s41598-018-24373-4 Concepts, definition, characterization and assumptions. Mar. Ecol. Prog. Ser.
Carey, G. (2013). Quantitative Methods in Neuroscience. Boulder, CO: University 337, 287–297. doi: 10.3354/meps337287
of Colorado, Boulder. Heupel, M. R., Semmens, J. M., and Hobday, A. J. (2006). Automated acoustic
Chapman, D. D., Babcock, E. A., Gruber, S. H., Dibattista, J. D., Franks, B. R., tracking of aquatic animals: scales, design and deployment of listening station
Kessel, S. A., et al. (2009). Long-term natal site-fidelity by immature lemon arrays. Mar. Freshw. Res. 57:91. doi: 10.1071/MF05091
sharks (Negaprion brevirostris) at a subtropical island. Mol. Ecol. 18, 3500– Huveneers, C., Simpfendorfer, C. A., Kim, S., Semmens, J. M., Hobday, A. J.,
3507. doi: 10.1111/j.1365-294X.2009.04289.x Pederson, H., et al. (2016). The influence of environmental parameters on the
Clevenstine, A. J., and Lowe, C. G. (2021). Aggregation site fidelity and performance and detection range of acoustic receivers. Methods Ecol. Evol. 7,
movement patterns of the protected marine predator giant sea bass (Stereolepis 825–835. doi: 10.1111/2041-210X.12520
gigas). Environ. Biol. Fishes 104, 401–417. doi: 10.1007/s10641-021-01 Jacoby, D. M. P., Busawon, D. S., and Sims, D. W. (2010). Sex and
077-9 social networking: the influence of male presence on social structure
Compagno, L. (2002). Sharks of the world: an annotated and illustrated of female shark groups. Behav. Ecol. 21, 808–818. doi: 10.1093/beheco/a
catalogue of shark species known to date. Bullhead, mackerel andcarpet sharks rq061
(Heterodontiformes, Lamniformes and Orectolobiformes), Vol. 2. Rome: Food Jacoby, D. M. P., Croft, D. P., and Sims, D. W. (2011). Social behaviour in sharks
and Agriculture Organization of the United Nations. and rays: analysis, patterns and implications for conservation. Fish Fish. 13,
Csardi, G., and Nepusz, T. (2006). The igraph software package for complex 399–417. doi: 10.1111/j.1467-2979.2011.00436.x
network research. InterJournal Complex Syst. 1695, 1–9. Jacoby, D. M. P., and Freeman, R. (2016). Emerging network-based tools in
Curtis, T. H., Metzger, G., Fischer, C., McBride, B., McCallister, M., Winn, L. J., movement ecology. Trends Ecol. Evol. 31, 301–314. doi: 10.1016/j.tree.201
et al. (2018). First insights into the movements of young-of-the-year white 6.01.011
Frontiers in Marine Science | www.frontiersin.org 12 September 2021 | Volume 8 | Article 688505Anderson et al. Sociality in Juvenile White Sharks
Jacoby, D. M. P., Papastamatiou, Y. P., and Freeman, R. (2016). Inferring animal Noldus, R., and Van Mieghem, P. (2015). Assortativity in complex networks.
social networks and leadership: Applications for passive monitoring arrays. J. R. J. Complex Networks 3, 507–542. doi: 10.1093/comnet/cnv005
Soc. Interface 13:20160676. doi: 10.1098/rsif.2016.0676 Oksanen, J., Blanchet, F. G., Friendly, M., Kindt, R., Legendre, P., McGlinn, D.,
Jones, T. B., Green, J. A., Patrick, S. C., Evans, J. C., Wells, M. R., Rodr Iguez- et al. (2011). vegan: Community Ecology Package. Available online at: https:
Malag, M. A., et al. (2020). Consistent sociality but flexible social associations //CRAN.R-project.org/package=vegan
across temporal and spatial foraging contexts in a colonial breeder. Ecol. Lett. Oñate-González, E. C., Sosa-Nishizaki, O., Herzka, S. Z., Lowe, C. G., Lyons, K.,
23, 1085–1096. doi: 10.1111/ele.13507 Santana-Morales, O., et al. (2017). Importance of bahia sebastian vizcaino as
Jorgensen, S. J., Chapple, T. K., Anderson, S., Hoyos, M., Reeb, C., and Block, a nursery area for white sharks (Carcharodon carcharias) in the Northeastern
B. A. (2010). “Connectivity among White Shark Coastal aggregation areas in Pacific: A fishery dependent analysis. Fish. Res. 188, 125–137. doi: 10.1016/j.
the Northeastern pacific,” in Global Perspectives on the Biology and Life History fishres.2016.12.014
of the White Shark, ed. M. L. Domeier (Boca Raton, FL: CRC Press), 159–168. Papastamatiou, Y. P., Bodey, T. W., Caselle, J. E., Bradley, D., Freeman, R.,
Kanive, P. E., Rotella, J. J., Chapple, T. K., Anderson, S. D., White, T. D., Block, Friedlander, A. M., et al. (2020). Multiyear social stability and social information
B. A., et al. (2021). Estimates of regional annual abundance and population use in reef sharks with diel fission-fusion dynamics: Shark sociality and
growth rates of white sharks off central California. Biol. Conserv. 257:109104. information use. Proc. R. Soc. B Biol. Sci. 287:9. doi: 10.1098/rspb.2020.1063
doi: 10.1016/j.biocon.2021.109104 Perryman, R. J. Y., Venables, S. K., Tapilatu, R. F., Marshall, A. D., Brown, C., and
Kessel, S. T., Cooke, S. J., Heupel, M. R., Hussey, N. E., Simpfendorfer, C. A., Vagle, Franks, D. W. (2019). Social preferences and network structure in a population
S., et al. (2014). A review of detection range testing in aquatic passive acoustic of reef manta rays. Behav. Ecol. Sociobiol. 73, 1–18. doi: 10.1007/s00265-019-
telemetry studies. Rev. Fish. Biol. Fish. 24, 199–218. doi: 10.1007/s11160-013- 2720-x
9328-4 Poysa, H. (1992). Group foraging in patchy environments: the importance of
Klimley, A. P., and Holloway, C. F. (1999). School fidelity and homing coarse- level local enhancement. Ornis Scand. 23, 159–166. doi: 10.2307/
synchronicity of yellowfin tuna, Thunnus albacares. Mar. Biol. 133, 307–317. 3676444
doi: 10.1007/s002270050469 Ramos-Fernández, G., and Morales, J. M. (2014). Unraveling fission-fusion
Kock, A., O’Riain, M. J., Mauff, K., Meÿer, M., Kotze, D., and Griffiths, C. (2013). dynamics: how subgroup properties and dyadic interactions influence
Residency, habitat use and sexual segregation of white sharks, carcharodon individual decisions. Behav. Ecol. Sociobiol. 68, 1225–1235. doi: 10.1007/
carcharias in False Bay, South Africa. PLoS One 8:e55048. doi: 10.1371/journal. s00265-014-1733-8
pone.0055048 Raoult, V., Williamson, J. E., Smith, T. M., and Gaston, T. F. (2019). Effects of
Kock, A. A., Photopoulou, T., Durbach, I., Mauff, K., Meÿer, M., Kotze, D., on-deck holding conditions and air exposure on post-release behaviours of
et al. (2018). Summer at the beach: Spatio-temporal patterns of white shark sharks revealed by a remote operated vehicle. J. Exp. Mar. Bio. Ecol. 511, 10–18.
occurrence along the inshore areas of False Bay, South Africa. Mov. Ecol. 6, doi: 10.1016/j.jembe.2018.11.003
1–13. doi: 10.1186/s40462-018-0125-5 Robbins, R. (2007). Environmental variables affecting the sexual segregation of
Krause, J., and Ruxton, G. D. (2002). Living in Groups. Oxford: Oxford great white sharks Carcharodon carcharias at the Neptune Islands South
University Press. Australia. J. Fish Biol. 70, 1350–1364. doi: 10.1111/j.1095-8649.2007.0
Lilly, J., McLean, M. F., Dadswell, M. J., Wirgin, I., Comolli, P., and 1414.x
Stokesbury, M. J. W. (2020). Use of social network analysis to examine Robitaille, A. L., Webber, Q. M. R., and Vander Wal, E. (2019). Conducting
preferential co-occurrences in Atlantic Sturgeon Acipenser oxyrinchus social network analysis with animal telemetry data: Applications and methods
oxyrinchus Mitchill, 1815. Anim. Biotelemetry 8:14. doi: 10.1186/s40317-020-0 using spatsoc. Methods Ecol. Evol. 10, 1203–1211. doi: 10.1111/2041-210X.1
0201-3 3215
Lusseau, D., Wilson, B., Hammond, P. S., Grellier, K., Durban, J. W., Parsons, K. M., Sabol, A. C., Lambert, C. T., Keane, B., Solomon, N. G., and Dantzer, B. (2020).
et al. (2006). Quantifying the influence of sociality on population structure in How does individual variation in sociality influence fitness in prairie voles?
bottlenose dolphins. J. Anim. Ecol. 75, 14–24. doi: 10.1111/j.1365-2656.2005. Anim. Behav. 163, 39–49. doi: 10.1016/j.anbehav.2020.02.009
01013.x Schilds, A., Mourier, J., Huveneers, C., Nazimi, L., Fox, A., and Leu, S. T. (2019).
Lyons, K., Jarvis, E. T., Jorgensen, S. J., Weng, K., O’sullivan, J., Winkler, Evidence for non-random co-occurrences in a white shark aggregation. Behav.
C., et al. (2013). The degree and result of gillnet fishery interactions with Ecol. Sociobiol. 73, 1–12. doi: 10.1007/s00265-019-2745-1
juvenile white sharks in southern California assessed by fishery-independent Sequeira, A. M. M., Thums, M., Brooks, K., and Meekan, M. G. (2016). Error
and-dependent methods. Fish. Res. 147, 370–380. doi: 10.1016/j.fishres.2013.0 and bias in size estimates of whale sharks: Implications for understanding
7.009 demography. R. Soc. Open Sci. 3:150668. doi: 10.1098/rsos.150668
May, C., Meyer, L., Whitmarsh, S., and Huveneers, C. (2019). Eyes on the size: Silk, M. J., Croft, D. P., Tregenza, T., and Bearhop, S. (2014). The importance
Accuracy of visual length estimates of white sharks, Carcharodon carcharias. of fission-fusion social group dynamics in birds. Ibis (Lond). 156, 701–715.
R. Soc. Open Sci. 6:190456. doi: 10.1098/rsos.190456 doi: 10.1111/ibi.12191
Merriam-Webster. (2021). Sociality. Available Online at: https://www.merriam- Simpfendorfer, C. A., Huveneers, C., Steckenreuter, A., Tattersall, K., Hoenner, X.,
webster.com/dictionary/sociality [Accessed March 3, 2021] Harcourt, R., et al. (2015). Ghosts in the data: False detections in VEMCO
Meese, E. N., and Lowe, C. G. (2019). Finding a resting place: How environmental pulse position modulation acoustic telemetry monitoring equipment. Anim.
conditions influence the habitat selection of resting batoids. Bull. South. Biotelemetry 3:55. doi: 10.1186/s40317-015-0094-z
California Acad. Sci. 118:87. doi: 10.3160/0038-3872-118.2.87 Simpfendorfer, C. A., and Milward, N. E. (1993). Utilisation of a tropical bay as a
Mourier, J., Lédée, E. J. I., and Jacoby, D. M. P. (2019). A multilayer perspective for nursery area by sharks of the families Carcharhinidae and Sphyrnidae. Environ.
inferring spatial and social functioning in animal movement networks. bioRxiv Biol. Fishes 37, 337–345. doi: 10.1007/bf00005200
2019:749085. doi: 10.1101/749085 Sims, D. W., Southall, E. J., Quayle, V. A., and Fox, A. M. (2000). Annual social
Mourier, J., and Planes, S. (2021). Kinship does not predict the structure of a shark behaviour of basking sharks associated with coastal front areas. Proc. R. Soc. B
social network. Behav. Ecol. 32, 211–222. doi: 10.1093/beheco/araa119 Biol. Sci. 267, 1897–1904. doi: 10.1098/rspb.2000.1227
Mourier, J., Vercelloni, J., and Planes, S. (2012). Evidence of social communities in Spaet, J. L. Y., Patterson, T. A., Bradford, R. W., and Butcher, P. A. (2020).
a spatially structured network of a free-ranging shark species. Anim. Behav. 83, Spatiotemporal distribution patterns of immature Australasian white sharks
389–401. doi: 10.1016/j.anbehav.2011.11.008 (Carcharodon carcharias). Sci. Rep. 10, 1–13. doi: 10.1038/s41598-020-6
Newman, M. E. J. (2002). Assortative mixing in networks. Phys. Rev. Lett. 6876-z
89:208701. doi: 10.1103/PhysRevLett.89.208701 Spaet, J., Manica, A., Brand, C., Gallen, C., and Butcher, P. (2020). Environmental
Newman, M. E. J. (2006). Finding community structure in networks using the conditions are poor predictors of immature white shark Carcharodon
eigenvectors of matrices. Phys. Rev. E 74:036104. doi: 10.1103/PhysRevE.74. carcharias occurrences on coastal beaches of Eastern Australia. Mar. Ecol. Prog.
036104 Ser. 653, 167–179. doi: 10.3354/meps13488
Frontiers in Marine Science | www.frontiersin.org 13 September 2021 | Volume 8 | Article 688505You can also read


