Rapid Accumulation of Proline Enhances Salinity Tolerance in Australian Wild Rice Oryza australiensis Domin
←
→
Page content transcription
If your browser does not render page correctly, please read the page content below
Article

Rapid Accumulation of Proline Enhances Salinity Tolerance in
Australian Wild Rice Oryza australiensis Domin
Ha Thi Thuy Nguyen *, Sudipta Das Bhowmik, Hao Long, Yen Cheng, Sagadevan Mundree and
Linh Thi My Hoang *

                                          Centre for Agriculture and the Bioeconomy, Queensland University of Technology (QUT), 2 George Street,
                                          Brisbane, QLD 4000, Australia; sudipta.dasbhowmik@qut.edu.au (S.D.B.); h1.long@qut.edu.au (H.L.);
                                          alam.cheng@qut.edu.au (Y.C.); sagadevan.mundree@qut.edu.au (S.M.)
                                          * Correspondence: thithuyha.nguyen@hdr.qut.edu.au (H.T.T.N.); lt.hoang@qut.edu.au (L.T.M.H.);
                                             Tel.: +61‐731‐380‐617

                                          Abstract: Proline has been reported to play an important role in helping plants cope with several
                                          stresses, including salinity. This study investigates the relationship between proline accumulation
                                          and salt tolerance in an accession of Australian wild rice Oryza australiensis Domin using morpho‐
                                          logical, physiological, and molecular assessments. Seedlings of O. australiensis wild rice accession
                                          JC 2304 and two other cultivated rice Oryza sativa L. cultivars, Nipponbare (salt‐sensitive), and Pok‐
                                          kali (salt‐tolerant), were screened at 150 mM NaCl for 14 days. The results showed that O. aus‐
                                          traliensis was able to rapidly accumulate free proline and lower osmotic potential at a very early
                                          stage of salt stress compared to cultivated rice. The qRT‐PCR result revealed that O. australiensis
                                          wild rice JC 2304 activated proline synthesis genes OsP5CS1, OsP5CS2, and OsP5CR and depressed
Citation: Nguyen, H.T.T.; Das             the expression of proline degradation gene OsProDH as early as 1 h after exposure to salinity stress.
Bhowmik, S.; Long, H.; Cheng, Y.;         Wild rice O. australiensis and Pokkali maintained their relative water content and cell membrane
Mundree, S.; Hoang, L.T.M. Rapid          integrity during exposure to salinity stress, while the salt‐sensitive Nipponbare failed to do so. An
Accumulation of Proline Enhances          analysis of the sodium and potassium contents suggested that O. australiensis wild rice JC 2304
Salinity Tolerance in Australian
                                          adapted to ionic stress caused by salinity by maintaining a low Na+ content and low Na+/K+ ratio in
Wild Rice Oryza australiensis Domin.
                                          the shoots and roots. This demonstrates that O. australiensis wild rice may use a rapid accumulation
Plants 2021, 10, 2044. https://doi.org/
                                          of free proline as a strategy to cope with salinity stress.
10.3390/plants10102044

                                          Keywords: Oryza australiensis; osmotic adjustment; proline; physiological parameters; qRT‐PCR;
Academic Editor: Pirjo Mäkelä,
Mercè Llugany, Peter A. Roussos
                                          salinity tolerance; wild rice
and Mumtaz Cheema

Received: 22 August 2021
Accepted: 27 September 2021               1. Introduction
Published: 28 September 2021
                                                 Salinity causes major constraints in global crop production [1]. The impacts of salin‐
                                          ity on crop yield vary greatly in different plants. For example, when grown on salt‐af‐
Publisher’s Note: MDPI stays neu‐
                                          fected land in the Indian Indo‐Gangetic Basin, the yields lost for rice, wheat (Triticum aes‐
tral with regard to jurisdictional
                                          tivum L.), cotton (Gossypium herbaceum L.), and sugar cane (Saccharum officinarum L.) were
claims in published maps and institu‐
tional affiliations.
                                          recorded at 45 %, 39 %, 63 %, and 48 %, respectively [2]. Cultivated rice Oryza sativa L. is
                                          one of the most important crops and serves more than one‐half of the world’s population
                                          [3]. However, cultivated rice is also reported as one of the most salt‐sensitive cereals [4].
                                          It has been estimated that salinity results in a 20% loss of global rice production [5]. Sev‐
Copyright: © 2021 by the authors. Li‐     eral strategies have been used to improve salt tolerance in cultivated rice O. sativa, includ‐
censee MDPI, Basel, Switzerland.          ing conventional breeding, genetic modification, and genome editing [6,7].
This article is an open access article           Wild Oryza spp. rice has been used as a genetic resource to improve salinity stress
distributed under the terms and con‐      tolerance in cultivated rice through conventional breeding for decades [8]. However, there
ditions of the Creative Commons At‐       is still a knowledge gap in understanding the salt tolerance mechanisms in these wild rice
tribution (CC BY) license (https://cre‐   species [9]. Oryza australiensis Domin is an endemic wild rice species that belongs to the
ativecommons.org/licenses/by/4.0/).       EE genome taxa of the Oryza genus. This wild rice species is perennially distributed across

Plants 2021, 10, 2044. https://doi.org/10.3390/plants10102044                                                         www.mdpi.com/journal/plants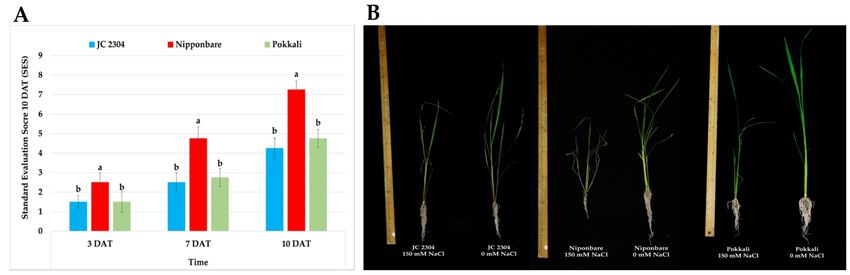
Plants 2021, 10, 2044                                                                                           2 of 16

                        Northern Australia. It grows in seasonally wet locations and has a rhizome that allows the
                        plants to survive in the dry season. Due to these characteristics, O. australiensis has been
                        suggested as a potential genetic source for drought tolerance [10]. In addition, this species
                        also has traits associated with other abiotic and biotic stress tolerance, including heat tol‐
                        erance [11] and brown planthopper (Nilaparvata lugens Stål) resistance [12]. Recently, Yi‐
                        chie et al. [13] found that proteins belonging to the transport, metabolic process, and trans‐
                        membrane transporter categories were highly responsive to salt treatment in O. aus‐
                        traliensis. This wild rice also showed the least reduction in biomass accumulation, SES
                        score, chlorophyll content, and lowest average shoot Na+/K+ ratio in response to salinity
                        compared to other wild and cultivated rice under 80 mM NaCl treatment [13]. However,
                        no study on the responses of this wild rice species to higher salt concentration has been
                        reported.
                              High salt concentrations in the soil lead to deleterious effects on plants due to osmotic
                        and ionic stresses. The short‐term exposure to salinity stress resulted in the reduction of
                        osmotic potential on the outside roots, disrupting the water uptake, leading to a signifi‐
                        cant decline in the shoot growth rate [4]. The adverse effects of osmotic stress reduce cell
                        expansion in root tips and leaf expansion, causing stomatal closure. Consequently, it
                        causes a decrease in photosynthesis, leading to the accumulation of reactive oxygen spe‐
                        cies (ROS) [14]. To adapt to osmotic stress, plants evolve an osmoprotectant mechanism
                        to adjust cellular osmotic potential [15]. Under this mechanism, plants accumulate suffi‐
                        cient compatible osmolytes to adjust osmotic potential and balance soil osmotic pressure
                        [16–18].
                              Proline is a proteinogenic amino acid that has been accumulated as a beneficial solute
                        in plants under both non‐stress and stress conditions [19]. Proline was first reported to be
                        accumulated in ryegrass (Lolium perenne L.) upon wilting conditions [20]. The accumula‐
                        tion of proline naturally occurs in the cytoplasm, where it acts as an osmoprotectant to
                        defend against osmotic stress [21–24]. A high level of proline in the cytosol reduces the
                        cellular water potential below the external water potential, enhancing the water flow into
                        the cells to maintain cellular water status and plant cell turgidity [22,25]. Apart from act‐
                        ing as an osmolyte for osmotic adjustment, proline contributes to stabilizing subcellular
                        structures (e.g., proteins and membranes) [26], buffering cellular redox potential against
                        stresses [22,27,28]. Proline has also been reported to play a role in mitigating ROS’s dele‐
                        terious effects [27,29], maintaining the NADP/NADPH ratio compatibility and alleviating
                        cytoplasmic pH [22]. Upon stress, proline supports mitochondrial oxidative phosphory‐
                        lation to generate energy for plants to recover from stress [22,30,31]. In higher plants, pro‐
                        line is synthesized via glutamate or ornithine pathways [24,32]. The radioisotope labeling
                        experiment indicated that the glutamate pathway is predominant for proline synthesis
                        during osmotic stress. In contrast, the ornithine pathway was the primary route under
                        high nitrogen application [24]. In the glutamate pathway, glutamate is converted to γ‐
                        glutamyl semialdehyde (GSA) by a bifunctional enzyme Δ‐pyrroline‐5‐carboxylate syn‐
                        thetase enzyme (P5CS), which has both γ‐GK and γ‐GPR domains [33]. GSA then sponta‐
                        neously cyclizes to Δ‐pyrroline‐5‐carboxylate (P5C). P5C is then reduced to proline by
                        enzyme Δ‐pyrroline‐5‐carboxylate reductase (P5CR) [17,26]. Proline dehydrogenase
                        (ProDH) catalyzes proline to P5C in mitochondria [26]. The proline content was reported
                        to increase in many plants during salinity stress [34–36]. The accumulation of proline oc‐
                        curs under salinity stress mainly due to the stimulated synthesis in the tissue, the inhibi‐
                        tion of proline oxidation in the mitochondria, and the plant’s ability to maintain the mito‐
                        chondria membrane’s permeability [24,37].
                              This study investigates the accumulation of free proline in O. australiensis accession
                        JC 2304 during the exposure to high salinity stress and analyses the relationship between
                        proline accumulation and salt tolerance in this wild rice species using molecular, morpho‐
                        logical, and physiological assessments.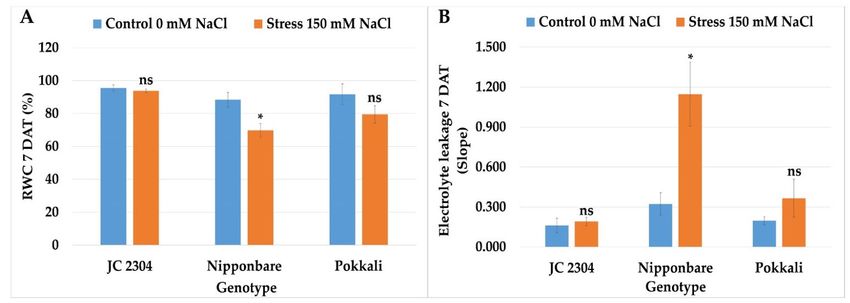
Plants 2021, 10, 2044                                                                                                                3 of 16

                                    2. Results
                                    2.1. Wild Rice O. australiensis Rapidly Accumulated Free Proline under Salinity Stress
                                         Proline is one of the most common osmolytes that contributes to the cellular osmotic
                                   potential change under various abiotic stresses. In this study, we observed that O. aus‐
                                   traliensis wild rice accession JC 2304 accumulated higher free proline content and more
                                   rapidly in response to salinity stress compared to the salt‐tolerant (Pokkali) and salt‐sen‐
                                   sitive (Nipponbare) O. sativa cultivars (Figure 1). Before the onset of salinity stress, free
                                   proline contents in cultivated rice cultivars were around 2 μmol g−1 FW (Figure 1B,C);
                                   meanwhile, the wild rice had only 0.71 μmol g−1 FW free proline (Figure 1A). However,
                                   within 48 h of salinity stress, a clear contrasting difference in the proline content was ob‐
                                   served between the wild rice and the cultivated rice cultivars. Wild rice JC 2304 sharply
                                   increased free proline content nearly seven times, from 0.71 μmol g−1 FW to 4.68 μmol g−1
                                   FW, after 24 h of exposure to salinity stress and steadily maintained at 4.72 μmol g−1 FW
                                   for up to 48 h (Figure 1A). In contrast, the two cultivated rice cultivars, Nipponbare and
                                   Pokkali, showed slight increases in free proline content by only 0.09 and 0.52 μmol g−1 FW,
                                   respectively (Figure 1B,C). After 72 h of salinity stress exposure, the proline content in the
                                   O. australiensis wild rice declined to about 3.27 μmol g−1 FW; meanwhile, Nipponbare and
                                   Pokkali had lower levels of proline content. The Nipponbare salt‐stressed plants had a
                                   slight increase in free proline content to 3.0 μmol g−1 FW at day seven of salt stress,
                                   whereas the salt‐stressed plants of Pokkali had a slight decrease in proline content to 2.0
                                   μmol g−1 FW. Wild rice O. australiensis still maintained a high free proline content at 2.5
                                   μmol g−1 FW. Overall, wild rice JC 2304 and Pokkali showed the same trend in proline
                                   accumulation, i.e., more proline was accumulated in the leaves of salt‐stressed plants com‐
                                   pared to non‐stressed plants. However, the significant proline accumulation was only ob‐
                                   served in JC 2304 but not Pokkali during the seven days of testing (Figure 1A,C). Nippon‐
                                   bare, on the other hand, showed the opposite trend to JC 2304 and Pokkali. This cultivar
                                   did not accumulate proline in the first 48 h of exposure to NaCl treatment but later at three
                                   and seven DAT (Figure 1B). These results suggest that O. australiensis wild rice may rap‐
                                   idly accumulate proline to withstand high salinity stress.

      Figure 1. Effects of salinity stress (150 mM NaCl) on free proline content of wild and cultivated rice at the seedling stage.
      (A) Wild rice O. australiensis JC 2304. (B) Cultivated rice O. sativa cultivar Nipponbare. (C) Cultivated rice O. sativa cultivar
      Pokkali. Data are means ± SE (n = 3). Asterisks indicate the significant difference (p ≤ 0.05), ns‐not significant, based on the
      Student t‐test between salt‐stressed and non‐stressed counterparts. DAT—day after treatment. FW – fresh weight.

                                   2.2. Wild Rice O. australiensis Activated Proline Synthesis and Depressed Proline Degradation
                                   Genes at the Early Stage of Exposure to Salinity Stress
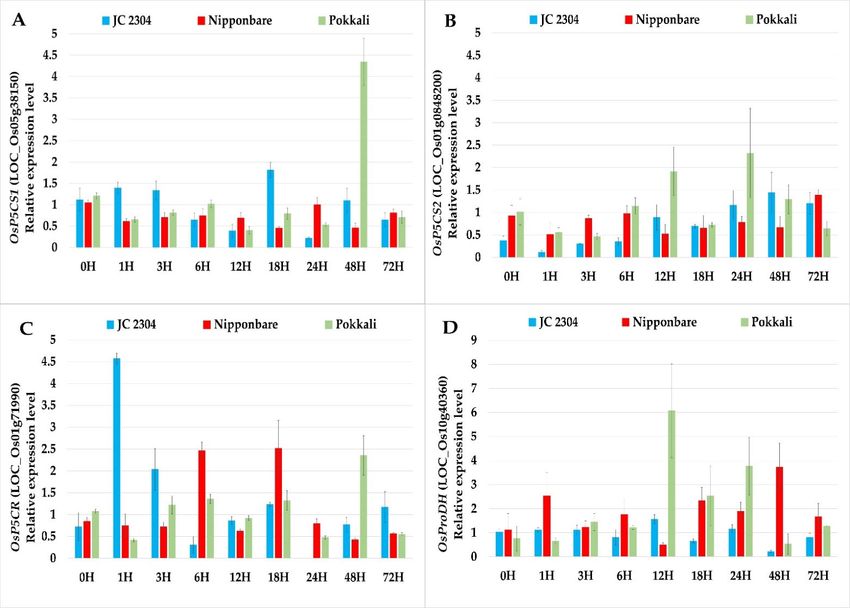
                                        The results of the qRT‐PCR gene expression analyses showed that the genes related
                                   to proline biosynthesis (OsP5CS1 and OsP5CR) were upregulated in O. australiensis wild
                                   rice JC 2304 as early as 1 h upon exposure to 150 mM NaCl. The transcripts levels of
                                   OsP5CS1 and OsP5CR in leaves of O. australiensis wild rice were observed to increase 1.5‐
                                   and 4.5‐fold within the first hour of salinity exposure, respectively (Figure 2A,C). On the
                                   contrary, none of the genes involved in proline biosynthesis were upregulated in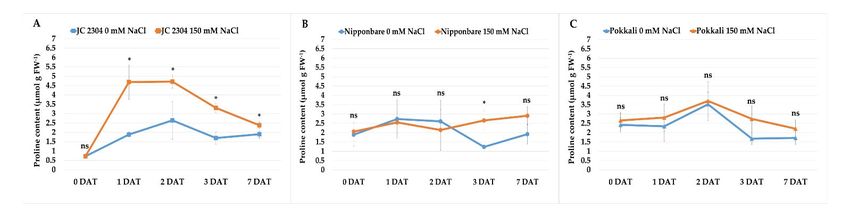
Plants 2021, 10, 2044                                                                                                            4 of 16

                                  Nipponbare or Pokkali before the 6 h time point. Noticeably, the expressions of two
                                  OsP5CS genes in Nipponbare were not switched on until 72 h of salinity stress (Figure
                                  2A,B). Another proline synthesis gene, OsP5CR, was upregulated approximately 2.5‐fold
                                  at 6 h and 18 h but remained downregulated at all other time points in Nipponbare. In
                                  Pokkali, the expression level of the OsP5CS2 gene increased significantly at 12 h and 24 h
                                  following the salinity treatment; however, the other genes in the proline biosynthesis
                                  pathway, OsP5CS1 and OsP5CR, were significantly upregulated only after 48 h of salt ex‐
                                  posure (Figure 2). In terms of the proline degradation gene, we observed a 2.5‐fold in‐
                                  crease in the expression level of OsProDH in Nipponbare as early as 1 h after the salinity
                                  treatment, and the highest transcripts level of this gene in Nipponbare was recorded at
                                  the 48 h time point with a 3.7‐fold increase (Figure 2D). In Pokkali, the transcripts level of
                                  OsProDH peaked at 12 h after salt stress with an approximately 6.1‐fold increase, and the
                                  expression level decreased thereafter. In contrast, no change was noticed in the transcripts
                                  level of OsProDH in O. australiensis wild rice JC 2304 during a 72 h exposure to salinity
                                  stress except for a noticeable downregulation at the 48 h time point (Figure 2D).

      Figure 2. Effects of salinity stress (150 mM NaCL) on relative expression of proline metabolism genes in wild and culti‐
      vated rice. The relative expression was quantified as fold change in leaf tissue of cultivated rice (O. sativa) and wild rice
      (O. australiensis) by quantitative Real‐Time PCR (qRT‐PCR). (A) OsP5CS1. (B) OsP5CS2. (C) OsP5CR. (D) OsProDH. Levels
      of the transcript were normalized to two internal reference genes OsAct and OsEF‐1α. Expression levels of genes in salt‐
      stressed plants were normalized with respect to those in non‐stressed plants. Data represent the means ± SE (n = 9). H‐
      hours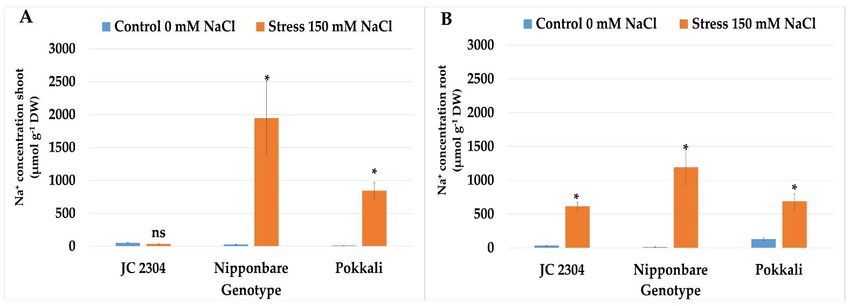
Plants 2021, 10, 2044                                                                                                            5 of 16

                                  2.3. Wild Rice O. australiensis Showed a High Tolerant Level to Salinity Stress
                                        The salinity tolerance of each rice genotype was evaluated based on the salt damage
                                  symptoms of the leaves and plants. In our study, we used the standard evaluation score
                                  (SES) of visual salt injury developed by Gregorio et al. at the International Rice Research
                                  Institute (IRRI) [38]. We observed that O. australiensis wild rice accession JC 2304 showed
                                  a similar level of tolerance to salinity stress to the well‐known salt‐tolerant cultivar
                                  Pokkali and a greater tolerance than the salt‐sensitive cultivar Nipponbare.
                                        On day three of exposure to 150 mM NaCl stress, the wild rice exhibited a similar
                                  SES to the salt‐tolerant rice Pokkali (SES = 1.5 ± 0.32). The salt‐sensitive cultivar
                                  Nipponbare, in contrast, started to show mild symptoms of salt injury, with an SES
                                  around 2.50 ± 0.50. With prolonged stress exposure (seven DAT), O. australiensis wild rice
                                  accession JC 2304 (SES = 2.5 ± 0.5) was still ranked as similarly tolerant compared to Pok‐
                                  kali (SES = 2.75 ± 0.45), while Nipponbare had an SES of 4.75 ± 0.59. As salt stress continued
                                  to 10 days, O. australiensis wild rice JC 2304, with an SES of 4.25 ± 0.52, was rated to be as
                                  tolerant as Pokkali (SES = 4.75 ± 0.45) (Figure 3A). On the other hand, the Nipponbare
                                  cultivar was rated as salt‐sensitive to 150 mM NaCl and showed severe salt damage symp‐
                                  toms with an SES around 7.25 ± 0.45. Regarding phenotypic changes, the wild rice and
                                  Pokkali salt‐stressed plants showed less salt injury symptoms, such as chlorosis or leaf
                                  rolling, compared to Nipponbare, which exhibited wilted leaf symptoms on day 10 of salt
                                  treatment (Figure 3B).

      Figure 3. Salinity tolerance of wild and cultivated rice under 150 mM NaCl treatment. (A) SES of wild rice JC 2304 and
      two cultivated rice cultivars (salt‐sensitive cultivar Nipponbare and salt‐tolerant cultivar Pokkali). (B) Phenotypes of wild
      and cultivated rice under 150 mM NaCl treatment for 10 days. Data represent the means ± SE (n = 8). Values labelled with
      different letters are significantly different at p < 0.05, based on the Turkey HSD test. DAT – day after treatment.

                                  2.4. Wild Rice O. australiensis Exhibited Higher Root Growth and Biomass than Cultivated
                                  Rice under Salinity Stress
                                       Increasing salt concentration in soils causes osmotic stress that affects cell expansion
                                  in root tips and, consequently, reduces root growth. Therefore, in this study, the effects of
                                  salinity stress on the root growth and biomass of O. australiensis wild rice JC 2304 and
                                  cultivated rice Nipponbare and Pokkali were investigated. The root length, fresh weight
                                  (FW), and dry weight (DW) data of salt‐stressed plants on day 14 were compared to those
                                  of their respective non‐stressed counterparts as the mean of ratio (Figure 4). As shown in
                                  Figure 4A, the relative root length of O. australiensis wild rice accession JC 2304 increased
                                  by 44% (stressed/non‐stressed root length ratio ⁓1.44), while the salt‐sensitive cultivated
                                  rice Nipponbare declined in root length by 22% (stressed/non‐stressed root length ratio
                                  ⁓0.78). No change was observed in the root length of the Pokkali plants under stressed
                                  and non‐stressed conditions (Figure 4A). On measuring the root FW ratio, O. australiensis
                                  wild rice JC 2304 significantly maintained a higher relative root fresh weight by more than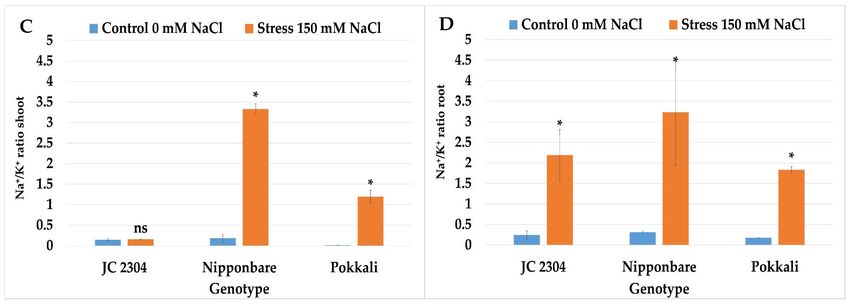
Plants 2021, 10, 2044                                                                                                             6 of 16

                                  two‐fold than Nipponbare and Pokkali, which had 25% and 46% reduced root fresh
                                  weights, respectively (Figure 4B). In addition, wild rice JC 2304 maintained a significantly
                                  higher relative root dry weight in comparison to the two cultivated rice, Nipponbare and
                                  Pokkali (Figure 4C).

      Figure 4. Effects of salinity stress (150 mM NaCl) on root length and root biomass (14 DAT) of wild and cultivated rice at
      the seedling stage. (A) Relative root length. (B) Relative root fresh weight. (C) Relative root dry weight. Data represent the
      means ± SE (n = 4). Value labeled with different letters is significantly different at p < 0.05, based on the Turkey HSD test.

                                  2.5. Wild Rice O. australiensis Lowered Osmotic Potential at the Early Stage of Exposure to
                                  Salinity Stress
                                       To determine whether the rapid accumulation of free proline in O. australiensis affects
                                  osmotic potential in this wild rice under salinity stress, we measured the osmotic potential
                                  in the second youngest fully expanded leaves of the wild rice and cultivated the rice on
                                  days three and seven following the salt treatment. The results showed that O. australiensis
                                  wild rice JC 2304 significantly lowered the osmotic potential from ‐1.49 MPa to ‐1.73 Mpa
                                  at day three of salt stress (Figure 5). Cultivated rice cultivars, on the contrary, had no sig‐
                                  nificant decreases in osmotic potential at three DAT (Figure 5A). Furthermore, the osmotic
                                  potential in the Nipponbare cultivar started to decrease significantly from day seven of
                                  salt stress, while the Pokkali cultivar still maintained an unchanged osmotic potential,
                                  whereas O. australiensis wild rice JC 2304 recorded an approximately 40% decrease in os‐
                                  motic potential compared to the non‐stressed controls (Figure 5B). These results suggest
                                  that proline accumulation in the O. australiensis wild rice JC 2304 might contribute to ad‐
                                  justing osmotic potential lowering in this wild rice accession.

      Figure 5. Effects of 150 mM NaCl on the osmotic potential of seedlings of wild and cultivated rice. (A) Osmotic potential
      3 DAT. (B) Osmotic potential 7 DAT. Data represent means ± SE (n = 3). Asterisks indicate the significant difference of salt‐
      stressed plants with respect to non‐stressed plants, based on the Student t‐test (ns‐not significant, * p ≤ 0.05). DAT—day
      after treatment.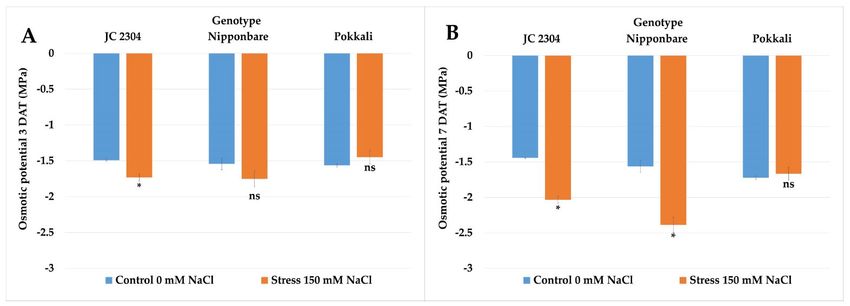
Plants 2021, 10, 2044                                                                                                              7 of 16

                                  2.6. Wild Rice O. australiensis Maintained Higher Relative Water Content and Cell Membrane
                                  Integrity under Salinity Stress Compared to Salt‐Sensitive Cultivated Rice
                                       Relative water content (RWC) and electrolyte leakage were used in many studies as
                                  key physiological parameters to evaluate salinity tolerance in rice [39–41]. Therefore, in
                                  this study, we measured the RWC and electrolyte leakage in O. australiensis wild rice JC
                                  2304, Pokkali, and Nipponbare plants’ exposure to 150 mM NaCl at day seven of salt‐
                                  treatment. Figure 6A shows that O. australiensis wild rice JC 2304 maintained the RWC at
                                  day seven at about 93.79%, which was not significantly different from the non‐stressed
                                  control counterparts and higher than was observed in the stressed Pokkali plants. On the
                                  contrary, the salt‐sensitive cultivated rice Nipponbare had a significant reduction in RWC
                                  by about 30% (Figure 6A). In terms of electrolyte leakage, Nipponbare encountered a
                                  sharp increase in electrolyte leakage by 3.8 times compared to the non‐stressed controls
                                  after seven days of exposure to salinity stress. In contrast, the electrolyte leakage of both
                                  O. australiensis wild rice accession JC 2304 and the salt‐tolerant Pokkali exhibited no sig‐
                                  nificant increase compared to the respective non‐stressed control counterparts (Figure 6B).
                                  These results further demonstrated that O. australiensis wild rice and the salt‐tolerant cul‐
                                  tivated rice Pokkali have abilities to mitigate the adverse effects of salinity on RWC and
                                  maintain plasma membrane integrity.

      Figure 6. Effects of 150 mM NaCl on relative water content and electrolyte leakage of wild and cultivated rice at 7 days
      exposure to salinity stress. (A) RWC. (B) Electrolyte leakage. Data represent the means ± SE (n = 3). Asterisks indicate the
      significant difference of salt‐stressed plants with respect to non‐stressed plants, based on the Student t‐test (ns‐not signif‐
      icant, * p ≤ 0.05). DAT—day after treatment.

                                  2.7. Wild Rice O. australiensis Accumulated Less Toxic Ion and Maintained a Lower Na+/K+
                                  Ratio in Shoots under Salinity Stress Compared to Cultivated Rice
                                       An excessive concentration of salinity in soil induces the accumulation of toxic ions
                                  in the roots and shoots of plants, injuring cells in transpiring leaves, leading to plant
                                  growth reduction. The accumulation of sodium ions in plant cells constrains potassium
                                  ions’ uptake, which is essential for plant growth. Therefore, the sodium and potassium
                                  ion content were measured in the shoots and roots of salt‐stressed plants at 14 days post‐
                                  salinity treatment. Under non‐stressed conditions, all three of the rice genotypes main‐
                                  tained the minimum Na+ in their shoots (Figure 7A). However, under 150 mM NaCl treat‐
                                  ment, a rapid increase in Na+ concentration was observed in the shoots of Nipponbare and
                                  Pokkali genotypes. Nipponbare accumulated 1946.68 μmol g−1 DW Na+, whereas Pokkali
                                  accumulated 843.2 μmol g−1 DW Na+ in the shoots, which was significantly higher than
                                  those in the non‐stressed control counterparts (Figure 7A). On the contrary, O. australiensis
                                  wild rice accession JC 2304 accumulated only 34.67 μmol g−1 DW Na+ in the shoots, which
                                  was not significantly different compared to the non‐stressed control plants (Figure 7A).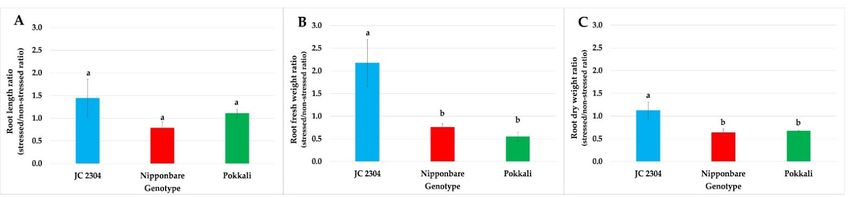
Plants 2021, 10, 2044                                                                                                       8 of 16

                                 The roots accumulated significantly more Na+ in all three of the tested genotypes com‐
                                 pared to their respective non‐stressed controls. Among these three genotypes, O. aus‐
                                 traliensis wild rice accession JC 2304 accumulated the least sodium content (613.6 μmol g−1
                                 DW), whereas Nipponbare plants accumulated the most (1193.51 μmol g−1 DW) in their
                                 roots (Figure 7B). The relative Na+/K+ ratio in the shoots of non‐stressed plants of all the
                                 genotypes exhibited less accumulation of Na+ ion than K+ ion. However, salinity stress
                                 induced significant increases in Na+ accumulation in the shoots of stressed Nipponbare
                                 and Pokkali plants. In contrast, O. australiensis wild rice JC 2304 did not significantly in‐
                                 crease the Na+/K+ ratio in the shoots compared to the respective non‐stressed control coun‐
                                 terparts (Figure 7C). Wild rice O. australiensis JC 2304 showed the lowest accumulation of
                                 Na+ in the shoots, with a Na+/K+ ratio of 0.15, whereas the concentration of Na+ accumula‐
                                 tions in the shoots of salt‐stressed plants of Nipponbare were 3.3 times higher than those
                                 in non‐stressed plants (Figure 7C). Like the shoots, the relative Na+/K+ ratio in the roots of
                                 all three of the genotypes under non‐stressed conditions remained very low (Figure 7D).
                                 Under salinity stress, O. australiensis wild rice JC 2304 and the salt‐tolerant cultivated rice
                                 Pokkali maintained a lower Na+/K+ ratio in their roots than in the salt‐sensitive cultivated
                                 rice Nipponbare. The salt‐stressed plants of O. australiensis wild rice JC 2304 and Pokkali
                                 had Na+/K+ ratios in their roots at 2.19 and 1.82, respectively. On the contrary, the salt‐
                                 sensitive cultivated rice Nipponbare plants had the highest accumulation of Na+ and less
                                 expulsion of K+ in their roots with a Na+/K+ ratio of 3.22 (Figure 7D). The results suggest
                                 that O. australiensis wild rice accession JC 2304 may employ a mechanism to exclude Na+
                                 from the roots, thereby maintaining a low Na+/K+ ratio in the shoots.

      Figure 7. Effects of 150 mM NaCl on sodium and potassium contents in wild and cultivated rice seedlings after 14 days of
      stress. (A) Sodium content in shoots (B) Sodium content in roots. (C) Potassium content in shoots (D) Potassium content
Plants 2021, 10, 2044 9 of 16
in roots. Data represent the means ± SE (n = 9). Asterisks indicate the significant difference of salt‐stressed plants with
respect to non‐stressed plants, based on the Student t‐test (ns‐not significant, * p ≤ 0.05). DW – dry weight.
3. Discussion
Salinity is a growing worldwide problem. It is one of the two most critical factors in
abiotic stresses affecting crop production [15]. Efforts are ongoing to identify high salt‐
tolerant genetic resources for the improvement of salt tolerance in rice [6,42]. Wild rice O.
australiensis is considered a potential candidate due to its ability to tolerate many abiotic
and biotic stresses [39,43–46]. However, tolerance to high concentrations of salt, a criterion
for being a salt‐tolerant trait donor, has not been studied in this wild rice species. Salinity
tolerance in rice is a quantitative trait that involves a complex of physiological responses,
metabolic processes, and gene expression networks [47,48]. A previous study reported
that salt tolerance in O. australiensis, exposure to 80 mM NaCl, resulted in a high response
of proteins that belong to the transport, metabolic process, and transmembrane trans‐
porter categories [49]. In this study, we found that O. australiensis wild rice accession JC
2304 exhibited tolerance to 150 mM NaCl by rapidly accumulating free proline, lowering
osmotic potential, maintaining high RWC, high membrane integrity, and low Na+ in the
shoots and roots.
Proline is one of the most common osmolytes that accumulate in many plants under
various environmental stresses, including salinity [26,50]. The results of our investigation
on proline accumulation in the leaves of wild and cultivated rice after being exposed to
150 mM NaCl treatment indicated that O. australiensis wild rice rapidly accumulated a
high amount of free proline during the first 48 h of salt stress treatment (Figure 1A). On
the other hand, the salt‐tolerant cultivated rice Pokkali accumulated less free proline in
the first 48 h of NaCl treatment compared to JC 2304; meanwhile, the salt‐sensitive cultivar
Nipponbare showed unchanged proline levels during this period of the salt treatment
(Figure 1B,C). Proline accumulation under salinity stress has been reported to confer sa‐
linity tolerance in many plants, such as green gram (Phaseolus aureus L.) [51], wheat (Trit‐
icum aestivum L.) [52], mulberry (Morus alba L.) [53], canola (Brassica napus L.) [54], and
Jerusalem artichoke (Helianthus tuberosus L.) [37]. In cultivated rice O. sativa, the accumu‐
lation of free proline under salt stress varies between different cultivars and growth
stages. Several studies indicated that salt‐tolerant rice cultivars accumulated higher pro‐
line than salt‐sensitive rice under salinity‐stressed conditions [55–58]. In this study, we
found that the accumulation of proline, especially during the early stage (48 h) of salinity
stress, positively correlated with the salt‐tolerant level of O. australiensis wild rice JC 2304
(Figures 1A and 3). We also noticed that the time of proline accumulation and the amount
of this osmolyte in plants influenced their ability to cope with salt stress in the accessions
tested. Both O. australiensis wild rice JC 2304 and Pokkali accumulated proline to a high
level (above 3.5 μmol g−1 FW) within 48 h of exposure to 150 mM NaCl, and they showed
a higher salt‐tolerant level compared to Nipponbare, which did not accumulate proline
during the first 48 h of salt treatment (Figures 1 and 3). The salt‐sensitive cultivar
Nipponbare started increasing the proline content in the leaves at three DAT, but to a
much lower concentration compared to that in O. australiensis wild rice JC 2304 and
Pokkali (Figure 1).
In higher plants, free proline accumulation results from the upregulation of proline
synthesis and downregulation of proline degradation [26,59]. The results of our study
agreed with these reports. Wild rice JC 2304 showed the upregulation of the genes in‐
volved in proline synthesis, including OsP5CS1, OsP5CS2, and OsP5CR, and downregu‐
lation of the gene for proline degradation, OsProDH, during the first 48 h exposure to salt
treatment, leading to proline accumulation in these plants. The salt‐tolerant cultivar Pok‐
kali showed high expression of the genes for proline synthesis but also up‐regulated the
OsProDH gene at 12 h after salt treatment; therefore, less proline was accumulated in these
plants compared to O. australiensis wild rice JC 2304 plants. Meanwhile, the salt‐sensitive
Nipponbare showed an opposite trend to the wild rice, i.e., the downregulated genes forPlants 2021, 10, 2044 10 of 16
proline synthesis and upregulated gene for proline degradation led to no proline accumu‐
lation in this cultivar in the first 48 h of salt treatment (Figures 1 and 2).
Rapid response to osmotic stress is critical for plants to maintain water uptake,
thereby maintaining cellular water status and growth rate [4]. Under salinity stress, the
presence of salt in the root zone triggers the osmotic stress that causes constraints on water
uptake by the root system. Thus, maintaining sufficient water uptake is critical for plants
to maintain cellular metabolic processes under salinity stress [60]. A positive correlation
between proline accumulation and a decrease in osmotic potential was reported previ‐
ously in salt‐tolerant plants [51]. In our study, the lower osmotic potential in O. aus‐
traliensis wild rice JC 2304 likely facilitated the water uptake that resulted in a higher RWC
in this wild rice compared to the salt‐sensitive cultivar Nipponbare (Figure 6A). These
results suggest that this wild rice rapidly altered its osmotic adjustment to adapt to os‐
motic stress and maintain sufficient cellular water content, while the salt‐sensitive culti‐
vated rice Nipponbare showed a much later response, leading to a greater reduction in
RWC and growth (Figure 4). A previous study reported that salt‐tolerant plants showed
less reduction in RWC than salt‐sensitive plants during salinity stress [61]. In this study,
the wild rice and Pokkali showed higher tolerance to salinity stress than Nipponbare (Fig‐
ure 3). They also had less reduction in RWC compared to that cultivar during exposure to
150 mM NaCl treatment (Figure 6A). Interestingly, the salt‐tolerant cultivar Pokkali did
not show a rapid increase in free proline content but gradual accumulation, and its os‐
motic potentials of the salt‐stressed plants were not significantly different from those of
their non‐stressed control counterparts (Figure 5). This observation, together with a pre‐
vious report [62], indicates that stressed Pokkali plants did not employ the osmotic ad‐
justment as a predominant mechanism to cope with salinity stress. These results led us to
hypothesize that the rapid and high accumulation of proline might be a key osmolyte
contributing to osmotic potential adjustment and high RWC in this wild rice accession.
Osmotic stress causes the overproduction of reactive oxygen species (ROS), which, in turn,
causes damage to the cell membrane [63]. The movement of salts into plant cells leads to
the alternation of plasma membrane permeability [64]. Our study presents the first obser‐
vation of electrolyte leakage changes in O. australiensis wild rice upon high salinity stress.
The results of electrolyte leakage were supported by a previous study indicating that salt‐
tolerant genotypes maintained lower electrolyte leakage during salinity stress compared
to salt‐sensitive genotypes [65]. The wild rice and the salt‐tolerant Pokkali maintained a
low electrolyte leakage during exposure to 150 mM NaCl, whereas the salt‐sensitive cul‐
tivar Nipponbare increased electrolyte leakage significantly at day seven post‐NaCl treat‐
ment (Figure 6B). The maintenance of low electrolyte leakage indicated that the wild rice
and Pokkali maintained plasma membrane integrity under salt stress. The ability of the
wild rice and Pokkali to retain plasma membrane integrity might relate to the beneficial
role of proline to either (i) mitigate the negative effects of ROS [66], (ii) sustain membrane
lipid and protein compositions [67], or (iii) reduce activities of lipid peroxidation and pro‐
tein oxidation [68].
Under optimal conditions, plants maintain a high concentration of K+ and a low con‐
centration of Na+ in the cytosol. Under salt stress, the movement of Na+ to the roots dis‐
rupts K+ uptake and K+, Na+ homeostasis [25]. To overcome these conditions, plants de‐
ploy an ion homeostasis mechanism, which relies on (i) ion exclusion from the leaf and
(ii) the accumulation and compartmentation of sufficient Na+ and Cl‐ ions in vacuoles to
balance with those in the soils [69]. While most of the halophytes employ ion compart‐
mentation as the majority adaptive trait to ionic stress, rice is tolerant to ionic stress
through ion exclusion and low Na+ concentrations maintenance in leaves [70]. Under salt
stress, the maintenance of K+ and Na+ homeostasis are key components of salt stress toler‐
ance in plants [71–73]. The results of Na+ and K+ contents and the ratio between these ions
in our study indicated that the Na+ content in the shoots and roots of the salt‐sensitive
cultivated rice Nipponbare were significantly higher than those in Pokkali and the wild
rice (Figure 7A,B). Interestingly, O. australiensis wild rice accession JC 2304 maintainedPlants 2021, 10, 2044 11 of 16
much lower Na+ in the roots than Pokkali, which is well‐known cultivated rice that em‐
ploys ion homeostasis to exclude Na+ from the roots (Figure 7B) [74]. The molecular mech‐
anism that helped this cultivar regulate the translocation and compartmentation of Na+ to
the leaf tissue and vacuoles was well‐documented [75–77]. Wild rice O. australiensis acces‐
sion JC 2304 also has the lowest Na+/K+ ratio in the shoots and the second‐lowest Na+/K+
ratio in the roots amongst the accessions tested (Figure 7C). These results suggest that,
besides osmotic adjustment, O. australiensis wild rice employs ion homeostasis to cope
with salinity stress. An investigation on the regulation of the genes involving Na+/K+ trans‐
porter and Na+/H+ exchanger in JC 2304 under salinity stress would provide details on the
ion homeostasis capacity of this wild rice. The ability of roots to retain K+ and maintain
low Na+/K+ has been reported to be critical regarding conferring salinity tolerance in cere‐
als [78]. Therefore, further investigation on the molecular responses under this mechanism
in the wild rice would provide more useful information for improving salt tolerance
through ion homeostasis in cultivated rice.
In summary, this paper details the investigation on proline accumulation and salt
tolerance in wild rice O. australiensis and two cultivated rice O. sativa cultivars. The rapid
accumulation of free proline in O. australiensis resulted in osmotic adjustment and salt
tolerance in this wild rice. In addition to osmotic adjustment, wild rice O. australiensis also
uses ion homeostasis as a mechanism to cope with salinity stress. Our study revealed a
new salinity tolerant wild germplasm O. australiensis and the knowledge of salt tolerance
mechanisms in this wild rice species would be useful for the future improvement of salt
tolerance in cultivated rice.
4. Materials and Methods
4.1. Plant Material
The wild rice seeds used in this study were obtained from the Australian Grains
Genebank (AGG) (Horsham, Victoria, Australia) (Supplemental Table S1).
4.2. Seedling Preparation and Salinity Stress Assay
Intact wild rice seeds were heat‐treated at 50 °C in an oven for three days before the
experiment. Approximately 30 heat‐treated seeds were then dehulled and washed 3–4
times with tap water to remove leftover hulls, followed by soaking in warm water in a 50
mL Falcon tube at 52 °C for 10 min. The Falcon tube containing seeds was then incubated
in the dark at 37 °C for 48 h and finally transferred to water‐soaked filter paper in a petri
dish for germination. The germinated seeds were transferred to pots (10 cm diameter)
containing potting mix (Searles, Australia). The seedling pots were placed inside a con‐
tainer and filled with tap water up to half the pot in height and kept under controlled
growth conditions at 27 °C/25 °C day/night, 16 h/8 h light/dark. Salinity stress assay was
conducted on three fully expanded leaves’ seedlings by adding 150 mM of saline water
into the seedling containers to one cm above the potting mix level. Experiments were con‐
ducted in a Randomized Complete Block design. Salinity tolerant level of each rice geno‐
type was evaluated based on the visual salt‐induced symptoms (VSI) recorded on the 3rd,
7th, and 10th day after treatment (DAT) and converted to the modified standard evaluat‐
ing score (SES) [38]. The scoring discriminates from highly susceptible (score 9) to highly
tolerant (score 1). Growth rates were evaluated based on the root lengths and fresh and
dry weights of roots measures at day 14 of the salinity treatment.
4.3. Determination of Proline Content
Proline accumulation in leaf tissue was determined via reaction with ninhydrin
(Sigma Aldrich), as described by Bates et al. [79]. Purified proline (Sigma Aldrich, Mel‐
bourne, VIC, AU) was used to build a standard curve for proline content quantification.
Approximately 0.5 fresh leaf samples were homogenized in 10 mL of 3% aqueous sulfosal‐
icylic acid and centrifuged at 3000 rpm for 1 min. Exactly 2 mL of supernatant was reactedPlants 2021, 10, 2044 12 of 16
with 2 mL of ninhydrin acid and 2 mL of glacial acetic acid for 1 h at 100 °C in a heater.
The chromophore was extracted using 2 mL of Toluene, and its absorbance at 520 nm was
determined by Genesys 10‐s UV/Vis Spectrophotometer (Thermo Spectronic, Waltham,
MA, USA) with toluene used as blank. Proline content was calculated using the following
formula.
((μg proline/mL × mL toluene)/115.5 μg/μmole) × (g sample/5) = μmoles proline gram FW−1
4.4. Gene Expression Analysis
Leaf tissues of control and salt‐stressed plants were frozen in liquid nitrogen and
ground to fine powder without thaw. Total RNA was extracted from 100 mg of leaf tissue
by using the GeneJet Plant RNA purification kit (Thermo Scientific, Waltham, MA, USA)
according to the manufacturer’s instructions. RNA was treated with RQ1 RNase‐Free
DNase (Promega, Alexandria, NSW, AU) to degrade any DNA contamination. The first
strand of cDNA was synthesized from DNase‐treated RNA using GoScriptTM IV first‐
Strand synthesis following the manufacturer’s protocols. Quantitative real‐time PCR
(qRT‐PCR) was performed on a CFX 384™ Real‐time PCR system (BioRad, Foster City,
CA, USA). A 10 μL reaction mixture contained 50 ng of cDNA and 8 μL Applied Bio‐
sytems™ PowerUp™ SYBR™ Green Master Mix (Applied Biosystems™, Carlsbad, CA,
USA), and 30 pmol of forward and reverse primers. Sequences of primers used in this
study were presented in Supplemental Table S2. Sequences of primers for amplifying
OsP5CS1 and OsActin genes were acquired from a previous study [80]. Cycling conditions
were as follows: 95 °C for 3 min, followed by 45 cycles at 95 °C for 10 s and 60 °C for 30 s.
A melting profile was set at 95 °C for 10 s, 65 °C for 5 s, and 95 °C for 5 s. The expression
levels of two internal reference genes, OsAct1 and OsEF1α, were used as calibrators to
calculate relative expression levels of target genes by ∆∆Ct method [81]. Three biological
replicates were collected for each assessed time point, and three technical replicates were
run for each biological replicate.
4.5. Determination of Relative Water Content
The relative water content of plant leaf was examined using the method described by
Hoang et al. [41]. Briefly, the relative water content of the leaf was measured on the second
youngest fully expanded leaf. A 10 cm piece in the middle part of the leaf blade was ex‐
cised, then weighed to record the fresh weight (FW). The leaf piece was then transferred
to a 15 mL Falcon tube filled with distilled water and kept in the dark at 4 °C overnight.
The following morning, the leaf was blotted dry with a tissue towel for 30 s and weighed
to record the turgid weight (TW). The dry weight (DW) of the sample was determined
after three days of drying in a vacuum oven at 70 °C. The relative water content was cal‐
culated as RWC = (FW − DW) × 100/(TW − DW).
4.6. Determination of Osmotic Potential
The osmotic potential was calculated based on the measurement of leaf sap osmolal‐
ity (mOsm kg−1). Briefly, the second youngest fully expanded leaves of non‐stressed and
salt‐stressed plants were excised and frozen at −80 °C for 12 h; cell sap was squeezed out
of frozen leaf samples using a 5 mL syringe. An aliquot of 20 μL of cell sap was used for
osmolarity measurement with a freezing point micro‐osmometer Fiske 210 (John Morris
Scientific, Chatswood, NSW, AU) at room temperature (298 °K). The osmotic potential
was calculated using the following van’t Hoff equation: Π = −(M × R × T)/1000. M: molar
concentration of solute in dilute solution; R: ideal gas constant (0.082); T: the room tem‐
perature on the Kelvin scale (298 °K).Plants 2021, 10, 2044 13 of 16
4.7. Determination of Sodium and Potassium Content
The preparation of sample material for subsequent micronutrient analysis followed
the protocols described by the Centre for Agriculture and the Bioeconomy (QUT). The
shoot and root rice samples were dried in a hot air oven at 70 °C for three days and freeze‐
dried at −80 °C for 24 h using Virtis Benchtop Pro freeze dryers. The freeze‐dried sample
was then ground to fine powder using Tissue Lyser II. Approximately 0.2–0.3 g of freeze‐
dried sample was weighed using an analytical balance and transferred to a 50 mL Falcon
tube. Samples were pre‐digested with acid mixtures (3 mL HNO3 70% and 1 mL HCl 40%)
and mixed well by vortexing and left overnight in a fume hood at room temperature. On
the following morning, the sample was digested at 80 °C for 30 min followed by 2 h at 125
°C in a dry heat block. After the digestion, the sample was cooled to room temperature
before diluting with 22 mL of distilled water to make a final volume of 25 mL. The tube
containing samples was centrifuged at 4500 rpm for 10 min, and 10 mL of supernatant
was transferred to a polypropylene tube. Element content analyses were carried out using
Perkin Elmer Optima 8300 DV Inductively Coupled Plasma Optical Emission Spectrome‐
ter (ICP‐OES) following the manufacturer’s instructions. Data were analyzed using
Syngistix software V2.0.
4.8. Measurement of Electrolyte Leakage
Electrolyte leakage, during salinity stress assay, was measured using a CM 100‐2 con‐
ductivity meter (Reid & Associates CC, DU, South Africa) following the manufacturer’s
instructions. A 0.5 cm piece of the second youngest fully expanded leaf was briefly excised
and placed inside a zip‐lock plastic bag and immediately put on ice. Then, the leaf piece
was rinsed with deionized water and loaded into wells of the CM 100‐2 conductivity me‐
ter containing 1.25 mL of deionized water. Measurement was carried out every two min
over 60 min periods. Following the measurement, samples were dried in an oven at 70 °C
overnight, then weighed (dry weight). Electrolyte leakage was calculated as the slope of
electrolyte leakage over time and normalized by dry weight.
4.9. Statistical Analysis
The salinity screening experiments were designed in a completely randomized block
design with three replications. One‐way Analysis of Variance (ANOVA) analyzed the sta‐
tistical significance of mean values with Turkey HSD multiple comparisons with three
replicates (MiniTab version 17, NSW, Australia).
Supplementary Materials: The following are available online at www.mdpi.com/arti‐
cle/10.3390/plants10102044/s1, Table S1: Plant materials, Table S2: Primers used in this study.
Author Contributions: Conceptualization, H.T.T.N., L.T.M.H., S.D.B. and S.M.; methodology
H.T.T.N., H.L., Y.C. and L.T.M.H.; formal analysis, H.L. and H.T.T.N.; investigation, S.M., H.T.T.N.
and L.T.M.H.; writing—original draft preparation H.T.T.N. writing—review and editing, S.D.B.,
H.L., Y.C., S.M., H.T.T.N. and L.T.M.H.; supervision, S.M., S.D.B. and L.T.M.H.; funding acquisition,
S.M. All authors have read and agreed to the published version of the manuscript.
Funding: The research was funded by the QUT‐VIED JOINT Scholarship, Queensland University
of Technology, Australia.
Institutional Review Board Statement: Not applicable.
Informed Consent Statement: Not applicable.
Data Availability Statement: The authors confirm that the data supporting the findings of this
study are available within the article.
Acknowledgments: The authors acknowledge Australian Grain GenBank (AGG) for providing
plant materials. We thank Sunny Hu and Tal Cooper, Central of Analytical Research Facility ‐QUT,
for assistance in sodium and potassium analysis.
Conflicts of Interest: The authors declare no conflict of interest.Plants 2021, 10, 2044 14 of 16
References
1. Al Otayk, S.M. Response of some wheat genotypes to different salinity levels of Irrigated water. South. Cross J. 2020, 13, 37–45,
doi:10.21475/poj.13.01.20.p2268.
2. Qadir, M.; Quillérou, E.; Nangia, V.; Murtaza, G.; Singh, M.; Thomas, R.J.; Drechsel, P.; Noble, A.D. Economics of salt‐induced
land degradation and restoration. Nat. Resour. Forum 2014, 38, 282–295, doi:10.1111/1477‐8947.12054.
3. Nguyen, N. Global Climate Changes and Rice Food Security; International Rice Commission, FAO: Rome, Italy, 2002.
4. Munns, R.; Tester, M. Mechanisms of salinity tolerance. Annu. Rev. Plant Biol. 2008, 59, 651–681, doi:10.1146/annurev.ar‐
plant.59.032607.092911.
5. Zhou, Y.; Yang, P.; Cui, F.; Zhang, F.; Luo, X.; Xie, J. Transcriptome analysis of salt stress responsiveness in the seedlings of
dongxiang wild rice (Oryza rufipogon Griff.). PLoS ONE 2016, 11, e0146242, doi:10.1371/journal.pone.0146242.
6. Hoang, T.M.L.; Tran, T.N.; Nguyen, T.K.T.; Williams, B.; Wurm, P.; Bellairs, S.; Mundree, S. Improvement of salinity stress
tolerance in rice: Challenges and opportunities. Agronomy 2016, 6, 54, doi:10.3390/agronomy6040054.
7. Zhang, A.; Liu, Y.; Wang, F.; Li, T.; Chen, Z.; Kong, D.; Bi, J.; Zhang, F.; Luo, X.; Wang, J.; et al. Enhanced rice salinity tolerance
via CRISPR/Cas9‐targeted mutagenesis of the OsRR22 gene. Mol. Breed. 2019, 39, 47, doi:10.1007/s11032‐019‐0954‐y.
8. Ganeshan, P.; Jain, A.; Parmar, B.; Rao, A.; Sreenu, K.; Mishra, P.; Mesapogu, S.; Subrahmanyam, D.; Ram, T.; Sarla, N.; et al.
Identification of salt tolerant rice lines among interspecific BILs developed by crossing “Oryza sativa O. rufipogon and O. sativa
O. nivara”; S. Cross J. 2016, 10, 220–228.
9. Solis, C.A.; Yong, M.T.; Vinarao, R.; Jena, K.; Holford, P.; Shabala, L.; Zhou, M.; Shabala, S.; Chen, Z.‐H. Back to the wild: On a
quest for donors toward salinity tolerant rice. Front. Plant Sci. 2020, 11, 323–337, doi:10.3389/fpls.2020.00323.
10. Henry, R.J.; Rice, N.F.; Waters, D.; Kasem, S.; Ishikawa, R.; Hao, Y.; Dillon, S.L.; Crayn, D.; Wing, R.; Vaughan, D. Australian
oryza: Utility and conservation. Rice 2009, 3, 235–241, doi:10.1007/s12284‐009‐9034‐y.
11. Scafaro, A.; Gallé, A.; Van Rie, J.; Carmo‐Silva, E.; Salvucci, M.E.; Atwell, B.J. Heat tolerance in a wild Oryza species is attributed
to maintenance of Rubisco activation by a thermally stable Rubisco activase ortholog. New Phytol. 2016, 211, 899–911,
doi:10.1111/nph.13963.
12. Hu, J.; Xiao, C.; Cheng, M.‐X.; Gao, G.‐J.; Zhang, Q.‐L.; He, Y.‐Q. A new finely mapped Oryza australiensis‐derived QTL in rice
confers resistance to brown planthopper. Gene 2015, 561, 132–137, doi:10.1016/j.gene.2015.02.026.
13. Yichie, Y.; Brien, C.; Berger, B.; Roberts, T.H.; Atwell, B.J. Salinity tolerance in Australian wild Oryza species varies widely and
matches that observed in O. sativa. Rice 2018, 11, 66, doi:10.1186/s12284‐018‐0257‐7.
14. Bose, J.; Rodrigo‐Moreno, A.; Shabala, S. ROS homeostasis in halophytes in the context of salinity stress tolerance. J. Exp. Bot.
2014, 65, 1241–1257, doi:10.1093/jxb/ert430.
15. Munns, R.; Gilliham, M. Salinity tolerance of crops—what is the cost? New Phytol. 2015, 208, 668–673, doi:10.1111/nph.13519.
16. McCue, K.F.; Hanson, A.D. Drought and salt tolerance: Towards understanding and application. Trends Biotechnol. 1990, 8, 358–
362, doi:10.1016/0167‐7799(90)90225‐m.
17. Delauney, A.J.; Verma, D.P.S. Proline biosynthesis and osmoregulation in plants. Plant J. 1993, 4, 215–223, doi:10.1046/j.1365‐
313x.1993.04020215.x.
18. Zulfiqar, F.; Akram, N.A.; Ashraf, M. Osmoprotection in plants under abiotic stresses: New insights into a classical phenome‐
non. Planta 2019, 251, 3, doi:10.1007/s00425‐019‐03293‐1.
19. Kishor, P.B.K.; Kumari, P.H.; Sunita, M.S.L.; Sreenivasulu, N. Role of proline in cell wall synthesis and plant development and
its implications in plant ontogeny. Front. Plant Sci. 2015, 6, 544, doi:10.3389/fpls.2015.00544.
20. Kemble, A.R.; MacPherson, H.T. Liberation of amino acids in perennial rye grass during wilting. Biochem. J. 1954, 58, 46–49,
doi:10.1042/bj0580046.
21. Stewart, G.R.; Lee, J.A. The role of proline accumulation in halophytes. Planta 1974, 120, 279–289, doi:10.1007/bf00390296.
22. Hare, P.; Cress, W. Metabolic implications of stress‐induced proline accumulation in plants. Plant Growth Regul. 1997, 21, 79–
102, doi:10.1023/A:1005703923347.
23. Kaur, G.; Asthir, B. Proline: A key player in plant abiotic stress tolerance. Biol. Plant. 2015, 59, 609–619, doi:10.1007/s10535‐015‐
0549‐3.
24. Meena, M.; Divyanshu, K.; Kumar, S.; Swapnil, P.; Zehra, A.; Shukla, V.; Yadav, M.; Upadhyay, R.S. Regulation of L‐proline
biosynthesis, signal transduction, transport, accumulation and its vital role in plants during variable environmental conditions.
Heliyon 2019, 5, e02952, doi:10.1016/j.heliyon.2019.e02952.
25. Hasegawa, P.M.; Bressan, R.A.; Zhu, J.K.; Bohnert, H.J. Plant cellular and molecular responses to high salinity. Annu. Rev. Plant.
Physiol. Plant. Mol. Biol. 2000, 51, 463–499, doi:10.1146/annurev.arplant.51.1.463.
26. Szabados, L.; Savouré, A. Proline: A multifunctional amino acid. Trends Plant Sci. 2010, 15, 89–97,
doi:10.1016/j.tplants.2009.11.009.
27. Miller, G.; Honig, A.; Stein, H.; Suzuki, N.; Mittler, R.; Zilberstein, A. Unraveling Δ1‐pyrroline‐5‐carboxylate‐proline cycle in
plants by uncoupled expression of proline oxidation enzymes. J. Biol. Chem. 2009, 284, 26482–26492,
doi:10.1074/jbc.m109.009340.
28. Servet, C.; Ghelis, T.; Richard, L.; Zilberstein, A.; Savoure, A. Proline dehydrogenase: A key enzyme in controlling cellular
homeostasis. Front. Biosci. 2012, 17, 607–620, doi:10.2741/3947.Plants 2021, 10, 2044 15 of 16
29. Hong, Z.; Lakkineni, K.; Zhang, Z.; Verma, D.P.S. Removal of feedback inhibition of Δ1‐pyrroline‐5‐carboxylate synthetase re‐
sults in increased proline accumulation and protection of plants from osmotic stress. Plant Physiol. 2000, 122, 1129–1136,
doi:10.1104/pp.122.4.1129.
30. Ashraf, M.; Foolad, M. Roles of glycine betaine and proline in improving plant abiotic stress resistance. Environ. Exp. Bot. 2007,
59, 206–216, doi:10.1016/j.envexpbot.2005.12.006.
31. Carillo, P.; Mastrolonardo, G.; Nacca, F.; Parisi, D.; Verlotta, A.; Fuggi, A. Nitrogen metabolism in durum wheat under salinity:
Accumulation of proline and glycine betaine. Funct. Plant Biol. 2008, 35, 412–426, doi:10.1071/fp08108.
32. Fichman, Y.; Gerdes, S.Y.; Kovács, H.; Szabados, L.; Zilberstein, A.; Csonka, L.N. Evolution of proline biosynthesis: Enzymology,
bioinformatics, genetics, and transcriptional regulation. Biol. Rev. 2014, 90, 1065–1099, doi:10.1111/brv.12146.
33. Hu, C.A.; Delauney, A.J.; Verma, D.P. A bifunctional enzyme (delta 1‐pyrroline‐5‐carboxylate synthetase) catalyzes the first two
steps in proline biosynthesis in plants. Proc. Natl. Acad. Sci. USA 1992, 89, 9354–9358, doi:10.1073/pnas.89.19.9354.
34. Fougère, F.; Le Rudulier, D.; Streeter, J.G. Effects of salt stress on amino acid, organic acid, and carbohydrate composition of
roots, bacteroids, and cytosol of alfalfa (Medicago sativa L.). Plant Physiol. 1991, 96, 1228–1236, doi:10.1104/pp.96.4.1228.
35. Khanna‐Chopra, R.; Semwal, V.; Lakra, N.; Pareek, A. Proline—a key regulator conferring plant tolerance to salinity and
drought. In Plant Tolerance to Environmental Stress; CRC Press: Boca Raton, FL, USA, 2019; pp. 59–80.
36. Hayat, S.; Hayat, Q.; Alyemeni, M.; Wani, D.A.; Pichtel, J.; Ahmad, A. Role of proline under changing environment: A review.
Plant Signal. Behav. 2012, 7, 1456–1466, doi:10.4161/psb.21949.
37. Huang, Z.; Zhao, L.; Chen, D.; Liang, M.; Liu, Z.; Shao, H.; Long, X. Salt stress encourages proline accumulation by regulating
proline biosynthesis and degradation in Jerusalem artichoke plantlets. PLoS ONE 2013, 8, e62085, doi:10.1371/jour‐
nal.pone.0062085.
38. Gregorio, G.; Senadhira, D.; Mendoza, R. Screening rice for salinity tolerance. In IRRI Discussion Paper Series; International Rice
Research Institute: Los Baños, Philippines, 1997; Volume 22.
39. Dionisio‐Sese, M.L.; Tobita, S. Antioxidant responses of rice seedlings to salinity stress. Plant Sci. 1998, 135, 1–9,
doi:10.1016/S0168‐9452(98)00025‐9].
40. Cha‐um, S.; Trakulyingcharoen, T.; Smitamana, P.; Kirdmanee, C. Salt Tolerance in two rice cultivars differing salt tolerant
abilities in responses to iso‐osmotic stress. Aust. J. Crop Sci. 2009, 3, 221–230.
41. Hoang, T.M.L.; Williams, B.; Khanna, H.; Dale, J.; Mundree, S.G. Physiological basis of salt stress tolerance in rice expressing
the antiapoptotic gene SfIAP. Funct. Plant Biol. 2014, 41, 1168–1177, doi:10.1071/fp13308.
42. Qin, H.; Li, Y.; Huang, R. Advances and Challenges in the Breeding of Salt‐Tolerant Rice. Int J Mol Sci 2020, 21, 8385,
[10.3390/ijms21218385].
43. Brar, D.S.; Khush, G.S. Transferring Genes from Wild Species into Rice; International Rice Research Institute: Metro Manila, Philip‐
pines, 2002; Volume 14, pp. 197–217.
44. Menguer, P.K.; Sperotto, R.A.; Ricachenevsky, F.K. A walk on the wild side: Oryza species as source for rice abiotic stress tol‐
erance. Genet Mol Biol 2017, 40, 238‐252, doi:10.1590/1678‐4685‐GMB‐2016‐0093.
45. Henry, R.J. Australian wild rice populations: A key resource for global food security. Front. Plant Sci. 2019, 10, 1354,
doi:10.3389/fpls.2019.01354.
46. Khush, G.S.; Brar, D.S. Alien introgression in rice. Nucleus 2017, 60, 251–261, doi:10.1007/s13237‐017‐0222‐7.
47. Gupta, B.; Huang, B. Mechanism of salinity tolerance in plants: Physiological, biochemical, and molecular characterization. Int.
J. Genom. 2014, 2014, 701596, doi:10.1155/2014/701596.
48. Reddy, I.N.B.L.; Kim, B.‐K.; Yoon, I.‐S.; Kim, K.‐H.; Kwon, T.‐R. Salt tolerance in rice: Focus on mechanisms and approaches.
Rice Sci. 2017, 24, 123–144, doi:10.1016/j.rsci.2016.09.004.
49. Yichie, Y.; Hasan, M.T.; Tobias, P.A.; Pascovici, D.; Goold, H.; Van Sluyter, S.C.; Roberts, T.H.; Atwell, B. Salt‐treated roots of
Oryza australiensis seedlings are enriched with proteins involved in energetics and transport. Proteomics 2019, 19, e1900175,
doi:10.1002/pmic.201900175.
50. Kavi Kishor, P.B.; Sreenivasulu, N. Is proline accumulation per se correlated with stress tolerance or is proline homeostasis a
more critical issue? Plant Cell Environ. 2014, 37, 300–311, doi:10.1111/pce.12157.
51. Misra, N.; Gupta, A.K. Effect of salt stress on proline metabolism in two high yielding genotypes of green gram. Plant Sci. 2005,
169, 331–339, doi:10.1016/j.plantsci.2005.02.013.
52. Poustini, K.; Siosemardeh, A.; Ranjbar, M. Proline accumulation as a response to salt stress in 30 wheat (Triticum aestivum L.)
cultivars differing in salt tolerance. Genet. Resour. Crop. Evol. 2006, 54, 925–934, doi:10.1007/s10722‐006‐9165‐6.
53. Surabhi, G.‐K.; Reddy, A.M.; Kumari, G.J.; Sudhakar, C. Modulations in key enzymes of nitrogen metabolism in two high yield‐
ing genotypes of mulberry (Morus alba L.) with differential sensitivity to salt stress. Environ. Exp. Bot. 2008, 64, 171–179,
doi:10.1016/j.envexpbot.2008.04.006.
54. Xue, X.; Liu, A.; Hua, X. Proline accumulation and transcriptional regulation of proline biosynthesis and degradation in Brassica
napus. BMB Rep. 2009, 42, 28–34, doi:10.5483/bmbrep.2009.42.1.028.
55. Roy, D.; Bhunia, A.; Basu, N.; Banerjee, S.K. Effect of nacl‐ salinity on metabolism of proline in salt‐ sensitive and salt‐ resistant
cultivars of rice. Biol. Plant. 1992, 34, 159–162, doi:10.1007/bf02925814.
56. Roychoudhury, A.; Basu, S.; Sarkar, S.N.; Sengupta, D.N. Comparative physiological and molecular responses of a common
aromatic indica rice cultivar to high salinity with non‐aromatic indica rice cultivars. Plant Cell Rep. 2008, 27, 1395–1410,
doi:10.1007/s00299‐008‐0556‐3.You can also read


