Vegetative phase change in Populus tremula 9 alba - people ...
←
→
Page content transcription
If your browser does not render page correctly, please read the page content below
Research

Vegetative phase change in Populus tremula 9 alba
Erica H. Lawrence1                 , Aaron R. Leichty1,2                , Erin E. Doody1               , Cathleen Ma3, Steven H. Strauss3                          and
R. Scott Poethig1
1
Department of Biology, University of Pennsylvania, Philadelphia, PA 19104, USA; 2Department of Plant Biology, University of California, Davis, CA 95616, USA; 3Department of Forest
Ecosystems and Society, Oregon State University, Corvallis, OR 97331, USA

                                                         Summary
Author for correspondence:                                Plants transition through juvenile and adult phases of vegetative development in a process
Erica H. Lawrence                                        known as vegetative phase change (VPC). In poplars (genus Populus) the differences
Email: lawrence.erica.h@gmail.com
                                                         between these stages are subtle, making it difficult to determine when this transition occurs.
                                                         Previous studies of VPC in poplars have relied on plants propagated in vitro, leaving the natu-
Received: 13 January 2021                                ral progression of this process unknown.
Accepted: 17 February 2021
                                                          We examined developmental morphology of seed-grown and in vitro derived Populus
                                                         tremula 9 alba (clone 717-1B4), and compared the phenotype of these to transgenics with
New Phytologist (2021)                                   manipulated miR156 expression, the master regulator of VPC.
doi: 10.1111/nph.17316                                    In seed-grown plants, most traits changed from node-to-node during the first 3 months of
                                                         development but remained constant after node 25. Many traits remained unchanged in
Key words: development, juvenile-to-adult                clones over-expressing miR156, or were enhanced when miR156 was lowered, demonstrat-
transition, miR156, Populus (poplar), vegeta-            ing their natural progression is regulated by the miR156/SPL pathway. The characteristic leaf
tive phase change.                                       fluttering of Populus is one of these miR156-regulated traits.
                                                          Vegetative development in plants grown from culture mirrored that of seed-grown plants,
                                                         allowing direct comparison between plants often used in research and those found in nature.
                                                         These results provide a foundation for further research on the role of VPC in the ecology and
                                                         evolution of this economically important genus.

                                                                                              However, even in these so-called homoblastic species (Goebel,
Introduction
                                                                                              1900), organs produced early in shoot development differ from
During ontogeny, plants transition through distinct phases,                                   those produced later in development in a variety of morphologi-
which is reflected in morphological variation in the organs pro-                              cal, anatomical and physiological traits (Feng et al., 2016). Iden-
duced across development. These developmental transitions                                     tifying these traits and determining which are components of
include the visually obvious transition between vegetative and                                vegetative phase change as opposed to those regulated by other
reproductive growth as well as the often more subtle change                                   factors, such as plant size or chronological age, is an important
between juvenile and adult vegetative stages, known as vegetative                             problem in plant development.
phase change (Ashby, 1948; Brink, 1962; Doorenbos, 1965;                                         In Arabidopsis and most other plants, the transition from the
Poethig, 2013). In species with abrupt changes in vegetative mor-                             juvenile to the adult phase of vegetative development is regulated
phology – termed heteroblastic – the distinction between the juve-                            by two closely related microRNAs, miR156 and miR157
nile and adult phases is unambiguous (Zotz et al., 2011). For                                 (Poethig, 2013; He et al., 2018). These miRNAs directly repress
example, many species of Acacia transition from producing bip-                                members of the Squamosa Promoter Binding Protein-Like (SPL)
innate compound leaves to producing a simple undivided leaf ter-                              family of transcription factors (Rhoades et al., 2002; Schwab
med a phyllode (Walters & Bartholomew, 1984). Other                                           et al., 2005) which promote adult traits (Xu et al., 2016). During
examples include Eucalyptus globulus, which transitions from pro-                             the juvenile phase, miR156/157 levels are high, but as plants age
ducing ovate, wax-covered leaves to producing lanceolate glau-                                their expression declines, allowing for the increased expression of
cous leaves (James & Bell, 2001) and Ipomoea caerulea, which                                  their SPL targets. This coordinated change in miR156 and SPL
transitions from producing monolobed to trilobed leaves (Ashby,                               gene expression leads to the onset of adult traits, with different
1948). Vegetative phase change is more difficult to identify in                               traits typically appearing at slightly different times in shoot devel-
species that experience less drastic changes in leaf and shoot mor-                           opment, depending on their sensitivity to the level of SPL pro-
phology. As a result, we know little about the duration of juvenile                           teins (He et al., 2018).
and adult phases in different taxa, or the relationship between this                             Vegetative phase change is likely to be of particular importance
developmental transition and other aspects of plant life history,                             in long-lived perennial species such as trees, because the ability of
such as plant responses to biotic and abiotic conditions.                                     these species to survive to reproductive competence requires that

Ó 2021 The Authors                                                                                                                                    New Phytologist (2021) 1
New Phytologist Ó 2021 New Phytologist Foundation                                                                                                  www.newphytologist.com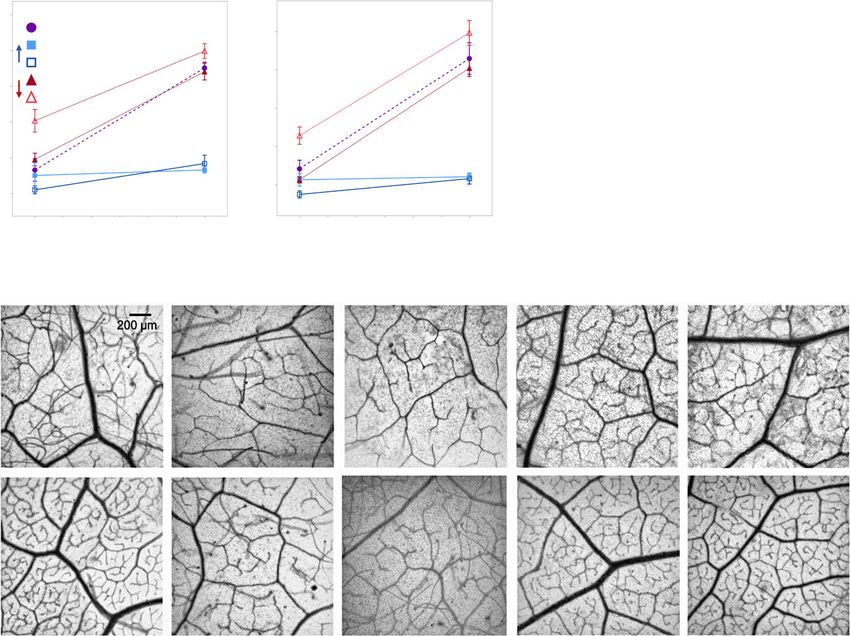
New
2 Research                                                                                                                       Phytologist

  they cope with changing conditions over a long period of time.        producing transgenic shoots (proportion of explants forming
  Poplars are of considerable economic and ecological importance        shoots was 52% vs 33.9%). We did not track efficiency for the
  and have become popular model systems for tree biology due to         other MIM156 construct.
  their ability to be propagated in culture and susceptibility to
  Agrobacterium-mediated transformation (Taylor, 2002). Leaf and
                                                                        Plant material and growth conditions
  shoot phenotypes of plants derived from culture and over-ex-
  pressing miR156 have been described in clones of                      Populus tremula 9 alba line 717-1B4, two independent miR156
  Populus 9 canendensis (Wang et al., 2011) and P. tremula 9 alba       over-expressing (miR156OX) lines, 40 and 78, and two indepen-
  (Rubinelli et al., 2013). However, the significance of this infor-    dent MIM156 lines, 22 and 84, were obtained by in vitro propa-
  mation for vegetative phase change in Populus is still unknown        gation and hardening on propagation media as described by
  because these studies lacked the earliest developmental stages and    Meilan & Ma (2006). Plants were then transplanted to Fafard-2
  fine-scale timeline needed to capture vegetative phase change,        growing mix (Sungro Horticulture, Agawam, MA, USA) in 0.3-l
  and relied on gain-of-function transgenics. Here, we compare the      pots in the glasshouse at the University of Pennsylvania
  vegetative phenotype of seed-grown P. tremula 9 alba with plants      (39.9493°N, 75.1995°W, 22.38 m above sea level) and kept in
  originating from explants in tissue culture across multiple time      plastic bags for increased humidity for 2 wk. Plants were trans-
  points during vegetative development, and identify phase-specific     ferred to 4.2-litre pots with Fafard-52 growing mix 3 wk later
  traits using both gain- and loss-of-function miR156 transgenics.      and fertilized with Osmocote 14-14-14 (The Scotts Co.,
  We found that shoot development in plants propagated in vitro         Marysville, OH, USA), supplemented by weekly applications of
  closely resembles the development of seed-grown plants, and that      Peters 20-10-20 (ICL Fertilizers, Dublin, OH, USA). Plants were
  vegetative phase change occurs very early in both types of shoots.    grown at 22–27°C on a 16 h photoperiod, with illumination pro-
  Most of the traits we examined changed significantly across shoot     vided by a combination of natural light and 400 W metal halide
  development and were sensitive to the level of miR156. One of         lamps (P.L. Light Systems, Ontario, Canada) with daily irradi-
  these was leaf fluttering, a trait that has a significant effect on   ances of 300–1500 lmol m 2 s 1 measured at the top of the
  photosynthetic efficiency (Roden & Pearcy, 1993b). Our results        canopy across the day. Planting of individuals was staggered
  provide basic information about the nature of vegetative phase        across three months with the position of plants in the glasshouse
  change in P. tremula 9 alba and demonstrate that shoots regener-      randomized and individuals rotated frequently.
  ated in vitro can be used as models of primary shoot development         Populus tremula 9 alba seeds were purchased from Sheffield’s
  in this species.                                                      Seed Co. (Locke, NY, USA), and were germinated on a layer of
                                                                        vermiculite on top of Fafard-2 growing mix in 0.64-l pots in the
                                                                        glasshouse under conditions described above. Seedlings were
  Materials and Methods
                                                                        transplanted 1 month after germination into Fafard-52 growing
                                                                        mix in 1.76-l pots, fertilized with Osmocote 14-14-14. They
  Plant transformation
                                                                        were transplanted to 4.2-l pots 3 months later. Planting of indi-
  Assembly of Ubi10:AthMIR156a and Ubi10:MIM156 con-                    viduals was staggered across 5 months and individuals were
  structs have been described previously (Feng et al., 2016). Addi-     rotated within the glasshouse frequently.
  tionally, a second MIM156 construct was designed with Golden
  Gate Cloning (Engler et al., 2014) and used for a later transfor-
                                                                        mRNA and smRNA abundance
  mation after losing many of the original lines to a chamber mal-
  function. Further details of construct assembly can be found in       For initial screening of miR156 and miR157 abundance, and fol-
  Supporting Information Table S1.                                      low-up validation of selected lines, shoot apices with leaf primor-
     Poplar line 717-1B4 was transformed using Agrobacterium            dia less than 3 cm were used. For characterization of temporal
  tumefaciens (strain AGL1) following the protocol described by         patterns of miR156/157 and SPL abundance in seed-grown and
  Filichkin et al. (2006). Briefly, leaf and stem explants were         culture derived plants, leaf primordia smaller than 1 cm were
  selected on callus induction, shoot induction, shoot elongation       sampled and pooled with at least three leaves per replicate. For all
  and rooting media using BASTA. A total of 30 Ubi10:                   plants, node or leaf positions are counted from the base of the
  AthMIR156a events and 25 Ubi10:MIM156 events were iso-                plant where the first leaf produced is number 1. Primordia were
  lated. PCR was used to first screen for transgene insertion using     collected across the plant’s lifespan to obtain samples for each of
  two primer sets, each utilizing a primer to the Arabidopsis           the measured leaf positions when they were at the same stage of
  UBIQUITIN 10 promoter and either the MIR156a or MIM156                development, frozen with liquid N2 and stored at 70°C until
  sequence (Table S2). Of these, we screened 28 Ubi:AthMIR156a          all samples were ready for RNA extraction. Total RNA was iso-
  lines and 19 Ubi10:MIM156 lines for levels of miR156 and              lated using the SpectrumTM Plant Total RNA Kit (Sigma-
  miR157 (Fig. S1A,B). Based on levels of miR156, two lines for         Aldrich, St Louis, MO, USA), according to the manufacturer’s
  each construct type were selected (or based on availability in the    instructions. Small noncoding RNA (smRNA) levels were mea-
  case of event GG.MIM156-22). For the Ubi10:AthMIR156a                 sured by real-time quantitative PCR (RT-qPCR), using primers
  and Ubi10:MIM156 constructs made with the pCambia 3300                specific for mature sequences of miR156, miR157 and miR159
  backbone, the Ubi10:AthMIR156a construct had a higher rate of         in combination with the stem-loop RT primers described by

  New Phytologist (2021)                                                                                                    © 2021 The Authors
  www.newphytologist.com                                                                       New Phytologist © 2021 New Phytologist Foundation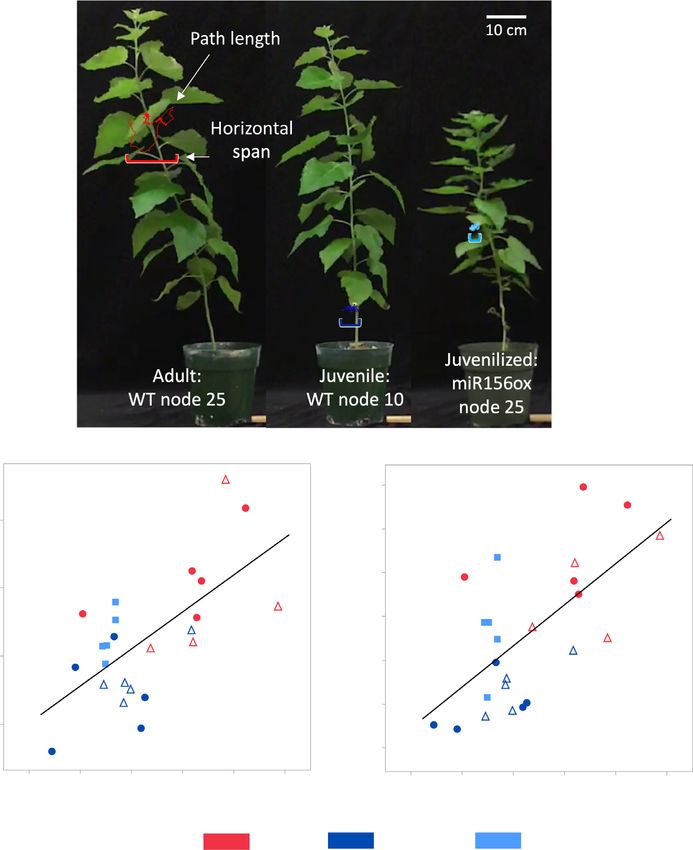
New
Phytologist                                                                                                                       Research 3

Varkonyi-Gasic et al., (2007) (Table S2). miR159 was used as an        indentations. Serrations were analyzed relative to the leaf perime-
endogenous control (Leichty & Poethig, 2019) and validated             ter so that the data were not influenced by differences in overall
across time points in seed-grown and culture derived plants            leaf size.
(Fig. S2). cDNA was synthesized using Invitrogen SuperScript III
following the methods of Varkonyi-Gasic et al. (2007). Platinum
                                                                       Leaf initiation rate, internode distance and branching
Taq (Invitrogen, Waltham, MA, USA) was used with the Roche
universal hydrolysis probe #21, and a three-step amplification         The leaf initiation rate was determined by counting the node of
protocol. For measuring mRNA abundance, total RNA was                  the uppermost visible leaf at least twice a week between 10 and
DNase-digested (Qiagen, Germantown, MD, USA) followed by               160 d of growth in seed-grown plants and between 32 and 55 d
cDNA synthesis using Invitrogen SuperScript III using each             after transplant to soil in 717-1B4 lines. The number of branches
manufacturer’s protocol and a polyT primer. PtaACT2 or                 at least 1 cm in length between nodes 1 and 25 was determined
PtaCDC2 was used as the endogenous control (Pettengill et al.,         after 4 months of growth in soil.
2012). Resulting cDNA was quantified by qPCR using SYBR-
Green Master Mix (Bimake, Houston, TX, USA) and primers
                                                                       Fluttering
specific to the endogenous control and SPL genes (PtSPL24 and
PtSPL23 which each contain an miR156 target site and PtSPL4            To measure leaf fluttering, plants were placed 100 cm away from
and PtSPL7 which do not) (Table S2) with a three-step amplifica-       a fan, with the leaf to be measured facing perpendicular to the
tion protocol. Relative measures of abundance were calculated          wind. Wind speeds at the sample leaf position were 1.5 m s 1 as
using the 2-DDCt method (Livak & Schmittgen, 2001).                    measured with an anemometer. Leaf movement was filmed at
                                                                       240 fps for 30 s (representative example in Video S1). Leaf move-
                                                                       ment was analyzed by following the movement of a mark placed
Stomatal impressions, epidermal traits, petiole morphology
                                                                       at the tip of the leaf using the TRACKER video analysis and model-
and abaxial trichome density
                                                                       ing tool v.5.0.7. The height and width of the petiole were mea-
Stomatal density and epidermal cell size were measured using           sured using a digital caliper.
clear nail polish impressions of adaxial and abaxial surfaces of
fully expanded leaves. Trichomes were removed from the abaxial
                                                                       Statistical analysis
side of leaves with tape when necessary, and three sections per leaf
were imaged and photographed using an Olympus BX51 light               All statistical analyses were performed in JMP® PRO v.14.0.0
microscope. Hand sections of leaf petioles within 1 cm of the leaf     (SAS Institute Inc., Cary, NC, USA). Traits in seed-grown
attachment site were imaged as described above. Trichome den-          poplar across leaf positions were measured from a minimum of
sity on the abaxial side of the leaf was measured using an Olym-       42 individuals and fit with a linear or second-degree polynomial
pus MVX10 dissecting scope. Measurements were made along               as appropriate with P-values and R2 values reported. Traits that
the midvein, where the density was low enough to permit accu-          were examined at multiple leaf positions in 717 wild-type,
rate counts. All measurements and counts were made using FIJI          MIM156 lines 84 and 22, and miR156OX lines 40 and 78 were
software (Schindelin et al., 2012).                                    measured from a minimum of six individuals and compared by
                                                                       analysis of covariance (ANCOVA) and a Student’s t-test
                                                                       (a = 0.05) where leaf position and genotype were the main
Leaf vein densities
                                                                       effects. Whole-plant measures of branching and internode length
Sections from new fully expanded leaves were cleared using             in these plants was compared by one-way ANOVA where geno-
NaOH and bleach, and then stained with Safranin following the          type was the main effect and a Student’s t-test (a = 0.05), and leaf
protocol described by Scoffoni & Sack (2013). Vein lengths of          emergence was compared by ANCOVA with days after trans-
all visible vein orders were measured from microscope images           plant and genotype as the main effects.
using FIJI software (Schindelin et al., 2012), and vein densities
were calculated following Scoffoni & Sack (2013).
                                                                       Results

Leaf shape and size                                                    Isolation of MIR156a over-expressing and MIM156 plants
Fully expanded leaves were attached to paper using double-sided        For the lines with confirmed transgene insertions, the relative
tape, labeled by node number increasing from the base of the           abundance of miR156 averaged 0.63 and 1.37 for the MIM156
plant and scanned. The scanned images were measured using the          and MIR156a lines, respectively (Fig. S1A,B). MIR156A lines 78
Morphological Analysis of Size and Shape (MASS) software               and 40 were selected as strong and moderate miR156 over-ex-
(Chuanromanee et al., 2019). The SHAPE program (Iwata &                pressors, respectively (Fig. S1A). MIM156 line 84 was selected as
Ukai, 2002) and FIJI (Schindelin et al., 2012) were used to deter-     a strong miR156 mimic, while MIM156 line 22 was selected to
mine the number of serrations and the perimeter of the leaf. The       represent a transgenic line in which miR156 levels were not sig-
perimeter of the leaf was measured from the tops of the serrations     nificantly different from the wild-type (Fig. S1A,B, t-test:
so as not to include the added length from the serration               P = 0.51). The levels of miR156-targeted SPL genes were

© 2021 The Authors                                                                                                    New Phytologist (2021)
New Phytologist © 2021 New Phytologist Foundation                                                                 www.newphytologist.com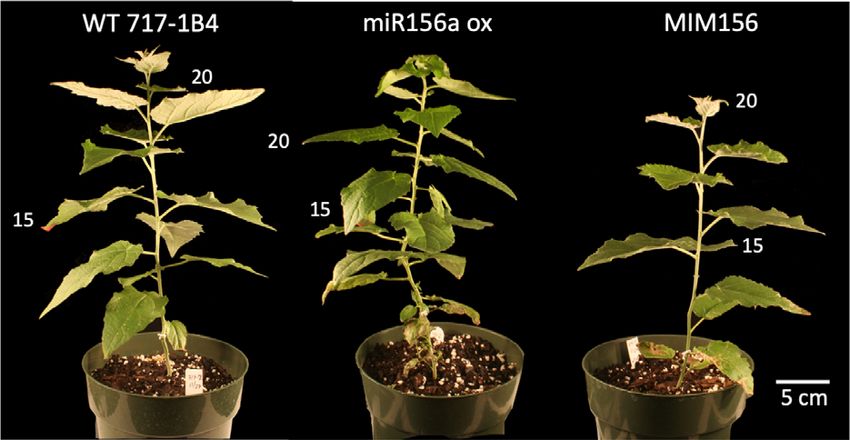
New
4 Research                                                                                                                       Phytologist

  consistent with the levels of miR156/157 in different transgenic      The abundance of miR156/157 in the primordia of leaves 15
  lines. MIM156 line 84 had, respectively, 3- and 9-fold more           and 25 in wild-type 717-1B4 was similar to the amount of
  PtSPL24 and PtSPL23 transcripts relative to the wild-type             miR156/157 in these same leaves in seed-grown poplar (Fig. 1a,
  (Fig. S1C). As expected based on its levels of miR156, the tran-      b), suggesting that miR156/157 are expressed at comparable
  scripts of both PtSPL24 and PtSPL23 in MIM156 line 22 did             levels at the same node in plants propagated by these methods.
  not differ from the wild-type (Fig. S1C). Both MIR156A lines          Leaves 15 and 25 of the miR156OX lines had, respectively 4.9
  40 and 78 showed significantly lower levels of these same genes       and 5.6 times the amount of miR156 as wild-type leaves, a level
  when compared with the wild-type (Fig. S1C). To confirm the           comparable to that of leaves 3 and 5 of seed-grown plants
  specificity of these transgenes, we also measured levels of PtSPL4    (Fig. 1a,b). Although the amount of miR156/157 in leaves 15
  and PtSPL7 – genes with no predicted miR156 target site. In           and 25 of the MIM156 lines was similar to that in 717-1B4 and
  both cases, there was no clear pattern of transcript abundance        seed-grown poplar (Fig. 1a,b), line 84 had about one-third the
  across transgenic lines (Fig. S1C).                                   amount of miR156 at an earlier stage of development, before it
                                                                        was transferred to soil (Fig. S1A). Target mimics do not necessar-
                                                                        ily reduce the level of their target miRNAs (Franco-Zorrilla et al.,
  miR156/157 and PtSPL24 abundance in seed-grown plants
                                                                        2007), so the significance of these MIM156 data is difficult to
  and 717-1B4 lines
                                                                        interpret. Regardless, the similarity between the amount of
  Patterns of miR156/157 abundance in the leaf primordia of             miR156/157 in MIM156 and wild-type lines shows that the
  seed-grown plants matched that previously reported for other          transformation protocol and vector components have no inde-
  species, such as Arabidopsis thaliana and Vachellia sp. (He et al.,   pendent effect on miR156/157 abundance.
  2018; Leichty & Poethig, 2019). miR156/157 abundance                     To determine if the changes in miR156/157 abundance
  dropped 7-fold between nodes 1 and 10, followed by a slower           observed in seed- and culture-derived plants were large enough to
  decline in successive nodes (Fig. 1a). We first determined that the   have downstream effects on the expression of their SPL targets,
  control small RNA, miR159, was present at the same level in           we measured PtSPL24 abundance across nodes 1 and 34 in seed-
  leaves 15 and 25 of seed-grown plants and the clone 717-1B4           grown plants and at nodes 15 and 25 of 717-1B4 lines. PtSPL24
  (Fig. S2), and then used this transcript to normalize the level of    abundance increased more than 11-fold between nodes 1 and 34
  miR156/157 in wild-type and transgenic genotypes of 717-1B4.          in seed-grown plants (Fig. 2a). In wild-type 717-1B4, PtSPL24

             (a)                                       (b)

                                                                                                  Fig. 1 miR156/157 relative abundance in
                                                                                                  Populus tremula 9 alba leaf primordia grown
                                                                                                  from seed (a) or in transgenic and wild-type
   (c)                                                                                            plants of the 717-1B4 background grown
                                                                                                  from tissue culture (b). miR156/157
                                                                                                  abundance relative to the average of four
                                                                                                  replicates from seed-grown leaves 1 and 2.
                                                                                                  Data presented as means  SE with seed-
                                                                                                  grown samples depicted by black open
                                                                                                  circles, 717 wild-type by purple circles,
                                                                                                  miR156a overexpression lines depicted by
                                                                                                  blue squares and MIM156 lines depicted by
                                                                                                  red triangles. Representative leaf shape for
                                                                                                  leaves 1–17, 20 and 30 from plants grown
                                                                                                  from seed (c).

  New Phytologist (2021)                                                                                                    © 2021 The Authors
  www.newphytologist.com                                                                       New Phytologist © 2021 New Phytologist Foundation
New
Phytologist Research 5
abundance increased 2-fold between nodes 15 and 25 (Fig. 2b). at increasing rate over the next 2–3 wk of measurement. During
Across a similar span in seed-grown plants, PtSPL24 abundance this latter period, miR156OX lines had higher rates of leaf initia-
increased by more than 1.5-fold between nodes 12 and 22, again tion than either the wild-type or MIM156 lines (Fig. 3b).
indicating that the expression patterns of genes in the miR156/ miR156OX lines also had shorter internodes than either the
157-SPL pathway are comparable between similar nodes of wild-type or MIM156 lines (Fig. 3c) and produced significantly
plants propagated via seeds and cuttings. Leaves 15 and 25 in the more axillary branches after 3 months than these genotypes
miR156OX lines had 4- and 15-fold less PtSPL24 respectively, (Fig. 3d; photographs of plants at this age in Fig. S3). The
compared to these same nodes in the wild-type line. This is con- MIM156 lines were not significantly different from 717-1B4 for
sistent with the levels of miR156/157 in these lines, and indicates any of these traits, although these lines did have slightly longer
that these levels of miR156/157 are functionally significant. The internodes than 717-1B4.
abundance of PtSPL24 in MIM156 line 22 was similar to that in
the wild-type, consistent with the observation that the abundance
Juvenile and adult leaves differ in leaf shape and size
of miR156 in this line is not significantly different from the wild-
type. Interestingly, the abundance of PtSPL24 was more than 2- The leaves of seed-grown plants became gradually rounder (de-
fold greater in leaf 15 of MIM156 line 84 compared to the wild- creased length : width (L : W) ratio) (Fig. 4a) and larger (Fig. 4c)
type, although the level of miR156/157 in this transgenic leaf is from node 1 to node 25 and did not change significantly in
similar to the wild-type. This discrepancy between miR156 and shape or size after this point (Figs 1c, 4c). 717-1B4 displayed a
PtSPL24 expression differences could be due to the nature of the similar trend, although the leaves of this clone reached their cli-
target mimic method as discussed previously. There was no dif- max shape and size a few nodes earlier than seed-grown plants
ference in the abundance of PtSPL24 at node 25 in MIM156 line (Figs 4b,d, 5). MIM156 lines did not differ significantly in size
84 and wild-type plants. Together with the abundance of from 717-1B4, but the leaves of line 84 were rounder than
miR156 and PtSPL24 measured in young plants still in culture 717-1B4 beginning at node 15. By contrast, the leaves of
(Fig. S1), these data suggest that the MIM156 transgene has the miR156OX lines were significantly more elongated and smaller
greatest effect during the juvenile phase, when miR156 levels are than wild-type leaves starting from node 15 (Student’s t-test
naturally high. P < 0.05). These results suggest that changes in leaf shape and
size during shoot development in poplar are partly regulated by
a decrease in the level of miR156.
Changes in miR156 abundance alter plant growth rate and
To obtain a comprehensive picture of the effect of miR156 on
form
leaf morphology in P. tremula 9 alba, we also measured the
Plants grown from seed produced leaves at a relatively slow rate specific leaf area (SLA), serrations, stomatal density, epidermal
for the first few weeks after planting, and transitioned to a faster, cell area, abaxial trichome density and petiole morphology of suc-
linear growth rate after producing 15–20 leaves (Fig. 3a). Leaf cessive leaves. We examined every fifth leaf of seed-grown plants
initiation in the wild-type and transgenic clones of 717-1B4 was from germination to nodes 45–50, and every fifth leaf of 717-
delayed for 35–40 d after transplanting to soil, and then occurred 1B4 and transgenic lines from nodes 10 to 25. We observed
(a) (b)
Fig. 2 PtSPL24 relative abundance in
Populus tremula 9 alba leaf primordia grown
from seed (a) or in transgenic and wild-type
plants of the 717-1B4 background grown
from tissue culture (b). PtSPL24 abundance
in seed-grown plants relative to seed-grown
leaves 1 and 2 (a) or relative to the average
wild-type 717 leaf 15 in plants from tissue
culture (b). Data presented as means SE
(n = 3) with seed-grown data depicted as
black open circles, 717 wild-type by purple
circles, miR156a overexpression lines
depicted by blue squares and MIM156 lines
depicted by red triangles.
© 2021 The Authors New Phytologist (2021)
New Phytologist © 2021 New Phytologist Foundation www.newphytologist.comNew
6 Research Phytologist
greater variation for these traits in seed-grown plants compared significant differences in leaf size, serration numbers are normal-
to the culture-derived clones, probably because of the increased ized to leaf perimeter. We found a slight decrease in the number
genetic variation in these open-pollinated plants. of serrations per centimeter of leaf perimeter in seed-grown
SLA is the area of the leaf blade per unit mass and is deter- plants, decreasing from just over two at node 10 to around 1.5 at
mined by the thickness of the leaf blade and cell density. SLA node 35 (Fig. 4g). 717-1B4 lines showed no phase-specific differ-
impacts leaf physiology through changes in intraleaf light dynam- ences in the number of serrations (P = 0.1469) as leaves of all
ics, CO2 diffusion and the distribution of leaf nitrogen genotypes and all positions had between 0.64 and 0.97 serrations
(Parkhurst, 1994; Epron et al., 1995; Terashima & Hikosaka, per centimeter of leaf perimeter (Fig. 4h). It is unclear why cul-
1995; Reich et al., 1998; Terashima et al., 2006; Evans et al., ture-derived plants have lower serration density than seed-grown
2009), and therefore provides insights into how changes in leaf plants, but these small differences in serrations are not likely to
development alter function. SLA decreased in a curvilinear fash- have any biological significance.
ion from leaf 5 to leaf 40 in seed-grown plants and decreased lin- Stomatal density on both the adaxial and the abaxial side of
early from leaf 10 to leaf 25 in 717-1B4 and the four transgenic the leaf changed across leaf positions, but in opposite directions
lines (Fig. 4e,f). However, SLA decreased nearly linearly between (Fig. 4i,k). In seed-grown plants, adaxial stomatal density
leaf 10 and leaf 25 in seed-grown plants, so these data do not decreased linearly from leaf 5 to leaf 40, whereas abaxial stomatal
reveal if there is a significant difference in the pattern in seed- density increased linearly over this interval; at every node, the
grown and clonally propagated plants. On the other hand, we density of stomata on the adaxial surface of the leaf was signifi-
found that – at nodes 15, 20 and 25 – lines over-expressing cantly less than that on the abaxial surface. Both 717-1B4 and
miR156 had a significantly higher SLA, and one MIM156 line the MIM156 lines had a very low density of adaxial stomata on
(84) had a significantly lower SLA, than 717-1B4 at node 10 leaf 10, and this number was reduced to nearly zero on leaf 25.
(Student’s t-test, P < 0.05 and P < 0.0001 for miR156OX lines at By contrast, the density of abaxial stomata in these genotypes
nodes 15 and 20, and node 25 respectively and P = 0.019 for line increased significantly between leaf 10 and leaf 25. In the
84 node 10). These results suggest that SLA is a phase-specific miR156OX lines, the density of stomata on both the adaxial and
trait and is regulated by miR156. the abaxial surfaces of leaves 10 and 25 was essentially identical
Leaf serrations are present on leaves of all measured positions to that of the basal-most leaves of seed-grown plants. Thus,
for both seed- and culture-derived plants. To account for miR156 has a role in regulating stomatal density on both sides of
(a) (b)
Fig. 3 Number of leaves initiated by Populus
tremula 9 alba grown from seed (a) and the
717-1B4 wild-type and four transgenic lines
from tissue culture (n = 3–6) (b). Internode
distance between nodes 10 and 20 (n = 6)
(c), and number of branches of > 1 cm in
length between nodes 1 and 25 after
4 months of growth (n = 6) (d) in the 717-
1B4 and four transgenic lines. Data from
seed-grown plants presented as individual
(c) (d) biological replicates using grey open circles
and a mean best-fit line in black or as
means SE with 717 wild-type data
depicted by purple circles, miR156a
overexpression lines depicted by blue squares
and MIM156 lines depicted by red triangles.
Data in (a) show a second-degree polynomial
fit with P < 0.0001 and R2 = 0.92 and an
ANCOVA for (b) found P < 0.0001 for
genotype and days after transplant but no
significance for an interaction between
effects. One-way ANOVA for (c) and (d)
found P < 0.0001 with the results of a
Student’s t-test between wild-type and
mutants represented by: *, P < 0.05; **,
P < 0.01; ***, P < 0.001.
New Phytologist (2021) © 2021 The Authors
www.newphytologist.com New Phytologist © 2021 New Phytologist FoundationNew
Phytologist Research 7
(a) (b) (i) (j)
(c) (d) (k) (l)
(e) (f) (m) (n)
(g) (h) (o) (p)
Fig. 4 Leaf length : width (L : W) ratio, leaf area, specific leaf area (SLA), serrations per centimeter of leaf perimeter, adaxial stomatal density, abaxial
stomatal density, adaxial epidermal cell area and abaxial trichome density of seed-grown P. tremula 9 alba (a, c, e, g, i, k, m, o) and the 717-1B4 and
transgenic lines (b, d, f, h, j, l, n, p). Data from seed-grown plants presented as individual biological replicates using grey open circles and a mean best-fit
line in black or as means SE with 717 wild-type data depicted by purple circles, miR156a overexpression lines depicted by blue squares and MIM156 lines
depicted by red triangles (n = 5–11). Data in (a), (c), (e), (g), (m) and (o) show a second-degree polynomial relationship with P < 0.0001 and R2 values of
0.17, 0.6, 0.32, 0.25, 0.85 and 0.56, respectively. Data in (i) and (k) show a linear relationship with P < 0.0001 and R2 values of 0.58 and 0.46 respectively.
ANCOVAs with leaf position and genotype as the effects for data in (b), (d), (f), (l), (n) and (p) found P < 0.001 for both leaf position and genotype. In (j),
P < 0.001 for genotype but not significant (ns) for leaf position. In (h), P < 0.01 for leaf position but ns for genotype. For the interaction between genotype
and leaf position, P < 0.05 for data in (b), (f), (l), and (p) and ns for (d), (h), (j) and (n).
the leaf. However, other factors are also likely to contribute to We measured epidermal cell area by taking impressions of the
the developmental changes in stomatal density (Berger & Alt- adaxial epidermis, because the high density of trichomes made it
mann, 2000; Sugano et al., 2010), because this parameter impractical to measure this trait on the abaxial surface. In seed-
changes linearly during shoot development, rather than in the grown plants, cell area decreased c. 4-fold over the first 30 leaves
curvilinear pattern characteristic of the change in miR156 levels and remained relatively constant after this point (Fig. 4m). In
(Fig. 4j,l). 717-1B4, cell area decreased about 2-fold from leaf 10 to leaf 20,
© 2021 The Authors New Phytologist (2021)
New Phytologist © 2021 New Phytologist Foundation www.newphytologist.comNew
8 Research Phytologist
increased by about 6-fold between leaf 10 and leaf 25 in 717-
1B4. By contrast, abaxial trichome density remained at the same
relatively low level from node 10 to node 25 in miR156OX, and
it increased significantly more than 717-1B4 in both MIM156
lines (Student’s t-test; P < 0.01 and P < 0.0001 for lines 22 and
84 respectively). This result suggests that abaxial trichome pro-
duction is a phase-specific trait in P. tremula 9 alba and is hyper-
sensitive to the level of miR156.
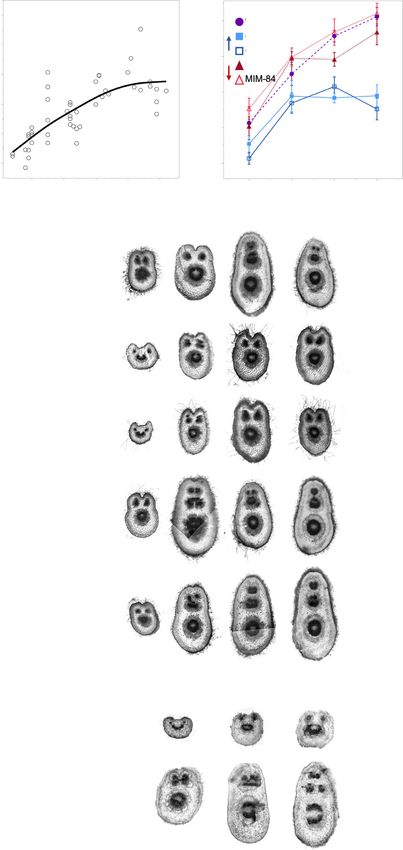
Leaf vein density increases as plants transition from juvenile
to adult
While working with the 717-1B4 lines, we noted differences in
vasculature of leaves at the same position between wild-type and
transgenic lines. Because vein density and patterning impact leaf
structure and function (i.e. assimilation and herbivore resistance)
(Brodribb et al., 2007; Blonder et al., 2018), we thought this trait
was worth investigating. Leaf vein density increased 1.8-fold with
increasing leaf position in 717-1B4 and in the MIM156 lines,
although MIM156 line 84 had a significantly higher vein density
than 717-1B4 in leaf 10 (Student’s t-test, P < 0.01). Similar
results were obtained for the density of vein endings. In the
miR156OX lines, vein density and the density of vein endings
did not differ much between leaf 10 and leaf 25, and were identi-
cal to, or slightly lower than, the values observed for leaf 10 in
717-1B4 (Fig. 6).
Petiole morphology changes during development leading
to altered leaf fluttering behavior
Many species of poplar, including P. tremula 9 alba, exhibit leaf
fluttering, a trait that has been attributed to the vertical elonga-
tion of the petiole (Niklas, 1991). In a previous study of
Populus 9 canadensis, we found that the petioles of in vitro propa-
gated plants became increasing elongated as the shoot developed,
and that over-expression of miR156 suppressed this process
(Wang et al., 2011). To determine if this phenomenon occurs
Fig. 5 Representative plants from the wild-type 717-1B4 Populus
naturally, we examined the L : W ratio of a cross-section of the
tremula 9 alba, miR156a overexpressor line 40 and MIM156 line 84 petiole in seed-grown P. tremula 9 alba (Fig. 7a,d). We found
2 months following transplant from tissue culture. Leaves at positions 15 that the petiole of leaves at node 10 was slightly broader than tall
and 20 are noted. Representative leaf shape for fully expanded leaves (L : W < 1), whereas the petioles of leaves at higher nodes became
from positions 10, 15, 20 and 25 in the 717-1B4 and transgenic poplar vertically elongated (L : W > 1), reaching their climax shape
plants from tissue culture.
around node 40. In wild-type 717-1B4, and in the MIM156 and
miR156OX lines, the petiole also became progressively elongated
and decreased much less dramatically, if at all, between leaf 20 (Fig. 7b,c). However, the miR156OX lines had significantly
and leaf 25. The MIM156 lines were not significantly different fewer elongated petioles than the 717-1B4 and the MIM156
from 717-1B4. By contrast, cell area in the miR156OX did not lines, and reached a maximum L : W ratio at an earlier node. We
change significantly between leaf 10 and leaf 25 (Fig. 4n). These also examined the effect of these transgenes on petiole anatomy.
results suggest that epidermal cell area is a phase-specific trait. In 717-1B4, the petioles of leaves at nodes 10 and 15 had an
The leaves of Populus alba appear white because of a dense adaxial indentation, a large central vascular bundle and two
layer of trichomes on the abaxial surface of the leaf blade, and this smaller vascular bundles located in a horizontal plane above the
trait is also characteristic of P. tremula 9 alba (Fig. S4). All the central bundle. The petioles of leaves 20 and 25 lacked an adaxial
leaves of P. tremula 9 alba produced abaxial trichomes, but tri- indentation and had three vertically oriented vascular bundles
chome density increased dramatically during shoot growth that decreased in size from the abaxial to the adaxial side of the
(Fig. 4o,p). In seed-grown plants, abaxial trichome density petiole. In the MIM156 lines, the vascular anatomy of leaf 15
increased more than 10-fold between leaf 5 and leaf 40 and was intermediate between that of leaf 10 and leaf 20 in 717-1B4,
New Phytologist (2021) © 2021 The Authors
www.newphytologist.com New Phytologist © 2021 New Phytologist FoundationNew
Phytologist Research 9
(a) (b)
Fig. 6 Total leaf vein density (a) and the
number of vein endings (b) in the 717-1B4
and transgenic Populus tremula 9 alba. Data (c)
from seed-grown plants presented as
individual biological replicates using grey
open circles and a mean best-fit line in black
or as means SE with 717 wild-type data
depicted by purple circles, miR156a
overexpression lines depicted by blue squares
and MIM156 lines depicted by red triangles
(n = 5–6). ANCOVA with leaf position and
genotype as the effects found P < 0.0001 for
both effects and the interaction for data in
(a) and (b). Representative samples of leaves
cleared and stained to visualized vein density
and architecture in leaves 10 and 25 of 717-
1B4 and transgenic poplar lines (c).
indicating that the transition to the adult shape is accelerated in shoots arising de novo in culture, and that most of these changes
these lines, despite the lack of a significant change in the L : W are correlated with and sensitive to changes in the level of
ratio of the petiole (Fig. 7c). Consistent with their L : W ratio, miR156. These data confirm and extend previous studies of the
lines over-expressing miR156 retained a juvenile petiole mor- effect of miR156 on Populus development (Wang et al., 2011;
phology up to at least node 25. Petiole anatomy is therefore an Rubinelli et al., 2013), and provide a foundation for future
obvious qualitative indicator of the phase identity of a leaf in P. research on the function of vegetative phase change in the life his-
tremula 9 alba. tory of this woody species.
To determine if this change in petiole morphology has an In nature, poplars propagate primarily from adventitious
effect on the behavior of the leaf, we looked at two measures of shoots, whereas clones used for research or commercial purposes
leaf fluttering – the total distance moved by the leaf, and the max- are propagated from axillary buds or by inducing shoot regenera-
imum horizontal span of the leaf tip – when leaves were exposed tion in vitro (Taylor, 2002). The extent to which these plants
to a constant wind velocity (Figs 8a, S5). There was a statistically recapitulate the development of the primary shoot is still
significant (P < 0.0001) positive linear relationship between peti- unknown. We found by at least the 10th node, the development
ole L : W ratio and these fluttering measures in 717-1B4, the of a regenerated shoot is remarkably similar to that of seed-grown
MIM156 and miR156OX lines. Leaves at basal node 10 in the plants. This result suggests that the phase-identity of poplar cells
717-1B4 and in the MIM156 lines fluttered less than leaves at is either reset during the dedifferentiation of the primary tissue
more apical node 25, whereas juvenile leaves at node 25 of the sample, or during shoot regeneration, and is consistent with
miR156OX lines fluttered less than leaves at node 25 of the 717- observations in Zea mays (Irish & Karlen, 1998; Orkwiszewski &
1B4 and in the MIM156 lines (Fig. 8b,c). Thus, the petiole mor- Poethig, 2000). This observation also raises the long-standing
phology of juvenile and adult leaves of P. tremula 9 alba has a question of whether differentiated traits can be maintained in tis-
significant effect on their response to wind. sue culture.
Although vegetative phase change sometimes involves traits
unique to a particular species (Wang et al., 2011; Leichty &
Discussion
Poethig, 2019), analyses of plants with altered levels of miR156
Many plants lack visually abrupt changes in form during shoot have revealed a number of phase-specific traits that are common to
development, making the onset of vegetative phase change diffi- phylogenetically diverse species. In Z. mays, A. thaliana, Nicotiana
cult to observe. As a result, the existence of this phenomenon and tabacum and now P. tremula 9 alba, these traits include patterns
its significance for plant ecology and evolution are often under- of trichome production, leaf shape and size, epidermal and stom-
appreciated. In this study, we characterized the growth rate, atal cell traits, vein density, leaf initiation rate, and branching
developmental morphology and temporal pattern of miR156 and (Bongard-Pierce et al., 1996; Telfer et al., 1997; Feng et al., 2016;
SPL expression in P. tremula 9 alba, an ecologically and econom- He et al., 2018). At least some of these traits are also regulated by
ically important tree. We found that many leaf traits change dur- miR156 in Populus 9 canadensis (Wang et al., 2011), rice (Xie
ing shoot development in plants grown from seeds, as well as in et al., 2006), alfalfa (Aung et al., 2015), switchgrass (Fu et al.,
© 2021 The Authors New Phytologist (2021)
New Phytologist © 2021 New Phytologist Foundation www.newphytologist.comNew
10 Research Phytologist
(a) (b)
(c)
Fig. 7 Petiole length : width (L : W) ratio
from cross-sections made within 1 cm of leaf
attachment in seed-grown (a) and 717-1B4
and transgenic Populus tremula 9 alba (b).
Data from seed-grown plants presented as
individual biological replicates using grey
open circles and a mean best-fit line in black
or as means SE with 717 wild-type data
depicted by purple circles, miR156a
overexpression lines depicted by blue squares
and MIM156 lines depicted by red triangles
(n = 7–12). Data from (a) show a second-
degree polynomial relationship with
P < 0.0001 and R2 = 0.62. For (b), ANCOVA
with leaf position and genotype as the effects
found P < 0.0001 for leaf position and
genotype and P = 0.01 for the interaction.
Representative samples of petiole cross-
sections from leaves 10, 15, 20 and 25 of the
717-1B4 and four transgenic lines (c).
Representative samples of petiole cross-
sections from leaf positions between 5 and
40 in plants grown from seed (d).
2012), Lotus japonicus (Wang, 2014) and tomato (Zhang et al., shoot development contributes to plant fitness and is therefore
2011). This observation indicates that vegetative phase change is under natural selection (Leichty & Poethig, 2019).
an ancient and fundamental aspect of shoot development, and also Determining how phase-specific traits contribute to plant fit-
suggests that the differential expression of various traits during ness is challenging. However, a number of studies have shown
New Phytologist (2021) © 2021 The Authors
www.newphytologist.com New Phytologist © 2021 New Phytologist FoundationNew
Phytologist Research 11
(a)
(b) (c)
Fig. 8 Diagram showing the path length and
horizontal span measurements of leaf
fluttering of an adult (WT 717-1B4 node 25),
juvenile (WT 717-1B4 node 10) and
juvenilized (miR156 overexpressor line 40
node 25) leaf of Populus tremula 9 alba.
Quantification of leaf fluttering through total
path length over a 1 s period (a) and
maximum horizontal span of the tip of the
leaf (b) and their relationship with petiole
length : width ratio (L : W). 717-1B4 data are
depicted by circles, miR156a overexpressor
line 40 by squares and MIM156 line 84, by
triangles. Leaf developmental stage is noted
by color with adult leaves in red, juvenile in
dark blue and juvenilized in light blue. Linear
fit for (b) path length = 0.34288 + 0.544
(petiole L : W ratio) and (c) horizontal
span = 0.0852 + 0.0939(petiole L : W ratio).
that plants over-expressing miR156 are more or less sensitive to the onset of adult traits begins within 3 months of growth,
various environmental stresses (Stief et al., 2014; Cui et al., 2014; despite the much longer lifespan of this species. As in Arabidopsis
Arshad et al., 2017; Kang et al., 2020), Despite this, there is still (He et al., 2018), miR156 expression in poplar declines rapidly
little evidence that juvenile and adult phases of wild-type plants over the first few leaves, but it is not until later, when the decline
display these same differences in sensitivity or how they might in miR156 is more subtle, that adult morphological traits first
contribute to plant fitness. There are relatively few examples of appear. This result further supports the findings in Arabidopsis
phase-specific vegetative traits that are either known or expected that miR156/157 expression in early leaves far exceeds the
to be selectively advantageous (Williams et al., 1998; Holeski amount necessary to repress most SPL targets (He et al., 2018).
et al., 2009; Leichty & Poethig, 2019). Our observation that Furthermore, these findings suggest that it is inappropriate to
adult leaves flutter more than juvenile leaves is another such assume the timing of vegetative phase change is proportional to
example. In poplar, leaf fluttering is beneficial under high light the lifespan of a species. As we continue to characterize this devel-
and high heat environments, but is disadvantageous under low opmental transition across species with diverse life histories, we
light conditions as it reduces photosynthesis (Roden & Pearcy, are likely to find large variations in the proportion of time spent
1993a,b). This suggests that reduced leaf fluttering is advanta- in either the juvenile or the adult vegetative phase.
geous early in development, when plants are more likely to be During shoot development, different morphological and phys-
shaded, whereas increased fluttering is advantageous once plants iological traits change in a coordinated fashion, but not necessar-
are no longer in the understory. ily at the same node or at the same rate (Hackett & Murray,
Surprisingly, we found that progression of vegetative phase 1997; Leichty & Poethig, 2019). Furthermore, under certain
change in poplar, a woody perennial, is not very different from conditions, traits can become dissociated, resulting in leaves or
this process in Arabidopsis, an annual herb. In P. tremula 9 alba, shoots that have unusual combinations of juvenile and adult traits
© 2021 The Authors New Phytologist (2021)
New Phytologist © 2021 New Phytologist Foundation www.newphytologist.comNew
12 Research Phytologist
(Robbins, 1960; Doorenbos, 1965). In our experiments, this was R. Scott Poethig https://orcid.org/0000-0001-6592-5862
apparent from the phenotype of transgenic lines expressing a Steven H. Strauss https://orcid.org/0000-0001-9670-3082
miR156/miR157 target site mimic (MIM156). The stronger of
these transgenes had a significant effect on leaf L : W ratio, SLA,
References
epidermal cell area, petiole morphology and leaf vein density, but
did not affect leaf initiation rate, stomatal density or petiole L : W Arshad M, Feyissa BA, Amyot L, Aung B, Hannoufa A. 2017. MicroRNA156
improves drought stress tolerance in alfalfa (Medicago sativa) by silencing
ratio. These observations are consistent with studies in
SPL13. Plant Science 258: 122–136.
Arabidopsis, which show that different miR156-regulated SPL Ashby E. 1948. Studies in the morphogenesis of leaves. II. The area, cell size and
genes have different transcription patterns and sensitivity to cell number of leaves of Ipomoea in relation to their position on the shoot. New
miR156 abundance (Xu et al., 2016; He et al., 2018). Along with Phytologist 47: 177–195.
the evidence that SPL genes also have different loss-of-function Aung B, Gruber MY, Amyot L, Omari K, Bertrand A, Hannoufa A. 2015.
Ectopic expression of LjmiR156 delays flowering, enhances shoot branching,
phenotypes (Xu et al., 2016), these results suggest that variability and improves forage quality in alfalfa. Plant Biotechnology Reports 9: 379–393.
in the expression of different phase-specific traits may arise from Baxter HL, Mazarei M, Dumitrache A, Natzke JM, Rodriguez M, Gou J, Fu C,
the differential response of functionally distinct SPL genes to Sykes RW, Turner GB, Davis MF et al. 2018. Transgenic miR156 switchgrass
changes in the level of miR156. in the field: growth, recalcitrance and rust susceptibility. Plant Biotechnology
miR156 and its SPL targets control many economically Journal 16: 39–49.
Berger D, Altmann T. 2000. A subtilisin-like serine protease involved in the
important traits, including flowering time, shoot architecture,
regulation of stomatal density and distribution in Arabidopsis thaliana. Genes
biomass and lignin production, pest and disease resistance, and and Development 14: 1119–1131.
abiotic stress responses (Wang & Wang, 2015). In the biofuel Blonder B, Salinas N, Patrick Bentley L, Shenkin A, Porroa POC, Tejeira YV,
crop Panicum virgatum, for example, over-expressing miR156 Espinoza TEB, Goldsmith GR, Enrico L, Martin R et al. 2018. Structural and
leads to increases in biomass, digestibility and lignin produc- defensive roles of angiosperm leaf venation network reticulation across an
Andes–Amazon elevation gradient. Journal of Ecology 106: 1683–1699.
tion, a delay in flowering time, and altered susceptibility to the
Bongard-Pierce DK, Evans MMS, Poethig RS. 1996. Heteroblastic features of
pathogen Puccinia emaculata (Chuck et al., 2011; Fu et al., leaf anatomy in maize and their genetic regulation. International Journal of
2012; Baxter et al., 2018). Similar effects of miR156 over-ex- Plant Sciences 157: 331–340.
pression have been observed in the forage legumes Trifolium Brink RA. 1962. Phase change in higher plants and somatic cell heredity. The
pretense (Zheng et al., 2016) and Medicago sativa (Aung et al., Quarterly Review of Biology 37: 1–22.
Brodribb TJ, Feild TS, Jordan GJ. 2007. Leaf maximum photosynthetic rate and
2015). Poplars are fast-growing trees useful for a wide variety of
venation are linked by hydraulics. Plant Physiology 144: 1890–1898.
industrial purposes, as well for the reforestation of degraded Chuanromanee TS, Cohen JI, Ryan GL. 2019. Morphological analysis of size
land (Taylor, 2002). The ability to engineer their chemistry and and shape (MASS): an integrative software program for morphometric analyses
vegetative development through the manipulation of miR156 of leaves. Applications in Plant Sciences 7: e11288.
offers new opportunities for the improvement of this important Chuck GS, Tobias C, Sun L, Kraemer F, Li C, Dibble D, Arora R, Bragg JN,
Vogel JP, Singh S et al. 2011. Overexpression of the maize Corngrass1
group of plants.
microRNA prevents flowering, improves digestibility, and increases starch
content of switchgrass. Proceedings of the National Academy of Sciences, USA
109: 995.
Acknowledgements Cui L-G, Shan J-X, Shi M, Gao J-P, Lin H-X. 2014. The miR156-SPL9-DFR
We thank Samara Gray and Joshua Darfler for their assistance in pathway coordinates the relationship between development and abiotic stress
tolerance in plants. The Plant Journal 80: 1108–1117.
caring for the plants used in this study. This research was funded Doorenbos J. 1965. Juvenile and adult phases in woody plants. Encyclopedia of
by the NSF Graduate Research Fellowship (DGE-1845298), Plant Physiology 15: 1222–1235.
University of Pennsylvania SAS Dissertation Research Fellowship Engler C, Youles M, Gruetzner R, Ehnert T-M, Werner S, Jones JDG, Patron
and the Peachey Research Fund to EHL, NIH T32GM008216 NJ, Marillonnet S. 2014. A Golden Gate modular cloning toolbox for plants.
to ARL and NIH GM51893 to RSP. ACS Synthetic Biology 3: 839–843.
Epron D, Godard D, Cornic G, Genty B. 1995. Limitation of net CO2
assimilation rate by internal resistances to CO2 transfer in the leaves of two tree
Author contributions species (Fagus sylvatica L. and Castanea sativa Mill.). Plant, Cell & Environment
18: 43–51.
EHL, ARL and RSP planned and designed the research. EHL Evans JR, Kaldenhoff R, Genty B, Terashima I. 2009. Resistances along the
and ARL performed the experiments. CM and SHS helped create CO2 diffusion pathway inside leaves. Journal of Experimental Botany 60: 2235–
2248.
the transgenics used in this study. EED performed follow-up
Feng S, Xu Y, Guo C, Zheng J, Zhou B, Zhang Y, Ding Y, Zhang L, Zhu Z,
experiments during revision. EHL performed statistical analyses Wang H et al. 2016. Modulation of miR156 to identify traits associated with
and wrote the first draft of the manuscript. All authors revised vegetative phase change in tobacco (Nicotiana tabacum). Journal of
and provided comments on the manuscript. Experimental Botany 67: 1493–1504.
Filichkin SA, Meilan R, Busov VB, Ma C, Brunner AM, Strauss SH. 2006.
Alcohol-inducible gene expression in transgenic Populus. Plant Cell Reports 25:
ORCID 660–667.
Franco-Zorrilla JM, Valli A, Todesco M, Mateos I, Puga MI, Rubio-Somoza I,
Erin E. Doody https://orcid.org/0000-0002-1282-1792 Leyva A, Weigel D, Garcıa JA, Paz-Ares J et al. 2007. Target mimicry
Erica H. Lawrence https://orcid.org/0000-0002-0220-3210 provides a new mechanism for regulation of microRNA activity. Nature
Aaron R. Leichty https://orcid.org/0000-0003-1071-7921 Genetics 39: 1033–1037.
New Phytologist (2021) © 2021 The Authors
www.newphytologist.com New Phytologist © 2021 New Phytologist FoundationNew
Phytologist Research 13
Fu C, Sunkar R, Zhou C, Shen H, Zhang J-YY, Matts J, Wolf J, Mann DGJ, Schwab R, Palatnik JF, Riester M, Schommer C, Schmid M, Weigel D. 2005.
Stewart CN, Tang Y et al. 2012. Overexpression of miR156 in switchgrass Specific effects of microRNAs on the plant transcriptome. Developmental Cell
(Panicum virgatum L.) results in various morphological alterations and leads to 8: 517–527.
improved biomass production. Plant Biotechnology Journal 10: 443–452. Scoffoni C, Sack L. 2013. Quantifying leaf vein traits. Prometheus Wiki. [WWW
Goebel K. 1900. Organography of Plants Part I. General Organography. (English document] URL http://prometheuswiki.org/tiki-index.php?page=Quantifying+
Translation by I. B. Balfour). Oxford, UK: Clarendon Press. leaf+vein+traits [accessed 1 May 2018].
Hackett WP, Murray JR. 1997. Approaches to understanding maturation or Stief A, Altmann S, Hoffmann K, Pant BD, Scheible W-R, B€a urle I. 2014.
phase change. In: Geneve RL, Preece JE, Merkle SA, eds. Biotechnology of Arabidopsis miR156 regulates tolerance to recurring environmental stress
ornamental plants. New York, NY, USA: CAB International, 73–86. through SPL transcription factors. Plant Cell 26: 1792–1807.
He J, Xu M, Willmann MR, McCormick K, Hu T, Yang L, Starker CG, Voytas Sugano SS, Shimada T, Imai Y, Okawa K, Tamai A, Mori M, Hara-Nishimura
DF, Meyers BC, Poethig RS. 2018. Threshold-dependent repression of SPL I. 2010. Stomagen positively regulates stomatal density in Arabidopsis. Nature
gene expression by miR156/miR157 controls vegetative phase change in 463: 241–244.
Arabidopsis thaliana. PLoS Genetics 14: e1007337. Taylor G. 2002. Populus: Arabidopsis for forestry. Do we need a model tree?
Holeski LM, Kearsley MJC, Whitham TG. 2009. Separating ontogenetic and Annals of Botany 90: 681–689.
environmental determination of resistance to herbivory in cottonwood. Ecology Telfer A, Bollman KM, Poethig RS. 1997. Phase change and the regulation of
90: 2969–2973. trichome distribution in Arabidopsis thaliana. Development 124: 645–654.
Irish EE, Karlen S. 1998. Restoration of juvenility in maize shoots by meristem Terashima I, Hanba YT, Tazoe Y, Vyas P, Yano S. 2006. Irradiance and
culture. International Journal of Plant Sciences 159: 695–701. phenotype: comparative eco-development of sun and shade leaves in relation to
Iwata H, Ukai Y. 2002. SHAPE: a computer program package for quantitative photosynthetic CO2 diffusion. Journal of Experimental Botany 57: 343–354.
evaluation of biological shapes based on elliptic Fourier descriptors. The Journal Terashima I, Hikosaka K. 1995. Comparative ecophysiology of leaf and canopy
of Heredity 93: 384–385. photosynthesis. Plant, Cell & Environment 18: 1111–1128.
James SA, Bell DT. 2001. Leaf morphological and anatomical characteristics of Varkonyi-Gasic E, Wu R, Wood M, Walton EF, Hellens RP. 2007. Protocol: a
heteroblastic Eucalyptus globulus ssp. globulus (Myrtaceae). Australian Journal of highly sensitive RT-PCR method for detection and quantification of
Botany 49: 259–269. microRNAs. Plant Methods 3: 12.
Kang T, Yu CY, Liu Y, Song WM, Bao Y, Guo XT, Li B, Zhang HX. 2020. Walters GA, Bartholomew DP. 1984. Acacia koa leaves and phyllodes: gas
Subtly manipulated expression of ZmmiR156 in tobacco improves drought exchange, morphological, anatomical, and biochemical characteristics.
and salt tolerance without changing the architecture of transgenic plants. Botanical Gazette 145: 351–357.
Frontiers in Plant Science 10: 1664. Wang H, Wang H. 2015. The miR156/SPL module, a regulatory hub and
Leichty AR, Poethig RS. 2019. Development and evolution of age-dependent versatile toolbox, gears up crops for enhanced agronomic traits. Molecular Plant
defenses in ant-acacias. Proceedings of the National Academy of Sciences, USA 8: 677–688.
116: 15596–15601. Wang J-W. 2014. Regulation of flowering time by the miR156-mediated age
Livak KJ, Schmittgen TD. 2001. Analysis of relative gene expression data using pathway. Journal of Experimental Botany 65: 4723–4730.
real-time quantitative PCR and the 2-DDCT method. Methods 25: 402–408. Wang JW, Park MY, Wang LJ, Koo Y, Chen XY, Weigel D, Poethig RS. 2011.
Meilan R, Ma C. 2006. Poplar (Populus spp.). In: Wang K, ed. Methods in MiRNA control of vegetative phase change in trees. PLoS Genetics 7:
Molecular Biology: Agrobacterium Protocols. Totowa, NJ, USA: Humana Press e1002012.
Inc., 143–151. Williams WP, Davis FM, Buckley PM, Hedin PA, Baker GT, Luthe DS. 1998.
Niklas KJ. 1991. The elastic moduli and mechanics of Populus tremuloides Factors associated with resistance to fall Armyworm (Lepidoptera: Noctuidae)
(Salicaceae) petioles in bending. American Journal of Botany 78: 989–996. and southwestern Corn Borer (Lepidoptera: Crambidae) in corn at different
Orkwiszewski JAJ, Poethig RS. 2000. Phase identity of the maize leaf is vegetative stages. Journal of Economic Entomology 91: 1471–1480.
determined after leaf initiation. Proceedings of the National Academy of Sciences, Xie K, Wu C, Xiong L. 2006. Genomic organization, differential expression, and
USA 97: 10631–10636. interaction of SQUAMOSA Promoter-Binding-Like Transcription Factors and
Parkhurst DF. 1994. Diffusion of CO2 and other gases inside leaves. New microRNA156 in rice. Plant Physiology 142: 280–293.
Phytologist 126: 449–479. Xu M, Hu T, Zhao J, Park M-Y, Earley KW, Wu G, Yang L, Poethig RS. 2016.
Pettengill EA, Parmentier-Line C, Coleman GD. 2012. Evaluation of qPCR Developmental functions of miR156-regulated SQUAMOSA PROMOTER
reference genes in two genotypes of Populus for use in photoperiod and low- BINDING PROTEIN-LIKE (SPL) genes in Arabidopsis thaliana. PLoS
temperature studies. BMC Research Notes 5: 366. Genetics 12: e1006263.
Poethig RS. 2013. Vegetative phase change and shoot maturation in plants. Zhang X, Zou Z, Zhang J, Zhang Y, Han Q, Hu T, Xu X, Liu H, Li H, Ye Z.
Current Topics in Developmental Biology 105: 125–152. 2011. Over-expression of sly-miR156a in tomato results in multiple vegetative
Reich PB, Ellsworth DS, Walters MB. 1998. Leaf structure (specific leaf area) and reproductive trait alterations and partial phenocopy of the sft mutant.
modulates photosynthesis–nitrogen relations: evidence from within and across FEBS Letters 585: 435–439.
species and functional groups. Functional Ecology 12: 948–958. Zheng Q-L, Liu J, Goff BM, Dinkins RD, Zhu H. 2016. Genetic manipulation
Rhoades MW, Reinhart BJ, Lim LP, Burge CB, Bartel B, Bartel DP. 2002. of miR156 for improvement of biomass production and forage quality in red
Prediction of plant microRNA targets. Cell 110: 513–520. clover. Crop Science 56: 1–7.
Robbins WJ. 1960. Further observations on juvenile and adult Hedera. American Zotz G, Wilhelm K, Becker A. 2011. Heteroblasty – a review. Botanical Review
Journal of Botany 47: 485–491. 77: 109–151.
Roden JS, Pearcy RW. 1993a. Effect of leaf flutter on the light environment of
poplars. Oecologia 93: 201–207.
Roden JS, Pearcy RW. 1993b. The effect of flutter on the temperature of poplar Supporting Information
leaves and its implications for carbon gain. Plant, Cell & Environment 16: 571–
577. Additional Supporting Information may be found online in the
Rubinelli PM, Chuck G, Li X, Meilan R. 2013. Constitutive expression of the Supporting Information section at the end of the article.
Corngrass1 microRNA in poplar affects plant architecture and stem lignin
content and composition. Biomass and Bioenergy 54: 312–321. Fig. S1 The relative abundance of miR156 and SPL transcripts
Schindelin J, Arganda-Carreras I, Frise E, Kaynig V, Longair M, Pietzsch T,
Preibisch S, Rueden C, Saalfeld S, Schmid B et al. 2012. Fiji: An open-source
in leaf primordia of young transgenic and 717-1B4 wild-type P.
platform for biological-image analysis. Nature Methods 9: 676–682. tremula 9 alba grown in culture.
© 2021 The Authors New Phytologist (2021)
New Phytologist © 2021 New Phytologist Foundation www.newphytologist.comYou can also read