Characteristics of expert search behavior in volumetric medical image interpretation
←
→
Page content transcription
If your browser does not render page correctly, please read the page content below
Characteristics of expert search behavior in
             volumetric medical image interpretation

         Lauren H. Williams ,a,* Ann J. Carrigan,b,c,d Megan Mills,e
       William F. Auffermann ,e Anina N. Rich ,c,d,f and Trafton Drewg
   a
     University of California, San Diego, Department of Psychology, San Diego, California,
                                           United States
    b
      Macquarie University, Department of Psychology, Sydney, New South Wales, Australia
   c
     Macquarie University, Perception in Action Research Centre, Sydney, New South Wales,
                                              Australia
      d
       Macquarie University, Centre for Elite Performance, Expertise, and Training, Sydney,
                                    New South Wales, Australia
  e
    University of Utah, School of Medicine, Department of Radiology and Imaging Sciences,
                                Salt Lake City, Utah, United States
f
 Macquarie University, Department of Cognitive Science, Sydney, New South Wales, Australia
        g
         University of Utah, Department of Psychology, Salt Lake City, Utah, United States

Abstract
Purpose: Experienced radiologists have enhanced global processing ability relative to novices,
allowing experts to rapidly detect medical abnormalities without performing an exhaustive
search. However, evidence for global processing models is primarily limited to two-dimensional
image interpretation, and it is unclear whether these findings generalize to volumetric images,
which are widely used in clinical practice. We examined whether radiologists searching volu-
metric images use methods consistent with global processing models of expertise. In addition,
we investigated whether search strategy (scanning/drilling) differs with experience level.
Approach: Fifty radiologists with a wide range of experience evaluated chest computed-tomog-
raphy scans for lung nodules while their eye movements and scrolling behaviors were tracked.
Multiple linear regressions were used to determine: (1) how search behaviors differed with years
of experience and the number of chest CTs evaluated per week and (2) which search behaviors
predicted better performance.
Results: Contrary to global processing models based on 2D images, experience was unrelated to
measures of global processing (saccadic amplitude, coverage, time to first fixation, search time,
and depth passes) in this task. Drilling behavior was associated with better accuracy than scan-
ning behavior when controlling for observer experience. Greater image coverage was a strong
predictor of task accuracy.
Conclusions: Global processing ability may play a relatively small role in volumetric image
interpretation, where global scene statistics are not available to radiologists in a single glance.
Rather, in volumetric images, it may be more important to engage in search strategies that sup-
port a more thorough search of the image.
© 2021 Society of Photo-Optical Instrumentation Engineers (SPIE) [DOI: 10.1117/1.JMI.8.4.041208]
Keywords: medical image perception; gist processing; expertise; scanners and drillers; lung
cancer detection.
Paper 20348SSRR received Dec. 22, 2020; accepted for publication Jun. 28, 2021; published
online Jul. 14, 2021.

*Address all correspondence to Lauren H. Williams, l8williams@ucsd.edu

2329-4302/2021/$28.00 © 2021 SPIE

Journal of Medical Imaging                              041208-1           Jul∕Aug 2021   •   Vol. 8(4)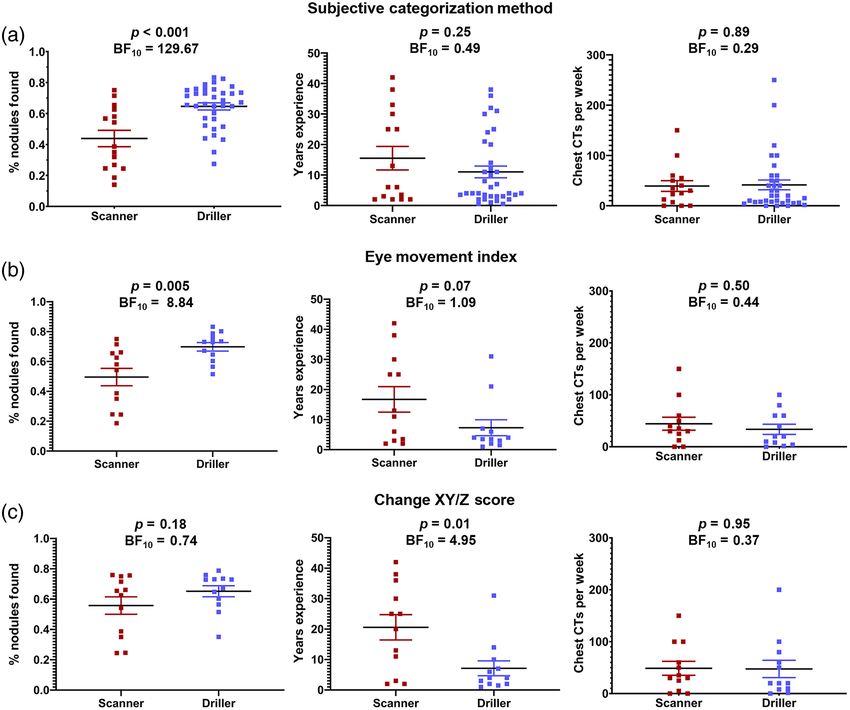
Williams et al.: Characteristics of expert search behavior in volumetric medical image interpretation

1 Introduction
Identifying an abnormality in a medical image is a critical step toward patient diagnosis and
treatment. However, medical image interpretation is a difficult task, and research spanning the
past several decades has consistently revealed missed abnormality rates of ∼30%.1 Given the
challenge of this task, one might expect abnormality detection to involve an exhaustive search of
the image until an abnormality is located. However, radiologists frequently report sensing an
abnormality is present before it is actually located and identified in the image. Consistent with
these anecdotal reports, radiologists detect most abnormalities within the first second of inter-
pretation, which is much less time than it would take to complete an exhaustive search of the
image.2–4 In addition, radiologists can discriminate between normal and cancerous cases at a
rate well-above chance after viewing medical images for only a fraction of a second.5–8 These
findings demonstrate that radiologists can extract a remarkable amount of information about
a medical image in only a single glance. This phenomenon is referred to as “gist” or “global”
processing, and these enhanced perceptual abilities are considered to be a key distinguishing
characteristic between experts and novices in radiology.9–11
    Although radiologists would never view medical images for only a fraction of a second in
clinical practice—accuracy greatly improves with an unlimited viewing time12—these findings
provide important insight on how the development of perceptual expertise influences naturalistic
search behavior in radiology. Since the early 1970s, researchers have observed both qualitative
and quantitative differences in search patterns across radiologists with different levels of
experience.13 More experienced radiologists have lower image coverage, make fewer fixations,
have larger saccadic amplitude, and fixate on abnormalities more quickly (i.e., shorter time to
first fixation) than both naïve and novice observers.10 These findings suggest that experienced
radiologists are able to rely more on the global properties of the image for attentional guidance
than novices. These enhanced perceptual abilities appear to emerge before expert decision-
making abilities develop and without any explicit instruction on search strategy.13,14
    The differences in search behavior between experts and novices have led to a number of
medical image perception models, each of which posits a major role for global processing
in medical image interpretation.15–17 The most recent of these models proposes a two-component
visual search process with a non-selective (global) pathway and a selective (local) pathway that
operate in parallel.15 The non-selective pathway enables radiologists to rapidly extract the global
statistical properties of an image. Although the non-selective pathway helps guide attention to
perturbations in the image, detailed information about the abnormalities appears to be limited
relative to the selective pathway.6,7 In contrast, the selective pathway is limited in processing
capacity but provides fine-grained information that supports the recognition and localization
of abnormalities during a more foveal search. This two-pathway model originates in the visual
search literature,18 where evidence suggests that global summary statistics (e.g., mean size19 and
orientation20 of objects, scene category,21 or direction of motion22) can be extracted from scenes
in a single glance, whereas only a limited number of objects can be recognized simultaneously
due to limits of object-based attention.23 Global processing ability in radiology is thought to
involve the same cognitive mechanisms that allow laypeople to categorize familiar types of
scenes after brief image presentations.15,24,25 Through experience, radiologists develop a strong
mental representation of a normal medical image, resulting in greater sensitivity to the statistical
irregularities associated with an abnormal image. Thus more experienced radiologists are able to
rely more on the non-selective pathway than novices, resulting in a search that relies more on
information extracted from the periphery than an exhaustive search of the image.
    Despite the prominent role of global processing in all major medical image perception mod-
els, some caution is warranted on the generalizability of these findings. These models were
established using a relatively limited set of tasks: lung cancer detection using chest radiographs
and breast cancer detection in mammography. Meanwhile, advancements in medical imaging
technology have dramatically changed the size and complexity of medical images over the past
several decades. In particular, there has been a shift from two-dimensional (2D) medical images,
such as radiographs, to volumetric images, such as computed tomography (CT) scans, that better
preserve the underlying three-dimensional (3D) structure of the human body. Volumetric medical
images make up an increasingly large portion of radiologists’ workload,26,27 but it remains

Journal of Medical Imaging                      041208-2                          Jul∕Aug 2021   •   Vol. 8(4)
Williams et al.: Characteristics of expert search behavior in volumetric medical image interpretation
unclear how global processing ability might manifest in these images, where the global statistical
information is embedded in a navigable volume rather than being available to the observer in a
single glance.28
Recent studies have evaluated global processing in these new modalities by showing observ-
ers videos of volumetric medical images that rapidly transition through the image slices at a fixed
rate.29,30 In these studies, observers were able to reliably discriminate between normal and abnor-
mal cases after rapid image presentations and discrimination ability increased with observer
experience. Although these studies provide evidence that global processing may play a role
in volumetric image interpretation, we do not yet know how experience influences naturalistic
search behavior. If more experienced radiologists use a global search strategy, eye tracking
metrics associated with experience in 2D medical images, such as reduced image coverage and
shorter time to first fixation, should replicate in volumetric image interpretation tasks. However,
a recent review paper found that very few of these expertise-related differences in search
behavior have been examined in comparable tasks using volumetric images.28
In addition to differences in scan patterns, global processing ability might also change how
the observer scrolls through the depth of volumetric images. The global statistical properties of
volumetric images are embedded throughout multiple stacked slices. Therefore, forming a global
impression must involve some type of interaction with scrolling behavior. For example, an
observer might establish a global impression of the image by frequently scrolling through the
full depth of the image volume.31 In a recent longitudinal study, radiology residents spent less
time conducting “full runs” through the stack toward the end of their training, suggesting that
global impressions of the image are established more efficiently with experience.32 Similarly,
experts adapted to faster image presentation speeds more easily than novices, which might reflect
a shift toward a more global search strategy with experience.33 However, other studies have not
found any differences in performance between experts and novices at different image presen-
tation speeds, and very few studies have addressed this question while allowing radiologists to
freely scroll through the image stack as they would in clinical practice.34,35
Although global processing ability explains much of the variation between experts and novi-
ces in 2D image interpretation tasks, volumetric images introduce other aspects of search behav-
ior that may help explain individual differences in performance. For example, two different
strategies have been identified for searching through the depth of chest CT stacks during a lung
cancer detection task: scanning and drilling.36 Scanners search broadly across each slice of the
CT scan while slowly moving through the image slices. In contrast, drillers keep their eyes rel-
atively fixed in a single region of the lung at a time while rapidly scrolling through the depth of
the stack. When given a fixed time limit for each case (3 min), drillers detected more lung nod-
ules and had greater image coverage than scanners. These differences in performance are attrib-
uted to the fact that lung cancer nodules appear to flicker in and out of view when the observer
scrolls through the image slices, which helps the observer differentiate the nodules from other
structures, such as blood vessels, that persist throughout many slices of the image.37
It is not yet clear if the benefits of drilling generalize to tasks beyond lung cancer
detection.38,39 However, volumetric images clearly have unique properties that are important
to consider in models of perceptual expertise. For example, lung nodules may appear to flicker
in and out of view as the observer scrolls through the depth of a CT stack, which may mimic
abrupt motion onset cues that are thought to involuntarily capture attention.40 Although there
does not appear to be a standard practice for how to instruct radiologists to search through volu-
metric medical images, search strategy might develop organically with experience. For example,
a wider useful field of view (UFOV) might allow more experienced radiologists to take advan-
tage of motion onset cues elicited in the periphery when scrolling through depth. Alternatively,
search strategy might be passed on informally from mentor to mentee during training, or radi-
ologists may simply learn that one strategy is more effective than another and begin to adopt it
over time. In the original scanner/driller study, drillers reported reading more CT images in an
average week than scanners, but radiologists in each group had similar years of experience.36
Although this preliminary evidence that drillers had more regular experience with CT images is
promising, that study was not designed to look at experience-related effects on search strategy,
requiring more work to fully disentangle the effects of experience versus search strategy on task
performance.
Journal of Medical Imaging 041208-3 Jul∕Aug 2021 • Vol. 8(4)Williams et al.: Characteristics of expert search behavior in volumetric medical image interpretation
In sum, knowledge of how expert search behavior develops in volumetric image interpre-
tation is currently a substantial gap in the medical image perception literature. Here we sought to
help fill this gap by characterizing expert search behavior in a large sample of radiologists
(n ¼ 50) with a wide range of experience. In this study, radiologists evaluated chest CT scans
for lung cancer nodules. Because lung cancer detection is one of the most well-researched tasks
in the medical image perception literature, these findings can be more easily compared to the
previous research. The first aim of this study was to determine whether behavioral and eye
tracking measures associated with global processing ability in 2D images (accuracy, search time,
image coverage, saccadic amplitude, and time to first fixation) replicate in volumetric medical
images. Although the search behaviors associated with global processing ability in volumetric
images are not yet well-understood, the measures associated with global processing ability in 2D
images serve as a useful starting point for understanding expert search behavior in volumetric
tasks. In addition, we investigated how radiologists might establish a global impression of the
image using novel measures of scrolling behavior (number of depth passes and scrolling speed).
The second aim of this study was to determine how overall search strategy changes with expe-
rience. Specially, the goals were to: (1) replicate previous findings that drilling is a better strategy
than scanning for lung cancer detection and (2) disentangle the effects of experience from search
strategy. Together, these analyses help determine whether existing models of medical image
perception can account for expert search behavior in volumetric image interpretation, as well
as how they might be updated to account for scrolling behavior in volumetric images.
2 Method
A separate analysis of this dataset has been published previously.41
2.1 Participants
Fifty-six radiologists were recruited from the National Cancer Institute’s Perception Lab at a
Radiological Society for North America meeting; a hospital in Salt Lake City, UT, United
States; and a hospital in Sydney, NSW, Australia. In order to meet the minimum experience
level for eligibility in our study, participants were required to be in the first year of a radiology
residency program or higher. Five radiologists were excluded from the study prior to partici-
pation due to unsuccessful eye tracking calibration, and data from one radiologist were excluded
from the analysis due to equipment failure. The final sample consisted of 50 radiologists with
a wide range of experience: 25 radiology residents (4 first year, 5 second year, 7 third year, and
9 fourth year), 1 fellow, and 24 attending or practicing radiologists.
Participants at RSNA were entered into a raffle for a chance to win a $500 Amazon gift card,
participants in Salt Lake City were compensated with $50, and participants in Sydney volun-
teered their time. The study procedures were approved by the University of Utah Institutional
Review Board and the Macquarie University Human Research Ethics Committee. All partici-
pants provided informed written consent and were debriefed following the study.
2.2 Procedure
Participants first completed a questionnaire regarding their level of experience, area of expertise,
and demographic information. Next, observers performed a lung cancer detection task using
seven axial chest CT scans (one practice and six experimental) viewed in a typical lung window
and level. Half of the cases were normal (no lung nodules) and the other half were abnormal (at
least one lung nodule). Participants were instructed to identify nodules ≥3 mm in diameter by
clicking on the nodule’s center of mass with the mouse. Case completion time was unrestricted
and participants clicked on a box to move on to the next case. Participants could freely scroll
back and forth through the slices of the CT scan using the mouse scroll wheel. On average, there
were 148 slices in each CT stack. Following each case, radiologists rated the difficulty of the case
from 1 (not at all difficult) to 6 (very difficult).
Journal of Medical Imaging 041208-4 Jul∕Aug 2021 • Vol. 8(4)Williams et al.: Characteristics of expert search behavior in volumetric medical image interpretation
Participants were situated on a chinrest ∼89 cm from a 17-arc sec monitor. Eye movements
were recorded using an Eyelink 1000 Plus at a sampling rate of 1000 Hz. Participants underwent
a nine-point calibration procedure at the beginning of the study, and recalibrations were per-
formed throughout the task as necessary. To reconstruct eye movements through the volumetric
space, the observer’s current position in depth was co-registered with each eye tracking sample
and processed offline using custom MATLAB scripts.
2.3 Materials
The abnormal cases contained 9, 11, and 23 nodules, respectively. Five of the six experimental
cases were obtained from the Lung Image Database Consortium (LIDC) and the final case
was obtained from clinical practice at the University of Utah School of Medicine.42 For the
LIDC cases, ground truth was established by four thoracic radiologists who independently
marked nodule locations prior to reviewing the anonymized marks of the other three radiol-
ogists and rendering a final decision. For the Utah case, author W.A. marked the nodule
locations.
2.4 Analysis Plan
The study’s sample size, data exclusion criteria, and primary predictions and analyses were pre-
registered prior to data collection.43 There are some preregistered analyses that have not yet been
conducted as they are beyond the scope of this particular paper (e.g., similarity score and pupill-
ometry). As preregistered, years of experience since graduating medical school and the average
number of chest CTs evaluated each week were entered into a multiple linear regression for each
of the dependent measures. In addition, in preregistered analyses, image coverage, search strat-
egy (i.e., scanning/drilling), and scrolling speed were regressed onto nodule detection rate to
determine which search behaviors predicted better performance. To control for the effects of
experience, years of experience and the number of chest CTs read per week were added as pre-
dictors in each regression model. The remaining regression analyses were exploratory and not
included in the preregistration. We also added a quartile comparison where we compared the
bottom and top quartile of each quantitative scanner/driller measure using a between-participants
t-test to determine how these methods compared to the subjective method of classifying search
strategy.
In addition to the preregistered analyses, Bayes factors were calculated to assist in the inter-
pretation of null results and to help identify analyses that might have been underpowered. For the
linear regressions, we used a JZS prior with the default scale (r ¼ 0.35). A BF10 > 3 indicates
sufficient evidence for the alternative relative to the null hypothesis, a BF10 < 1∕3 indicates suf-
ficient evidence for the null relative to the alternative hypothesis, and a BF10 between these two
values indicates that more evidence is needed for a strong conclusion.44 For each multiple linear
regression model, Bayes factors are reported for each predictor variable individually as well as
the full model.
3 Results
3.1 Observer Experience
Participants (19 females and 31 males) reported reading 41 (SD ¼ 52, range ¼ ½0;250) chest CT
scans in an average week and had an average of 12 (SD ¼ 13, range ¼ ½0.5; 42) years of radi-
ology experience since graduating medical school. On average, radiologists were 41 (SD ¼ 13,
range ¼ ½27;68) years old. Of these radiologists, 27 (54%) reported they were American Board
of Radiology certified or their country’s equivalent. Twenty (40%) radiologists reported exper-
tise in thoracic imaging. The relationship between experience and each of the dependent mea-
sures of search behavior is shown in Table 1.
Journal of Medical Imaging 041208-5 Jul∕Aug 2021 • Vol. 8(4)Williams et al.: Characteristics of expert search behavior in volumetric medical image interpretation
Table 1 Results of multiple linear regressions for experience measures.
Chest
Years CTs Model
Measure Mean SD p value p value β0 β1 β2 p value R 2 BF10
Sensitivity 58% 19% 0.56 0.26 57 −0.001 0.001 0.40 0.04 0.24
False alarms 3.4 2.4 0.21 0.17 3.44 −0.04 0.009 0.14 0.08 0.55
Search time 137.9 s 61.7 s 0.23 0.89 149.1 −0.87 −0.02 0.49 0.03 0.20
Coverage 38% 13% 0.17 0.54 42 −0.002 −0.0002 0.36 0.04 0.26
Saccadic amplitude 2.15 deg 0.77 deg 0.06 0.26 1.85 0.02 0.002 0.12 0.09 0.61
Time to first fixation 567 ms 596 ms 0.24 0.61 501.4 8.25 −0.87 0.40 0.04 0.24
Depth passes 2.3 1.7 0.07 0.22 3.03 −0.04 −0.006 0.11 0.09 0.65
Scrolling speed 6 2 0.004 0.18 7.17 −0.07 −0.007 0.01 0.18 4.59
Refixation rate 39% 11% 0.047 0.27 44 −0.003 −0.0003 0.10 0.10 0.73
Nodule dwell time 3065.8 ms 1531.7 ms 0.60 0.38 3136 9.33 −3.84 0.55 0.03 0.19
Eye movement index 0.41 0.24 0.06 0.32 0.32 0.005 0.001 0.13 0.29 0.60
Change X Y ∕Z score 63.74 64.31 0.02 0.15 31.26 1.79 0.26 0.03 0.14 2.04
3.2 Task Performance
3.2.1 Accuracy
On average, radiologists reported 58% (SD ¼ 19%) of the lung cancer nodules. Contrary to our
prediction, neither years of experience, Fð1;46Þ ¼ 0.34, p ¼ 0.56, BF10 ¼ 0.36, nor the number
of chest CTs read per week, Fð1;46Þ ¼ 1.32, p ¼ 0.26, BF10 ¼ 0.54, predicted nodule detection
rate, R2 ¼ 0.04, BF10 ¼ 0.24 [Fig. 1(a) and Table 1]. Next, we calculated false alarms as the
average number of clicks per case that were not within 50 pixels of a true nodule. The average
number of false alarms per case was 3.4 (SD ¼ 2.4) nodules. The number of false alarms was not
predicted by years of experience, Fð1;46Þ ¼ 1.62, p ¼ 0.21, BF10 ¼ 0.68, or the number of
chest CTs read per week, Fð1;46Þ ¼ 1.92, p ¼ 0.17, BF10 ¼ 0.77; R2 ¼ 0.08, BF10 ¼ 0.55
[Fig. 1(b) and Table 1]. However, the Bayes factors suggest more evidence is needed to make
a conclusion about whether false alarms differ across experience levels.
3.2.2 Error classification
Using the eye tracking data, miss errors were classified into recognition, search, or decision
errors by calculating the cumulative dwell time on the lung nodules.45 Recognition errors were
defined as unreported nodules fixated forWilliams et al.: Characteristics of expert search behavior in volumetric medical image interpretation Fig. 1 Relationship between experience and task performance. There was no evidence for a sig- nificant relationship between: (a) nodule detection rate and years of experience or the number of chest CTs read per week; (b) false alarms and years of experience or the number of chest CTs read per week; and (c) search time and years of experience or the number of chest CTs read per week. Dashed lines represent the 95% CI here and throughout the manuscript. decision, 30% search, and 25% recognition errors. In this task, there were 51% recognition errors, 39% search errors, and 10% decision errors. One possible reason for the shift from deci- sion to recognition errors in this dataset is that nodules and normal structures (e.g., blood vessels) might be less confusable with each other in volumetric medical images. However, this proposal will need to be tested in future work by directly comparing 2D and volumetric image search when controlling for other characteristics (e.g., abnormality size and location and case diffi- culty). Although we predicted the number of search errors would differ with experience, years of experience and the number of chest CTs read per week did not predict a greater proportion of any error type, all p values > 0.05 and all BF10 < 0.33. 3.2.3 Search time On average, radiologists spent 137.9 (SD ¼ 61.7) s evaluating each case. Abnormal trials (M ¼ 163.3 s, SD ¼ 72.2 s) were searched significantly longer than normal trials (M ¼ 112.6 s, SD ¼ 61.5 s), tð49Þ ¼ 6.81, p < 0.001, BF10 ¼ 975782.9. In 2D images, search time would be expected to decrease with experience due to an increased reliance on the global proper- ties of the image. However, in this volumetric image interpretation task, search time did not decrease with years of experience, Fð1;46Þ ¼ 1.46, p ¼ 0.23, BF10 ¼ 0.52, nor the number of chest CTs read per week, Fð1;46Þ ¼ 0.02, p ¼ 0.89, BF10 ¼ 0.29; R2 ¼ 0.03, BF10 ¼ 0.20 Journal of Medical Imaging 041208-7 Jul∕Aug 2021 • Vol. 8(4)
Williams et al.: Characteristics of expert search behavior in volumetric medical image interpretation

Fig. 2 Predictors of task performance (controlling for experience using multiple linear regression).
Higher nodule detection rates were predicted by (a) longer search times, (b) greater image cover-
age, and (c) more depth passes.

          Table 2 Predictors of lung nodule detection rate (controlling for experience
          using multiple linear regression).

          Measure                           β            p value            R2            BF10

          Search time                     0.002
Williams et al.: Characteristics of expert search behavior in volumetric medical image interpretation Fig. 3 Relationship between experience and search behavior. There was no evidence for a sig- nificant relationship between (a) image coverage and years of experience or the number of chest CTs read per week; (b) saccadic amplitude and years of experience or the number of chest CTs read per week; and (c) time to first fixation and years of experience or the number of chest CTs read per week. chest CTs evaluated each week, Fð1;46Þ ¼ 0.39, p ¼ 0.54, BF10 ¼ 0.31; R2 ¼ 0.04, BF10 ¼ 0.26 [Fig. 3(a) and Table 1]. Controlling for experience using multiple linear regression, search- ing the images more thoroughly strongly predicted increased nodule detection rate, Fð1;45Þ ¼ 18.57, p < 0.001, R2 ¼ 0.32, BF10 ¼ 252.06 [Fig. 2(b) and Table 2]. 3.3.2 Saccadic amplitude A larger saccadic amplitude (i.e., the average distance between consecutive fixations expressed in degrees of visual angle) is thought to reflect a more global search strategy and was expected to increase with observer experience.10 On average, saccadic amplitude was 2.15 deg (SD ¼ 0.77 deg). Contrary to our prediction, saccadic amplitude did not significantly increase with years of experience, Fð1;46Þ ¼ 3.61, p ¼ 0.06, BF10 ¼ 0.99, nor the average number of chest CTs read per week, Fð1;46Þ ¼ 1.29, p ¼ 0.26, BF10 ¼ 0.39; R2 ¼ 0.09, BF10 ¼ 0.61 [Fig. 3(b) and Table 1]. However, the Bayes factors suggest more evidence is needed before a strong conclusion can be made about the relationship between experience and saccadic ampli- tude. Controlling for experience using multiple linear regression, having a smaller saccadic Journal of Medical Imaging 041208-9 Jul∕Aug 2021 • Vol. 8(4)
Williams et al.: Characteristics of expert search behavior in volumetric medical image interpretation

amplitude predicted a higher nodule detection rate, Fð1;45Þ ¼ 5.45, p ¼ 0.02, R2 ¼ 0.14,
BF10 ¼ 3.39 (Table 2).

3.3.3 Time to first fixation
Time to first fixation on a detected abnormality in 2D medical images is thought to reflect a more
global search strategy and typically decreases with experience.10 To adapt this measure to volu-
metric images, we calculated time to first fixation relative to the moment the abnormality first
became visible when scrolling through the slices.50 If the nodule was not detected the first time,
it became visible (i.e., the radiologist moved to another position in depth without clicking on the
nodule), time to first fixation was calculated relative to the moment the abnormality first reap-
peared prior to detection.
    On average, radiologists took 567 (SD ¼ 596) milliseconds to fixate on the nodules from the
moment they first became visible. Contrary to our prediction, time to first fixation did not
decrease with years of experience, Fð1;46Þ ¼ 1.41, p ¼ 0.24, BF10 ¼ 0.55, nor the number
of chest CTs read per week, Fð1;46Þ ¼ 0.27, p ¼ 0.61, BF10 ¼ 0.35; R2 ¼ 0.04, BF10 ¼
0.24 [Fig. 3(c) and Table 1]. Upon visual inspection [Fig. 3(c)], it became apparent that one
participant was an outlier (>3 SDs from the mean). However, the outcome of the multiple linear
regression does not change if this outlier is removed, both p values > 0.05, all BFs10 < 0.55.5

3.3.4 Refixation rate
Refixation rate was calculated as the proportion of total fixations that were within UFOV
(2.6 deg) of a previous fixation (i.e., proportion of fixations that were refixations).51 We predicted
that more experienced radiologists would use more systematic search strategies to navigate
through the image, resulting in fewer refixations.
    On average, 39% (SD ¼ 11%) of fixations were refixations. In partial support for our hypoth-
esis, refixation rate decreased with years of experience, Fð1;46Þ ¼ 4.16, p ¼ 0.047, BF10 ¼
1.21, but not the number of chest CTs read per week, Fð1;46Þ ¼ 1.24, p ¼ 0.27, BF10 ¼
0.37; R2 ¼ 0.10, BF10 ¼ 0.73. However, the Bayes factors indicate that more evidence is needed
to make a strong conclusion about the relationship between refixations and observer experience.
Controlling for experience using multiple linear regression, higher refixation rates predicted
better nodule detection performance, Fð1;45Þ ¼ 5.67, p ¼ 0.02; R2 ¼ 0.15, BF10 ¼ 3.67.
This result suggests that observers with larger refixation rates may benefit from additional oppor-
tunities to detect nodules that might have been missed during the first opportunity for detection.
Consistent with this proposal, refixation rate was strongly correlated with search time,
Fð1;48Þ ¼ 62, p < 0.001, r2 ¼ 0.56, BF10 ¼ 3.57 × 10⁷ , and higher refixation rates were no
longer significantly associated with better performance when controlling for search time,
Fð1;47Þ ¼ 1.04, p ¼ 0.31; R2 ¼ 0.30, BF10 ¼ 0.41.

3.4 Scrolling Behavior

3.4.1 Depth passes
The number of passes through the depth of the CT scan has been proposed as a metric of global
processing ability in volumetric images.31 If experienced observers rely more on a global search
strategy, they may make more passes through the depth of the image in order to establish a global
impression of the image. Alternatively, if more experienced observers are able to extract the
global properties of the image more easily, they might be able to maintain high-performance
despite making fewer passes through the depth of the image. The number of passes through
depth was defined as the number of times the radiologist scrolled through at least 80% of the
depth of the full stack.
    On average, radiologists made 2 (SD ¼ 2) depth passes. Contrary to our prediction, the num-
ber of passes through depth was not significantly related to years of experience, Fð1;46Þ ¼ 3.57,
p ¼ 0.07, BF10 ¼ 0.95, nor the number of chest CTs read per week, Fð1;46Þ ¼ 1.53, p ¼ 0.22,

Journal of Medical Imaging                      041208-10                         Jul∕Aug 2021   •   Vol. 8(4)
Williams et al.: Characteristics of expert search behavior in volumetric medical image interpretation Fig. 4 Relationship between experience and scrolling behavior. (a) There was no significant rela- tionship between the mean number of depth passes per case and years of experience or the number of chest CTs read per week. Depth passes are defined as the number of times the radi- ologist scrolled through at least 80% of the CT scan. (b) Scrolling speed (slices per second) decreased with years of experience but did not differ with the number of chest CTs read per week. BF10 ¼ 0.42; R2 ¼ 0.09, BF10 ¼ 0.65 [Fig. 4(a) and Table 1]. However, Bayes factors suggest that more evidence is needed before making a strong conclusion about the relationship between the number of passes through depth and experience. Controlling for experience using multiple linear regression, making more passes through depth predicted increased nodule detection rate, Fð1;45Þ ¼ 7.51, p ¼ 0.009; R2 ¼ 0.18, BF10 ¼ 6.98 [Fig. 2(c) and Table 2]. 3.4.2 Scrolling speed On average, scrolling speed was 6 (SD ¼ 2) slices per second. We predicted that more expe- rienced observers would scroll through the stack more quickly than less experienced radiolog- ists. However, contrary to this prediction, scrolling speed significantly decreased with years of experience, Fð1;46Þ ¼ 9.14, p ¼ 0.004, BF10 ¼ 6.69 but not the number of chest CTs read per week, Fð1;46Þ ¼ 1.82, p ¼ 0.18, BF10 ¼ 0.39; R2 ¼ 0.18, BF10 ¼ 4.59 [Fig. 4(b) and Table 1]. Controlling for experience using multiple linear regression, scrolling speed did not predict differences in nodule detection rate, Fð1;45Þ ¼ 0.02, p ¼ 0.90, R2 < 0.001, BF10 ¼ 0.46 (Table 2). 3.5 Scanners and Drillers Radiologists were first tentatively divided into scanners and drillers by analyzing the depth by time plots for each participant following the subjective method used in the previous studies [Fig. 5(a)].36,39 First, the observer’s position in depth was plotted on the y axis and time was plotted on the x axis. Next, each quadrant of the image was assigned a different color. At each time point, the observer’s eye position on the 2D plane was reduced to a single dimension by plotting each point in the color assigned to that quadrant. Using the depth by time plots, the lead author then made a subjective decision about whether each radiologist was a driller or a scanner according to the descriptions of search strategy outlined by Drew et al. (2013). Qualitatively, Journal of Medical Imaging 041208-11 Jul∕Aug 2021 • Vol. 8(4)
Williams et al.: Characteristics of expert search behavior in volumetric medical image interpretation

Fig. 5 Different methods of categorizing scanners and drillers: (a) depth by time plots; (b) eye
movement index = normalized saccadic amplitude + normalized number of fixation clusters per
second; and (c) change in X Y ∕Z = summed scan path distance/change in Z averaged over 5-s
intervals. The color coding in (b) and (c) reflects the groups determined using the subjective
categorization method described in (a). Dashed lines represent the dividing point for the lower
and upper quartiles.

driller plots are characterized by spending prolonged time in one region of the lung (typically one
quadrant or lobe) at a time while rapidly scrolling through the slices. In contrast, scanners search
broadly across the 2D plane while slowly moving through the depth of the CT scan [Fig. 5(a)].
Although depth by time plots can reveal qualitative differences in search strategy, it is unclear
how to best capture these differences in search behavior quantitatively. Here we compared two
quantitative measures that have been used in the previous research: the eye-movement index36,39
and the change in XY∕Z score.38
    In the original scanner/driller study, the authors’ subjective categorizations of search strategy
were then tested using the eye movement index.36 On average, scanners should have larger sac-
cadic amplitude and make fewer consecutive fixations in the same quadrant of the lung (i.e.,
fixation clusters) than drillers. Therefore, if mean saccadic amplitude is plotted on the x axis
and the average number of fixation clusters per second is plotted on the y axis, scanners tend
to cluster in the top-right of the figure [Fig. 5(b)]. These measures can then be combined into
a single metric by normalizing each score from 0 to 1 and adding the two measures
together [Fig. 5(b)].
    The eye movement index can help distinguish between scanners and drillers,36 but this metric
does not directly take the observer’s movement through depth into account. If drilling is asso-
ciated with better performance because it enables radiologists to take advantage of abrupt motion
onset cues while scrolling through depth, this may be an important aspect of search behavior to

Journal of Medical Imaging                      041208-12                         Jul∕Aug 2021   •   Vol. 8(4)
Williams et al.: Characteristics of expert search behavior in volumetric medical image interpretation
quantify. To account for this possibility, scanning and drilling behavior has also been concep-
tualized as the [summed change in xy (i.e., scan path length)/the maximum change in z] averaged
across 5-s intervals.38 Within a set time period, drillers make more movements in Z than
in XY compared to scanners, resulting in smaller change in XY∕Z scores than scanners
[Fig. 5(c)]. Another promising approach is to classify scanners and drillers based on the number
of direction changes that occur during each case.52 However, this measure requires a fixed time
limit for each CT scan, so we were not able to use this categorization method for the current
dataset.
Both EMI and change in XY∕Z scores have been used in the previous research, but there is no
consensus on which best captures the qualitative differences in search strategy observed in depth
by time plots. Although there is some overlap in these measures, an observer can still score
relatively high on one and relatively low on the other, suggesting they tap into distinct aspects
of search behavior [Fig. 5).36,38 Furthermore, it is unclear if search strategy is dichotomous (e.g.,
scanners versus drillers), or whether it is more appropriate to consider continuous changes in
these measures (e.g., more drilling versus less drilling behavior). Here we used the eye move-
ment index and change in XY∕Z scores as continuous predictors for each of the dependent var-
iables using linear regression. In addition, we also divided radiologists into groups based on
quartile rankings and compared these results to the subjective categorization method described
above. The subjective categorization method and the change in XY∕Z score regression analyses
were preregistered,43 but the eye movement index and quartiles analyses were exploratory.
3.5.1 Subjective categorization method
Using the subjective categorization method [Fig. 5(a)], 30% of radiologists were categorized as
scanners and 70% were categorized as drillers. We first present the results using this separation
and then examine the degree to which the different objective methods of quantifying search
strategy impact the results.
Controlling for experience using multiple linear regression, drillers (M ¼ 65% and
SD ¼ 14%) detected more of the lung nodules than scanners (M ¼ 44% and SD ¼ 20%),
Fð1;45Þ ¼ 16.41, p < 0.001, BF10 ¼ 129.67 [Fig. 6(a)]. Drillers (M ¼ 4.1, SD ¼ 2.4) also
made more false alarms per case than scanners (M ¼ 1.7, SD ¼ 1.4), Fð1;45Þ ¼ 12.28,
p ¼ 0.001, BF10 ¼ 35.50, but it is possible that some true nodules may be unmarked in
the LIDC database (see also Ref. 15) so we do not want to over-emphasize false alarms.
Scanners (M ¼ 48%, SD ¼ 20%) made significantly more search errors than drillers
(M ¼ 35%, SD ¼ 15%), tð48Þ ¼ 2.67, p ¼ 0.01, BF10 ¼ 4.67, whereas drillers (M ¼ 54%,
SD ¼ 12%) made significantly more recognition errors than scanners (M ¼ 43%,
SD ¼ 17%), tð48Þ ¼ 2.73, p ¼ 0.009, BF10 ¼ 5.28. There were no significant differences
between scanners (M ¼ 8%, SD ¼ 7%) and drillers (M ¼ 11%, SD ¼ 8%) on decision errors,
tð48Þ ¼ 0.83, p ¼ 0.41, BF10 ¼ 0.37.
These large differences in hit rate between the search strategies were not associated with
differences in years of experience, tð48Þ ¼ 1.16, p ¼ 0.25, BF10 ¼ 0.49, nor the number of
chest CTs read per week, tð48Þ ¼ 0.14, p ¼ 0.89, BF10 ¼ 0.29 [Fig. 6(a)]. What did seem
to drive the improved hit rate was that drillers spent more time evaluating each case,
tð48Þ ¼ 3.23, p ¼ 0.002, BF10 ¼ 15.71, searched the images more thoroughly, tð48Þ ¼
4.29, p < 0.001, BF10 ¼ 252.04, and made more passes through depth, tð48Þ ¼ 2.23, p ¼
0.03, BF10 ¼ 2.06, than scanners.
Using the subjective categorization, we then examined the eye movement index and change
in XY∕Z scores for the two groups. On average, scanners (M ¼ 0.68, SD ¼ 0.19) had a larger
eye movement index than drillers (M ¼ 0.30, SD ¼ 0.15), tð48Þ ¼ 7.55, p < 0.001, BF10 ¼
6.64 × 10⁶ ; and scanners (M ¼ 118.9, SD ¼ 82.6) had a larger change in XY∕Z score than
drillers (M ¼ 40.1, SD ¼ 35.1), tð48Þ ¼ 4.77, p < 0.001, BF10 ¼ 956.03.
We then examined the effect of using quantitative categorizations, repeating the above analy-
ses using EMI and XY∕Z quantitative measures as: (1) continuous predictors of performance and
(2) to classify radiologists into distinct groups of scanners and drillers using the top and bottom
quartiles, respectively.
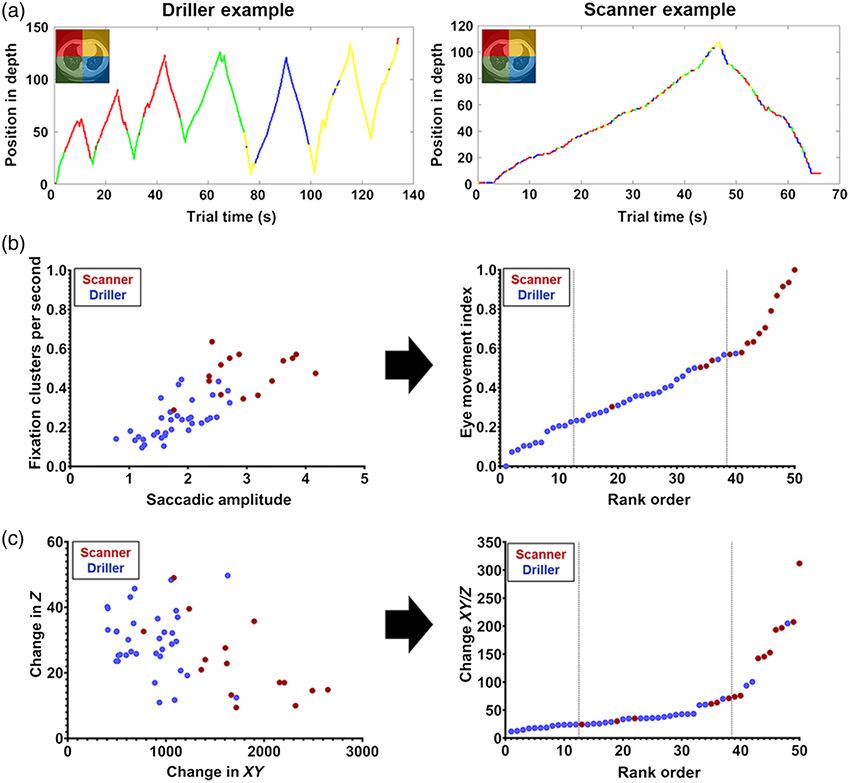
Journal of Medical Imaging 041208-13 Jul∕Aug 2021 • Vol. 8(4)Williams et al.: Characteristics of expert search behavior in volumetric medical image interpretation Fig. 6 The relationship between search strategy, experience, and task performance using differ- ent methods of classifying search strategy. (a) Subjective categorization using depth by time plots; (b) categorization using the eye movement index by quartiles; (c) categorization using the change in X Y ∕Z scores by quartiles. The solid line indicates the mean value, dots represent the individual data points, and error bars represent standard error of the mean. 3.5.2 Eye movement index First, we used the eye movement index [Fig. 5(b)] as a continuous predictor of performance in a linear regression analysis. Controlling for experience using multiple linear regression, having a smaller eye movement index (drilling) was associated with better nodule-detection rates than having a large eye movement index (scanning), Fð1;45Þ ¼ 6.85, p ¼ 0.01, R2 ¼ 0.17, BF10 ¼ 5.54 [Figs. 7(a) and Table 2]. Next, we sought to determine whether these measures could be used to establish an objective classification system by dividing radiologists into scanners and drillers using the top and bottom quartiles, respectively. Using this method, 12/12 radiologists in the bottom quartile matched our subjective “drilling” classification, and 11/12 radiologists in the top quartile matched our “scanning” classification [Fig. 5(b)]. If we then look at the performance of these two quartile groups on the nodule detection, the drillers (bottom quartile) detected 70% (SD ¼ 10%) of the nodules, on average, whereas the scanners (top quartile) detected only 50% (SD ¼ 20%) of the nodules, tð22Þ ¼ 3.13, p ¼ 0.005, BF10 ¼ 8.84 [Fig. 6(b)]. The distribution of error type follows the same pattern as the subjectively categorized results: scanners (M ¼ 47%, SD ¼ 20%) made significantly more search errors than drillers (M ¼ 30%, SD ¼ 12%), tð22Þ ¼ 2.56, p ¼ 0.02, BF10 ¼ 3.37, whereas drillers (M ¼ 57%, SD ¼ 8%) made significantly more recognition errors than scanners (M ¼ 44%, SD ¼ 18%), tð22Þ ¼ 2.26, p ¼ 0.03, BF10 ¼ 2.16. There were no significant differences between scanners (M ¼ 14%, SD ¼ 7%) and drillers (M ¼ 9%, SD ¼ 8%) on decision errors, tð22Þ ¼ 1.59, p ¼ 0.13, BF10 ¼ 0.92. Journal of Medical Imaging 041208-14 Jul∕Aug 2021 • Vol. 8(4)
Williams et al.: Characteristics of expert search behavior in volumetric medical image interpretation

Fig. 7 The relationship between search strategy, experience, and task performance using differ-
ent methods of classifying search strategy. (a) Eye movement index: lower scores reflect more
drilling behavior. (b) Change in X Y ∕Z scores: lower scores indicate more drilling behavior.

    Neither years of experience, Fð1;46Þ ¼ 3.79, p ¼ 0.06, BF10 ¼ 1.09 (although note the
insufficient evidence here), nor the number of chest CTs per week, Fð1;46Þ ¼ 1.02,
p ¼ 0.32, BF10 ¼ 0.35, predicted the eye movement index, R2 ¼ 0.29, BF10 ¼ 0.60
[Fig. 7(a) and Table 1]. The bottom (M ¼ 7, SD ¼ 9) and top (M ¼ 17, SD ¼ 15) quartiles
did not significantly differ in years of experience, tð22Þ ¼ 1.89, p ¼ 0.07, BF10 ¼ 1.30
[Fig. 6(b)], but the Bayes factor indicates that more evidence is needed to make a strong con-
clusion. Similarly, the bottom (M ¼ 34, SD ¼ 34) and top (M ¼ 44, SD ¼ 43) quartiles did
not differ in the number of chest CTs read per week, tð22Þ ¼ 0.68, p ¼ 0.50, BF10 ¼
0.44 [Fig. 6(b)].
    Using the eye movement index as a continuous measure, we found that drilling was asso-
ciated with longer search times, Fð1;48Þ ¼ 11.41, p ¼ 0.002, BF10 ¼ 22.79, greater image cov-
erage, Fð1;48Þ ¼ 12.94, p ¼ 0.001, BF10 ¼ 39.29, and more depth passes, Fð1;48Þ ¼ 7.42,
p ¼ 0.009, BF10 ¼ 5.27. As seen in the subjective classification method, the quartile analysis
revealed that drillers (bottom quartile) spent more time evaluating each case, tð22Þ ¼ 3.2,
p ¼ 0.004, BF10 ¼ 9.93, searched the images more thoroughly, tð22Þ ¼ 3.47, p ¼ 0.002,
BF10 ¼ 16.48, and made more passes through depth, tð22Þ ¼ 2.90, p ¼ 0.008, BF10 ¼ 5.96,
than scanners [top quartile, Fig. 8(a)].

3.5.3 Change in XY/Z score
Next, we used the change in XY∕Z scores as our key variable [Fig. 5(c)].38 Controlling for expe-
rience using multiple linear regression, change in XY∕Z scores did not significantly predict nod-
ule detection rate, Fð1;45Þ ¼ 0.09, p ¼ 0.77, R2 ¼ 0.04, BF10 ¼ 0.47 [Fig. 7(b) and Table 2].
Using the quartile method, 12/12 radiologists in the bottom quartile matched our subjective
“drilling” classification, and 9/12 radiologists in the top quartile matched our “scanning”
classification [Fig. 5(c)]. Drillers detected 65% (SD ¼ 13%) of the nodules, whereas scanners
detected 56% (SD ¼ 20%) of the nodules. These differences were not statistically significant,
tð22Þ ¼ 1.39, p ¼ 0.18, BF10 ¼ 0.74 [Fig. 6(c)], but the Bayes factors indicate there is insuf-
ficient evidence to interpret these null findings. For the change in XY∕Z score, there were
no significant differences in the type of miss errors between scanners and drillers, all
p values > 0.05.
    Radiologists with a larger change in XY∕ZXY∕Z score (scanners) tended to have more years
of experience, Fð1;46Þ ¼ 6.4, p ¼ 0.02, BF10 ¼ 2.42, but there was no relationship between
change in XY∕Z score and the number of chest CTs read per week, Fð1;46Þ ¼ 2.20,

Journal of Medical Imaging                      041208-15                         Jul∕Aug 2021   •   Vol. 8(4)
Williams et al.: Characteristics of expert search behavior in volumetric medical image interpretation Fig. 8 Scanner and driller search behavior. (a) Eye movement index: lower scores reflect greater drilling behavior. (b) Change in X Y ∕Z score: lower scores reflect greater drilling behavior. p ¼ 0.15, BF10 ¼ 0.46; R2 ¼ 0.14, BF10 ¼ 2.04 [Fig. 7(b) and Table 1]. Drillers (M ¼ 7, SD ¼ 9) had fewer years of experience than scanners (M ¼ 21, SD ¼ 14), tð22Þ ¼ 2.79, p ¼ 0.01, BF10 ¼ 4.95, but the bottom (M ¼ 48, SD ¼ 58) and top (M ¼ 49, SD ¼ 47) quartiles did not differ in the number of chest CTs read per week, tð22Þ ¼ 0.06, p ¼ 0.95, BF10 ¼ 0.37 [Fig. 6(c)]. Using change in XY∕Z scores as a continuous measure, drilling was associated with greater image coverage, Fð1;48Þ ¼ 6.52, p ¼ 0.01, BF10 ¼ 3.74, and more depth passes, Fð1;48Þ ¼ 10.10, p ¼ 0.003, BF10 ¼ 14.18 but was not significantly related to search time, Fð1;48Þ ¼ 1.67, p ¼ 0.20, BF10 ¼ 0.56. Similarly, in the quartile analysis, drillers had longer search times, tð22Þ ¼ 2.11, p ¼ 0.046, BF10 ¼ 1.74, greater image coverage, tð22Þ ¼ 2.49, p ¼ 0.02, BF10 ¼ 3.05, and more depth passes, tð22Þ ¼ 3.87, p < 0.001, BF10 ¼ 35.24, than scanners [Fig. 8(b)]. 3.5.4 Results summary Across the three methods of classifying search behavior, our results largely replicate previous findings that drilling is a superior strategy for lung nodule detection than scanning when con- trolling for the effects of experience. Both the subjective categorization method and the eye movement index revealed greater nodule detection for drilling than scanning. The change in XY∕Z score did not significantly predict performance; however, the Bayes factors indicate that these analyses are not interpretable with this sample size. Critically, this study expands on the previous research by examining whether differences in experience level between the two groups can account for differences in performance. On average, drillers tended to have less experience than scanners [Fig. 7(b)], which is inconsistent with the idea that radiologists learn to adopt better search strategies with experience. However, this data should not be interpreted as evidence that more experienced observers are worse at the task overall. We do not see any evidence for a negative relationship between experience and detection rate in our dataset [Fig. 1(a)], and there are many additional factors that may explain variation in task performance beyond search strat- egy. Rather, these results demonstrate that drilling behavior predicts better performance above and beyond the effects of experience. Drillers may have performed better on the task because they engaged in a more systematic search of the images: regardless of how we classified the radiologists, drilling was associated with greater image coverage, making more passes through depth, and spending more time on each case. Journal of Medical Imaging 041208-16 Jul∕Aug 2021 • Vol. 8(4)
Williams et al.: Characteristics of expert search behavior in volumetric medical image interpretation

4 Discussion
In this study, we examined how naturalistic search behavior differed across radiologists with
varying levels of experience during lung cancer detection with volumetric images. This research
makes two primary contributions to the literature. First, contrary to predictions based on findings
from studies using 2D medical images, we did not find evidence in support of global processing-
related changes in search behavior with experience—and, importantly, we demonstrate evidence
for the null using Bayes analyses. Null results were consistent across a number of measures that
have been closely associated with expertise in 2D medical image interpretation (search time,
image coverage, saccadic amplitude, and time to first fixation) as well as novel measures of
scrolling behavior (depth passes and scrolling speed) that have been proposed as potential indi-
ces of expertise in volumetric image interpretation.31,33 Second, we identified several strong pre-
dictors of individual differences in task performance for lung cancer detection. Although experts
tend to have better performance than novices in 2D interpretation tasks despite lower image
coverage, we found that performance in our volumetric task was closely related to how many
opportunities there were for abnormality detection. Specifically, better performance was pre-
dicted by spending more time on each case, searching the images more thoroughly, and making
more passes through the depth of the CT scan. Observers who adopted a drilling search strategy
detected more of the lung cancer nodules than scanners, which may be due to differences in how
systematically the images were searched. Critically, these performance differences do not appear
to be driven by differences in experience level. Drilling remained a significant predictor of the
performance when controlling for differences in experience, and there was limited evidence that
drillers actually had fewer years of experience than scanners. Together, these findings have
important implications for current models of perceptual expertise and may provide insight
on how to train radiologists to evaluate volumetric images.
    Although this research suggests a smaller role for global processing in volumetric image
interpretation than in 2D images, these results need to be reconciled with recent reports that
radiologists can reliably classify volumetric images as normal or abnormal after brief video
presentations.29,30 The current study used lung cancer detection rather than the breast cancer
and prostate cancer detection tasks used in the previous studies, suggesting differences in stimu-
lus characteristics (e.g., abnormality size) might account for the different findings. In addition,
the type of signal that supports abnormality detection in gist processing studies could be quite
different in volumetric images, where a global “snapshot” of the image is not present. Instead, the
abrupt motion onset cues elicited by abnormalities in the periphery as the videos transition
through depth might be the key driver for performance, rather than sensitivity to global scene
statistics per se. In future research, it may be fruitful to determine how different abnormality
characteristics, such as their ability to elicit motion onset cues, relate to performance in gist
processing studies. In previous flash-viewing studies, radiologists were able to detect cancerous
“signals” in the breast opposite to the lesion, as well as images taken years before the develop-
ment of a detectable mass.53,54 If the presence of a mass is also unnecessary for gist processing in
volumetric images, it would suggest that the outcome of previous gist processing studies did not
depend solely on motion onset cues that may have been generated by the abnormalities when the
videos transitioned through depth.
    A clearly plausible explanation for global processing playing a smaller role in volumetric
rather than 2D image interpretation is that the global statistical properties of the image cannot
be extracted in a single glance and must instead be acquired as the observer scrolls through the
depth of the stack. If the gist of the image is not readily available, it might then become more
important to rely on a more systematic, foveal search through the image, which is a characteristic
of drilling behavior. Consistent with this interpretation, many of our current results show the
opposite relationship between scan patterns and task performance than would be expected under
global processing models. Specifically, nodule detection rate was strongly predicted by how
thoroughly the images were searched, suggesting less information can be extracted from the
periphery during volumetric image interpretation. Notably, this is consistent with the recent work
demonstrating that UFOV is lower for lung cancer detection in volumetric medical images than
UFOV estimates established for the same task using chest radiographs.47

Journal of Medical Imaging                      041208-17                         Jul∕Aug 2021   •   Vol. 8(4)
You can also read