Israel's Life Sciences Industry IATI 2015 Report - Israel Advanced Technology Industries
←
→
Page content transcription
If your browser does not render page correctly, please read the page content below
Israel Advanced
      Technology Industries

Israel’s Life Sciences Industry
       IATI 2015 Report
Israel Advanced
            Technology Industries

     ISRAEL'S LARGEST
 UMBRELLA ORGANIZATION
     for the High-Tech
 and Life Science Industries

                iati.co.il
For more information about IATI please contact:
T: +972 (0)73-713-6313 | E: iati@iati.co.il |
Dear Friends,

Israel’s Life Sciences Industry – IATI 2015 Report presents an overview of the current status of the
Israeli life sciences industry. It analyzes industry dynamics and trends while providing insights into
the basic ingredients of the industry that has made it such a successful sector: academic excellence,
government support, investments, mergers& acquisitions (M&A) and more.

The Israeli Life Science Industry is rapidly and exuberantly growing, while playing an important role in
the world healthcare market. Following a decade of significant growth, the Israeli life sciences
industry is continually demonstrating encouraging parameters of maturity and promising signs
towards a breakthrough decade. Israel’s life sciences industry is innovative, where excellence in
academic research, government support and increased availability of funding is translated into
commercial success. It is based on a combination of highly educated professionals with
entrepreneurial culture, innovative spirit and great technologies.

All efforts were taken to make this report as extensive and detailed as possible to reflect the many
different facets of the industry. We trust that you will find it both useful and informative. Please feel
free to forward it to others.

Special thanks to IVC Research Center who analyzed its database according to our specific requests.

                                                     Warm Greetings
                                                      IATI Team

      Dr. Benny Zeevi                                                                                 Karin Mayer Rubinstein
     IATI Co-Chairman                                                                                        IATI CEO
 General Managing Partner
DFJ Tel-Aviv Venture Partners

All rights reserved for IATI - Israel Advanced Technology Industries (R.A)© ("IATI") . No part of this publication may be reproduced,
copied, photocopied, stored in retrieval system, transmitted by electronic, mechanical, photocopying or recording means in any form in
whole or in part - without the prior written permission of IATI.
TABLE OF CONTENTS

Introduction ……………………………...................................................................................................................................………... 2
Academic Excellence in Life Sciences ……………………………...……………………………………………………………………………….……... 3
Commercialization Companies Israel- Technology Transfer Offices (TTOs) …………………………..………………… 6
Government Support …………………………………………………………………………………………………………………………………….……….…... 11
        The Incubators Program ……………………………………………………………………………………………..………………………..…….…... 13
Accelerators ………………………………………………………………………………………………………………………………………..……………..…….…... 16
2005-2014: A Decade of Growth …………………………………………………………………….…………………………………………..…….…... 17
Israel Life Science Industry Sub-Sectors …………………………………………………………………………………………………….…….…... 19
Global Multinational Life Sciences R&D Centers in Israel …………………………………………………………………..….……... 20
Funding …………………………………………………………………………………………………………………………………………………….…………..………... 21
        Israel High-Tech Funding ……………………………………………………………………………………………………………………...………... 21
        Israel Life Science Sector – Funding ………………………………………………………………………………………………....………... 23
        Breakdoen of Life sciences Investments in Israel ………………………………………………………………………...………... 27
        Most Active Life Sciences Investors in Israel ………………………………………………………………………………....………... 33
        Israeli Life Sciences Companies on The NASDAQ ………………………………………………………………….……..………... 34
        Tel Aviv Stock Exchange (TASE) …………..………………………………………………………………………………………………………... 37
        Other Stock Exchanges …………………………………………………………………………………………………………………………………….. 38
Acquisitions of Israeli Life Sciences Companies ……………………………………………………………………………….……..………... 39
Export of Israeli Life Sciences Products …………………………………………………………………..…………………………………………... 46
Healthcare IT and Digital Health……………………………………………………………………………………………………………………………... 47
        Israel Healthcare IT and Digital Health Landscape ……………………………………………………………………...………... 48
        Number of Companies …………………………………………………………………..………………………………………………………………... 48
        Subsectors ………………………………………………………………………………………………………………………………………………...………... 50
        Business Models…………………………………………………………………..………………………………………………………………………..…... 53
        Funding of the Healthcare IT and Digital Sub-Sector …………………………………………………………………..………... 55
Israel Life Sciences Sector – Opportunities …………………………………………………………………………………………………………. 56
The state of The Israel Life Sciences Industry
        IATI- 2015 Summary Report

Introduction
The Israeli Life Science Industry is rapidly and exuberantly growing, while playing an important role in
the world healthcare market. Following a decade of significant growth, the Israeli life sciences
industry is continually demonstrating encouraging parameters of maturity and promising signs
towards a breakthrough decade. Israel’s life sciences industry is innovative, where excellence in
academic research, government support and increased availability of funding is translated into
commercial success. It is based on a combination of highly educated professionals with
entrepreneurial culture, innovative spirit and great technologies.

Since our last report, published in June 2013, the Israel Life Sciences industry has demonstrated
significant growth, record investment amounts with interest from new investors mainly from China
and the Far East, increased number of companies in advanced stages of clinical trials, the highest
number of successful IPOs of Israeli life sciences companies on the NASDAQ, three record years for
life sciences exits in total dollars amount as well as an emergence of a prominent sub sector of
Health IT and digital Health. We are confident that Israel's life science companies can contribute in
helping solve the major challenges facing the global healthcare systems.

The global healthcare systems are facing many challenges. Worldwide, the pressures of the growing
demand for healthcare services—fueled by aging populations and burgeoning middle classes,
especially in emerging markets like China and India, along with expectations of higher-quality care
and a squeeze on funding—have created a perfect storm that is driving a need for new innovative
technologies and business models. The healthcare systems will increase demand for new evidence
and definitions for positive health outcomes before using any new technology or services .As the
economy rebounds and the baby boomers retire, employers as well as insurers are looking for fresh
ways to engage, retain and attract the next generation of health consumers.

In such an environment, the need for heightened efficiencies and increased innovation has never
been greater. Accordingly, companies must find new ways to improve the efficiency of their
operations, increase their research-and development (R&D) capabilities, tap into alternative sources
of innovation and capture new customers—particularly as demand for health care rises in emerging
markets.

We are confident that Israeli life sciences companies can sustain in playing a paramount role in the
global healthcare industry.

                                                   2
Academic Excellence in Life Sciences
To a great extent, the country’s economic achievements rely on Israel’s ability to tap into its
available scientific and technological potential. Israel’s scientific research highly contributes to its
international status and geopolitical position in the region providing it with a respected place among
the developed countries in the world hence acting as leverage for economic growth. Life Sciences
represent about 50% of Israeli civilian research activities in its 7 universities, 10 research institutes
and 5 medical schools. Israel has one of the highest concentrations of scientists per capita (145 per
10,000). One of every three Israeli scientists specialized in life sciences, which is the world’s highest
per capita ratio. The number of scientific publications in Life Sciences is one of the parameters for
academic excellence which demonstrates a link between basic research, applied research and
industrial development. According to a report published in August 2013 by The Samuel Neaman
Institute at the Technion, an independent multi-disciplinary national policy research institute for the
National Committee for Civilian Research and Development at the Ministry of Science, Technology
and Space, out of 58,210 scientific publications that came out of Israel during 2007-2011, about 45%
were related to the various life science sub - sectors while 23.07% came from the leading sub-sector,
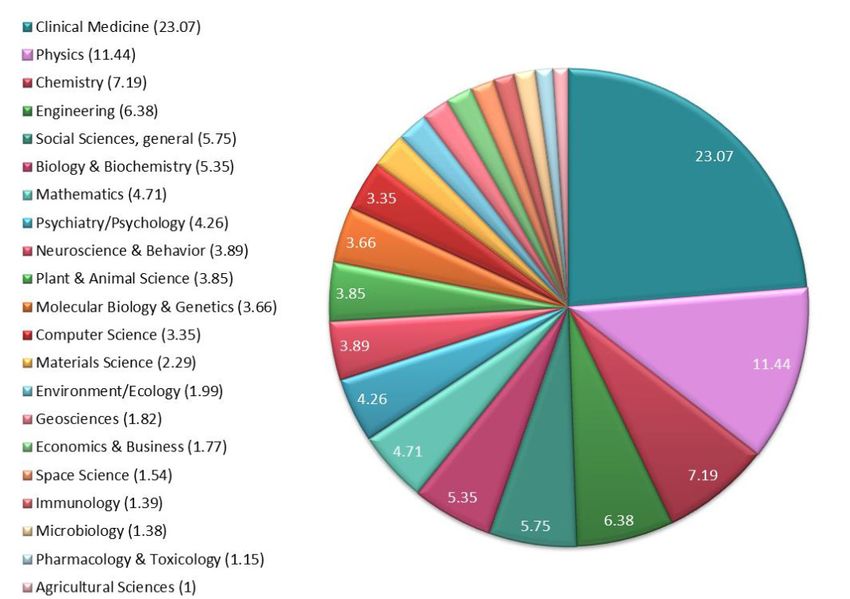
Clinical Medicine. (Figure 1)
Figure 1:
Percentage of Scientific Publications from Israel 2007-2011 according to sub-sectors
Source: The Samuel
Neaman Institute at
the Technion,
Analysis of
Thomson Reuters
Data, August 2013
The contribution of Israeli Scientific Publications in Life Sciences, to the global scientific publications,
related sub - sectors is also substantial as can be seen in Figure 2
3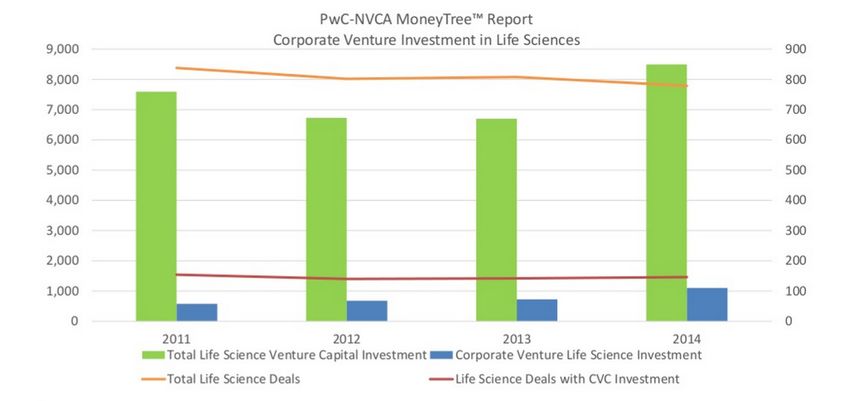
Figure 2: The contribution of Israeli Scientific Publications

Many citations of scientific publications in a certain period, usually demonstrate an increased
scientific activity in that specific sub-sector in a country- Immediacy Index. According to the above
report many of the life sciences sub-sectors have higher Immediacy Index compared to the rest of
the world, demonstrating them as “HOT” scientific areas in Israel (Figure 3).

                                                 4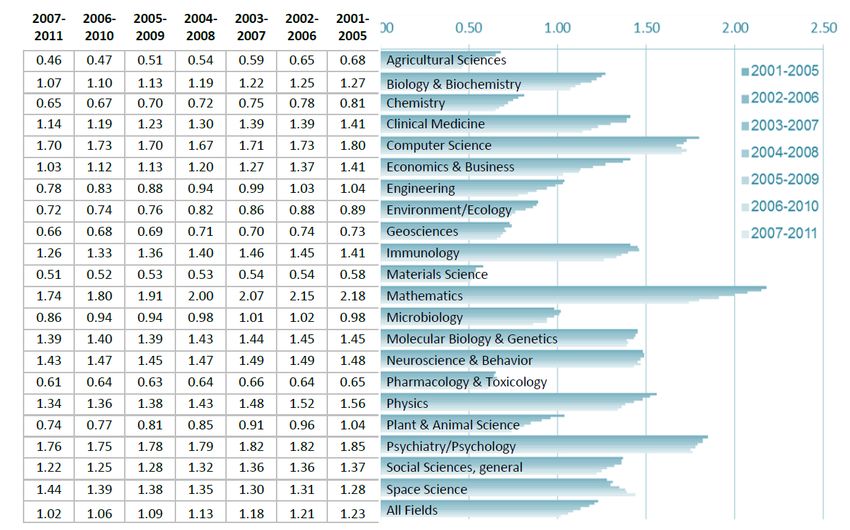
Figure 3: Immediacy Index in different sub-sectors in Israel and the world

                                       World                Israel

There are numerous interesting facts about the high quality sub-sectors of academic publications in
that report with many of them relating to life sciences.

Academic Students:

According to another report published in 2013 by The Samuel Neaman Institute at the Technion, an
independent multi-disciplinary national policy research institute, for the National Committee for
Civilian Research and Development at the Ministry of Science, Technology and Space on the
“Measures for Science, Technology and Innovation in Israel”, out of 49,716 first degree students in
2010-11 in the Universities (46%) and Colleges (54%) a third were in the life sciences. According to
the same report in 2010-11, 12 percent of the BAs were in biological sciences with that percentage
increasing to 26% in the MAs and 46% in the PhDs, demonstrating the high proportion of biological
sciences in higher degrees in Israel

                                                 5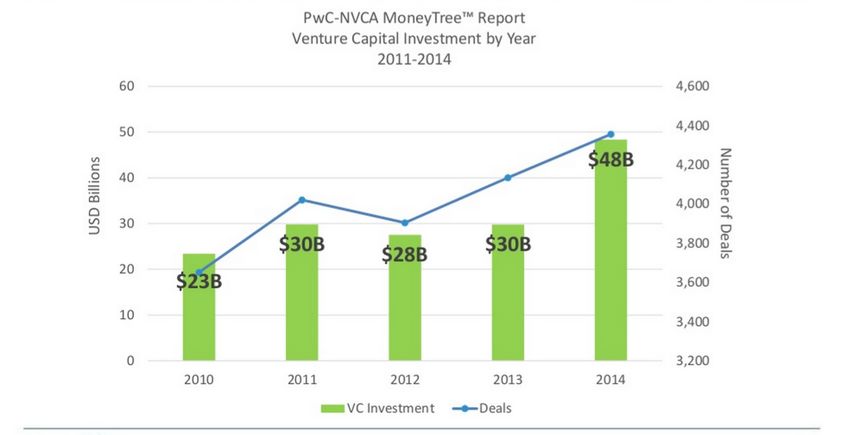
Commercialization Companies Israel- Technology Transfer Offices (TTOs)

The Central Bureau of Statistics of the State of Israel published a Survey (August 26, 2014) of
Commercialization Companies in Israel 2012-2013 relating to Inventions, Patents, License
Agreements, Revenues and Startup Companies coming out of the TTOs. The survey was initiated and
supported by the Israel National Council for Research and Development, of the Ministry of Science,
Technology and Space.

The role of commercialization companies (TTOs) is to search out, develop, and market the knowhow
accumulated in the institutions mentioned above, to turn a patent into a commercial product, and
help in creating startup companies. Commercialization companies with these activities substantially
contribute to the growth of the economy concomitant by increasing the income of the institutions
they represent.

The TTOs play a major role in the life sciences industry in Israel with many patents, new start-ups and
licensing agreements in the field originating from the eight research universities and eleven research
institute and hospitals.

According to the report, Commercialization companies filed 451 original patent applications in 2013,
of which 51 were submitted in Israel, and in 2012, 516 original patent applications were submitted,
33 of which were submitted in Israel. The number of original patent applications rose over the period
2008-2013 by 34%.The dominant fields of the original patent applications were medicines (24%),
bio-technology (17%), and medical equipment (13%). In 2012, life science related sub
sectorscomprised56% of all applications, and in 2013, about 53% of all applications. The main fields
of activity in the universities were: Medicines (20%), Bio-Technology (18%), Physics, Electronics and
Electro-Optics (14%).The main fields of activity in hospitals were: Medical Equipment (48%) and
Medicines (42%).The main fields of activity in research institutions and colleges were: Medicines
(33%) and Bio-Technology (26%). (Figure 4)

                                                  6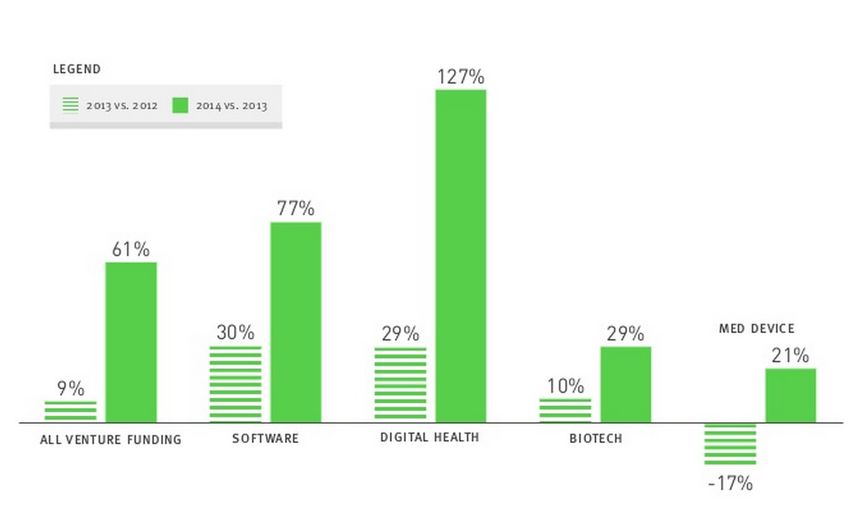
Figure 4: Commercialization Companies in Israel- New Patent Applications, by field,
2012 & 2013

 During the years in which the commercialization companies were active under the auspices of the
 institutions included in the survey, the companies accumulated a large inventory of current patents
 that were marketed or yet remain to be marketed. This inventory is the inventions portfolio of each
 company represented here by patent families. As can be seen in Figure 5, the life sciences
 sub-sectors represent a major part of those patent families. The dominant field of the active portfolio
 in 2013 was medicines, which was 23% out of total patent families. In 2011, the dominant field was
 bio-technology, medicines and medical equipment, which was 51% out of total patent families.

                                                   7
Figure 5: Commercialization Companies in Israel- Patent Families in the Active Portfolio*,
by Field, 2013
*Active portfolio - meaning one patent out of the family patent is operative.
The role of commercialization companies is to market and deliver the knowledge generated in
universities, hospitals and research institutions. The conventional way is through license agreements.
The number of license agreements that were valid, active or producing royalties in 2012-2013 was
1,966. Most of the agreements were signed with commercialization companies from Israel (71%)
with companies from the United States placing second (17%). Most of the new agreements were
signed with companies at universities (80%). In the last two years, 2012 and 2013, 259 new license
agreements were signed. Of all license agreements, 263 were valid license agreements that
produced royalties in 2012-2013; of those, 174 companies in Israel and 89 abroad. The dominant
fields of the active license agreements in 2012-2013 were fields which are related to life science:
medicines (26%), bio-technology (20%) and agriculture and plants genetics (17%)(Figure 6).
8Figure 6: Commercialization Companies Israel - Active License Agreements, by Field, 2013
The revenues from sales of intellectual property and gross royalties amounted to NIS 1,881 million in
2012, compared to NIS 1,680 million in 2011, an increase of 11.9%. Most of the revenues from sales
of intellectual property (IP) and gross royalties received in 2012 came from Israel - 72%. The
dominant field of the received revenues was medicines (94%).The dominant fields of the active
license agreements in 2012-2013 were fields which are related to life science: medicines (26%), bio-
technology (20%) and agriculture and plants genetics (17%).(Table1)
Table 1: Commercialization Companies Israel - Active License Agreements, by Field, 2013
NIS million
Mathem atics Physics "Clean"
Com panies Agriculture Chem istry
and and Bio- Medical Bio- Technology
associated Total Medicines and Plants and Nano Other
Com puter Electro- Technology Equipm ent Inform atics and
w ith: Genetics Technology
Science Optics Environm ent
Total 1,881 1,770 46 35 11 6 5 4 2 1 1
Universities 1,853 1,752 46 26 11 6 5 4 2 1 -
Hospitals 2 2 - - - - - - - - -
Research
institutions 26 16 - 9 - - - - - - 1
and colleges
In 2012-2013, commercialization companies were involved in the establishment of 72 start-up
companies. The main industries of the start-up companies were scientific research and development
(81%) and computer programming (7%).(Table 2)
9Table 2: Commercialization Companies in Israel - Establishment of Startup Companies,
2012–2013
Total- Israel and Abroad 72
Universities 57
Hospitals 11
Research institutions and colleges 4
International Comparison - Israel, United Kingdom, United States and Japan (The data presented are
for companies associated with universities only). Israel ranks high in all indicators (after
normalization) of international comparison (to the countries presented here): the number of
invention disclosures, patent applications, license agreements, startups established and revenue
from IP and royalties. This is after normalizing by the R&D expenditure of the higher education
sector. (Table 3)
Table 3: Commercialization Companies Israel - Indicators for International Comparison,
Normalized by the R&D Expenditure of the Higher Education Sector, 2012
United United Japan
Israel
Kingdom States
Expenditures on R&D by
the higher education
1,224 10,361 62,723 20,336
sector (million dollars,
PPP)
Invention disclosures 0.43 0.42 0.38 0.44
Patent applications 0.35 0.19 0.23 0.34
License agreements 0.86 0.42 0.08 0.43
Startup companies 0.02 0.018 0.01 0.003
Revenue* from IP
0.39 0.01 0.04 0.02
(million dollars)
10Israel’s scientists and engineers have integrated advanced technologies in electronics,
communications, electro -optics, Lasers, IT and others to develop cutting–edge medical devices as
well as commercialized defense R&D technologies. Israeli entrepreneurs continually overcome
technological barriers and solve development problems quicker and at capital efficiency compared to
their larger and more affluent competitors overseas. All Israeli entrepreneurs have been "going
global" from day one. With a go-getter attitude embedded in the culture, risk-taking and creativity
are encouraged while failures are tolerated.
Government Support
The government of Israel is strongly focused on creating an R&D support network through various
grants and incentive programs. The Office of the Chief Scientist (OCS) at the Ministry of Economy is
responsible for the funding of industrial R&D programs in Israel and contributes up to 50% of R&D
approved expenses of High – Tech companies including that of life sciences companies. During the
last decade the OCS invested more than $100 million annually in the life sciences sector via its
different programs (Figure 11) including the Incubators program, General Industrial R&D Grants, The
Magnet Program (Consortium of academia and industry), Nofar Program (Applied Academic
Research), The Kamin program of the OCS is bridging the gap between applied research and the
industry, and the TNUFA Program which focuses on linking individual inventors and investors.
11Figure 11: OCS R&D Support of the Life Sciences Sector (Million NIS)
Source: OCS
12The life sciences sector support of the OCS is between 25-30 percent of its yearly budget (Figure 12)
Figure 12: OCS Budget – Sectors
5.3% 3.5%
8.0% 10.3% 7.3%
13.5% 14.3% 11.6% 14.6% 14.2%
27.7% 27.4%
28.4% 25.9% 30.0%
24.8% 25.1%
26.0%
Other
28.5% 28.1%
Life Sciences
34.0%
Communications
25.4% 28.7% 32.7%
29.2% 33.3%
22.2% 31.3%
28.1% 24.7%
Software
8.0%
Chemistry
15.8% 10.7% 13.0% 12.0%
15.9% 14.4% 9.8% 11.3%
12.1%
4.4%
3.1%
3.7%
3.2% Electro-Optica
2.9% 3.5% 3.7% 3.5% 3.4% 7.3%
2.7% 7.6%
6.6% 9.8% 5.2% 4.2%
5.6% 4.9% 5.1% 8.4% Electronics
12.8% 13.0% 15.3% 12.3%
11.0% 10.0% 9.9% 10.6% 10.8% 8.3%
2014 2013 2012 2011 2010 2009 2008 2007 2006 2005
Source: OCS
There are also Bi-National grants, the EU framework and other marketing grants that life sciences
companies are receiving.
The Incubators Program
The Technological Incubators Program was established in 1991 and is administrated by the Office of
the Chief Scientist, Ministry of Economy. The primary goal of the program is to transform innovative
technological ideas that are too risky for private investments, into viable startup companies where
after the incubator term should be able to raise money from the private sector and operate on their
own. The incubators program positioned itself as the primary manufacturer of startups in Israel
today, establishing 70- 80 new startups every year.
There are 19 incubators in Israel to date, out of which 17 are technological incubators, 1 is a
technology based industrial incubator and 1 is a designated biotech incubator. 9 of the incubators
accept companies in the life sciences sector. The incubators are spread out all across Israel including
8 of which are located in peripheral areas.
13Field of Activity:
In the last 10 years (2005-2014) 696 companies were accepted into the incubators program, out of
which 231 (33.2%) were medical device companies and 97 (14%) were biotech/pharma companies.
At the beginning of 2015, 35% are medical device companies and 7% are biotech/pharma companies
(Figure 13).
Especially in the life sciences sector were the risk of establishing a company are relatively high, the
incubator program allows an initial proof-of-concept that if successful will later attract private
investments. Without government risk- taking and making the initial investments in these initiatives,
the companies would not have been established and the private investments that they have
successfully raised would not materialize.
Figure 13 – Percentage of Life Science Companies in the Incubators program 2015
Misc, 3%
Medical
Device, 35
ICT, 36%
%
Bio-
Clean/Agro Pharma, 7
-Tech, 19% %
Source: Incubator Program. Office of the Chief Scientists Ministry of Economy
14Financial Support
The incubation term of a project in a technological incubator is approximately 2 years and the total
budget for the two-year term ranges between US $500,000 to US $800,000, depending on the field
of activity of the project (in addition, projects in peripheral incubators are entitled to an extra budget
of US $125,000). 15% of the total budget is financed by the incubator and 85% of the total budget is
financed by the government as a grant, that will be paid back only upon success. The company will
pay the government 3%-5% royalties from revenue generated, until the full amount of the grant
(plus interest) is paid back.
Success stories
From 1991 to the end of 2013, the government initiated over 1,900 companies with a total
cumulative government investment of over 730 million dollars.
Over 1,600 companies had matured and left the incubators. Of these graduates, 60% have
successfully raised private investments. By the end of 2013, 35% of the incubator's graduates were
still up and running. The total cumulative private investment in graduated incubator companies
surpassed 4 billion dollars.
This means that for every dollar the government invested in an incubator company, the company
raised an additional 5 – 6 dollars from the private sector. (Figure 14)
15Figure 14 – Incubator Program-Government Funding VS Private Investments 1991 – 2013
Government Funding Private Investments
4,500,000
4,250,000
4,000,000
3,750,000
3,500,000
3,250,000
3,000,000
2,750,000
2,500,000
2,250,000
2,000,000
1,750,000
1,500,000
1,250,000
1,000,000
750,000
500,000
250,000
0
1991
1992
1993
1994
1995
1996
1997
1998
1999
2000
2001
2002
2003
2004
2005
2006
2007
2008
2009
2010
2011
2012
2013
Source: Incubator Program. Office of the Chief Scientists Ministry of Economy
Examples of Life Science Success Stories that graduated from the incubator program:
Several successful life sciences companies started in the incubators program and many of them also
received additional funding from various programs of the Office of Chief Scientists. Among them are:
Argo-Re Walk, Compugen, Simbionix, Protalix, Prolor, Mazor Robotics, Enzymotec, Collplant, Remon
Medical, Dune Medical and others.
Accelerators
In the last two years we noticed increased activity of several accelerators in Israel's life sciences
industry. Accelerators typically run 12-week programs to get startups quickly from concept to
product. They offer mentoring with some also offering seed money in exchange for equity. Programs
culminate in a demo day, during which graduates pitch their startups to investors.
16Microsoft's accelerator included life sciences companies in all its batches since they started the
program in Israel (Overall 11 life sciences companies). Microsoft Ventures opened the first medical
accelerator in Israel as it realized the growing potential in this relatively untapped domain as far as it
goes to early stage startups. Microsoft Ventures Tel-Aviv partnered with two leading world-class
organizations - Becton Dickinson and Healthbox to grant the startups in this program a faster reach
out to their market and first hand advise from domain experts in their fields.
MassChallenge accelerator had 9 Israeli startups in the life sciences industry during its 2013-2014
accelerator programs. The accelerators can play an important role in the early stages of Israeli life
sciences start-ups especially in better product definition as well as initial assessment by the market
and potential customers/partners.
2005-2014: A Decade of Growth
According to multiple different data bases (IATI, IVC, SNC)* and our own assessment there are about
1,380 active life sciences companies in Israel(Figure 7). Most of the companies (66%) were
established in the last decade. In the last seven years, on average, 98 life sciences companies were
established annually in Israel (Figure 8).In the last four years 2011-2014, 36 percent of the
companies that were established were from the Healthcare IT digital health sub-sector (144 out of
396).
*IATI- The Israeli Advanced Technology Industries Organization, IVC- IVC Research Center, SNC- Start-Up Nation
Central, a non-profit organization
Figure 7: Cumulative Number of life sciences companies: 2004-2014
1600 1293 1380
1400 1193
1088
1200 984
884
1000 794
692
800 619
538
600 467
400
200
0
Source: IVC, IATI, SNC Data Bases and IATI Data Analysis
17Figure 8: Number of Israeli life sciences companies established and active 2004-2014
500 467
450
400
350
300
250
200
150 102 90 100 104 105 100 87
100 71 81 73
50
0
Source: IVC, IATI, SNC Data Bases and IATI Data Analysis
According to the IVC Research Center during the last decade (2005-2014), 603 life sciences
companies ceased to operate for various reasons, about 60 companies per year (Figure 9).
Figure 9: Number of Israeli Life Science Companies Ceased to operate 2005-2014
90
80
70
60
50
40 76 80
67 72
30 57 62 59
51 44
20 35
10
0
2005 2006 2007 2008 2009 2010 2011 2012 2013 2014
Source: IVC Research Center
18Israel Life Sciences Industry Sub-Sectors
The Israeli Life Sciences Industry is heavily biased towards the medical device sub-sector, with 725
companies or 53% of the total. Biotech and Pharma is the second largest sub-sector with 317
companies or 23% and Healthcare IT and Digital Health is the third with 285 companies or 20% of all
life sciences companies actively operated in Israel, this sub-sector demonstrated the most significant
growth in the last four years (see Figure 10).
Figure 10: Israel Life Sciences Industry Sub-Sectors
Others
53
Healthcare IT
& Digital
Health 285
Medical
Devices
725
Biotechnology/
Pharmaceutical
317
As the different data bases have different definitions for the companies included in medical device,
healthcare IT and digital health sub-sectors, it was impossible to define the various sub groups in
each sub-sector (eg: implantable, diagnostics, monitoring, sensing etc.). In the special section of this
report dedicated to healthcare IT and digital health there is also breakdown of sub-groups.
19Global Multinational Life Sciences R&D Centers in Israel
With almost 280 global multinational R&D centers in Israel, the country has become a sought-after
hot spot. Multinational R&D centers are playing a major role in the Israeli High-Tech ecosystem
employing about 45% of the High-Tech work force.
There are dozens of global multinational Life Sciences R&D centers in Israel of global medical device,
Healthcare IT and pharmaceutical companies. Most of these centers originated as a result of
acquisitions of Israeli companies. These centers continue to develop breakthrough technologies for
the global healthcare market, as well as playing a key role in building a cadre of future Israeli
managers in the areas of R&D, sales and marketing. (Figure 15)
Figure 15: Notable Life Sciences Multinational R&D centers in Israel
Few of these multinationals companies have other activities in Israel eg: Novartis invested in Gamida
Cell and BioLine Rx and the latter will also identify and develop Israeli technologies for Novartis.
Merck-Serono established a strategic bio-incubator fund in Israel with a budget of 10 million Euro.
Samsung started an innovation center in Israel and has invested/collaborated with several Israeli
companies especially in the digital health sub-sector. In 2010 Roche Partnering signed an agreement
with Pontifax to search for Israeli life sciences technologies to invest in together. Many of the
corporates venture capital funds invested in Israeli companies in order to get early exposure to their
technologies.
20Funding
Israel High-Tech Funding
There are several sources of funding for the Israeli Life Sciences Industry among them are: Office of
Chief Scientist grants, grants like the NIH, Binational Government supported Foundations, angels,
venture capital funds (Israeli VCs and foreign VCs), micro-funds, corporate investors and funds
raised at the various public markets eg; the TASE and NASDAQ. Exact figures are hard to come by, as
the definitions in the various reports that are generated each year are different. We based our
funding data on the information of the IVC-KPMG High-Tech Survey, this survey reviews capital
raised by Israeli High-Tech companies from Israeli and foreign venture capital funds as well as other
investors such as foreign or Israeli investment companies, corporate investors, incubators,
accelerators and private investors like angels and angels clubs. Capital raised on public stock
exchanges is reported separately in this report.
According to the IVC-KPMG High-Tech 2014 Survey, capital raised by Israeli high-tech companies in
2014, set an all-time record, as 688 companies attracted $3.4 billion. The amount was up 48 percent
from $2.3 billion raised by659 companies in 2013.
In Q4/2014, 184 Israeli high-tech companies raised a whopping $1.1 billion – the most raised in one
quarter since 1999. The amount was up 58 percent from the $701 million raised by 170 companies in
Q3/2014 and up 39 percent from the $795 million attracted by 190 companies in Q4/2013. In
comparison, the past decade’s quarterly average was just $470 million. 110 VC-backed deals climbed
to $845 million in Q4 2014, 76 percent of total capital invested - the highest amount for a quarter in
six years. In 2014, 392 VC-backed deals totaled $2.36 billion or 69 percent of total capital invested.
This compared to $1.7 billion (75 percent) in 2013 and $1.3 billion (73 percent) in 2012. The average
VC-backed deal size reached $6 million, well above the six-year $4.3 million average. The average
company financing round increased to $6.0 million in Q4/2014 from $4.12 million in Q3/2014 and
$4.18million in Q4/2013. In 2014, Israeli VC funds invested $574 million (17 percent) in Israeli high-
tech companies, just 2percent more than the $561 million (24 percent) invested in 2013, but up 11
percent from $515million (29 percent) invested in 2012. (Figure16)
21Figure16: Capital Raised by Israeli High-Tech Companies
This is in line with the US investment trend. According to the Money Tree Report by
PricewaterhouseCoopers LLP (PwC) and the National Venture Capital Association (NVCA) based on
data from Thomson Reuters, venture capitalists invested $48.3 billion in 4,356 deals in 2014,
reaching its highest level since 2000. (Figure 17)
Figure 17: PwC-NVCA MoneyTree Report – Venture Capital Investment by Year 2011-2014
22Israel Life Science Sector - Funding
According to the IVC Research Center, in 2014, the life sciences sector attracted 24% of the total
investments in the Israeli High-Tech or $801 million. Over the last decade the life sciences sector
attracted on average 22.4% of the total investments in the Israel High-Tech. (Figure 18)
Figure 18: Capital raised Israeli High-Tech Companies by Sector 2005 - 2014
100% 4% 4% 5% 3%
8% 7% 9% 6%
12% 7% 3% 8%
16% 8% 6%
90% 4% 4% 3%
9% 6%
7% 8% 9%
12% 15% 14%
80% 10% 19%
3% 13%
70% 5% 22% 28%
22% 21%
14% 17%
21% 15%
60% 23%
25%
15%
50% 19% 22%
20% 28% 27% 24%
40%
35% 24% 20%
25%
30% 20% 17% 11%
21% 16%
20% 18%
10% 22% 20% 23% 19% 21% 22%
17% 16%
13% 12%
0%
2005 2006 2007 2008 2009 2010 2011 2012 2013 2014
Software Communications Life Sciences Internet Semiconductors Other Cleantech
Source: IVC Research Center
CenterCenter
According the IVC Research Center, 2014 set the all-time record in the amount invested in the life
sciences sector with $801 million invested in 167 life sciences companies. The amount was up 55
percent from $516million raised by 142 companies in 2013 and 64 percent up from the $489 million
invested in 133 life sciences companies in 2012.These three years demonstrated a significant
increase compared to the average of $371 million invested in an average of 99 life sciences
companies during the years 2005-2011. (Figure 19)
(2013-2014 were also record years for funds raised by Israeli life sciences companies on the NASDAQ
as described below).
23Figure 19: Capital Raised by Israeli Life Sciences Companies 2005-2014($M)
$m #
900 167 180
800 160
142
700 133 140
118
114
600 110 120
96
500 88 100
86
80
400 801 80
300 60
489 516
200 369 391 40
351 318 336
284 275
100 20
0 0
2005 2006 2007 2008 2009 2010 2011 2012 2013 2014
LS deals ($m) # of LS Deals Source: IVC Research Center
This trend of investments in the life sciences sector is in line with the US investment trend. According
to the Money Tree Report by PricewaterhouseCoopers LLP (PwC) and the National Venture Capital
Association (NVCA) based on data from Thomson Reuters, venture capitalists invested $8.6 billion in
life sciences sector investments (Biotechnology and Medical Devices combined) into 789 deals in
2014, the highest level since 2008. This is a 29 percent increase in dollars but a 3 percent drop in
deals compared to 2013. Dollars invested in life sciences companies accounted for 18 percent of
total venture capital investments in 2014 compared to 24 percent of total investments in Israel.
(Figure 20)
24Figure 20: PwC-NVCA MoneyTree Report – Venture Capital Investment by Industry 2014
An interesting trend noticed in 2014 in the US, is that corporate venture groups invested $5.4 billion
in 775 deals to U.S.-based companies in 2014, according to the MoneyTree™ Report from
PricewaterhouseCoopers LLP (PwC) and the National Venture Capital Association (NVCA), based on
data provided by Thomson Reuters. Corporate venture accounted for 11.0% of all venture dollars
invested and 17.8% of all venture deals in 2014, marking the strongest year for corporate venture
investing, by dollars, since 2000. Corporate venture investing in the life sciences sector, which
includes biotechnology and medical devices, was very strong in 2014. Corporate venture groups
invested $1.1 billion in 146 deals, representing a combined 20.4% of total dollars invested by
corporate venture groups for the year. As a percentage of overall venture investing in life sciences
companies in 2014, corporate venture represented 13.0% of all dollars invested, marking the highest
percentage of corporate venture investment in life sciences companies since the inception of the
MoneyTree Report™ in 1995. (Figure 21 and 22)
25Figure 21: PwC-NVCA MoneyTree Report – Corporate Venture Investment by Sector 2014
Figure 22: PwC-NVCA MoneyTree Report – Corporate Venture Investment in Life Sciences
26Breakdown of life sciences investments in Israel:
In 2014, $103 million was invested by Israeli venture capital funds, only 13 percent of the total
investments in the Israeli life sciences companies, which is down percent-wise compared to the $
105 million or 20 percent invested in 2013 and $121 million or 24 percent invested in 2012 ( Figure
23).
Figure 23: Capital Invested by Israeli VC Funds vs. Other Investors in Life Sciences 2005-2014($m)
$m
900
801
800
700
600
516
489
500
391 698
400 369 351 336
318
284 275
300 367 411
257 263
200 266 232 250
192 191
100
92 112 85 86 86 128 121 105 103
85
0
2005 2006 2007 2008 2009 2010 2011 2012 2013 2014
Other Investors ($m) Israeli VC Funds ($m) Source: IVC Research Center
If we look at the total amount invested by Israeli investors compared to foreign investors (As defined
in the beginning of this chapter) in 2010-2014, the picture is much better. In 2014 $332 million or
41 percent was invested by Israeli investor which is again down, percent-wise, from the $244 million
or 47 percent invested in 2013 and $267 million or 55 percent invested in 2013. This is
demonstrating an increased interest in the Israeli life sciences sector by foreign investors and
decrease in the number and capital available by Israeli venture capital funds investing in this sector
(Figure 24)
27Figure24: Capital Invested in Israeli Life Science Companies by Investor: Israeli vs. Foreign
Investors ($m) 2010-2014
$m
900 801
800
700
332
600 516
489
500
391
400 336 244
267
300
296 469
200 280
221 272
100
56 95
0
2010 2011 2012 2013 2014
Israeli Investors ($m) Foreign Investors ($m) Source: IVC Research Center
According to the IVC Research Center there is a significant increase in Non-VC-backed life science
financing rounds in recent years. $450 million or 56 percent were in invested in Non-VC backed
Israeli life sciences companies in 2014 compared to $259 million or 50 percent in 2013 and $214
million or 44 percent in 2012 ( Figure 25)
Figure 25: VC-Backed vs. Non-VC-Backed Life Science Financing Rounds 2005-2014 ($m)
900
800
700
600 450
500
400 214 259
107
300 175 139 45 86
83 69
200 351
273 250 284 274 257
100 201 195 212 207
0
2005 2006 2007 2008 2009 2010 2011 2012 2013 2014
VC-backed LS ($m) Non VC-backed LS ($m)
Source: IVC Research Center
28As the Israeli life sciences industry matures and the total amount invested in the sector increases,
we see that the relative amount of investments going to later stages companies (Initial revenues
and revenues growth) has been increasing significantly in the last five years as well as the
amounts invested in larger deals of $10-20 million and more than $20 million (Figures26,27).
Figure 26: Capital Raised by Israeli Life Sciences Companies by Stage ($m) 2005-2014
2…13 462 175 151
2… 24 216 195 81
2… 35 276 117 60
2…12 198 170 11
2…14 186 126 10
2… 26 125 78 47
2… 20 244 39 14
2… 19 174 68 91
2…14 195 96 64
2… 19 138 124 3
0 100 200 300 400 500 600 700 800 900
Seed ($m) R&D ($m) Initial Revenues ($m) Revenue Growth ($m) Source: IVC Research Center
Figure 27: Capital Raised by Israeli Life Sciences Companies by Deal Size ($m) 2005-2014
900
800
700 217
600
500
79 89 271
400
65 134
82 20 172
300 40
150 102 136
79 126 113 82 150
200 149
42 39 77 94
71 104
100 85 72 73 88
123 136 143 144 163
77 90 89 76 86
0
2005 2006 2007 2008 2009 2010 2011 2012 2013 2014
0-$5M $5M-$10M $10M-$20M More than $20M Source: IVC Research Center
29The number of deals in Israeli life science financing, are still much higher in companies in seed and
R&D stages compared to companies in later stages (Figure 28)
Figure 28: Number of Israeli Life Science Financing Deals by Stage 2005-2014
100 91
90
80 76
69
70
60 59
60 55
52
48 47
50 44 45
40 36
31 29 29
28
30 24
21 19 18 31
20 26 28
23 23
10 18 19 12
15 15 14 8 8
5 5 3
0 1 2 1 2
2005 2006 2007 2008 2009 2010 2011 2012 2013 2014
# of Seed # of R&D
# of Initial Revenues # of Revenue Growth Source: IVC Research Center
30The average deal size increased significantly in 2014, reaching a record average of $4.8 million
(Figure 29)
Figure 29: Average Deal Size ($M) in Israel Life Sciences Financing 2005-2014
$
6
4.8
5 4.3 4
4 3.5 3.7 3.6
3.3 3.4
3.1
3 2.3
2
1
0
2005 2006 2007 2008 2009 2010 2011 2012 2013 2014
According to the IVC Research Center the amount invested in Israeli life sciences companies by
sub-sectors is demonstrated in figure 30. We have combined few sub-sectors to several groups, in
order to assess the sub-sectors investment more closely with our definition of the sub-sectors at the
beginning of this report which is slightly different from the definitions of IVC Research Center:
Medical devices, Biotech/Pharma, Diagnostics, Healthcare IT and Others. Including in the
Biotech/Pharma also Agrobiotech and Therapeutics according to the IVC Research Center definitions,
in Healthcare IT we included also Telemedicine and Bioinformatics.
As can be seen in figure 30 and figure 31 the medical device sub-sector attracted majority of the
amount invested in the last decade in Israeli life sciences companies. Although in the last four years
(2011-2014) its share decreased to an average of 54 percent in comparison to 61 percent in
2005-2010. There is also an increase in the amount invested in Israeli Healthcare IT companies in the
last four years. The real number invested in Digital health companies is most probably higher than
the total amount of $89 million demonstrated in figure 30, as some of the medical device companies
can also be included in this report definition of Digital Health as they are developing biosensors etc.
In a recent report published by IVC Research Center (December 2014) the total amount invested in
Israel Digital Health companies reached over $400 million in the last five years, out of this more than
$200 million were invested in the last two years. $121 million were invested in 2013 and $85 million
in 2014.
31Figure 30: Israeli Life Sciences capital raised by Sub-Sector ($m)
6 1 3 6 8
23 7 5 25 34 40
33 26 18 10 40
11 8 30
5 14
14 19 30 35
71
72 49 107
79
168 119 147
179 286
73
Other
Healthcare IT
Diagnostics
Biotech/Pharma
184 186 Medical Devices
225 209
287
172 212
188 259 410
2005 2006 2007 2008 2009 2010 2011 2012 2013 2014
32Figure 31: Israeli Life Sciences capital raised by Sub-Sector (# of companies)
1 2 1 1 1
3 3 2 4 5
6 5 5 5 5 3 5
7 5 8 15
10 8
7 8
7
23 21 26 19
29 32 43
22 36
51
Others
Healthcare IT
Diagnostics
Biotech/Pharma
81 81
51 73 Medical Devices
53 51 57 78 86
89
2005 2006 2007 2008 2009 2010 2011 2012 2013 2014
Most Active Life Sciences Investors in Israel:
According to the IVC Research Center and the available public data the most active life sciences
investors in Israel in the last five years (Excluding investments by incubators)*were Pontifax and
OrbiMed Israel Partners. Interesting is the emergence of OurCrowd (an equity-based crowdfunding
platform) as the second most active life sciences investor in 2014 (Table 4). In 2012, OrbiMed, a
leading global investment management firm, created Israel’s first investment fund dedicated to life
sciences venture capital opportunities with an anchor investment made by the Government of Israel.
The $222 million fund, OrbiMed Israel Partners LP, invests in biotechnology, pharmaceutical, medical
devices and diagnostics companies at varying stages of maturity, from seed through growth equity.
*The report presents a list of investors who participated in at least 4 financing rounds at a specific year, of
Israeli and Israel-related life science companies 2010-2014. Investors include all type of investors types, except
private investors; Foreign and Israeli investors included. The investors are ranked based on two measures: # of
First Investments, then Total # of Investments. The number of investments in both measures reflects
investments made in the relevant year. Total # of Investments refers to the entire number of financing rounds in
which the investor participated in a given year, including first and follow on investments.
33Table 4: Top Life Science Investors by Year, # of First Investments & Total # of Investments
Year Plc. Top Investors Investor #First Total # of
Type Investments Investments
2010 1 Pontifax II VC Fund 9 12
2 Clal Biotechnology Investmen 5 9
Industries (CBI) t Company
Capital Point Investmen 5 9
t Company
3 Virginia Life Sciences Investmen 5 5
Investments (VLSI) t Company
2011 1 Pontifax II VC Fund 6 9
2 Access Medical Ventures VC Fund 4 4
(AMV)
2012 1 Maryland/Israel VC Fund 7 8
Trendlines Fund
2 OrbiMedIsrael Partners VC Fund 4 4
2013 1 Pontifax III VC Fund 8 13
2 Peregrine Ventures II VC Fund 4 7
2014 1 OrbiMedIsrael Partners VC Fund 5 12
2 OurCrowd Angel 5 7
Club/
Group
3 Pontifax III VC Fund 2 8
4 Shavit Capital II Private 2 4
Equity
Fund
Source: IVC Research Center
Israeli life sciences companies on the NASDAQ
In the last two years, 2013-14, Israeli life sciences companies raised about $1.4 billion on the
NASDAQ, taking advantage of the opening window for life sciences public offerings. Out of 73
Biotech life sciences companies that underwent initial public offerings on the NASDAQ in 2014, 7
were Israeli companies (10%).
According to the IVC Research Center in 2013-2014, 11 Israeli life sciences companies went public on
the NASDAQ (Alcobra, Enzymotec, BioBlast, Poamix, Galmed, Macrocure, Mediwound, Neuroderm,
ReWalk, Lumenis and VBL) with average of $49.65 million raised. Two Israeli related life sciences
companies (Kite Pharma and Karyopharma) went public on the NASDAQ while two Israeli life
sciences companies had dual registration on the NASDAQ following their public trading on the TASE
(Kamada and BiolineRx) and five Israeli and Israeli related companies had follow-on offerings
(Alcobra, Enzymotec, Kite Pharma, and Keryx (x2)). (Figure 32) In 2015 another two Israeli life
sciences company went public on the NASDAQ (Check-Cap and Steadymed).
34Figure 32: Public Offerings* by Israeli Life Science Companies on NASDAQ 2005-2014 ($M,
# of offerings)
$m #
3,500 13 14
3,000 12
2,500 10
2,000 8
6
1,500 3,012 6
2,505
1,000 3 3 4
2 2
500 1 1 1,014 2
374 58 0 0- 33 373
28
- 0
2005 2006 2007 2008 2009 2010 2011 2012 2013 2014
Capital Raised ($m) # of Offering Source: IVC Research Center
*Including IPOs and follow on offerings on NASDAQ
If we compare the market cap on the first date of trading of the Israeli companies that underwent
initial public offerings (including dual listing) on the NASDAQ in 2013-14, to their market cap on
February 27, 2015 we see an average negative return of 14% ($2593.61 vs $2239.03). Only
ReWlak, Foamix, Neuroderm and BioLineRx have a higher market cap compared to their cap at
the initial float.
The two Israeli related companies (Kite Pharma and Karyopharm) performed exceptionally well in
that period.
2014 was a great year for global biotech companies at western stock exchanges were 87 such
companies had an initial IPO, 73 at NASDAQ, 13 at European Stock Exchanges and 1 at the
Australian Exchange, raising an average of $72 million (Figure 33and 34).
The average 2014 year-end change since float across all 87 IPOs was 34% (PHARMA & BIOTECH
2014 IN REVIEW, EvaluatePharma, March 2015).
35Figure 33: IPO Annual Totals (Western Stock Exchanges)
Source: PHARMA & BIOTECH 2014 IN REVIEW, EvaluatePharma, March 2015
Figure 34: Initial Public Offerings by Quarter on Western Exchanges
Source: PHARMA & BIOTECH 2014 IN REVIEW, EvaluatePharma, March 2015
36Tel Aviv Stock Exchange (TASE)
On the Tel Aviv Stock Exchange (TASE), life science is the largest sector, with 51 companies. Twelve of
the TASE life sciences companies are dually listed on foreign markets. Following the "boom" of
companies’ listing in 2005-2007, investors remain cautious due to overall underperformance of life
sciences companies, non-transparency and general lack of knowledge of that specific domain by the
institutional investors. There is an insufficient analyst reporting and understanding of this industry.
The other challenge these companies face is lack of or no liquidity. The TASE played a significant role
in providing these developing companies with a platform for fund raising, and a ladder from which to
move onto the NASDAQ or other stock exchanges at a later stage. According to the TASE, only two
new companies started trading in 2014 by merging into stock market shells. According to the ICV
Research Center in 2014, seven life sciences companies raised $69 million on the TASE via initial and
follow-on offerings. (Figure35)
Figure 35: Public Offerings* by Israeli Life Science Companies on TASE 2005-2014
($M, # of offerings)
$m #
180 15 15 16
14
160 13 14
140
11 12
120
9 10
100
7 8
80 167
6
60 4
103
40 4
77 69
52 57
20 1 39 2
35
0
8
- 0
2005 2006 2007 2008 2009 2010 2011 2012 2013 2014
Capital Raised ($m) # of Offering Source: IVC Research Center
*Initial and follow-on Offering
37You can also read